Wind Analysis. Technical Memorandum. Wind Direction and Fetch Length. Water Depth
|
|
|
- Virgil Hancock
- 5 years ago
- Views:
Transcription
1

2 standardized to a 10m observation level and corrected for increased overwater wind speed. The CEM procedures for adjusting observed winds were used to correct for the elevation of the CIMIS weather station from 4m using CEM Figure II-2-6. For fetch lengths less than 16km, the CEM recommends a factor of 1.2 to increase the wind speed for over water conditions. The ILDC also states that the wind speed duration to be used in these calculations should be less than one-hour duration. The CEM notes that the wind duration that generates maximum wave runup is a function of the fetch length and the wind speed. When the fetch is limited, as in a river application, CEM Figure II-2-3 can be used to provide an equivalent duration for wave generation. For the fetch lengths analyzed in this study, the equivalent wind speed durations ranged from 60 to 90 minutes. To meet the requirements of the ILDC, a one-hour wind speed duration was selected for all conditions. This selection represents a conservative approach to the calculation of wind setup and wave runup. and Fetch Length The fetch is defined as the region in which the wind speed and direction are reasonably constant. In river settings, the fetch is limited by surrounding landforms. nder these circumstances, the SPM recommends determining the fetch length by extending 9 radials from the point of interest at 3-degree intervals (centered on the maximum wind direction) until they intercept the opposite shoreline. The average of the 9 radial lengths represents the fetch length for a given wind direction. Water Depth The water depth at the toe of the levee at the design surface water elevation is used in the calculation of wave runup. The average water depth across the entire fetch length is used in the calculation of wind setup. For the purposes of this study, it is assumed that the design surface water elevation is the median 200-year still water elevation. Wind Analysis The wind data from the CIMIS Nicolaus #30 weather station is recorded as an hourly average wind speed with the prevailing wind direction in degrees. For this analysis, the wind speeds were separated into wind direction categories: North (337.5 to 22.5 degrees) Northeast (22.5 to 67.5 degrees) East (67.5 to degrees) Southeast (112.5 to degrees) South (157.5 to degrees) Southwest (202.5 to degrees) West (247.5 to degrees) Northwest (292.5 to degrees) 2 January 10, 2011
3 The wind speed data was then analyzed using HEC-SSP to perform a generalized frequency analysis to determine the 72.6-year return period wind speed for each wind direction. The resulting wind speeds represent the 72.6-year return period 60-minute wind speed at an elevation of 4m over land. For use in the wind setup and wave runup, these wind speeds must be corrected for an elevation of 10m over water. Table 1 presents the HEC-SSP output wind speed for each wind direction category along with the necessary elevation and over water corrections. Note that for the remainder of the wind setup and wave runup analysis, the wind speeds presented in the corrected for over water wind speed will be used. Table minute Wind Speed by Wind direction 72.6-year Return Period, 60-minute Wind Speed (mph) Observed at CIMIS Corrected for 10m Corrected for Over Water Weather Station Elevation Wind Speed North Northeast East Southeast South Southwest West Northwest Fetch Length Determination Figure 1 presents the water surface profile for the median 200-year stage along the Feather River. Due to the configuration of the river, the wind setup and wave runup calculations will vary for each segment of the west levee. The majority of the Feather River west levee is susceptible to wind generated wave action from the east. There are also several segments where wind from the northeast and southeast will generate waves perpendicular to the west levee. There are even fewer segments where wind from the north, south, or southwest will generate waves that are, at best, 45 degrees angles into the west levee. There are no segments where wind from the west or northwest will generate waves that will impact the west levee. In the calculation of wind setup and wave runup, a longer fetch results in greater values. To evaluate the worst case wind setup and wave runup values, the longest fetch for each of the 8 wind directions was determined. Table 2 presents a summary of the worst case fetch length for each wind direction. The wave approach angle also impacts the calculation of wave runup with perpendicular wave generating the greatest wave runup. In addition, Table 2 presents the wind direction relative to the Feather River flow. While there is no guidance for calculating a reduction in wind setup and wave runup, the effect of river flow on upstream wind should reduce the values of wind setup and wave runup. 3 January 10, 2011
4 Table 2. Fetch Length Determination by (1) Notes: (1) (2) Location (Levee Station) Fetch Length Wave Approach Angle (2) (degrees) Relative to River Flow North ,000 > 45 Downstream Northeast ,000 0 Downstream East , Southeast ,000 0 pstream South ,000 > 45 pstream Southwest ,000 > 45 pstream West Northwest Wind direction represents the direction the wind is coming from (e.g. North wind direction represents wind out of the north) Wave approach angle equals zero for wave perpendicular to the levee. Wind Setup When wind blows over water it exerts a shear stress on the water surface. Although the wind shear stress is usually very small, its effect, when integrated over a large body of water, can result in an increase of water level at the leeward end. This effect is called wind setup. Wind setup can be estimated for small bodies of water based on Equation 15-1, SACE Hydrologic Engineering Requirements for Reservoirs (EM ): S = 2 F 1400d Where S = wind setup = average wind speed (mph) F = fetch distance (miles) d = average water depth along the fetch line This equation is known as the Zeider Zee equation. More recent studies show that for shallow water (< 16 ft deep) the value from the equation above should be averaged with the Sibul equation below (Design Criteria Memorandum 2, SACE/South Florida Water Management District, 2006) Where S = wind setup d = average water depth along the fetch line F = fetch distance = average wind speed (ft/sec) g = gravitational constant = 32.2 ft/sec 4 January 10, 2011
5 The average water depth along the fetch line was estimated using the ground surface profile along the fetch line in conjunction with the HEC-RAS median 200-yr water surface elevation. Table 3 presents the estimated average water depth and the calculated wind setup height for each worst case wind direction. Note that the greatest wind setup values are generated from the south and southeast wind directions the directions with the greatest wind speed and the longest fetch. Table 3. Wind Setup Height Average Water Depth Zeider Zee Wind Setup Sibul Wind Setup Average Wind Setup North Northeast East Southeast South Southwest West Northwest Wave Runup Wave runup is defined as the vertical height above the stillwater level to which an incident wave will run up the bank of the levee. The wave runup depends primarily on the levee bank slope, the water depth at the levee toe, fetch length, wind speed, and wave approach angle. One method to determine wave runup determines the 2% wave runup elevation, which represents the elevation above the still water level that is exceeded by only 2% of the waves. Before the wave runup can be calculated, the wave characteristics must be determined specifically the significant wave height and the peak wave period. These two parameters were determined using CEM Equation II-2-36: and Where: H mo = significant wave height T p = peak wave period (sec) X = fetch length g = gravitational constant = 32.2 ft/sec = friction velocity (ft/sec) u f C D 10 = = drag coefficient = = wind speed at 10m elevation (ft/sec) Wave runup on a structure depends on the type of wave breaking. Wave breaker types are identified by their surf similarity parameter. With the wave characteristics defined, H mo and T p can be used to determine the surf similarity parameter per CEM Equation VI-5-2: 5 January 10, 2011
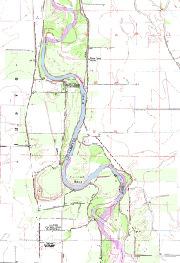
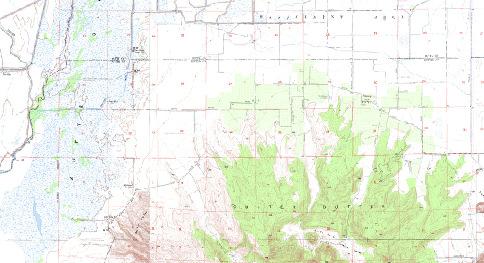
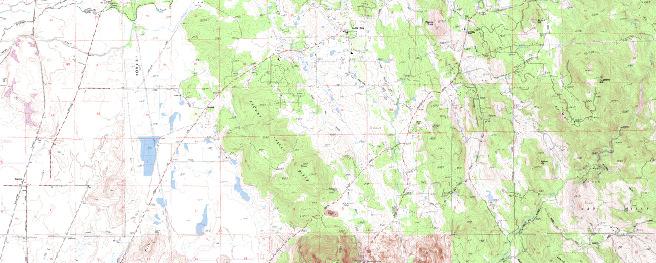
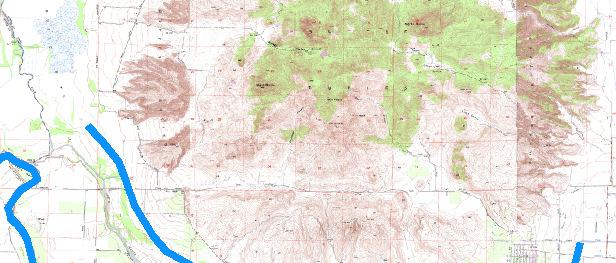
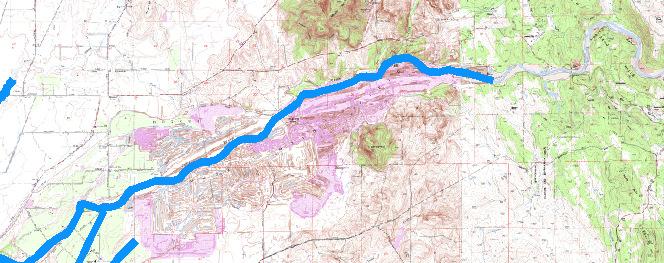
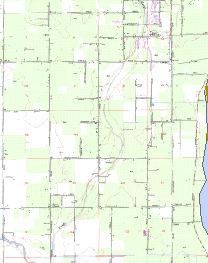
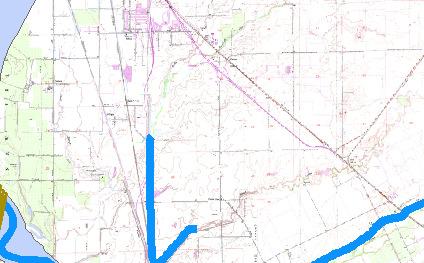
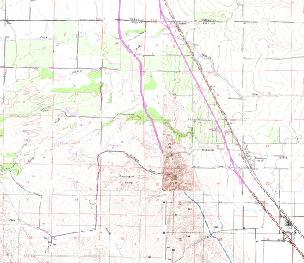
6 tan 2 Where: ε p = surf similarity parameter tan(α) = waterside slope of levee (assumed 1V:3H for all wind direction conditions) Now that the wave and wave breaking characteristics have been defined, the 2% wave runup elevation can be calculated per CEM Equation VI-5-3: % Where: R 2% = 2% wave runup elevation A,C = coefficients dependent on ε p (ε p < 2, A = 1.6, C = 0 for all wind direction conditions in this study per CEM Table VI-5-2) γ r = reduction factor for levee slope roughness (assumed γ r = 0.9 for 3 cm grass slopes per CEM Table VI-5-3) γ b = reduction factor for influence of a berm (assumed non-bermed fetch, γ b = 1) γ h = reduction factor for influence of shallow waves (assumed no shallow wave influence, γ h = 1) γ β = reduction factor for influence of angle of incidence, β, of the waves on the levee = Wave Runup Reduction Due to Vegetation The Three Rivers Levee Improvement Authority Feather River Setback Levee Design Report (January 2008) addresses the presence of trees and thick brush growing along parts of the Feather River floodplain. Figure 2 shows that similar vegetation is present in the worst case wave runup levee segments subject to wind from the south and southeast. Vegetation in the vicinity of the levee hinders wind-wave formation because it shelters the water surface from the wind. More importantly, this vegetation impedes wave travel and dissipates wave energy. These effects should result in a smaller-than-calculated wave runup on the levee and a correction factor should be applied. However, there is no theoretical guidance in the literature to account for this factor, but recent project studies in the Sacramento River watershed have made empirical corrections to account for this effect: The SACE Sacramento District (Natomas General Re-Evaluation Report Wave Runup Analysis, Draft Revised May 2006) estimated vegetation correction factors based on field 6 January 10, 2011
7 inspection at various points of analysis. Factors ranged from 1.0 (no vegetation) to 0.2 for areas where the vegetation on the levee was so dense that wave action will have little effect. The report presented 17 different correction factors with an average reduction factor of Mead & Hunt (SAFCA Wind Setup and Wave Runup Analysis for Natomas Levee Improvement Program, May 2007) performed a visual evaluation of aerial images of the levees and classified vegetative cover into three categories none, normal, and high and assigned corresponding reduction factors of 1.0, 0.75, and 0.6. GEI Consultants performed field observations of wind-wave action along the Feather River and Bear River levee during a high-water event in early January The average wind speed over the water was estimated at 35 mph from the southeast and the observed wave runup was less than 1 ft. The calculated wave runup was about 2 ft, so a 0.5 correction factor was applied as part of the TRLIA Feather River Setback Levee project. Based on these three studies, an average vegetative factor of 0.67 will be used in this study. Table 4 presents a summary of the 2% wave runup heights (both calculated and with vegetative correction) for each wind direction. Table 4. Wave Runup Height Calculated 2% Wave Runup Height 2% Wave Runup Height with Vegetative Correction North Northeast East Southeast South Southwest West Northwest Conclusions Table 5 presents the combined increase in stillwater elevation due to wind setup and wave runup for each of the worst case wind direction conditions. Note that in all cases, the impact of wind setup and wave runup is less than 3 ft. It should also be noted that in the areas with the greatest exposure from south and southwest wind, the top of levee is about 6 ft above the median 200- year water surface elevation. Table 5. Combined Wind Setup and Wave Runup Heights Average Wind Setup 2% Wave Runup Elevation with Vegetative Correction Combined Wind Setup and Wave Runup Elevation Increase North Northeast East Southeast (1) 7 January 10, 2011
8 Average Wind Setup 2% Wave Runup Elevation with Vegetative Correction Combined Wind Setup and Wave Runup Elevation Increase South (1) Southwest (1) West Northwest Notes: (1) Note that these cases are for upstream traveling waves. No reduction factor has been applied to address this situation. Based on these results, the ILDC freeboard requirement is 3 ft. 8 January 10, 2011


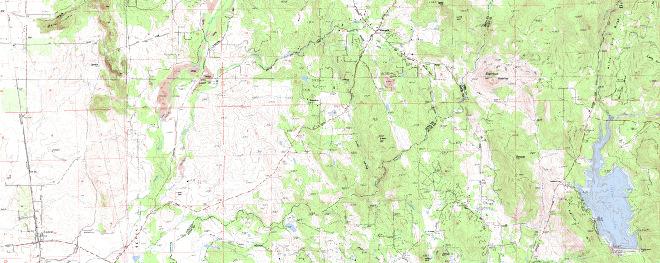
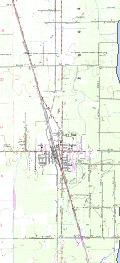
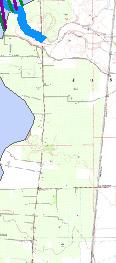
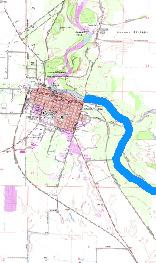
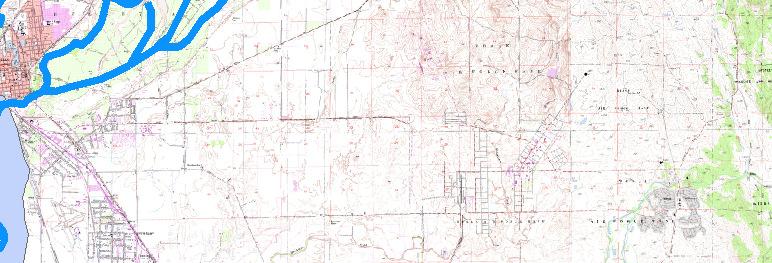
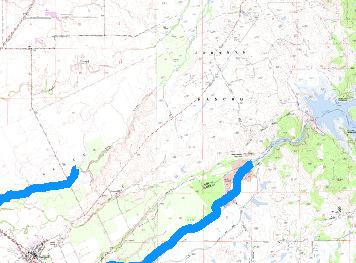
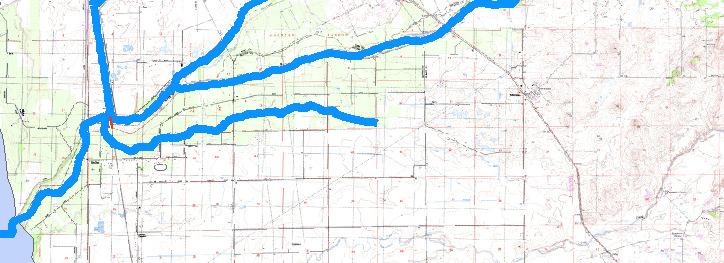
9 r rr ive at h e al Fe Ch ero ke ec an Oroville Thermalito Afterbay North Fetch Biggs South Fetch Southeast Fetch Gridley Feather River near Gridley East Fetch k Cree t u c Hon 99 þ } Median 200-Year Water Surface Butte Sink Live Oak Feather River at Live Oak ks l ou gh Sutter Bypass at Longbridge Sutter Bypass at Pumping Plant 3 Ca na Sutter rys Ma 20 þ } Wa ds wo rth Yuba River near Marysville l Butte Slough near Meridian Yuba City v ille Yu ba Yuba R Ja c Colusa Sacramento River at Colusa Feather River at Yuba City 65 þ } Grimes Tisdale Bypass Sacramento River Tisdale Bypass at Tisdale Weir at Tisdale Weir Sutter Bypass at Pumping Plant 2 North Fetch Su tte r iver Feather R Sacramento River below Wildins Slough near Grimes P Intercept Feather River at Boyd's Landing By pa ss Bear River e Yanke Southwest Fetch Feather River at Nicolaus c Sa Sacramento River at Knights Landing C R KL Woodland p 2.5 Yolo Bypass near Woodland 5 Miles JANARY Iron Point Rd., Suite 260 Folsom, CA os Cr Sutter Bypass at RD 1500 Pump Sacramento River at Freemont Weir þ } e nto Rive r Phone: (916) Fax: (916) l na a sc Sacramento River at Verona Sacramento Slough near Karnak Yolo Bypass 5! h Sloug Sutter Bypass at Willow Slough r am k ree C y Dr River Bear River Bear near Wheatland at Pleasant Grove Rd 99 þ } Sutter Bypass at Pumping Plant 1 0 O B Sutter Buttes North Highlands 80! STTER BTTE FLOOD CONTROL AGENCY FIGRE FEATHER RIVER WEST LEVEE WORST CASE FETCH LENGTH 1

")

10 Feather River West Levee Fe a e th rr r ive Map Key H p reek C t u onc 0.6 Miles JANARY Iron Point Rd., Suite 260 Folsom, CA Phone: (916) Fax: (916) STTER BTTE FLOOD CONTROL AGENCY FIGRE TYPICAL VEGITATION WITHIN THE FEATHER RIVER FLOODPLAIN 2
Period of Record from No data was available from 1955 to 1962, but the remaining 57 years of data was available. 2
 TECHNICAL MEMORANDUM analyzed from the shared National Oceanic and Atmospheric Administration (NOAA) and Western Regional Climate Center (WCRR) weather station at the Stockton Metropolitan Airport 1. Prior
Evaluation of June 9, 2014 Federal Emergency Management Agency Flood Insurance Study for Town of Weymouth, Norfolk, Co, MA
 Evaluation of June 9, 2014 Federal Emergency Management Agency Flood Insurance Study for Town of Weymouth, Norfolk, Co, MA Prepared For: Woodard & Curran 95 Cedar Street, Suite 100 Providence, RI 02903
Redd Dewatering and Juvenile Salmonid Stranding in the Lower Feather River,
 Redd Dewatering and Juvenile Salmonid Stranding in the Lower Feather River, 2005-2006 Interim Report for NOAA Fisheries Prepared by: California Department of Water Resources Division of Environmental Services
Steven A. Hughes. Ph.D., P.E. David R. Basco. Ph.D., P.E.
 Steven A. Hughes. Ph.D., P.E. Coastal and Hydraulics Laboratory US Army Engineer Research and Development Center David R. Basco. Ph.D., P.E. Coastal Engineering Center Old Dominion University Overview
TABLE OF CONTENTS EXECUTIVE SUMMARY 1
 SLI Doc. No. 505573-3001-4HER-0001 00 12-Sept-2012 ii TABLE OF CONTENTS PAGE EXECUTIVE SUMMARY 1 1 INTRODUCTION... 3 2 OBJECTIVES... 5 3 WIND DATA... 6 3.1 Wind Rose... 7 4 SOCIÉTÉ D ÉNERGIE DE LA BAIE
Plan B Dam Breach Assessment
 Plan B Dam Breach Assessment Introduction In support of the Local Sponsor permit applications to the states of Minnesota and North Dakota, a dam breach analysis for the Plan B alignment of the Fargo-Moorhead
Council Agenda Report
 Agenda Item #10 Council Agenda Report SUBJECT: REVIEW, DISCUSS AND APPROVE LETTER TO THE CENTRAL VALLEY FLOOD PROTECTION BOARD REGARDING ISSUES WITH THE CENTRAL VALLEY FLOOD PROTECTION PLAN MEETING DATE:
RESILIENCE THROUGH RESTORATION
 RESILIENCE THROUGH RESTORATION RECLAMATION DISTRICT NO. 1601 TWITCHELL ISLAND SAN JOAQUIN RIVER SETBACK LEVEE PROJECT TWITCHELL ISLAND BASICS Nearly 12 miles of levee Storm drainage facilities Protects
PROFILE OF SACRAMENTO RIVER, FREEPORT TO VERONA, CALIFORNIA,
 PROFILE OF SACRAMENTO RIVER, FREEPORT TO VERONA, CALIFORNIA, FLOOD OF FEBRUARY 1986 By J.C. Blodgett and J.B. Lucas U.S. GEOLOGICAL SURVEY Open-File Report 88-82 CO CM I m r-h CM Sacramento, California
Technical Brief - Wave Uprush Analysis Island Harbour Club, Gananoque, Ontario
 Technical Brief - Wave Uprush Analysis RIGGS ENGINEERING LTD. 1240 Commissioners Road West Suite 205 London, Ontario N6K 1C7 October 31, 2014 Table of Contents Section Page Table of Contents... i List
RISK AND STANDARDS BASED APPROACH TO RIP RAP DESIGN ALTERNATIVES FOR GRAHAMSTOWN DAM STAGE 2 AUGMENTATION
 RISK AND STANDARDS BASED APPROACH TO RIP RAP DESIGN ALTERNATIVES FOR GRAHAMSTOWN DAM STAGE 2 AUGMENTATION M. B. Barker 1 and D. Holroyde 2 ABSTRACT. A detailed study was completed for the Stage 2 works
Technical Brief - Wave Uprush Analysis 129 South Street, Gananoque
 Technical Brief - Wave Uprush Analysis 129 South Street, Gananoque RIGGS ENGINEERING LTD. 1240 Commissioners Road West Suite 205 London, Ontario N6K 1C7 June 12, 2013 Table of Contents Section Page Table
APPENDIX J HYDROLOGY AND WATER QUALITY
 APPENDIX J HYDROLOGY AND WATER QUALITY J-1 Technical Report on Airport Drainage, Northern Sector Airport and Ordinance Creek Watershed / Preliminary Creek Constructed Natural Channel Culvert J-2 Preliminary
HURRICANE SANDY LIMITED REEVALUATION REPORT UNION BEACH, NEW JERSEY DRAFT ENGINEERING APPENDIX SUB APPENDIX D SBEACH MODELING
 HURRICANE SANDY LIMITED REEVALUATION REPORT UNION BEACH, NEW JERSEY DRAFT ENGINEERING APPENDIX SUB APPENDIX D SBEACH MODELING Rev. 18 Feb 2015 1 SBEACH Modeling 1.0 Introduction Following the methodology
ANSWERS TO QUESTIONS IN THE NOTES AUTUMN 2018
 ANSWERS TO QUESTIONS IN THE NOTES AUTUMN 2018 Section 1.2 Example. The discharge in a channel with bottom width 3 m is 12 m 3 s 1. If Manning s n is 0.013 m -1/3 s and the streamwise slope is 1 in 200,
+)) Lower Churchill Project RIPRAP DESIGN FOR WIND-GENERATED WAVES SNC LAVALIN. SLI Document No HER
) Lower Churchill Project RIPRAP DESIGN FOR WIND-GENERATED WAVES SNC LAVALIN. SLI Document No HER") +)) SNC LAVALIN Lower Churchill Project RIPRAP DESIGN FOR SLI Document No. 505573-3001-4HER-0011-00 Nalcor Reference No. MFA-SN-CD-0000-CV-RP-0006-01 Rev. 81 Date: 07 -Dec-2012 Prepared by: Checked by:
+)) SNC LAVALIN Lower Churchill Project RIPRAP DESIGN FOR SLI Document No. 505573-3001-4HER-0011-00 Nalcor Reference No. MFA-SN-CD-0000-CV-RP-0006-01 Rev. 81 Date: 07 -Dec-2012 Prepared by: Checked by:
Technical Report Culvert A Hydraulic Analysis
 DATE: November 3, 2011 Technical Report Culvert A Hydraulic Analysis TO: FROM: RE: Jim Reiser, P.E. Project Manager Parsons Brinckerhoff, Inc. Kurt Killian, P.E., CFM Parsons Brinckerhoff, Inc. Design
Summary of HEC 18, Evaluating Scour at Bridges FHWA NHI Should really follow HEC 18, but this summary will get you the main points.
 Summary of HEC 18, Evaluating Scour at Bridges FHWA NHI 01-001 Should really follow HEC 18, but this summary will get you the main points. 1: Determine scour analysis variables 2: Analyze long-term bed
COST EFFECTIVE STORAGE CAPACITY INCREASE FOR ALUMINA TAILINGS DISPOSAL AREA THROUGH SPILLWAY OPTIMISATION
 COST EFFECTIVE STORAGE CAPACITY INCREASE FOR ALUMINA TAILINGS DISPOSAL AREA THROUGH SPILLWAY OPTIMISATION Abstract Lonie I * Tailings and Dams, GHD Brisbane, QLD, Australia Queensland Alumina Limited operates
APPENDIX D-2. Sea Level Rise Technical Memo
 APPENDIX D-2 Sea Level Rise Technical Memo 2185 N. California Blvd., Suite 500 Walnut Creek, CA 94596 (925) 944-5411 Fax: (925) 944-4732 www.moffattnichol.com DRAFT MEMORANDUM To: From: Neil Nichols,
Colusa Basin Drain Watershed Fish Stranding Tour Concept Paper Mike Hendrick and Brycen Swart NMFS
 Colusa Basin Drain Watershed Fish Stranding Tour Concept Paper Mike Hendrick and Brycen Swart NMFS On May 31, 2013 representatives from CDFW, USFWS, and NMFS went on a field tour to look at locations in
Wave Generation. Chapter Wave Generation
 Chapter 5 Wave Generation 5.1 Wave Generation When a gentle breeze blows over water, the turbulent eddies in the wind field will periodically touch down on the water, causing local disturbances of the
Sussex County, DE Preliminary Study Overview
 Sussex County, DE Preliminary Study Overview Coastal study scope: 102 miles of entire County shoreline Revised 102 panels for coastal study Riverine study scope: 14 streams, 67.1 miles, within the Nanticoke
2016 NC Coastal Local Governments Annual Meeting
 2016 NC Coastal Local Governments Annual Meeting Coastal Flood Study Modeling and Mapping 101 April 21, 2016 Tom Langan, PE, CFM Engineering Supervisor NCEM Floodplain Mapping Program FEMA Coastal Flood
Sea State Analysis. Topics. Module 7 Sea State Analysis 2/22/2016. CE A676 Coastal Engineering Orson P. Smith, PE, Ph.D.
 Sea State Analysis Module 7 Orson P. Smith, PE, Ph.D. Professor Emeritus Module 7 Sea State Analysis Topics Wave height distribution Wave energy spectra Wind wave generation Directional spectra Hindcasting
then extrapolated to larger area just based on the length of bank [that actually falls in this category].
![then extrapolated to larger area just based on the length of bank [that actually falls in this category].](/thumbs/73/69159506.jpg "then extrapolated to larger area just based on the length of bank [that actually falls in this category].") Ken Rood: Good morning, all. You'll probably be glad to know I'm the last speaker of the day. I'm never sure if that's a good thing or not. But [lucky me]. And I'm going to talk today -- the title of the
Ken Rood: Good morning, all. You'll probably be glad to know I'm the last speaker of the day. I'm never sure if that's a good thing or not. But [lucky me]. And I'm going to talk today -- the title of the
Culvert Design for Low and High Gradient Streams in the Midwest. Dale Higgins, Hydrologist Chequamegon-Nicolet National Forest
 Culvert Design for Low and High Gradient Streams in the Midwest Dale Higgins, Hydrologist Chequamegon-Nicolet National Forest Overview Culvert Design Considerations Hydraulic Terms Culvert Impacts Low
OFFICE OF STRUCTURES MANUAL FOR HYDROLOGIC AND HYDRAULIC DESIGN CHAPTER 11 APPENDIX B TIDEROUT 2 USERS MANUAL
 OFFICE OF STRUCTURES MANUAL FOR HYDROLOGIC AND HYDRAULIC DESIGN CHAPTER 11 APPENDIX B TIDEROUT 2 USERS MANUAL APRIL 2011 APRIL 2011 Page 1 Preface TIDEROUT 2, Build 1.22 dated June 29, 2006 is the current
Inner Harbor Navigation Canal (IHNC) Basin 1% (100-yr) and 0.2% (500-yr) Surge and Wave Event Water Levels
 Basin 1% (100-yr) and 0.2% (500-yr) Surge and Wave Event Water Levels") Inner Harbor Navigation Canal (IHNC) Basin 1% (100-yr) and 0.2% (500-yr) Surge and Wave Event Water Levels Dr. John Grieshaber Hurricane Protection Office US Army Corps of Engineers Overview The IHNC basin
Inner Harbor Navigation Canal (IHNC) Basin 1% (100-yr) and 0.2% (500-yr) Surge and Wave Event Water Levels Dr. John Grieshaber Hurricane Protection Office US Army Corps of Engineers Overview The IHNC basin
 Dam Modification Report Stingy Run Fly Ash Reservoir Appendix E Spillway System Design Calculations E1: Spillway/Energy Dissipater Design for 100-year Event CHE8273 8 September 4, 2014 Written by: CJW
3. GRADUALLY-VARIED FLOW (GVF) AUTUMN 2018
 AUTUMN 2018") 3. GRADUALLY-VARIED FLOW (GVF) AUTUMN 2018 3.1 Normal Flow vs Gradually-Varied Flow V 2 /2g EGL (energy grade line) Friction slope S f h Geometric slope S 0 In flow the downslope component of weight balances
3. GRADUALLY-VARIED FLOW (GVF) AUTUMN 2018 3.1 Normal Flow vs Gradually-Varied Flow V 2 /2g EGL (energy grade line) Friction slope S f h Geometric slope S 0 In flow the downslope component of weight balances
REVETMENTS. Purposes and Operational Constraints. Purposes Erosion control o o. Revetment Design 4/5/2016. CE A676 Coastal Engineering
 REVETMENTS Ijsseldam, the Netherlands Orson P. Smith, PE, Ph.D. Instructor Purposes and Operational Constraints Purposes Erosion control o o Embankment Toe protection for a seawall, retaining wall or other
Site Description: Tower Site
 Wind Resource Summary for Elizabeth Site Final Report Colorado Anemometer Loan Program Monitoring Period: 7/3/6 /15/7 Report Date: December 22, 7 Site Description: The site is.6 miles northeast of the
Juvenile Salmonid Emigration Monitoring in the Middle Sacramento River. Diane Coulon California Department of Fish and Wildlife
 Juvenile Salmonid Emigration Monitoring in the Middle Sacramento River Diane Coulon California Department of Fish and Wildlife Monitoring is conducted primarily to develop information on emigration timing
WIND SPEED LENGTH OF TIME WIND BLOWS (Duration) DISTANCE OVER WHICH IT BLOWS (Fetch)
 DISTANCE OVER WHICH IT BLOWS (Fetch)") WAVES Up and down movement of ocean surface Transportation of energy across the water over vast distances If not stopped by anything, waves can travel entire oceans Size and speed depend upon: WIND SPEED
WAVES Up and down movement of ocean surface Transportation of energy across the water over vast distances If not stopped by anything, waves can travel entire oceans Size and speed depend upon: WIND SPEED
Appendix E Cat Island Borrow Area Analysis
 Appendix E Cat Island Borrow Area Analysis ERDC/CHL Letter Report 1 Cat Island Borrow Area Analysis Multiple borrow area configurations were considered for Cat Island restoration. Borrow area CI1 is located
Assessing Mechanisms and Rates of Levee Erosion in the Sacramento-San Joaquin Delta
 Assessing Mechanisms and Rates of Levee Erosion in the Sacramento-San Joaquin Delta Douglas Sherman, Texas A&M University Bernard Bauer, University of British Columbia, Okanogan Mark Lorang, University
2.0 Existing Conditions
 20 2.0 Existing Conditions 2.1 Land Use, Future Growth Patterns, Physical Barriers Geographic Overview Sutter County s land use pattern is characterized by extensive agricultural areas, significant natural
SELBY CREEK SILVERADO TRAIL CULVERT FISH PASSAGE ASSESSMENT
 SELBY CREEK SILVERADO TRAIL CULVERT FISH PASSAGE ASSESSMENT NAPA COUNTY, CALIFORNIA PREPARED BY NAPA COUNTY RESOURCE CONSERVATION DISTRICT 1303 JEFFERSON ST. SUITE 500B NAPA, CALIFORNIA 94559 WWW.NAPARCD.ORG
COASTAL ENVIRONMENTS. 454 lecture 12
 COASTAL ENVIRONMENTS Repeated movement of sediment & water constructs a beach profile reflecting the balance between average daily or seasonal wave forces and resistance of landmass to wave action Coasts
MEMORANDUM. TNC Fisher Slough Final Design and Permitting Subject: DRAFT Technical Memorandum: Levee Emergency Spillway Design
 MEMORANUM TNC Fisher Slough Final esign and Permitting Subject: RAFT Technical Memorandum: Levee Emergency Spillway esign To: From: Internal Memorandum For Record Yen Hsu Chen (Tetra Tech) avid Cline (Tetra
PREDICTION OF WAVE RUN-UP ON A COASTAL IMPERMEABLE STRUCTURE
 Journal of Coastal Development ISSN: 40-57 Volume 4, Number, February 00 : 79-86 Accredited: 69/Dikti/Kep/000 PREDICTION OF WAVE RUN-UP ON A COASTAL IMPERMEABLE STRUCTURE Mustafid and Slamet Hargono Faculty
Name: SOLUTIONS MIDTERM 2, Spring 2019
 Name: SOLUTIONS MIDTERM 2, Spring 2019 Solutions in bold. Print your name clearly above, and write and bubble in your student 800 number on the provided scantron. There are 20 equally-weighted problems
Indiana LTAP Road Scholar Core Course #10 Culvert Drainage. Presented by Thomas T. Burke, Jr., PhD, PE Christopher B. Burke Engineering, Ltd.
 Indiana LTAP Road Scholar Core Course #10 Culvert Drainage Presented by Thomas T. Burke, Jr., PhD, PE Christopher B. Burke Engineering, Ltd. Objectives Review culvert shapes, end sections, and materials
Autodesk Moldflow Communicator Process settings
 Autodesk Moldflow Communicator 212 Process settings Revision 1, 3 March 211. Contents Chapter 1 Process settings....................................... 1 Profiles.................................................
Modeling of Long Culverts and Stormdrains A Comparison of Different Methods
 Modeling of Long Culverts and Stormdrains A Comparison of Different Methods Shrinivas Kaulgud, P.E., CFM Cheryl Hannan, P.E., CFM, LEED AP October 12, 2017 Presentation Outline Introduction Case Studies
CVEN 311 Fluid Dynamics Fall Semester 2011 Dr. Kelly Brumbelow, Texas A&M University. Final Exam
 CVEN 311 Fluid Dynamics Fall Semester 2011 Dr. Kelly Brumbelow, Texas A&M University Final Exam 8 pages, front & back, not including reference sheets; 21 questions An excerpt from the NCEES Fundamentals
Design and Installation of two Permanent Booms at La Romaine-2 to resist Ice, retain Debris and serve as Safety Booms.
 CGU HS Committee on River Ice Processes and the Environment 18 th Workshop on the Hydraulics of Ice Covered Rivers Quebec City, QC, Canada, August 18-20, 2015 Design and Installation of two Permanent Booms
CALCASIEU SALINITY STRUCTURES. HYDRODYNAMIC MODELING (To Support Design of Salinity Barriers)
") CALCASIEU SALINITY STRUCTURES HYDRODYNAMIC MODELING (To Support Design of Salinity Barriers) Presentation Overview 1 2 3 4 5 Project Overview and CEA Circulation Modeling Vessel Hydrodynamics Modeling
CALCASIEU SALINITY STRUCTURES HYDRODYNAMIC MODELING (To Support Design of Salinity Barriers) Presentation Overview 1 2 3 4 5 Project Overview and CEA Circulation Modeling Vessel Hydrodynamics Modeling
Structure and discharge test cases
 Chapter 28 Structure and discharge test cases 28.1 Introduction Three test case have been implemented to test the performance and applicability of the structures and discharges modules. drythin Simulates
Annex E Bridge Pier Protection Plan
 Annex E Bridge Pier Protection Plan Table E1 Bridge Types and Locations Table E2 Flow Conditions For River Sections Figure E1 Bridge Abutment Protection Figure E2 Bridge Pier Protection Figure E3 Central
Beach Profiles. Topics. Module 9b Beach Profiles and Crossshore Sediment Transport 3/23/2016. CE A676 Coastal Engineering
 Beach Profiles AND CROSS-SHORE TRANSPORT Orson P. Smith, PE, Ph.D., Professor Emeritus Topics Features of beach and nearshore profiles Equilibrium profiles Cross-shore transport References Text (Sorensen)
VIRGINIA SOIL AND WATER CONSERVATION BOARD GUIDANCE DOCUMENT ON DAM BREAK INUNDATION ZONE AND INCREMENTAL DAMAGE ANALYSIS AND MAPPING PROCEDURES
 (Approved XXXXX, 2010) Working Draft Version January 14, 2010 VIRGINIA SOIL AND WATER CONSERVATION BOARD GUIDANCE DOCUMENT ON DAM BREAK INUNDATION ZONE AND INCREMENTAL DAMAGE ANALYSIS AND MAPPING PROCEDURES
Washington State Fish Passage Barrier Removal Projects. Casey Kramer, PE WSDOT State Hydraulics Engineer
 Washington State Fish Passage Barrier Removal Projects Casey Kramer, PE WSDOT State Hydraulics Engineer 2014 National Hydraulic Engineering Conference Iowa City, IA August 20 th, 2014 WSDOT Fish Passage
Chapter 10, Part 1. Scales of Motion. Examples of Wind at Different Scales. Small Scale Winds
 Chapter 10, Part 1 Small Scale Winds Scales of Motion Wirls or eddies exist at all length scales in the atmosphere. Microscale (2m) Mesoscale (20km) Synoptic scale (2000km) Examples of Wind at Different
Northwest Hydraulic Consultants (NHC) is pleased to submit this assessment of the wave climate at Lazo Road, Comox.
 is pleased to submit this assessment of the wave climate at Lazo Road, Comox.") 405 495 Dunsmuir Street Nanaimo, B.C. V9R 6B9 250.754.6425 www.nhcweb.com NHC Ref. No. 03000276 21 November 2014 Wedler Engineering LLP #211-2459 Cousins Avenue Courtenay, BC V9N 3N6 Attention: Andrew
405 495 Dunsmuir Street Nanaimo, B.C. V9R 6B9 250.754.6425 www.nhcweb.com NHC Ref. No. 03000276 21 November 2014 Wedler Engineering LLP #211-2459 Cousins Avenue Courtenay, BC V9N 3N6 Attention: Andrew
PENNDRAIN.rep. HEC-RAS Version May 2005 U.S. Army Corp of Engineers Hydrologic Engineering Center 609 Second Street Davis, California
 HEC-RAS Version 3.1.3 May 2005 U.S. Army Corp of Engineers Hydrologic Engineering Center 609 Second Street Davis, California X X XXXXXX XXXX XXXX XX XXXX X X X X X X X X X X X X X X X X X X X XXXXXXX XXXX
Experimental Investigation on Changes of Water Surface Profile with Gaussian Shaped Bottom and Side Roughness
 Experimental Investigation on Changes of Water Surface Profile with Gaussian Shaped Bottom and Side Md. Rafiue Islam a, Shariful Islam b*, Md. Abdul Qaiyum Talukder c, S. M. Rezwan Hossain d Abstract Bed
The History of Coastal Flood Hazard Assessments in the Great Lakes
 The History of Coastal Flood Hazard Assessments in the Great Lakes Brian A. Caufield, P.E., CFM June 23, 2016 2 The Great Lakes Some Statistics Courtesy of Great Lakes Information Network One-fifth of
6.6 Gradually Varied Flow
 6.6 Gradually Varied Flow Non-uniform flow is a flow for which the depth of flow is varied. This varied flow can be either Gradually varied flow (GVF) or Rapidly varied flow (RVF). uch situations occur
Exercise (3): Open Channel Flow Rapidly Varied Flow
: Open Channel Flow Rapidly Varied Flow") Exercise (3): Open Channel Flow Rapidly Varied Flow 1) A hydraulic jump exists in a trapezoidal channel having a bed width of 7 m and side slope of 1:1. The flowing discharge is 25 m 3 /sec. Construct
Exercise (3): Open Channel Flow Rapidly Varied Flow 1) A hydraulic jump exists in a trapezoidal channel having a bed width of 7 m and side slope of 1:1. The flowing discharge is 25 m 3 /sec. Construct
OCEAN WAVES NAME. I. Introduction
 NAME OCEAN WAVES I. Introduction The physical definition of a wave is a disturbance that transmits energy from one place to another. In the open ocean waves are formed when wis blowing across the water
Baraga County, MI Coastal Hazard Analysis Flood Risk Review Meeting. July 12, 2018
 Baraga County, MI Coastal Hazard Analysis Flood Risk Review Meeting July 12, 2018 Agenda Introductions Coastal Flood Risk Study and Mapping Program Current Status Technical Overview of Study and Mapping
St. Louis County, MN Coastal Hazard Analysis Flood Risk Review Meeting. May 2, 2018
 St. Louis County, MN Coastal Hazard Analysis Flood Risk Review Meeting May 2, 2018 Agenda Introductions Coastal Flood Risk Study and Mapping Program Current Status Technical Overview of Study and Mapping
Culvert Design An Overview of the NYS Highway Design Manual Chapter 8
 Seventeenth Statewide Conference on Local Bridges Culvert Design An Overview of the NYS Highway Design Manual Chapter 8 Tuesday, October 25, 2011 Training Session: Culvert Design, Analysis - talk 2 Presented
Name: Form: 2.To know the difference between Constructive and Destructive wave # $
 Name: Form: Landforms and landscape processes: COASTS 1. To know what factors affect the strength of waves # $ 2.To know the difference between Constructive and Destructive wave # $ 3. To be able to draw
HARBOUR SEDIMENTATION - COMPARISON WITH MODEL
 HARBOUR SEDIMENTATION - COMPARISON WITH MODEL ABSTRACT A mobile-bed model study of Pointe Sapin Harbour, in the Gulf of St. Lawrence, resulted in construction of a detached breakwater and sand trap to
NordFoU: External Influences on Spray Patterns (EPAS) Report 16: Wind exposure on the test road at Bygholm
 Report 16: Wind exposure on the test road at Bygholm") NordFoU: External Influences on Spray Patterns (EPAS) Report 16: Wind exposure on the test road at Bygholm Jan S. Strøm, Aarhus University, Dept. of Engineering, Engineering Center Bygholm, Horsens Torben
NordFoU: External Influences on Spray Patterns (EPAS) Report 16: Wind exposure on the test road at Bygholm Jan S. Strøm, Aarhus University, Dept. of Engineering, Engineering Center Bygholm, Horsens Torben
Illinois State Water Survey
 Illinois State Water Survey HYDROLOGY DIVISION SWS Contract Report 508 COMPARISON OF 1987 AND 1989 BED PROFILE SURVEYS OF THE LOWER CACHE RIVER by Richard Allgire Office of Sediment and Wetland Studies
CHAPTER 4 SPALDING COUNTY, GEORGIA 4.0 CULVERT DESIGN
 SPALDING COUNTY, GEORGIA CHAPTER 4 4.0 CULVERT DESIGN... 4-1 4.1 INTRODUCTION... 4-1 4.2 SYMBOLS AND DEFINITIONS... 4-1 4.3 ENGINEERING DESIGN CRITERIA... 4-2 4.3.1 FREQUENCY FLOOD... 4-2 4.3.2 VELOCITY
Bayfield & Ashland Counties, WI Coastal Hazard Analysis Flood Risk Review Meeting. June 05, 2018
 Bayfield & Ashland Counties, WI Coastal Hazard Analysis Flood Risk Review Meeting June 05, 2018 Agenda Introductions Coastal Flood Risk Study and Mapping Program Current Status Technical Overview of Study
SUPPLEMENTAL DOCUMENT SEA LEVEL RISE SCENARIO SELECTION AND DESIGN TIDE CALCULATION
 SUPPLEMENTAL DOCUMENT SEA LEVEL RISE SCENARIO SELECTION AND DESIGN TIDE CALCULATION FOR THE GUIDANCE FOR INCORPORATING SEA LEVEL RISE INTO CAPITAL PLANNING IN SAN FRANCISCO: ASSESSING VULNERABILITY AND
The Hydraulic Design of an Arced Labyrinth Weir at Isabella Dam
 Utah State University DigitalCommons@USU International Symposium on Hydraulic Structures Jun 28th, 1:30 PM The Hydraulic Design of an Arced Labyrinth Weir at Isabella Dam E. A. Thompson Sacramento District
A.21 SACRAMENTO SPLITTAIL (POGONICHTHYS
 A. SACRAMENTO SPLITTAIL (POGONICHTHYS MACROLEPIDOTUS) A.. Legal and Other Status The Sacramento splittail was federally listed as threatened on February, (USFWS ), and delisted on September, 00 (USFWS
Wave Breaking. Wave Breaking
 Wave Breaking The release of energy derived from the wind, along a narrow coastal zone - geomorphic work done by wind, really, translated through medium of water. Wave Breaking Wave breaking is responsible
HEC 26 Aquatic Organism Passage Design Manual Evolution & Application
 HEC 26 Aquatic Organism Passage Design Manual Evolution & Application Sven Leon, P.E., Hydraulics Engineer Federal Highway Administration 2015 Alaska Fish Passage Meeting October 13 14, 2015 VTRC, Juneau,
Wave Overtopping of Seawalls. Design and Assessment Manual. HR Wallingford Ltd. February R&D Technical Report W178. R&D Technical Report W178
 Wave Overtopping of Seawalls Design and Assessment Manual HR Wallingford Ltd February 1999 R&D Technical Report W178 R&D Technical Report W178 Commissioning Organisation Environment Agency Rio House Waterside
Impact of New ANSI/TIA-222-H Standard on Broadcast NAB * ERI Breakfast * Apr 11, 2018 James Ruedlinger, P.E
 Impact of New ANSI/TIA-222-H Standard on Broadcast 2018 NAB * ERI Breakfast * Apr 11, 2018 James Ruedlinger, P.E Adoption ANSI/TIA-222 REV H: Current industry consensus standard Effective January 1, 2018
The Discussion of this exercise covers the following points: Pumps Basic operation of a liquid pump Types of liquid pumps The centrifugal pump.
 Exercise 2-3 Centrifugal Pumps EXERCISE OBJECTIVE In this exercise, you will become familiar with the operation of a centrifugal pump and read its performance chart. You will also observe the effect that
SECTION 2 HYDROLOGY AND FLOW REGIMES
 SECTION 2 HYDROLOGY AND FLOW REGIMES In this section historical streamflow data from permanent USGS gaging stations will be presented and discussed to document long-term flow regime trends within the Cache-Bayou
APPENDIX C. Fluvial and Tidal Hydraulics Report
 APPENDIX C Fluvial and Tidal Hydraulics Report BUENA VISTA LAGOON ENHANCEMENT PROJECT FLUVIAL AND TIDAL HYDRAULICS ANALYSES Prepared for: SANDAG 401 B Street, Suite 800 San Diego, California 92101 Contact:
Basis of Structural Design
 Basis of Structural Design Course 10 Actions on structures: Wind loads Other loads Course notes are available for download at http://www.ct.upt.ro/users/aurelstratan/ Wind loading: normative references
Managing floodplain productivity: Slow it down, Spread it out, Grow em Up
 Managing floodplain productivity: Slow it down, Spread it out, Grow em Up Jacob Katz California Trout C. Jeffres Inland Sea J street Flood of 1862 A Shifting Mosaic of Wetland Habitat Types Dynamic Permanence
COASTAL PROTECTION AGAINST WIND-WAVE INDUCED EROSION USING SOFT AND POROUS STRUCTURES: A CASE STUDY AT LAKE BIEL, SWITZERLAND
 COASTAL PROTECTION AGAINST WIND-WAVE INDUCED EROSION USING SOFT AND POROUS STRUCTURES: A CASE STUDY AT LAKE BIEL, SWITZERLAND Selim M. Sayah 1 and Stephan Mai 2 1. Swiss Federal Institute of Technology
REPORT GEO-TECHNICAL INVESTIGATION FOR THE PROPOSED BLOCK-7 SUB-STATION SY NO-225, NEAR RAYACHERLU VILLAGE
 REPORT ON GEO-TECHNICAL INVESTIGATION FOR THE PROPOSED BLOCK-7 SUB-STATION SY NO-225, NEAR RAYACHERLU VILLAGE CLIENT: KARNATAKA SOLAR POWER DEVELOPMENT CORPORATION BANGALORE 0 GEO-TECHNICAL INVESTIGATION
Low-crested offshore breakwaters: a functional tool for beach management
 Environmental Problems in Coastal Regions VI 237 Low-crested offshore breakwaters: a functional tool for beach management K. Spyropoulos & E. Andrianis TRITON Consulting Engineers, Greece Abstract Beach
Undertow - Zonation of Flow in Broken Wave Bores
 Lecture 22 Nearshore Circulation Undertow - Zonation of Flow in Broken Wave Bores In the wave breaking process, the landward transfer of water, associated with bore and surface roller decay within the
USING A LABYRINTH WEIR TO INCREASE HYDRAULIC CAPACITY. Dustin Mortensen, P.E. 1 Jake Eckersley, P.E. 1
 USING A LABYRINTH WEIR TO INCREASE HYDRAULIC CAPACITY Dustin Mortensen, P.E. 1 Jake Eckersley, P.E. 1 Plum Creek Floodwater Retarding Structure No. 6 is located in an area of Kyle, Texas, that is currently
2. Water levels and wave conditions. 2.1 Introduction
 18 2. Water levels and wave conditions 2.1 Introduction This Overtopping Manual has a focus on the aspects of wave run-up and wave overtopping only. It is not a design manual, giving the whole design process
Lake Oroville Coho Salmon Stocking Program Present. California Department of Water Resources (DWR) December 2009
 December 2009") Lake Oroville Coho Salmon Stocking Program 2000 - Present California Department of Water Resources (DWR) December 2009 1 CALIFORNIA DEPT. WATER RESOURCES Largest state-built power & water supply system
Lake Oroville Coho Salmon Stocking Program 2000 - Present California Department of Water Resources (DWR) December 2009 1 CALIFORNIA DEPT. WATER RESOURCES Largest state-built power & water supply system
Volume and Shoreline Changes along Pinellas County Beaches during Tropical Storm Debby
 Volume and Shoreline Changes along Pinellas County Beaches during Tropical Storm Debby Ping Wang and Tiffany M. Roberts Coastal Research Laboratory University of South Florida July 24, 2012 Introduction
IMO REVISION OF THE INTACT STABILITY CODE. Proposal of methodology of direct assessment for stability under dead ship condition. Submitted by Japan
 INTERNATIONAL MARITIME ORGANIZATION E IMO SUB-COMMITTEE ON STABILITY AND LOAD LINES AND ON FISHING VESSELS SAFETY 49th session Agenda item 5 SLF 49/5/5 19 May 2006 Original: ENGLISH REVISION OF THE INTACT
Evaluating the Design Safety of Highway Structural Supports
 Evaluating the Design Safety of Highway Structural Supports by Fouad H. Fouad and Elizabeth A. Calvert Department of Civil and Environmental Engineering The University of Alabama at Birmingham Birmingham,
REPORT GEO-TECHNICAL INVESTIGATION FOR THE PROPOSED BLOCK-1 SUB-STATION SY NO-44, NEAR KYATAGANACHERLU VILLAGE
 REPORT ON GEO-TECHNICAL INVESTIGATION FOR THE PROPOSED BLOCK-1 SUB-STATION SY NO-44, NEAR KYATAGANACHERLU VILLAGE CLIENT: KARNATAKA SOLAR POWER DEVELOPMENT CORPORATION BANGALORE 0 GEO-TECHNICAL INVESTIGATION
The API states the following about tube rupture for a shell-and-tube heat exchangers:
 Tutorial This tutorial describes the theory and modeling process of a tube rupture event using the special element type Rupture element in BOSfluids. It covers the algorithm BOSfluids uses to model the
Ellis Y. Byeon, PE Bryan VanderGheynst, PE 1
 Ellis Y. Byeon, PE Bryan VanderGheynst, PE 1 Background Information: City of Trenton, Mercer County Assunpink Creek, Pond Run and Delaware River Lower 2.5 miles of the Assunpink Creek Lower 0.6 miles of
FEMA Region V. Great Lakes Coastal Flood Study. Pilot Study Webinar. Berrien County, Michigan. February 26, 2014
 FEMA Region V Great Lakes Coastal Flood Study Pilot Study Webinar Berrien County, Michigan February 26, 2014 2 Pilot Study Webinar Agenda Great Lakes Coastal Flood Study Background Demonstration Project
HISTORY OF CONSTRUCTION
 HISTORY OF CONSTRUCTION CFR 257.73(c)(1) West Boiler Slag Pond Clifty Creek Plant Madison, Indiana October, 2016 Prepared for: Indiana Kentucky Electric Corporation Prepared by: American Electric Power
A Review of the Bed Roughness Variable in MIKE 21 FLOW MODEL FM, Hydrodynamic (HD) and Sediment Transport (ST) modules
 and Sediment Transport (ST) modules") A Review of the Bed Roughness Variable in MIKE 1 FLOW MODEL FM, Hydrodynamic (HD) and Sediment Transport (ST) modules by David Lambkin, University of Southampton, UK 1 Bed roughness is considered a primary
A Review of the Bed Roughness Variable in MIKE 1 FLOW MODEL FM, Hydrodynamic (HD) and Sediment Transport (ST) modules by David Lambkin, University of Southampton, UK 1 Bed roughness is considered a primary
Door County, WI Coastal Hazard Analysis Flood Risk Review Meeting. August 21, 2017
 Door County, WI Coastal Hazard Analysis Flood Risk Review Meeting August 21, 2017 Agenda Introductions Coastal Flood Risk Study and Mapping Program Current Status Technical Overview of Study and Mapping