Merepoint Boat Launch Facility Eelgrass Mitigation Measures: 2012 Monitoring Report
|
|
|
- Arron Evans
- 5 years ago
- Views:
Transcription
1 : Prepared for Department of Inland Fisheries and Wildlife 284 State Street Augusta, ME by MER Assessment Corporation 14 Industrial Parkway Brunswick, Maine (V) (F) (C) 16 November 2012
2 Acknowledgement Aerial photography and assistance with geo-referencing of the aerial photographs was provided by John Sowles, Yarmouth, Maine and Jennifer Austin, GISP of Kleinschmidt, Pittsfield, Maine.
3 Contents Executive Summary... i Introduction... 1 Verification of eelgrass habitat recovery in the vicinity of individual replacement moorings... 3 Eelgrass habitat recovery in the vicinity of Simpsons Point landing area Diver survey and video recording.. 6 Aerial photography Discussion.. 20 Conclusions and recommendations References.. 25 Appendix I... I-1 Appendix II... II-1 Appendix III... III-1 List of Figures Figure 1 Location of Merepoint Boat Launch Facility, Merepoint, Brunswick, Maine.. 1 Figure 2 Completed Merepoint Boat Launch Facility at Merepoint, Brunswick, Maine (Google Earth image) Figure 3 Location of the six (6) moorings selected in 2008 (Google Earth image). 3 Figure 4 Thoroughfare between MER 15 and float Figure 5 Proximity of boat to MER Figure 6 Diver crossing through mooring scar adjacent to scar MER Figure 7 Video survey transect lines Figure 8 Botrylloides violaceus encrusting eelgrass.. 10 Figure 9 6 August 2012 aerial photo of Simpsons Point landing area Figure 10 Geo-referenced aerial photo of Simpsons Point landing area of August 6, 2012 aerial photo showing dive transects and upper eelgrass boundary delineation of 2011 and Figure August 2011 aerial photo of Simpsons Point landing area with video transects and eelgrass upper boundary delineations 2011 (light green) and 2008 (yellow) and 2011 diver-defined edge of meadow (purple) Figure aerial photo of Simpsons Point landing area with video transects and eelgrass upper boundary delineation Figure aerial photo of Simpsons Point landing area prior to boat landing closure Figure 14 DeLorme photo of Simpsons Point landing area in Figure 15 Rafting of broken eelgrass blades carrying Botrylloides violaceus
4 List of Tables Table 1 Comparison of the 2008, 2011 and 2012 estimated area for each measured mooring scar based on distance from center to defined eelgrass boundary Table 2 Video transect GPS coordinates, distances, and direction Table 3 GPS coordinates for the video delineation of the upper eelgrass boundary Table 4 GPS coordinates for the diver delineation eelgrass meadow boundary.. 11 Table 5 GPS coordinates for the video transects recorded at Merepoint Boat Launch Facility... 20
5 Executive Summary The Maine Department of Inland fisheries and Wildlife (IF&W) was issued a permit by the Maine Department of Environmental Protection (DEP) on April 13, 2007 to construct and install a boat launch facility at Merepoint, Brunswick, Maine, construction of which was completed in September The permit included several conditions for mitigation of possible impacts to eelgrass resulting from construction and operation of the facility. These included: 1) removal and relocation of traditional mushroom anchor-chain moorings within the project area to areas outside eelgrass habitat, 2) replacement of traditional mushroom anchor-chain moorings with eelgrass-friendly helical, or embedment, moorings, 3) the closing of the Simpsons Point boat launch ramp to motorized vessels to allow recovery of eelgrass adjacent to the ramp, and 4) the preparation of an Eelgrass Mitigation Opportunities Guide for Northern Casco Bay, reported separately in February This report summarizes the results of: 1) continuing monitoring of the eelgrass scars at 3 removed moorings and at 3 helical replacement moorings; 2) recovery of eelgrass habitat at Simpsons Point landing following closure of the launch ramp to motorized vessels; and 3) underwater diver video monitoring at the Merepoint Boat Launch Facility. MER Assessment Corporation (MER) conducted detailed in situ measurements and video documentation of the 6 mooring scars on August 8 and 9, Although delineation of some of the scars was straightforward, efforts to accurately delineate certain mooring scars were again, as in prior years, made difficult due to several factors, including eelgrass patchiness, proximity of adjacent boats on moorings, apparent loss of eelgrass between adjacent moorings, and thinning of eelgrass resulting in poor definition of habitat boundaries. This resulted in some scars showing expansion despite the moorings having been removed and no boat being present. Mooring scar MER 16 shows significant expansion due to the apparent loss of eelgrass between adjacent scars; this is clearly an anomaly since the mooring at MER 16 was removed in If the MER 16 scar is assumed to have no recovery or is eliminated for purposes of calculation, the percent reduction in scar is 4% of the original scar area (6,250 ft 2 ) and 5% of the desired recovery area of 5,400 ft 2. These results continue to indicate that recovery is slow. Aerial photography of the Simpsons Point area was conducted on August 6, Video recording and delineation of the eelgrass meadow at Simpsons Point was conducted on August 15 and 20, 2012 using the same methods as used in 2008 and Specifically, a SCUBA diver video recorded transects set within the eelgrass meadow to document eelgrass condition and locate the upper eelgrass boundary based on GPS coordinates. As in previous years, these efforts were confounded by poor visibility caused by the naturally turbid conditions encountered in the upper bay area and the sparseness and increased patchiness of eelgrass within the area that made clear delineation very difficult. Delineation based on video recordings indicates that the upper boundary of the eelgrass habitat in the vicinity of the landing has receded between 12 and 17 meters since Page i
6 The reduced shoot density and increase in barren area between eelgrass patches is not restricted to the boundary areas but was observed throughout the survey area. These observations corroborate the aerial photography of the area of August 6, 2012 which continues to show thinning of the eelgrass and expansion of barren areas within the meadow seen in 2011 compared to conditions seen in The slow rate of recovery, and in some cases expansion, of the scars seen in 2011 and again in 2012 at the mooring sites selected in 2008 for mooring removal or replacement is clearly unrelated to physical disturbance. Similarly, the general thinning and decline of the eelgrass at Simpsons Point since 2008 is unrelated to boat activity in the area since the Simpsons Point landing has been blocked to motorized vessels since Although several factors, including elevated turbidity and temperature, may be contributing to the lack of recovery and general decline of eelgrass in the area, the increased incidence of the invasive orange-sheathed tunicate, Botrylloides violaceus, found attached to, and in some cases encrusting, eelgrass blades is likely an important cause. In Maquoit Bay at MER 11, a helix replacement mooring, some incidence of the orange tunicate is evident, although the eelgrass is in generally healthy condition. However, at mooring scar MER 5, another helix replacement located in Merepoint Bay just north of the Merepoint Boat Launch Facility and just south of Paul s Marina, the infestation by Botrylloides violaceus is heavy and the condition of the eelgrass is generally poor in comparison to that observed in Maquoit Bay. All of the other monitored scars are also located in Merepoint Bay around Paul s Marina and show similar, and in some cases worse, eelgrass condition. Review of the video recordings taken at Simpsons Point shows that the tunicate is also present there throughout the meadow but appears to become less dense towards the middle of the meadow. These results indicate that the eelgrass habitat recovery rate will take longer than the initially estimated 5 years to achieve 80% recovery. Although several causes may play a role in this, the apparent recent expansion of infestation by the invasive tunicate Botrylloides violaceus is the suspected likely cause. In view of this, the need for additional remedial measures by IF&W does not seem warranted. As previously reported, much of the difficulty encountered with the 2012 survey, as in the 2011 survey, was related to the difficulty in determining the eelgrass boundary in patchy and sparse conditions. The development of a clear and measurable definition of an eelgrass boundary in such conditions is needed. Page ii


7 Introduction The Maine Department of Inland Fisheries and Wildlife (IF&W) was issued a permit approval for the development and installation of the Merepoint Boat Launch (MPBL) facility at Merepoint, Brunswick, Maine on April 13, The location of the MPBL is shown in Figures 1 and 2, below. Figure 1. Location of Merepoint Boat Launch Facility, Merepoint, Brunswick, Maine Source: NOAA/NOS Casco Bay chart 13290, 37 th Ed. Mar./07 Page 1
 at Merepoint, Brunswick, Maine (Google Earth image) Source: Google Earth Several")
 verification that moorings removed from the floats and access lanes were")
 delineation and assessment of the eelgrass habitat impacted by boat traffic at the existing Simpsons Point boat launch")
 assisted IF&W with these eelgrass impact mitigation efforts in 2007 and 2008, the results of which were")

8 Figure 2. Completed Merepoint Boat Launch Facility (center) at Merepoint, Brunswick, Maine (Google Earth image) Source: Google Earth Several conditions were applied to the permit pertaining to mitigation for impacts to eelgrass, Zostera marina, resulting from the installation and operation of the boat launch facility including: 1) verification that moorings removed from the floats and access lanes were relocated beyond the eelgrass habitat boundary; 2) replacement of traditional anchor-chain moorings with helical, or embedment, moorings, and 3) delineation and assessment of the eelgrass habitat impacted by boat traffic at the existing Simpsons Point boat launch at the head of Merepoint Bay. MER Assessment Corporation (MER) assisted IF&W with these eelgrass impact mitigation efforts in 2007 and 2008, the results of which were included in a report submitted to the Department on March 18, This report summarizes the results of continuing fieldwork performed in August 2012, based on the methods developed in 2007 and 2008, and used in 2011 to verify: 1) recovery of eelgrass habitat in the vicinity of individual removed or helix-replaced moorings; 2) recovery of eelgrass habitat in the Simpsons Point boat ramp area following closure to motorized vessels in 2008; and 3) underwater diver video monitoring at the Merepoint Boat Launch Facility. Page 2

9 Verification of eelgrass habitat recovery in the vicinity of individual replacement moorings Mooring scar measurements were made on August 8-9, 2012 around the six (6) moorings selected in 2008 for removal and either relocation of the mooring or replacement of the traditional mushroom/block-chain mooring with an embedment helix mooring. The location of the six moorings is shown in Figure 3. Figure 3. Location of the six (6) moorings selected in 2008 (Google Earth image) Detailed in situ measurements of the scar area around each mooring were made by a SCUBA diver using the same method developed in 2008 and used again in 2011 (MER, 2011a; 2011b). Accordingly, measurements of the scars were made along eight cardinal directions, i.e. N, NE, E, SE, S, SW, W, NW, by attaching a plastic measuring tape to the permanent or Page 3


10 temporary (MER-placed based on GPS coordinates) mooring, stretching the tape to the first evidence of eelgrass boundary, and reading the distance; where no mooring exists, a red-tipped section of 1¼ in. PVC pipe was driven into the bottom to mark the center. Each segment was video recorded while the measuring tape was still in place to visually document the measurement and provide evidence of the scar condition along each segment; the diver s compass was also recorded to show the direction in which the measurement was made. The video recordings were made using an Amphibico VHHCEL57/Sony HDR-HC9 high definition digital video camera package on high definition (HDV) format tapes. When used, lighting was provided by an Amphibico VLDIG3AL 35W/50W switchable underwater arc lamp. All videos were uploaded to a Panasonic DMR-T3040 DVD Video Recorder using a Sony GV-HD700 Digital HD Videocassette Recorder for review and analysis and for producing DVD copies of the videos. DVD-R copies of the videos recorded at each mooring accompany this report. As reported in 2011, measurement of certain scars was relatively straightforward where eelgrass boundaries encircling the scar are clearly defined; however, measurement of the scar area associated with other moorings was again rendered difficult to measure where eelgrass boundaries are poorly defined due to patchy and/or sporadic eelgrass, particularly in the cases of former mooring locations MER 15, MER 16 and MER17. These moorings are in shallow water and in close proximity to the service floats and access thoroughfare of Paul s Marina (Figure 4); these moorings are also in close proximity of adjacent moorings and boats (see Figure 5). Figure 4. Thoroughfare between MER 15 and float Figure 5. Proximity of boat to MER 16 As in all previous monitoring efforts, the area of eight triangles (each with side lengths A, B and C and semi-perimeter s ) was calculated using the equation: Area = (s (s-a) (s-b) (s-c)) -2 where C = (A 2 + B 2 2(A B) ) -2 and s = (A+B+C)/2; Note: = cosine 45⁰ The individual areas of all eight triangles defining a scar were summed to yield the full scar area. Page 4
11 A comparison of the 2008, 2011 and 2012 estimated area for each measured mooring scar based on distance from the center of the scar to a defined eelgrass boundary is shown in Table 1; the area calculations for the 2012 scars are included as Appendix I. The % Scar reduction represents change between the 2008 baseline calculated area and the area calculated for 2012; the 2011 calculated areas are presented for comparison of change over time. Calculations for the 2008 baseline and 2011 monitoring event scar areas are included as Appendix II; graphic comparisons of the 2008 and 2012 scar areas are included in Appendix III. Table 1. Comparison of the 2008, 2011 and 2012 estimated area for each measured mooring scar based on distance from center to the defined eelgrass boundary MER Mooring # Owner Lat. (N) Coordinates Long. (W) 2008 Postreplacement Measured scar area (ft 2 ) 2011 Monitoring Measured scar area (ft 2 ) 2012 Monitoring Measured scar area (ft 2 ) % Scar reduction MER 5 Jim Dodd º º % MER 15 Doc Higgins º º % MER 17 Morin º º % MER 16 David Bean º º % MER 11 Sean White º º % MER 18 Bill Moore º º % % Although some patchy growth appears to be occurring within some of the scars, in most cases the scars show little to moderate reduction in area and in some cases enlargement of the area, particularly in the case of MER 16, yielding a net expansion of scar area of approximately 34%. It is important to note, however, that during measurement of the southeastern leg of scar MER 16, it was discovered that the scar from an adjacent, actively-used mooring (shown in Figure 6) seems to have merged with MER 16. The patchy, poorly-defined eelgrass boundaries in this area make it impossible to separate the scars of the active mooring from that of MER 16. Similar patchy, poorly-defined boundaries occurred along the eastern, southwestern and western legs (see Appendix III). Consequently, inclusion of the MER 16 scar confounds calculation of total scar area resulting in a net loss of eelgrass. To correct this, if the MER 16 scar is assumed to have no recovery or is eliminated for purposes of calculation, the percent reduction in scar is 4% of original area (6,250 ft 2 ) and 5% of the desired recovery area of 5,400 ft 2. Mooring scar MER 5 had been measured at 99 ft 2 in 2011 suggesting substantial recovery of eelgrass within the scar, but it was noted that this might be attributable to location discrepancies between the GPS coordinates for the mooring used by MER in 2011 and the actual helix position. In 2012 the actual helix position was used since the helix was reportedly installed in the previous mooring location. Scar measurements for MER 5 in 2012 yield a similar configuration as those of the 2008 baseline, albeit shorter, and the calculated scar area shows a 27% reduction in scar area; it is interesting to note that mooring MER 5 is in very shallow water which might explain the level of recovery observed. Page 5

12 Scars were generally found to be devoid of eelgrass with the exception of occasional individual shoots and patches; the exposed bottom is generally covered by a layer of brown epilithic diatoms and some eelgrass detritus. Eelgrass at the scar boundary and elsewhere in the surrounding area was found to be encrusted to varying extents with the invasive tunicates, Botrylloides violaceus, including the violet and/or orange variant, and the pancake tunicate, Didemnum vexillum. The possible implications of the occurrence of these tunicates are discussed later. Figure 6. Diver crossing through mooring scar adjacent to scar MER 16 Eelgrass habitat recovery in the vicinity of Simpsons Point landing area Video recordings within the area west of the stone pier adjacent to the Simpsons Point boat landing were made on August 15 and 20, 2012 following the same method and transect start and end points used in 2008 and DVD copies of the videos accompany this report. Diver survey and video recording Transect lines used for the video recording in 2012 consisted of 100m (330 ) and 60 meter (~200 ) ropes marked in 10m alternating black and white sections, with the exception of the first and last 10m, each of which are marked as two 5m sections, the last of which is marked in alternating 1m black and white increments; an example of a 60m line is shown in Figure 7. Figure 7. Video survey transect lines Page 6
13 To adequately cover the eelgrass meadow in the vicinity of the Simpsons Point landing and remnant stone pier, one 100m (330 ft) transect line and one 60m (200 ft) transect line were clipped together using stainless steel snap clips to form 160m (530 ft) transect lines; these were anchored with a 20 lb. mushroom anchor at the start and a yellow-painted window weight at the end. Transects were set parallel to shore (perpendicular to the remnant stone pier) at various distances from the low water mark to cover the study area (T1, T2, T3 and T4); one transect was recorded along the western side of the stone pier (T5). Transects were also set perpendicular to the shore to capture the upper boundary of the eelgrass habitat (T6, T7 and T8). GPS coordinates for the start and end of all transects were recorded using an on-board Garmin 4208 GPS/Sonar unit using 12 channels and WAAS-correction to ± 3m. Table 2 lists the start and end coordinates for each transect and the distance and direction of each video recording dive. Table 2. Video transect GPS coordinates, distances, and direction Start End Location Lat. (N) Long. (W) Lat. (N) Long. (W) Distance (m) Distance (ft) Direction (True) Transect 1 (T1) º º º º Transect 2 (T2) º º º º Transect 3 (T3) º º º º Transect 4 (T4) º º º º Transect 5 (T5) º º º º Transect 6 (T6) º º º º Transect 7 (T7) º º º º Transect 8 (T8) º º º º The video recordings were made using an Amphibico VHHCEL57/Sony HDR-HC9 high definition digital video camera package on high definition (HDV) format tapes. Lighting is provided by an Amphibico VLDIG3AL 35W/50W underwater arc lamp. All videos were uploaded to a Panasonic DMR-T3040 DVD Video Recorder using a Sony GV-HD700 Digital HD Videocassette Recorder for review and analysis. DVD copies of the videos were made. The video recordings were reviewed to establish points along the transects where the eelgrass habitat began and/or ended, as well as to detect any obvious changes in the eelgrass since the previous recordings of 2008 and At the upper, shoreside boundary of the eelgrass bed, where practical, geographic positions for the start and end of eelgrass were calculated based on the start and end points for the transects, the distance along the transect at which eelgrass either started or ended (based on swim direction and rate), and the course direction (True) of the dive. These data were used as input to POSAID (ver. 2.1) to calculate the latitude and longitude of the geographic points. Water clarity during the 2012 video survey was generally poor, although better in the deeper areas, but very poor in the nearshore area. As previously reported, this is due to the very soft surface sediments in the vicinity of Simpsons Point that are subject to easy disturbance resulting in elevated turbidity that quickly reduces visibility to near zero at the start of the transect, particularly in the shallowest areas nearshore. Several swimmers were seen in the Page 7


14 shallow, nearshore area on both survey dates and their activity may have contributed to the increased turbidity. In 2011 we reported a substantial thinning of the eelgrass and increase in patchiness between 2008 and The 2012 video survey shows a continuation of the thinning and patchiness of the meadow within the area, particularly at the eastern end of Transects 1 through 4, adjacent to the stone pier, and at the western end. Eelgrass was generally lush and dense in 2008 with relatively few interruptions or gaps and blades were long, at times entangling the diver. In both 2011 and 2012 eelgrass density appeared substantially thinner with patches of eelgrass separated by large gaps, some gaps extending for several meters and often covered by a layer of brown epilithic diatom growth, eelgrass detritus and snails, likely Nassarius obsoletus. The increased level of thinning and patchiness observed in 2012 was most obvious at the periphery of the meadow and in the outer, deeper sections although these were seen throughout the entire meadow area covered by the survey; the densest areas of eelgrass were seen in the center and shallower areas of the meadow. These observations corroborate the aerial photo images that show similar changes (see Aerial Photography section). Still capture images taken from the videos at the 60m mark (this distance chosen arbitrarily) from the video recordings of Transects 1, 2, 3, and 4 of 2012, 2011 and 2008 are shown side-by-side in the series below for comparative purposes. Transect 1 at 60m mark in 2012 Transect 1 at 60m mark in 2011 Transect 1 at 60m mark in 2008 Page 8


15 Transect 2 at 60m mark in 2012 Transect 2 at 60m mark in 2011 Transect 2 at 60m mark in 2008 Transect 3 at 60m mark in 2012 Transect 3 at 60m mark in 2011 Transect 3 at 60m mark in 2008 Page 9


16 Transect 4 at 60m mark in 2012 Transect 4 at 60m mark in 2011 Transect 4 at 60m mark in 2008 During the video recording in 2008 and 2012 the camera was carried somewhat closer to the bottom than during the 2011 recordings. Nevertheless, the 2008 images consistently show eelgrass while in 2011 only Transect 2 shows any substantive eelgrass, and in 2012 only Transects 2 and 3 show any substantive eelgrass; the images from the other transects show only a few plants or none at all. As observed elsewhere during the mooring scar survey, the incidence of the invasive tunicate, Botrylloides violaceus, shown in Figure 8 below, was substantially greater in 2012 at Simpsons Point than previously observed. The potential implications of this are discussed later. Figure 8. Botrylloides violaceus encrusting eelgrass Page 10
17 As on all previous occasions the delineation of the upper boundary of the eelgrass in the shallows was complicated, first, by elevated turbidity that limited the field of view and second, by the sparse nature of the eelgrass. Video delineation of the upper boundary was based on first observation of significant eelgrass (not isolated shoots) on the video recordings of Transect 6, 7, and 8; these points are listed in Table 3 and are very similar to those recorded in Table 3. GPS coordinates for the video delineation of the upper eelgrass boundary Location Lat. (N) Long. (W) T º º T º º T º º Using the same procedure as used in 2008 and 2011, GPS coordinates were also recorded for individual diver-set points to define the upper eelgrass meadow edge by having the diver mark the edge of the meadow at intervals using pins with attached small buoys; the interval distance between points was reduced in 2012 resulting in a substantially larger number of points. Coordinates were collected by placing the boat directly over the point and recording the latitude and longitude; these are listed in Table 4 and are shown in the geo-referenced aerial photo shown in Figure 10. Table 4. GPS coordinates for the diver delineation of the eelgrass meadow edge Lat. (N) Long. (W) ⁰ ⁰ ⁰ ⁰ ⁰ ⁰ ⁰ ⁰ ⁰ ⁰ ⁰ ⁰ ⁰ ⁰ ⁰ ⁰ ⁰ ⁰ ⁰ ⁰ ⁰ ⁰ ⁰ ⁰ ⁰ ⁰ ⁰ ⁰ ⁰ ⁰ ⁰ ⁰ ⁰ ⁰ ⁰ ⁰ ⁰ ⁰ ⁰ ⁰ ⁰ ⁰ Page 11
18 Table 4. GPS coordinates for the diver delineation of the eelgrass meadow edge (Continued) Lat. (N) Long. (W) ⁰ ⁰ ⁰ ⁰ ⁰ ⁰ ⁰ ⁰ ⁰ ⁰ ⁰ ⁰ ⁰ ⁰ ⁰ ⁰ ⁰ ⁰ ⁰ ⁰ ⁰ ⁰ ⁰ ⁰ ⁰ ⁰ ⁰ ⁰ ⁰ ⁰ ⁰ ⁰ ************ Intentionally blank Page 12
19 Aerial photography Aerial photos were taken of the Simpsons Point landing area between 0735 and 0805 on August 4, 2012 with low water of -0.8 feet at 0718, and on August 6, 2012 at 0818 with low tide of 0.0 feet at Conditions during flight were clear with little or no wind. A slight vibration caused a slight blurring of the August 4, 2012 photos and the August 6, 2012 photo was therefore selected for use. The 2012 aerial photo and those previously taken in 2007 through 2011 are shown in the figures below for comparative purposes. Figure 9 shows an aerial photo taken August 6, 2012 of the broader Simpsons Point landing area. Figure 10 shows a geo-referenced detail of the photo taken August 6, 2012 of the Simpson Point landing area and includes the geo-referenced video transects and upper eelgrass boundary delineation. Figure 11 shows the August 31, 2011 aerial photo of the area and includes the geo-referenced video transects, upper eelgrass boundary based on the video review, and the boundary of the eelgrass meadow based on the diver delineation GPS points. Figure 12 shows the September 2008 aerial photo of the same area along with the geo-referenced video transects and diver-delineated upper boundary of the eelgrass for that year. Figure 13 shows the same area in 2007 prior to the closing of the boat landing to motorized vessels. Comparison of these photos clearly shows a decline in the density of eelgrass within the area over the time period 2007 through 2012; these aerial observations are corroborated by the video recordings over the period 2008 through The most obvious change is in the apparent decrease in eelgrass density and the expansion of barren sediment areas between the eelgrass patches. Although barren areas existed within the meadow in 2008, these were generally small however, over the period these have increased in number as well as size. Figure 14 is a screenshot image of low tide photography taken by DeLorme in 2003 and available on the Maine office of GIS website at: The DeLorme photo appears colorenhanced to highlight the vegetation; however, the photo clearly shows the extent and density of the eelgrass coverage in that year, both to the east and west of the old stone pier, and serves to highlight the extent to which eelgrass in the area has declined over time. ************ Intentionally blank Page 13

20 Figure 9. August 6, 2012 aerial photo of Simpsons Point landing area Page 14

21 Figure 10. Geo-referenced aerial photo of Simpsons Point landing area of August 6, 2012 aerial photo showing dive transects and upper eelgrass boundary delineation of 2011 and Page 15

22 Figure 11. August 31, 2011 aerial photo of Simpsons Point landing area with video transects and eelgrass upper boundary delineations 2011 (light green) and 2008 (yellow) and 2011 diver-defined edge of meadow (purple) Source: John Sowles/Google Earth Page 16

23 Figure aerial photo of Simpsons Point landing area with video transects and eelgrass upper boundary delineation Source: John Sowles/Google Earth Page 17

24 Figure aerial photo of Simpsons Point landing area prior to boat landing closure Source: John Sowles/Google Earth Page 18

25 Figure 14. DeLorme photo of Simpsons Point landing area in 2003 Source: Maine Office of GIS Page 19
26 Eelgrass monitoring at Merepoint Boat Launch Facility Four video recordings were made on August 9, 2012 at the Merepoint Boat Launch Facility, two 60m transects having been recorded parallel to the float system on both the north and south sides beginning at the discernible end of the concrete ramps and extending approximately 30m to 35m beyond the end of the floats, using the same methods and equipment described above. GPS coordinates for the start and end of each transect are listed in Table 5, below. Table 5. GPS coordinates for the video transects recorded at Merepoint Boat Launch Facility Start End Location Lat. (N) Long. (W) Lat. (N) Long. (W) V º º º º V º º º º V º º º º V º º º º Eelgrass detritus was found covering the bottom from the end of the ramps to several meters out along the transects. The bottom beyond the end of the detritus covered bottom was generally barren with epilithic diatom growth on the surface. Little or no eelgrass was recorded along each of the transects; observed eelgrass was in the form of individual plants with one to few shoots. Some individual upright blades on the video appear to be attached shoots, but are actually separated blades. Other organisms observed include sea stars, Asterias sp., green crabs, Carcinus maenas, rock crab, Cancer irroratus, hermit crabs, likely Pagurus longicarpus; and the invasive tunicate, Botrylloides violaceus, was seen encrusted on the eelgrass detritus. Discussion Patchy, ill-defined boundaries around the mooring scars rendered scar measurements difficult, particularly in the case of the scar at MER 16. Including scar MER 16 in the scar measurements, the 2012 survey indicates a net loss of 2,144 ft 2 of eelgrass habitat or 34% additional loss of habitat since However, the enlarged scar at MER 16 is clearly an anomaly and omitting it from the calculations, thus assuming no recovery of the scar, yields a net recovery of 256 ft 2 or 4% of the original scarred area. The 2012 results indicate that recovery is slow, as previously found by others working on scar recoveries in the area (Neckles et al., 2005). In both 2012 and 2011, although actual mooring occupancy is unclear, none of the moorings surveyed were occupied at the time of the survey and in three cases the moorings no longer exist. Therefore, where expansion of the scar areas occurs, it is unlikely attributable to mooring effects and it again appears that some other factor, or factors, are contributing to the continued thinning and loss of eelgrass around the scars and the broader area. Eelgrass in the vicinity of the Simpsons Point landing has declined significantly since the 2008 baseline in extent, density, and overall health of the meadow. The Simpsons Point landing has been blocked to motorized boats since 2008 to avoid any negative impacts to eelgrass associated with the launching, hauling and operation of such boats. Given the cessation of motorized boat traffic, the general thinning of the eelgrass and increased barren areas between Page 20
27 clusters within the meadow at Simpsons Point, as revealed by the underwater video and aerial photography in both 2011 and 2012, appear unrelated to boat activity and are likely also related to some other factor, or factors. Changes in density and distribution within eelgrass beds are not uncommon; declines are related to both natural and anthropogenic causes. Common causes of declines in eelgrass habitat are physical disturbance that results in damage or uprooting of plants, including those related to storms, moorings and dredging and scouring by ice; shading caused by physical structures such as floats; elevated turbidity caused by physical disturbance to the bottom in adjacent areas; excessive epiphytic and phytoplankton growth usually related to elevated nutrients associated with land-use, e.g. agriculture, and waste water treatment effluents; and natural factors including disease (wasting), grazing, and self-poisoning (Robertson, 1984; Frederiksen et al., 2004). Costello and Kenworthy (2009) have reported widespread declines of eelgrass habitat in Massachusetts. Orth et al. (2006) discuss the broader impacts to sea grasses related to global climate change, including rising sea surface temperature. Several of these common causes of decline are unlikely to be causal effects in the minimal recovery of mooring scar area and the decline of the eelgrass meadow at Simpsons Point. In the case of the moorings, the moorings have either been completely removed or replaced with more eelgrass-friendly helical anchors, thus removing the physical disturbance to the bottom. As noted in the 2011 report, the shading effect of a boat occupying a mooring might cause sufficient shading to reduce eelgrass growth and density within the immediate area of the mooring. However, in the case of the moorings surveyed here, in three cases the moorings have been removed and in the other three cases the moorings have been found unoccupied at the time of the surveys. It therefore seems reasonable to assume that shading is not a new major contributor to decline, particularly where no mooring exists. With regard to elevated nutrients, no waste water treatment facility exists in the area and, as pointed out in the 2011 report, the Town of Brunswick enacted ordinances in the early 1990s to control excessive transport of nutrients into its coastal waters. It therefore seems unlikely that local nutrient loading, leading to excessive epiphyte growth, is involved. However, although growth of epiphytes does not appear to be problematic, the recent increase in the level of infestation and encrustation of eelgrass by the invasive tunicate Botrylloides violaceus may prove to be an important factor driving the general decline of eelgrass within the area. The occurrence and effects of invasive tunicate encrustation on eelgrass have been reported by Carman et al. (2009; 2010) working on Martha s Vineyard, Massachusetts and Block Island, Rhode Island and Wong, et al. (2012) working in Nova Scotia. B. violaceus was observed in both studies along with other invasive tunicate species, including the cream-colored pancake batter tunicate, Didemnum vexillum (Carman et al., 2010). Wong et al (2010) found that even minimal amounts of tunicate growth can substantially affect light attenuation by eelgrass blades; at high biomass of tunicate (>0.5 dry mg/cm 2 ) attenuation can reach 85-95% of incident light reaching the blade. This attenuation of light reaching the blades results in reduced photosynthesis and growth and in physical effects likely resulting in blades breaking away, eventually leading to reduced number of leaves per shoot, shoot length and shoot density within the bed. Additionally, the breaking away of blades carrying encrusted tunicates can serve as a Page 21
.")
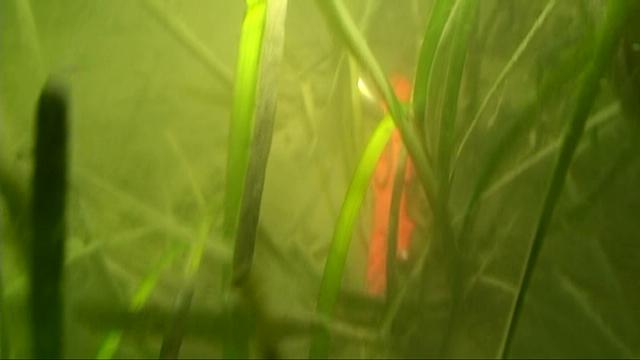
28 transport mechanism to infest other areas. Indeed, during the mooring scar survey, rafts of floating eelgrass were observed with a high percentage of the blades carrying at least some level of tunicate (see Figure 15). Some of the blades are clearly encrusted. Careful examination of this photo reveals that most of the blades are carrying some level of tunicate colonies. Infestation of eelgrass by B. violaceus has also been reported elsewhere in Casco Bay including the mouth of the Royal River (Steve Walker, Department of Inland Fisheries and Wildlife/Brunswick resident, pers. comm.). Figure 15. Rafting of broken eelgrass blades carrying Botrylloides violaceus Elevated turbidity appears to be a normal condition in the Simpsons Point area based on observations in 2008, 2011 and The soft sediments are easily disturbed and even small wind-generated waves can stir up the sediment, particularly in the shallower areas. The decline in eelgrass density within the bed, however, may lead to yet greater turbidity in the area as the sediment-stabilizing effect of eelgrass declines. Additionally, although motorized boat traffic has been eliminated from the landing, non-motorized boating activity and swimming does occur. During the diver video surveys in 2011 and 2012, swimmers and kayakers were observed in the area and using the landing. These activities were generally restricted to the nearshore area and are unlikely contributing to the larger area eelgrass decline; however, this activity may be contributing to some recession of eelgrass at the upper, nearshore boundary, since footprints along the bottom within the upper boundary of the eelgrass were reported by the diver. Page 22
29 Water temperature may also play a role, either directly or indirectly, in eelgrass decline in the area. Warmer than normal sea surface temperatures were recorded by MER early in the spring of 2012 and Friends of Casco Bay have reported similar trends within the Bay (pers. comm.). Additionally, in 2012 the NOAA Northeast Fisheries Science Center reported the warmest sea surface temperatures ever recorded for the Northeast Continental Shelf (NOAA, 2012). Since the cause of the slow recovery of the mooring scars and the general decline of the eelgrass meadow at Simpsons Point appear to be related, at least in part, to the tunicate infestation, the need for additional remedial measures by IF&W does not seem warranted. In our 2011 report we suggested that colonization of the scars might be accelerated by efforts to increase seed propagation within the scar area (Pickerell et al., 2005) or transplanting eelgrass shoots into the scars (Short, 2002). However, in view of the continued lack of recovery within the mooring scar areas and the decline of eelgrass in the vicinity of Simpsons Point resulting from causes apparently beyond immediate control, such efforts would likely prove futile and therefore are probably not advisable until the causes of decline are more definitively identified and better understood. Finally, as previously noted in our 2011 report, most of the difficulties encountered with the 2012 survey were again related to the difficulty in determining the eelgrass boundary where patchy and sparse eelgrass result in an ill-defined eelgrass boundary leading to increasingly subjective determinations of such boundaries. We therefore reiterate the importance of developing a clear and measurable definition of an eelgrass boundary in such conditions since such a definition is critical to properly quantifying area. Conclusions and recommendations The results of the mooring scar measurement work indicate that the eelgrass habitat recovery rate will take longer than the initially estimated 5 years to achieve 80% recovery. The rate of recovery is slow in nearly all cases, and although several causes may play a role in this, the apparent recent expansion of infestation by the invasive tunicate Botrylloides violaceus is likely suspect cause. Thinning and general decline of the eelgrass within the immediate vicinity of the Simpsons Point landing appears to be continuing and the upper boundary of the eelgrass meadow remains receded from the 2008 boundary. Although increases and decreases in eelgrass density and distribution occur periodically as a result of natural and anthropogenic causes, the observed decline in eelgrass is clearly unrelated to motorized boat traffic since the landing has been blocked to motor vessel launching since September Similar to the lack of recovery of the mooring scars, the decline of eelgrass at Simpsons Point is probably the result of a combination of causes, but the infestation by the invasive tunicate B. violaceus is likely an important cause. Although, as suggested in the 2011 report, measures are available that might enhance the rate of recovery, in view of the limited recovery observed within the mooring scar areas over the past four years and the apparent continuing decline of eelgrass in the vicinity of Simpsons Point, implementation of such efforts would likely prove futile and therefore not advisable. Page 23
30 Aerial photography proved very useful in providing a broader view of conditions surrounding Simpsons Point, offering a comparison of changes in those conditions between 2008, 2011 and 2012; its continued use to provide a broader context for changing conditions around the Simpsons Point landing should be considered. Finally, as reported for the 2011 survey, most of the difficulties encountered with the 2012 survey were related to the difficulty in determining the eelgrass boundary where eelgrass is patchy and sparse, particularly when compounded by turbid conditions and reduced visibility. Therefore, the need remains for the development of a clear and measurable definition of an eelgrass boundary in such conditions, particularly where quantifying area. Page 24
31 References Carman M.R. and D.W. Grunden, First occurrence of the invasive tunicate Didemnum vexillum in eelgrass habitat. Aquatic Invasions (2010) Volume 5, Issue 1: Proceedings of the 16th International Conference on Aquatic Invasive Species (19-23 April 2009, Montreal, Canada) Carman M.R. and K.E. Hoagland, E. Green-Beach and D.W. Grunden, Tunicate faunas of two North Atlantic-New England islands: Martha s Vineyard, Massachusetts and Block Island, Rhode Island. Aquatic Invasions (2009) Volume 4, Issue 1: Proceedings of the 2nd International Invasive Sea Squirt Conference (October 2-4, 2007, Prince Edward Island, Canada) Costello, C.T. and W.J. Kenworthy, Twelve-Year Mapping and Change Analysis of Eelgrass (Zostera marina) Areal Abundance in Massachusetts (USA) Identifies Statewide Declines. Estuaries and Coasts, Volume 34, Issue 2: MER, 2011a. : Detailed Methods and Results Report. Report prepared for the Maine Department of Inland Fisheries and Wildlife, March, 2011, 51pp. MER, 2011b. : 2011 Monitoring Report. Report prepared for the Maine Department of Inland Fisheries and Wildlife, December, 2011, 27pp. Neckles, H.A., F.T. Short, S. Barker, and B.S. Kopp, Disturbance of eelgrass Zostera marina by commercial mussel Mytilus edulis harvesting in Maine: dragging impacts and habitat recovery. Mar. Ecol. Prog. Ser. 285: NOAA, Orth R.J., T.J. B. Carruthers, W.C. Dennison, C.M. Duarte, J.W. Fourquerean, K.L. Heck, JR., A. R. Hughes, G.A. Kendrick, W. J. Kenworthy, S. Olyarnik, F.T. Short, M. Waycott, and S.L. Williams, (2006). A Global Crisis for Seagrass Ecosystems, BioScience, Vol. 56 No. 12, Pickerell, C.H., S. Schott, Sandy Wyllie-Echeverria, Buoy deployed seeding: Demonstration of a new eelgrass (Zostera marina L.) planting method. Ecol. Eng. 25: Robertson AI, Mann KH, Disturbance by ice and life-history adaptations of the seagrass Zostera marina. Mar Biol 80: Short, F.T., C.A. Short, and C.L. Burdick-Whitney, A Manual for Community-Based Eelgrass Restoration. Jackson Estuarine Laboratory, University of New Hampshire, Durham, New Hampshire, 56pp. Wong, M.C. and B. Vercaemer, Effects of invasive colonial tunicates and a native sponge on the growth, survival, and light attenuation of eelgrass (Zostera marina). Aquatic Invasions (2012) Volume 7, Issue 3: Page 25
32 Appendix I 2012 detailed calculations of the 2008 selected mooring scars area based on the eight in situ radii measurement method Appendix I-1
33 2012 Scar area calculation based on two known side lengths and 45º angle at center MER 11 Sean White MQ156 Triangle A B C s Area Mean r Mean r area 1210 MER 18 Bill Moore MP001 Triangle A B C s Area Mean r Mean r area 695 MER 5 Jim Dodd M55/MP030 Triangle A B C s Area Mean r Mean r area 322 Appendix I-2
34 Scar area calculation based on two known side lengths and 45º angle at center MER 15 Doc Higgins M14/MPxxx Triangle A B C s Area Mean r Mean r area 1304 MER 17 Morin M13/MPxxx Triangle A B C s Area Mean r Mean r area 1590 MER 16 David Bean M25/MPxxx Triangle A B C s Area Mean r Mean r area 4536 Appendix I-3
35 Appendix II Detailed calculations of each traditional mooring scars area in 2008 following replacement with helix anchor or relocation based on the eight in situ radii measurement method Appendix II-1
36 2008 Scar area calculation based on two known side lengths and 45º angle at center MER 11 Sean White MQ Pre-estimate Triangle A B C s Area Mean r Post-estimate Mean r area 1090 MER 18 Bill Moore MP Pre-estimate Triangle A B C s Area Mean r Post-estimate Mean r area 855 MER 5 Jim Dodd M55/MP Pre-estimate Triangle A B C s Area Mean r Post-estimate Mean r area 448 Appendix II-2
37 Scar area calculation based on two known side lengths and 45º angle at center MER 15 Doc Higgins M14/MPxxx 1134 Pre-estimate Triangle A B C s Area Mean r Post-estimate Mean r area 1257 MER 17 Morin M13/MPxxx 1336 Pre-estimate Triangle A B C s Area Mean r Post-estimate Mean r area 1847 MER 16 David Bean M25/MPxxx 672 Pre-estimate Triangle A B C s Area Mean r Post-estimate Mean r area 1402 Appendix II-3
38 Scar area calculation based on two known side lengths and 45º angle at center 2011 Full MER 5 Jim Dodd M55/MP030 Helix Triangle A B C s Area Mean r estimate 390 Mean r area 71 75% MER 15 Doc Higgins M14/MPxxx Removed Triangle A B C s Area Mean r estimate 1193 Mean r area % MER 17 Morin M13/MPxxx Removed Triangle A B C s Area Mean r estimate 1633 Mean r area % Appendix II-4
39 Scar area calculation based on two known side lengths and 45º angle at center 2011 Full MER 16 David Bean M25/MPxxx Removed Triangle A B C s Area Mean r estimate 1202 Mean r area % MER 11 Sean White MQ156 Helix Triangle A B C s Area Mean r estimate 1070 Mean r area % MER 18 Bill Moore MP001 Helix Triangle A B C s Area Mean r estimate 762 Mean r area % Appendix II-5
40 Appendix III Graphic representations showing 2008 and 2012 mooring scars area based on eight in situ radii measurements November 16, 2011 Appendix III-1
41 November 16, 2011 Appendix III-2

42 November 16, 2011 Appendix III-3

43 November 16, 2011 Appendix III-4

44 November 16, 2011 Appendix III-1

45 November 16, 2011 Appendix III-1

46 November 16, 2011 Appendix III-2
Use of Conservation Moorings as a Component of Eelgrass Restoration in two Massachusetts Harbors
 Use of Conservation Moorings as a Component of Eelgrass Restoration in two Massachusetts Harbors Massachusetts Bays Program Division of Marine Fisheries Jay Baker, Tay Evans, Mass Bays Program MarineFisheries
Restoration of Eelgrass to Upper Casco Bay: Feasibility Tests in Hilary A. Neckles US Geological Survey Augusta, ME
 Restoration of Eelgrass to Upper Casco Bay: Feasibility Tests in 2015 Hilary A. Neckles US Geological Survey Augusta, ME hneckles@usgs.gov Robert J. Orth Eelgrass: Zostera marina * marine flowering plant
Video-Based Mapping of Oyster Bottom in the Upper Piscataqua River, Sturgeon Creek, and Spruce Creek
 University of New Hampshire University of New Hampshire Scholars' Repository PREP Reports & Publications Institute for the Study of Earth, Oceans, and Space (EOS) 1-21-2009 Video-Based Mapping of Oyster
Florida Seagrass Integrated Mapping and Monitoring Program
 Florida Seagrass Integrated Mapping and Monitoring Program - 2004 The following document is composed of excerpts taken from the 2011 publication, Seagrass Integrated Mapping and Monitoring for the State
Casco Bay Intensified PSP Sampling Project
 Casco Bay Intensified PSP Sampling Project conducted by MER Corp. in cooperation with the Maine DMR with funding from the Casco Bay Estuary Partnership October 16, 2006 Problems: 1. Limited number of routine
Eelgrass Survey Reporting Form 2222 Channel Road Newport Beach, CA Eelgrass (Zostera marina) Survey
 Survey") Eelgrass Survey Reporting Form 2222 Channel Road Newport Beach, CA 92660 Eelgrass (Zostera marina) Survey Survey Date: July 19th, 2013 Report Date: July 26 th, 2013 Prepared by: Coastal Resources Management,
Eelgrass Survey Reporting Form 2222 Channel Road Newport Beach, CA 92660 Eelgrass (Zostera marina) Survey Survey Date: July 19th, 2013 Report Date: July 26 th, 2013 Prepared by: Coastal Resources Management,
Nearshore Habitat Mapping in Puget Sound Using Side Scan Sonar and Underwater Video
 Nearshore Habitat Mapping in Puget Sound Using Side Scan Sonar and Underwater Video Dana Woodruff, Paul Farley, Amy Borde, John Southard, Ron Thom Battelle Marine Sciences Laboratory Jim Norris Marine
BASELINE SURVEY, VISUAL - SITE SPECIFIC
 BASELINE SURVEY, VISUAL - SITE SPECIFIC Introduction As stated in SEPA s policy and in the Fish Farm Manual (1998), scientific data are required by SEPA in order to assess the existing condition on the
Department of Marine Resources Site Review #
 Department of Marine Resources Site Review #2017-11 Taunton Bay Oyster Company, Inc. P.O. Box 613 Ellsworth, ME 04605 207-266-3353 Figure 1: Vicinity map 1 Location: Taunton Bay, Town of Hancock, Hancock
Friends of Semiahmoo Bay Society Eelgrass Transplant Pilot Project May 6, 2007, Blackie Spit, Surrey, BC.
 Friends of Semiahmoo Bay Society Eelgrass Transplant Pilot Project May 6, 2007, Blackie Spit, Surrey, BC. Prepared for: Friends of Semiahmoo Bay Society Prepared by: Ramona C. de Graaf, BSc., MSc., Emerald
STATE OF MAINE DEPARTMENT OF MARINE RESOURCES
 STATE OF MAINE DEPARTMENT OF MARINE RESOURCES IN THE MATTER OF THE APPLICATION OF GREAT ) EASTERN MUSSEL FARMS FOR AN AQUACULTURE ) FINDINGS OF FACT, LEASE LOCATED OFF OF HADLEY POINT IN THE ) CONCLUSIONS
Oyster Bed Mapping in the Great Bay Estuary,
 University of New Hampshire University of New Hampshire Scholars' Repository PREP Reports & Publications Institute for the Study of Earth, Oceans, and Space (EOS) 6-26-2013 Oyster Bed Mapping in the Great
SEAGRASS MAPPING FOR THE PENRHYN ESTUARY HABITAT ENHANCEMENT PLAN
 SEAGRASS MAPPING FOR THE PENRHYN ESTUARY HABITAT ENHANCEMENT PLAN PREPARED FOR SYDNEY PORTS CORPORATION By D. E. Roberts, S. R. Murray, G. R., Sainty August 2008 TABLE OF CONTENTS INTRODUCTION...3 METHODS...3
RACHEL COLE National Marine Aquarium, Plymouth
 CITIZEN SCIENCE FOR SEAGRASS IN THE SOUTH WEST: THE COMMUNITY SEAGRASS INITIATIVE RACHEL COLE National Marine Aquarium, Plymouth Seagrasses create important marine habitats for many species and provide
PROCEDURE FOR MONITORING AN AQUATIC PLANT PROBLEM 1
 PROCEDURE FOR MONITORING AN AQUATIC PLANT PROBLEM 1 The density, diversity, and growth patterns of aquatic plants are unique to each lake. Therefore, many of the details concerning sample site locations
Eelgrass and Macroalgae Presence/Absence Preliminary Surveys BHP Proposed Grays Harbor Potash Export Facility A Task 400
 Memorandum 40600-HS-MEM-55036 Revision 0 Date: 26 July 2018 Subject: Eelgrass and Macroalgae Presence/Absence Preliminary Surveys BHP Proposed Grays Harbor Potash Export Facility A17.0202.00 Task 400 INTRODUCTION
EVALUATING THE EFFECTS OF BIVALVE SHELLFISH AQUACULTURE AND ITS ECOLOGICAL ROLE IN THE ESTUARINE ENVIRONMENT IN THE UNITED STATES
 EVALUATING THE EFFECTS OF BIVALVE SHELLFISH AQUACULTURE AND ITS ECOLOGICAL ROLE IN THE ESTUARINE ENVIRONMENT IN THE UNITED STATES Brett Dumbauld USDA Agricultural Research Service, Hatfield Marine Science
Keywords: marine habitat recovery, derelict fishing gear
 Marine habitat recovery after derelict fishing net removal. Jeff June*, Kyle Antonelis, Natural Resources Consultants, Inc. Seattle, WA. *Corresponding author: jjune@nrccorp.com Keywords: marine habitat
Chateaugay Lakes Milfoil Control Program
 Chateaugay Lakes Milfoil Control Program Summary of Activities and Findings for June August 29 Prepared By: Daniel L. Kelting Executive Director Adirondack Watershed Institute Paul Smith's College P.O.
Comparison of Acoustic and Aerial Photographic Methods for Quantifying the Distribution of Submersed Aquatic Vegetation in Sagamore Creek, NH
 Comparison of Acoustic and Aerial Photographic Methods for Quantifying the Distribution of Submersed Aquatic Vegetation in Sagamore Creek, NH by Bruce Sabol, Elizabeth Lord, Kevin Reine, and Deborah Shafer
Rising Tide Oyster Company 2.0 Acre Bellamy Site Marine Aquaculture License Application
 Rising Tide Oyster Company 2.0 Acre Bellamy Site Marine Aquaculture License Application Joshua and Jessica Carloni 264 Swain Road Barrington, N.H. 03825 Summary This is an amendment to our existing license
Eelgrass Survey PARADISE CAY BELVEDERE, MARIN COUNTY CALIFORNIA. Prepared For:
 Eelgrass Survey PARADISE CAY BELVEDERE, MARIN COUNTY CALIFORNIA Prepared For: Radford (Skid) Hall, Ph.D. Land Planning and Permitting Consultant 500 Airport Blvd., Suite 350 Burlingame, CA 94010 (650)
Survey Technique for Underwater Digital Photography with Integrated GPS Location Data
 Survey Technique for Underwater Digital Photography with Integrated GPS Location Data Tim Siwiec: United States Environmental Protection Agency Abstract This survey technique is an inexpensive method of
Starry Stonewort in Silver Lake Washington County, WI BRAD STECKART AIS COORDINATOR FOR WASHINGTON AND WAUKESHA COUNTIES
 Starry Stonewort in Silver Lake Washington County, WI BRAD STECKART AIS COORDINATOR FOR WASHINGTON AND WAUKESHA COUNTIES Brad Steckart -AIS coordinator for Washington and Waukesha Counties -Graduated from
New Millennium Dive Expeditions
 New Millennium Dive Expeditions 15030 N Timberline Drive Reno, NV 89511 (775)850-2510 * nmde@att.net www.nmde.org Project Report July 12, 2013: Phase 1 of 2 (Phase 2: August 26 th 30 th, 2013) Supporting
Osoyoos Lake Aquatic Plant Mapping
 Osoyoos Lake Aquatic Plant Mapping AquaTechnex, LLC Presented to Okanogan County NWCB by PO Box 30824 Bellingham WA, 98228 www.aquatechnex.com Introductions Myriophyllum spicatum or Eurasian Milfoil has
MEMORANDUM Comfort Lake-Forest Lake Watershed District
 MEMORANDUM Comfort Lake-Forest Lake Watershed District To: Board of Managers Date: December 7, 2016 From: Mike Kinney Subject: 2016 Watercraft Inspections and AIS Report Summaries Watercraft Inspection
Habitat Fact Sheets. Rocky habitats are dominated by seaweeds and often mussels, which rely on the rocks for attachment.
 Habitat Fact Sheets Habitats in the Gulf of Maine serve many important roles for the environment and for humans as well. These include: cycling nutrients, filtering pollution, trapping sediments, storing
Figure 1. View of entrance to dock, accessible from Water Street, Woods Hole.
 Report on 2011 Surveys of Marine Invasive Species, Cape Cod Eel Pond, Woods Hole Location: Marine Biological Laboratory (MBL) dock Total # high-resolution photos: 29 Comments: This site would be suitable
Oceans Humans both depend on it and threaten it with their activities
 Oceans Humans both depend on it and threaten it with their activities Oceans Water covers nearly ¾ of the Earth s surface More than 50% of the world s population lives within an hour of the coast Oceans
Delineation of the Asian Clam (Corbicula fluminea) Population at Sand Harbor State Park, Nevada
 Population at Sand Harbor State Park, Nevada") Delineation of the Asian Clam (Corbicula fluminea) Population at Sand Harbor State Park, Nevada Report to the Nevada Division of State Lands and the Tahoe Regional Planning Agency Final Draft Brant Allen,
Delineation of the Asian Clam (Corbicula fluminea) Population at Sand Harbor State Park, Nevada Report to the Nevada Division of State Lands and the Tahoe Regional Planning Agency Final Draft Brant Allen,
UPPER BEACH REPLENISHMENT PROJECT RELATED
 ASSESSMENT OF SAND VOLUME LOSS at the TOWNSHIP of UPPER BEACH REPLENISHMENT PROJECT RELATED to the LANDFALL OF HURRICANE SANDY - PURSUANT TO NJ-DR 4086 This assessment is in response to Hurricane Sandy
Didemnum. The first 5 years at Edmonds, WA. Tunicate Control Efforts by Volunteer Recreational Divers focused on Didemnum cf lahillei
 Didemnum The first 5 years at Edmonds, WA Tunicate Control Efforts by Volunteer Recreational Divers focused on Didemnum cf lahillei Bruce Higgins Volunteer Coordinator Edmonds Underwater Park, Edmonds
Repeat Monitoring of Seagrass Beds for Project Next Generation Autumn 2016
 Repeat Monitoring of Seagrass Beds for Project Next Generation Autumn 2016 Prepared by April 2016 Project Next Generation: Repeat Seagrass Monitoring: Autumn 2016 1 Repeat Monitoring of Seagrass Beds for
Good Mooring to You! Jensen Beach Mooring Field. Kathy Fitzpatrick, P.E. Coastal Engineer, Martin County
 Good Mooring to You! Kathy Fitzpatrick, P.E. Coastal Engineer, Martin County Penny Cutt Regional Manager, Coastal Systems International Mooring Field Advantages Provide a safe and secure anchorage at a
Estuarine Shoreline Stabilization
 Estuarine Shoreline Stabilization Property Owner s Guide to Determining the Most Appropriate Stabilization Method Estuarine shorelines are dynamic features that experience continued erosion. Land is lost
STATUS REPORT FOR THE SUBMERGED REEF BALL TM ARTIFICIAL REEF SUBMERGED BREAKWATER BEACH STABILIZATION PROJECT FOR THE GRAND CAYMAN MARRIOTT HOTEL
 August 23 STATUS REPORT FOR THE SUBMERGED REEF BALL TM ARTIFICIAL REEF SUBMERGED BREAKWATER BEACH STABILIZATION PROJECT FOR THE GRAND CAYMAN MARRIOTT HOTEL performed by Lee E. Harris, Ph.D., P.E. Consulting
Crooked Lake Oakland County (T4N, R9E, Sections 3, 4, 9) Surveyed May James T. Francis
 Surveyed May James T. Francis") Michigan Department of Natural Resources Status of the Fishery Resource Report No. 2004-1, 2004 Crooked Lake Oakland County (T4N, R9E, Sections 3, 4, 9) Surveyed May 2002 James T. Francis Environment Crooked
Michigan Department of Natural Resources Status of the Fishery Resource Report No. 2004-1, 2004 Crooked Lake Oakland County (T4N, R9E, Sections 3, 4, 9) Surveyed May 2002 James T. Francis Environment Crooked
Eurasian water-milfoil (Myriophyllum spicatum) SCUBA Dive Monitoring Survey Sand Bar Lake WBIC: Bayfield County, Wisconsin
 SCUBA Dive Monitoring Survey Sand Bar Lake WBIC: Bayfield County, Wisconsin") Eurasian water-milfoil (Myriophyllum spicatum) SCUBA Dive Monitoring Survey Sand Bar Lake WBIC: 2494900 Bayfield County, Wisconsin 6ft EWM Towers with Rooted Branch Preparing to Fall Off (Berg 2016) EWM
Eurasian water-milfoil (Myriophyllum spicatum) SCUBA Dive Monitoring Survey Sand Bar Lake WBIC: 2494900 Bayfield County, Wisconsin 6ft EWM Towers with Rooted Branch Preparing to Fall Off (Berg 2016) EWM
FACT SHEET MCGREGOR LAKE RESTORATION HABITAT PROJECT POOL 10, UPPER MISSISSIPPI RIVER, WISCONSIN ENVIRONMENTAL MANAGEMENT PROGRAM
 FACT SHEET MCGREGOR LAKE RESTORATION HABITAT PROJECT POOL 10, UPPER MISSISSIPPI RIVER, WISCONSIN ENVIRONMENTAL MANAGEMENT PROGRAM LOCATION McGregor Lake is located within a mid-river island in Pool 10
JadEco, LLC PO BOX 445 Shannon, IL 61078
 Introduction: With the assistance of Lake Holiday staff and volunteers, we were able to conduct an AC electrofishing survey on May 8, 27. Water temperatures were 2.3 C (8.5 F) and water clarity was decent
How many adult oysters are in the Great Bay Estuary and how has it changed over time?
 Indicator: in the Great Bay Estuary Question How many adult oysters are in the Great Bay Estuary and how has it changed over time? Short Answer The number of adult oysters decreased from over 25 million
Map Showing NAFO Management Units
 Map Showing NAFO Management Units Biology Are 6 species of seals in Atlantic Canadian waters, all of which occur in Newfoundland Two Arctic Species (Ringed, Bearded) Two temperate (Grey, Harbour) Two migratory
Sustainable Seas - Marine Fisheries Fisheries and Fishing
 Sustainable Seas - Marine Fisheries Fisheries and Fishing Maximum Sustainable Yield and Fishery Management Mariculture Reading: Ch 9: 9.12 Ch 14: 14.7-14.9 Ch 17: 17.1, 17.17-17.21,17.25 Graphic: Chub
Phase II Final Report Port Canaveral Lionfish Project
 Phase II Final Report Port Canaveral Lionfish Project Contract PO # P14685 Report prepared for Carol Noble Director, Environmental Plans and Programs Canaveral Port Authority Suite 301 445 Challenger Road
Volume and Shoreline Changes along Pinellas County Beaches during Tropical Storm Debby
 Volume and Shoreline Changes along Pinellas County Beaches during Tropical Storm Debby Ping Wang and Tiffany M. Roberts Coastal Research Laboratory University of South Florida July 24, 2012 Introduction
A PHYSICAL AND BIOLOGICAL SURVEY OF THE MID-REACH MITIGATION REEF SET NUMBER 1
 A PHYSICAL AND BIOLOGICAL SURVEY OF THE MID-REACH MITIGATION REEF SET NUMBER 1 John M. Hearin, Ph.D., P.E. 1 ; Geoff Swain, Ph.D. 2 ; Robert Weaver, Ph.D., P.E. 2 ; Kelli Z. Hunsucker, Ph.D. 2 ; Caglar
Nicholas Brown. 31 Bennett Rd Wolfeboro NH Application submitted
 Nicholas Brown 31 Bennett Rd Wolfeboro NH 03894 603-856-5454 Nick4634@gmail.com Application submitted 8-12-2017 Description of proposed project A. General Methodology The site located approximately 600
Orange County MPA Watch A n n u a l R e p o r t
 Orange County MPA Watch 2 0 1 4 A n n u a l R e p o r t WHAT IS AN MPA? Marine Protected Areas (MPAs) are discrete geographic marine or estuarine areas designed to protect or conserve marine life and habitat.
DUXBURY WAVE MODELING STUDY
 DUXBURY WAVE MODELING STUDY 2008 Status Report Duncan M. FitzGerald Peter S. Rosen Boston University Northeaster University Boston, MA 02215 Boston, MA 02115 Submitted to: DUXBURY BEACH RESERVATION November
Sontek RiverSurveyor Test Plan Prepared by David S. Mueller, OSW February 20, 2004
 Sontek RiverSurveyor Test Plan Prepared by David S. Mueller, OSW February 20, 2004 INTRODUCTION Sontek/YSI has introduced new firmware and software for their RiverSurveyor product line. Firmware changes
2014 Threatened and Endangered Fish Survey of. East Loon Lake and West Loon Lake. Lake County, Illinois
 2014 Threatened and Endangered Fish Survey of East Loon Lake and West Loon Lake Lake County, Illinois Prepared by Integrated Lakes Management 120 LeBaron St. Waukegan, IL 60085. Chris Ryan Chris Rysso
IF YOU BUILD IT THEY WILL COME
 IF YOU BUILD IT THEY WILL COME Delaware s Artificial Reef Program is funded under the Federal Aid in Fisheries Restoration Act by the Delaware Division of Fish and Wildlife ABOUT THE COVER The tugs Fels
EPA R6 Dive Team Operations Report. San Jacinto Waste Pits Channelview, TX December 9-10, 2015
 EPA R6 Dive Team Operations Report San Jacinto Waste Pits Channelview, TX December 9-10, 2015 BACKGROUND The San Jacinto River Waste Pit Site history has been documented in several documents prepared for,
EcoLogic Memorandum. TO: Ben Brezell; EDR FROM: Mark Arrigo RE: Possible Impacts of Dredging Snooks Pond DATE: 6/4/07
 EcoLogic Memorandum TO: Ben Brezell; EDR FROM: Mark Arrigo RE: Possible Impacts of Dredging Snooks Pond DATE: 6/4/07 Background EDR P.C. (EDR) has been contracted by a landowner to assess the feasibility
Near-Field Sturgeon Monitoring for the New NY Bridge at Tappan Zee. Quarterly Report July 1 September 30, 2014
 Near-Field Sturgeon Monitoring for the New NY Bridge at Tappan Zee Quarterly Report July 1 September 30, 2014 Prepared by AKRF, Inc. 7250 Parkway Drive, Suite 210 Hanover, MD 21076 for New York State Thruway
Seagrass surveys must be conducted between the dates of April 1 st and October 31 st with the following exceptions:
 Florida Fish and Wildlife Conservation Commission (FWC) Recommended Survey Protocols for Estuarine and Marine Submerged Aquatic Vegetation (SAV) related to Permitting Applications 12/14/2011 DRAFT 1) Survey
Orange County MPA Watch A n n u a l R e p o r t
 Orange County MPA Watch 2 0 1 5 A n n u a l R e p o r t WHAT IS AN MPA? Marine Protected Areas (MPAs) are discrete geographic marine or estuarine areas designed to protect or conserve marine life and habitat.
Alewife Brook, Cape Elizabeth, River Herring Monitoring Summary 2015
 University of Southern Maine USM Digital Commons Publications Casco Bay Estuary Partnership (CBEP) 2-3-2016 Alewife Brook, Cape Elizabeth, River Herring Monitoring Summary 2015 Matt Craig University of
Kerr Lake Vegetation Survey. October November Report submitted by NC State University. Background
 Kerr Lake Vegetation Survey October November 2012 Report submitted by NC State University Background Hydrilla (Hydrilla verticillata) is a non-native invasive submersed aquatic plant. This plant was first
MAHS Field School 2018 Pickles Reef Florida Keys National Marine Sanctuary
 MAHS Field School 2018 Pickles Reef Florida Keys National Marine Sanctuary MAHS returned to Pickles Reef in June of 2018 to hold its annual field school. Pickles Reef lies about 6 miles from Key Largo
LaSalle Park Marina Wave Break
 LaSalle Park Marina Wave Break Federal and Municipal Environmental Assessment Background History of the Marina and LaSalle Park The LaSalle Park Marina is located in LaSalle Park at the foot of LaSalle
Coastal and marine recreation in New England is ingrained in the region s economic and
 RECREATION Coastal and marine recreation in New England is ingrained in the region s economic and social fabric. Recreation on the ocean and coast includes many of New Englanders most time-honored and
Anchoring Is Important
 BCC Sailing Classes - Third Theory Anchoring Anchoring Is Important 1 The Anchor is your last resort. Anchoring Keep off a lee shore. Needs to be shaped (type of anchor) to bury in the type of bottom for
Equatorial upwelling. Example of regional winds of small scale
 Example of regional winds of small scale Sea and land breezes Note on Fig. 8.11. Shows the case for southern hemisphere! Coastal upwelling and downwelling. Upwelling is caused by along shore winds, that
SOCIETAL GOALS TO DETERMINE ECOSYSTEM HEALTH: A FISHERIES CASE STUDY IN GALVESTON BAY SYSTEM, TEXAS
 SOCIETAL GOALS TO DETERMINE ECOSYSTEM HEALTH: A FISHERIES CASE STUDY IN GALVESTON BAY SYSTEM, TEXAS Anthony S. Pait, NOAA, National Centers for Coastal Ocean Science Thomas P. O Connor, David R. Whitall,
Available from Deakin Research Online:
 This is the published version: Hirst, Alistair, Heislers, Simon, Ball, David, Blake, Sean and Coots, Allister 2011, Baywide seagrass monitoring program : milestone report no. 11 (Oct. Nov. 2010) Department
Comparison of Predicted and Measured Shoaling at Morro Bay Harbor Entrance, California
 Comparison of Predicted and Measured Shoaling at Morro Bay Harbor Entrance, California by Edward F. Thompson, Inocencio P. DiRamos, and Robert R. Bottin, Jr. PURPOSE: This Coastal and Hydraulics Engineering
Figure 4, Photo mosaic taken on February 14 about an hour before sunset near low tide.
 The Impact on Great South Bay of the Breach at Old Inlet Charles N. Flagg and Roger Flood School of Marine and Atmospheric Sciences, Stony Brook University Since the last report was issued on January 31
MANAGEMENT OF KRILL AS AN ESSENTIAL COMPONENT OF THE CALIFORNIA CURRENT ECOSYSTEM
 MANAGEMENT OF KRILL AS AN ESSENTIAL COMPONENT OF THE CALIFORNIA CURRENT ECOSYSTEM AMENDMENT 12 TO THE COASTAL PELAGIC SPECIES FISHERY MANAGEMENT PLAN ENVIRONMENTAL ASSESSMENT, REGULATORY IMPACT REVIEW
TITLE: North Carolina s Changing Shorelines. KEYWORDS: erosion - shorelines - mapping - sustainability
 UNC Coastal Studies Institute Teacher Resources 1 TITLE: North Carolina s Changing Shorelines KEYWORDS: erosion - shorelines - mapping - sustainability Changing shorelines impact coastal infrastructure.
Frequency of Percnon gibbesi in relation to. Diadema antillarum at Rodney s Rock
 Frequency of Percnon gibbesi in relation to Diadema antillarum at Rodney s Rock By: Rickey Wallace Study Abroad Dominica Summer 2007 Texas A&M University Dr. Bob Wharton Dr. Jim Woolley Abstract The nimble
Performance of Upham Beach T-Groin Project and Its Impact to the Downdrift Beach
 Performance of Upham Beach T-Groin Project and Its Impact to the Downdrift Beach Progress Report for the Period of October 2008 to April 2009 Submitted by Ping Wang, Ph.D., and Tiffany M. Roberts Department
MAINTENANCE DREDGING IN A SENSITIVE ENVIRONMENT CASE STUDY: MANCHESTER ENTRANCE CHANNEL
 MAINTENANCE DREDGING IN A SENSITIVE ENVIRONMENT CASE STUDY: MANCHESTER ENTRANCE CHANNEL Carlos G. Peña, P.E. 1 ABSTRACT Eelgrass (Zostera marina) is a shallow water plant species common in coastal regions
Green crabs: invaders in the Great Marsh Featured scientist: Alyssa Novak from the Center for Coastal Studies/Boston University
 Name Green crabs: invaders in the Great Marsh Featured scientist: Alyssa Novak from the Center for Coastal Studies/Boston University Research Background: Marshes are areas along the coast that flood with
Cove Point Beach Restoration: Utilization of a Spawning Habitat by Horseshoe Crabs (Limulus polyphemus)
") Cove Point Beach Restoration: Utilization of a Spawning Habitat by Horseshoe Crabs (Limulus polyphemus) Paul Bushmann, Jessica Peterson, Bethany Enyeart and Deborah Smith Anne Arundel Community College
Cove Point Beach Restoration: Utilization of a Spawning Habitat by Horseshoe Crabs (Limulus polyphemus) Paul Bushmann, Jessica Peterson, Bethany Enyeart and Deborah Smith Anne Arundel Community College
Seagrass Surveys in Kampot
 Coastal Annual Forum 23 rd October 2014 Sihanoukville, Cambodia Seagrass Surveys in Kampot Presentation by Louis Bourne INTERNATIONAL UNION FOR CONSERVATION OF NATURE Presentation Overview Location and
Welcome to Paddle for the Edge!
 Welcome to Paddle for the Edge! Thank you for volunteering to conduct a survey of the Barnegat Bay s shorelines. As a citizen scientist, you become part of a project to collect critical data about current
Vieques Underwater Demonstration Project
 Vieques Underwater Demonstration Project NOAA Office of Response and Restoration National Ocean Service 2006-2007 2007 University of New Hampshire Joint Hydrographic Center 2006 Science Application International
Shoreline Studies Program, Department of Physical Sciences, VIMS
 Living Shoreline Training Class 2017 1 Demonstration sites discussed in this talk. 2 A shoreline management plan for the entire creek made conceptual shoreline management recommendations along every stretch
Figure79. Location map for the 10 NJBPN profile sites in Atlantic County, NJ 155
 154 Figure79. Location map for the 10 NJBPN profile sites in Atlantic County, NJ 155 ATLANTIC COUNTY SPRING 2009 to FALL 2010 The Atlantic County coastline consists of three barrier islands. Between Little
Current Status and Management Recommendations for the Fishery in the Cloverleaf Chain of Lakes
 Current Status and Management Recommendations for the Fishery in the Cloverleaf Chain of Lakes Jason Breeggemann Senior Fisheries Biologist Wisconsin Department of Natural Resources Outline DNR fisheries
CHAPTER 4: BEST MANAGEMENT PRACTICES FOR EROSION AND SEDIMENTATION CONTROL
 Figure 4.4m. Type III Floating Turbidity Barrier Source: American Boom and Barrier Corporation and Virginia Department of Transportation (DOT) Standard Sheets 71 4.4.6 Floating Turbidity Barrier Definition
Aquatic Plant Surveys in Donner Lake State Park, California: Report to California State Parks. Final Draft
 Aquatic Plant Surveys in Donner Lake State Park, California: 2017 Report to California State Parks Final Draft Brant Allen, Katie Senft, and Brandon Berry UC Davis Tahoe Environmental Research Center February
Aids to navigation can include buoys, day beacons, range markers, and lighthouses.
 This boating safety course manual has been approved by Transport Canada strictly on the basis that it meets the minimum requirements of basic boating safety knowledge set out in Transport Canada s Boating
Aquatic Plant Management and Importance to Sport Fisheries
 Aquatic Plant Management and Importance to Sport Fisheries Presentation to Michigan Inland Lakes Convention May 2014 Mike Maceina Professor Emeritus School of Fisheries, Aquaculture, and Aquatic Sciences
Final Bull Trout Redd Monitoring Report for the Wallowa Falls Hydroelectric Project
 Final for the Wallowa Falls Hydroelectric Project East Fork Wallowa River barrier to upstream fish migration, photo courtesy of Kendrick Moholt (FERC No. P-308) December 18, 2017 Prepared by: Jeremiah
REVISED SILT CURTAIN DEPLOYMENT PLAN
 Contract No.: HY/2009/11 Central Wanchai Bypass, North Point Reclamation REVISED SILT CURTAIN DEPLOYMENT PLAN Name Prepared by: China Harbour Engineering Co., Ltd. China Road and Bridge Corporation Joint
Red Tide Blooms in Casco Bay (2010 State of the Bay Presentation)
") University of Southern Maine USM Digital Commons Presentations Casco Bay Estuary Partnership (CBEP) 2010 Red Tide Blooms in Casco Bay (2010 State of the Bay Presentation) Scott Libby Battelle Don Anderson
University of Southern Maine USM Digital Commons Presentations Casco Bay Estuary Partnership (CBEP) 2010 Red Tide Blooms in Casco Bay (2010 State of the Bay Presentation) Scott Libby Battelle Don Anderson
Summary of Research within Lamlash Bay No-Take Zone - Science report for COAST July
 Summary of Research within Lamlash Bay No-Take Zone - Science report for COAST July 2013 - *Picture of a spider crab (Macropodia spp) inside a plumose anemone. Taken within Lamlash Bay No-Take Zone by
Puget Sound Nearshore Ecosystem Restoration Project Restore America s Estuaries Conference 2012 Tampa, FL
 Restore America s Estuaries Conference 2012 Tampa, FL presented by: Theresa Mitchell, WA Dept. of Fish & Wildlife Nearshore General Investigation Change Analysis: Comparison of historical and current
The Sand Beaches of New Hampshire and Maine
 The Sand Beaches of New Hampshire and Maine Beach Preservation and Erosion Control Photographs provided by Joe Kelly and Steve Adams Cover photo: Reid State Park, ME Introduction The sand beaches of New
National Report on Large Whale Entanglements
 National Report on Large Whale Entanglements Confirmed in the United States in 2017 In 2017, 76 confirmed cases of large whale entanglements were documented along the coasts of the United States. Seventy
CLAM PASS ANNUAL RESTORATION & MANAGEMENT PLAN TIDAL ANALYSIS ELEMENT REPORT NO. 13
 CLAM PASS ANNUAL RESTORATION & MANAGEMENT PLAN TIDAL ANALYSIS ELEMENT REPORT NO. 13 Submitted to: Pelican Bay Services Division Prepared by: Humiston & Moore Engineers H&M File No. 13-078 November 2012
STEELHEAD SURVEYS IN OMAK CREEK
 STEELHEAD SURVEYS IN OMAK CREEK 2002 Annual Report Prepared by Chris Fisher John Arterburn Colville Confederated Tribes Fish and Wildlife Department P.O. Box 150 Nespelem, WA 99155 Prepared for Project
I. Monitoring and Adaptive Management Approach. Potential Effects, Monitoring Studies & Mitigation
 I. Monitoring and Adaptive Management Approach Define the problem or management objective. Determine potential effects of the project on indicator species. Emphasis on examining potentially negative, rather
Results of a Suspended Solids Survey at the Whites Point Quarry, Little River, Digby County, Nova Scotia
 Results of a Suspended Solids Survey at the Whites Point Quarry, Little River, Digby County, Nova Scotia Prepared for Global Quarry Products P.O. Box 2113 Digby, Nova Scotia B0V 1A0 By Michael Brylinsky
Provisions for Moorings
 Provisions for Moorings Tasman Resource Management Plan Summary Guide No. 11 Current: July 2013 1. Introduction Structures and occupation of the coastal marine area (CMA) are managed to control the location
Marine Ecosystems. Aquatic Ecosystems Section 2
 Marine Ecosystems Marine ecosystems are located mainly in coastal areas and in the open ocean. Organisms that live in coastal areas adapt to changes in water level and salinity. Organisms that live in
located Let s go fishing Hydrilla
 Our Lake of the Month for November is Lake August (set your GPS to 27.2750-81.4136). The elevation of Lake August is 102.5. Lake August is a 52 acre dredge hole lake (man-made from a former wetland; see