Prioritizing Re-Mapping and Analyses of Rivermouths in California Coastal Areas. Following FEMA Region IX s Coastal Re-Study
|
|
|
- Ginger Price
- 5 years ago
- Views:
Transcription
1 Prioritizing Re-Mapping and Analyses of Rivermouths in California Coastal Areas Proud Platinum Sponsor of the ASFPM 2017 Annual Conference Following FEMA Region IX s Coastal Re-Study Vince Geronimo, PE, CFM Operations Manager, Oakland, CA Edward Curtis, PE, CFM FEMA RIX Regional Engineer ASFPM 2017 Annual Conference FLOOD RISK MANAGEMENT IN THE HEARTLAND Kansas City, Missouri, April 30 May 5 May the 4 fourth be with you
2 Prioritizing Re-Mapping and Analyses of Rivermouths in California Coastal Areas Just as a drop of water in the ocean cannot avail much; but if a great river runneth into it, that maketh a great commotion Jakob Bohme (German Theologian b.1575)

3
4 Page 4


5 Page 5

6
7
8

9
10
11
12
13

14
15
16
17
18
19
20
21


22

23
24

25
26
27

28
29


30

31

32
33

34 San Elijo Lagoon

35 San Elijo Lagoon
36
37


38
39 XS 1 XS yr Still Water Elevation MHHW
40

41


42


43
 Regional 0.2- percent (feet, NAVD) At-site 1- percent (feet, NAVD) San Diego Southern 7.17 7.39 7.54 7.72 7.88 8.03 8.42 7.95 La Jolla Southern 6.19 7.13 7.27 7.44 7.59 7.74 8.")
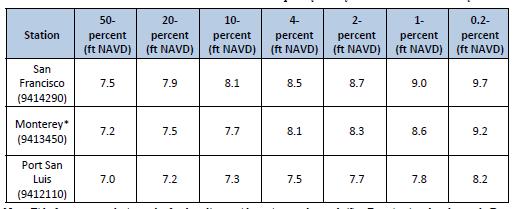
44 Station Region Regional 50- percent (feet, NAVD) Regional 20- percent (feet, NAVD) Regional 10- percent (feet, NAVD) Regional 4- percent (feet, NAVD) Regional 2- percent (feet, NAVD ) Regional 1- percent (feet, NAVD) Regional 0.2- percent (feet, NAVD) At-site 1- percent (feet, NAVD) San Diego Southern La Jolla Southern Newport Bay Los Angeles Santa Monica Santa Barbara Port San Luis Southern Southern Southern Southern Southern Monterey Central San Francisco Point Reyes Arena Cove Humboldt Bay Crescent City Port Orford Central Central Central Central Central Northern Charleston Northern Station ID Inferred Station Predictor Station CH P0 CC HU AC PR SF MO SL SB RI SM LA NB LJ SD CH P CC HU AC PR SF MO SL SB RI SM LA NB LJ SD Station County Coverage Annual Maxima (yrs)* MLLW to NAVD88 (ft) Mean Sea Level Trend (mm/yr) Charleston Coos, OR 72% 40 (42) Port Orford Curry, OR 52% 26 (31) Crescent Del Norte 96% 70 (77) City Humboldt Humboldt 64% 33 (34) North Spit Arena Cove Mendocino 45% 24 (27) ** Point Reyes Marin 69% 36 (37) San Francisco San Francisco 99% 114 (114) Monterey Monterey 72% 37 (38) Port San Luis San Luis 94% 61 (66) Obispo Santa Barbara Rincon Island Santa Barbara 26% 18 (23) Ventura 22% 15 (24) Santa Los Angeles 68% 64 (71) Monica Los Angeles Los Angeles 98% 84 (88) Newport Orange 29% 37 (39) Bay Entrance La Jolla San Diego 94% 75 (86) San Diego San Diego 66% 83 (85)

45
46
47
48 Coincident Peak Base Flood Profile Elevation XS 1 XS yr Still Water Elevation MHHW
49


50


51

52
53


54


55

56

57

58

59

60


61
62 Map Map Map Map Map Map Analysis Analysis Analysis Analysis Analysis Analysis Analysis Analysis Analysis Analysis Input Analysis Analysis Analysis Analysis Analysis 2017 Stream County City X-Coordinate (UTM m) Y-Coordinate (UTM m) Primary Riverine SFHA SFHA Designation Floodway Floodway Score BFE (ft) Note FP Width (ft) Nearest Transect OPC Study Coastal SWEL 10% Coastal SWEL 4% Coastal SWEL 2% OPC Study Coastal SWEL 1% Coastal SWEL 0.2% Coastal TWL 10% Coastal TWL 2% Coastal TWL 1% Coastal TWL 0.2% Calc TWL- SWEL (100-Yr) Community Rating (1-5) Map errors, New Terrain, etc IDS4 Mapping Comment COMMENT Effective 10-yr Boundary Condition Effective 100-yr Boundary Condition (Base Flood Elevation) Effective 500-yr Boundary Condition (Base Flood Elevation) Change in 10% Boundary Elevation Change in 1% Boundary Elevation Watershed sqmi Watershed sqmi (FIS) Discharge Slope Distance u/s Date of Riverine study Age LEVEE ID Levied Levee Scale (1-5) LEVEE NAME PAL STATUS LEVEE COMMENT Population of Floodplain Development 1-5) 1 = many homes i Laguna Salada San Mateo Fairway Park 544, ,163, A 1 1 n/a Community nearby but not in floodplain. Golf course in floodplain Yes 3 Calera Creek San Mateo Pacifica 544, ,162, A 1 1 n/a Community nearby but not in floodplain. Some houses in 500yr floodplain Yes 3 Unnamed Creek San Mateo Pacifica 544, ,162, A 1 1 n/a Community nearby but not in floodplain. Some houses in 500yr floodplain Yes 3 San Pedro Creek San Mateo Pacifica 543, ,161, AO 3 1 AO3/AH14 (from tie-in SF) Coastal wave effects were applied at Lindamar Beach in Pacifica to the TWL of 17 and 20 feet. The effective Zone A south of Mapping Transect 16 remains intact. Beyond the crest Developed and many houses in floodplain Yes 5 Unnamed Creek San Mateo Montara 542, ,155, A 1 1 n/a Developed but no properties in floodplain Yes 5 Montara Creek San Mateo Montara 542, ,154, AE (from tie-in SF) Coastal wave effects were applied at the mouth of Montara Creek to the TWL of 26 feet at the mouth of the channel and truncated at the effective Zone AE. The effective zone was modified in the area of the 8 ft riverine BFE to improve the tie-in Developed but no properties in floodplain Yes 5 San Vincente Creek San Mateo Montara 542, ,153, AE (from tie-in SF) Coastal wave effects were applied at the mouth of San Vicente Creek to the TWL of 29 feet along the backshore. The effective AE Zone with a BFE of 38 feet was superseded at the backshore to improve the tie-in > Developed but no properties in floodplain. Some houses in 500yr floodplain Yes 3 Denniston Creek San Mateo Princeton 545, ,150, AE ft Coastal wave effects were applied at the mouth of Denniston Creek within Pillar Point Harbor to the TWL of 14 feet and truncated in the vicinity of the effective 21 ft BFE. A review of the effective mapping compared to the new topography used for the study revealed a disconnect between the effective riverine study and the new topography which would require extensive restudy to correct. Therefore, redelineation was limited to the channel area approximately 90 feet upstream of the tie-in location. The effective flood Developed but no properties in floodplain. Some houses in 500yr floodplain Yes 3 Frenchmans Creek San Mateo Halfmoon Bay 548, ,148, A 1 1 n/a Developed but no properties in floodplain. Yes 2 Purisima Creek San Mateo Halfmoon Bay 550, ,139, A 1 1 n/a Area is undeveloped No 1 Tunitas Creek San Mateo Halfmoon Bay 553, ,134, A 1 1 n/a Area is undeveloped No 1 San Gregorio Creek San Mateo Halfmoon Bay 552, ,130, A 1 1 n/a Area is undeveloped No 1 Pomponio Creek San Mateo San Gregorio 552, ,128, A 1 1 n/a Area is undeveloped No 1 Pescadero Creek San Mateo Pescadero 552, ,124, AE 5 Floodway 5 13 (from tie-in SF) Coastal wave effects were applied at the mouth of Pescadero Creek to the TWL of 24 feet. The effective mapping was redelineated at the lowest reaches of the floodway, limited to the area seaward of Cross Section A using the 13 to 16 ft contours. This improves the tie-in at the roadway, however, additional study would be required to correct the floodway inland of this location. This area will be provided to Coordinated Needs Management Strategy (CNMS) for further review Area is undeveloped No 1 Arroyo de los Frijoles San Mateo Pescadero 552, ,120, A 1 1 n/a Area is undeveloped No 1 Gazos Creek San Mateo Pescadero 556, ,113, A 1 1 n/a Area is undeveloped No 1 Cascade Creek San Mateo - 558, ,110, A 1 1 n/a Area is undeveloped No 1 Green Oaks Creek San Mateo - 559, ,109, A 1 1 n/a Area is undeveloped No 1 Finney Creek San Mateo Davenport 562, ,107, A 1 1 n/a Area is undeveloped No 1 Elliot Creek San Mateo Davenport 562, ,107, A 1 1 n/a Area is undeveloped No 1 Waddell Creek Santa Cruz Swanton 564, ,105, A 1 1 n/a See comments in KAM tie-in MXD. Tie in the Zone A across the highway on the west side, and tie in to the Coastal AE21 on the east side. South of the AE21 finger, do not map Zone A Area is undeveloped No 1 Scott Creek Santa Cruz Swanton 568, ,099, A 1 1 n/a Riverine Zone A. Coastal SWEL not needed. Cut effective Zone A at the end of the new coastal VE Area is undeveloped No 1 Molino Creek Santa Cruz Swanton 568, ,099, A 1 1 n/a Examine alignment of Zone A boundary - is extremely poor when compared to OPC terrain. Zone A does not even cover current stream centerline. Realign Zone A and tie-in will be simple between coastal VE & Riverine A. Ensure that the stream centerline is located properly Area is undeveloped No 1 San Vincente Creek Santa Cruz Davenport 571, ,096, AE (from tie-in SF) Coastal wave effects (runup) were applied to San Vicente Creek at an elevation of 18.6 feet. The downstream portion of the 1-percent-annual-chance detailed floodplain for San Vicente Creek was superseded by the new coastal floodplain in the backshore. Mapping upstream of the San Vicente Creek tie-in boundaries was not revised. PROFILE: 1% effective elevation is at 8.5; apply coastal backwater to the profile and FDT. Location of tie-in is ~70' u/s of confluence (or ~400' d/s of Railroad). MAPPING: Supersede BFEs at downstream end. Tie-in is straightforward (HUC , San Francisco Coastal South) 674 (HUC , San Francisco Coastal South) N/A 1 N/A N/A N/A Small coastal community present, some houses in floodplain Yes 4 Laguna Creek Santa Cruz Davenport 575, ,093, A 1 1 n/a Examine alignment of Zone A boundary - is extremely poor when compared to OPC terrain. Zone A does not even cover current stream centerline. Realign Zone A and tie-in will be simple between coastal VE & Riverine A Area is undeveloped No 1 Majors Creek Santa Cruz Davenport 576, ,092, A 1 1 n/a Examine alighment - is poor when compared to OPC terrain. If alignment can be fixed, tie-in will be simple between coastal VE & Riverine A Area is undeveloped No 1 Baldwin Creek Santa Cruz Santa Cruz 577, ,091, A 1 1 n/a Looks like coastal zone needs another gutter/ae Zone at the top of that runup zone. Do not keep the small A Zone leftover at the upstream end along Baldwin Creek. DO keep the backwater finger attached to the right of this area Area is undeveloped No 1 Lombardi Gulch Santa Cruz Santa Cruz 579, ,091, A 1 1 n/a Tie in as usual between coastal VE & Riverine Zone A (see KAM tie-in MXD) Area is undeveloped No 1 Old Dairy Gulch Santa Cruz Santa Cruz 580, ,090, A 1 1 n/a Tie in as usual between coastal VE & Riverine Zone A (see KAM tie-in MXD) Area is undeveloped No 1 Wilder Creek Santa Cruz Santa Cruz 582, ,090, A 1 1 n/a Coastal SWEL does not reach Zone A extent. Tie in with gutter at interface between VE & A Area is undeveloped No 1 Younger Lagoon Santa Cruz Santa Cruz 583, ,089, AE Area is undeveloped No 1 Moore Creek Santa Cruz Santa Cruz 583, ,089, AE 5 Floodway 5 9 (from tie-in SF) Coastal wave effects (runup) were applied at Moore Creek to an elevation of approximately 10.0 feet, limited to the immediate backshore, and truncated at the effective Zone AE floodway approximately 100 feet upstream of the effective limit of the floodway. Mapping upstream of the Moore Creek tie-in boundaries was not revised. PROFILE: 1% effective elevation is at 8.4; apply coastal backwater to the profile and FDT. Location of tie-in is ~250' u/s of confluence (or ~2,285' d/s of Delaware Ave). MAPPING: Map VE up to 9' contour OR up to end of VE depth depending on coastal eng. feedback. Apply AE <3' wave where possible; tie in 0.2% TWL into riverine 0.2% where possible (HUC , Monterey Bay) 757 (HUC , Monterey Bay) N/A 1 N/A N/A N/A Area is developed but no properties in floodplain Yes 2 San Lorenzo River Santa Cruz Santa Cruz 587, ,091, AE 5 Floodway 5 9 (from tie-in SF) The downstream section of the effective floodway for the San Lorenzo River was adjusted using the revised topography upstream to the area between the 14 ft and 15 ft BFE to ensure the floodway is not jumping the banks or propagating over the floodwall onto the boardwalk. Portions of the effective 0.2-percent-annual-chance floodplain between the coastal and riverine SFHAs have been superseded by the new coastal study. The effective A99 zone(s) polygons in the area have been left intact. The coastal floodplain boundary has been limited to the overtopping distance along the boardwalk and ends at the effective floodway immediately downstream of the 9 ft BFE. PROFILE: Eff profile starts at a 1% WSEL of 7.9'; apply coastal backwater to the profile and FDT. MAPPING: Mapping contains A99 Zones. Discuss with Ed Curtis/Eric Simmons. Adjust interface of boundary between A99 & Coastal VE at Municipal Wharf Rd. New coastal mapping is more narrow than eff SFHA on all sides. New coastal mapping excludes Santa Cruz Pier (~0.5 mi up the coast from San Lorenzo River), whereas, the eff VE Zone did not. Suggest adding the east side of this stream to CNMS as a need. Assuming we cannot reduce the width of the floodway here (even though it is bisecting structures) - we have to temporarily leave it hanging. Due to the OPC terrain the FW delineation does not appear to make sense - seems like it should be contained by the feature along the east side of the stream (HUC , Monterey Bay) 757 (HUC , Monterey Bay) & Yes 5 San Lorenzo River levee N/A The effective FIS does provide a profile and FDT that include and do not include levee effects, but this levee is not certified so the info not including levee effects was referenced. Area is highly developed with properties adjacent to floodplain. Further upstream, houses are in floodplain Yes 5 Schwan Lagoon Santa Cruz Santa Cruz 589, ,091, AE 5 1 n/a 130_ Schwann Lagoon ties directly into the limit of overtopping from the new coastal hazards data at East Cliff Drive and remains mapped at the whole foot BFE of 16 feet. The coastal mapping overtops East Cliff Drive for a distance of 30 feet from the crest which was added to the coastal runup VE 19 to create a reasonable tie-in to the AE 16 of Schwann Lagoon. PROFILE: 1% eff elevation is at 8.7. Project current trajectory of profile down to 8.6, then add 8.6 backwater & coastal influence note. MAPPING: If this is a capped/overtopped location, apply the AO and tie that back in to the riverine AE. Place a Riverine BFE 16 on the upstream side of the last coastal gutter (HUC , Monterey Bay) 757 (HUC , Monterey Bay) N/A 1 N/A N/A N/A Area is highly developed but no properties in floodplain Yes 4 Rodeo Creek Gulch Santa Cruz Santa Cruz 590, ,091, AE 5 Floodway 5 9 (from tie-in SF) Coastal wave effects were applied to Rodeo Creek Gulch/Corcoran Lagoon of 18.0 feet at East Cliff Drive where an overtopping VE 14 zone was applied for a distance of 31 feet across the roadway. The effective mapping was redelineated using the revised terrain from an elevation of 11 feet to 9 feet immediately upstream of the limit of the effective floodway PROFILE: 1% eff elevation is at 8.9. Project current trajectory of profile down to 8.6, then add 8.6 backwater & coastal influence note. MAPPING: Either fill in the missing mapping sliver with AO (if this is an overtopped/capped location) or fill in with riverine AE (at elev/bfe 9) (HUC , Monterey Bay) 757 (HUC , Monterey Bay) N/A 1 N/A N/A N/A Area is highly developed but no properties in floodplain. Some properties are in the 500yr floodplain Yes 3 Moran Lake Santa Cruz Santa Cruz 591, ,090, A 1 1 n/a At Mapping Transect 41 at Moran Lake, the effective Zone A boundary was redelineated to approximately the 16 ft contour at the down stream end of the lake to improve the tie-in to the coastal mapping. Apply coastal SWEL 8.6 up to the Lake shoreline. Zone A alignment with current terrain is very bad. Re-align Zone A using SwiftMap Area is highly developed with properties adjacent to floodplain. Yes 4 Soquel Creek Santa Cruz Santa Cruz 593, ,092, AE 5 Floodway 5 15 (from tie-in SF) The downstream portion of the 1-percent-annual-chance detailed floodplain for Soquel Creek was adjusted to tie into the new coastal floodplain, and riverine BFEs were adjusted accordingly. The effective coastal flooding of VE 22 and VE 19 have been superseded by the VE 18 coastal mapping on either side of the floodway for Soquel Creek, which remains intact. The overtopping analysis at Mapping Transect 48 resulted in the creation of two AE 14 zones at the Venetian Cottages and the Capitola Boardwalk. The floodway at Mapping Transect 49 was extended slightly to complete the tie-in with the VE 15 overtopping zone south of the Capitola Boardwalk. PROFILE: 1% effective elevation is at 7.6; apply coastal backwater to the profile and FDT. Location of tie-in is ~70' u/s of confluence (or 430' d/s of Stockton Ave). Mapping: fill the effective FW back in, down to the confluence with the VE, based on the effective width published in the FDT (HUC , Monterey Bay) 757 (HUC , Monterey Bay) N/A 1 N/A N/A N/A Area is highly developed with properties in the floodplain. Yes 5 Aptos Creek Santa Cruz Santa Cruz 597, ,092, AE 5 Floodway 5 8 (from tie-in SF) _ The downstream portion of the 1-percent-annual-chance detailed floodplain for Aptos Creek was adjusted to tie into the new coastal floodplain and riverine BFEs were adjusted accordingly. The effective floodway for Aptos Creek was extended downstream to the VE 18 overtopping zone at Rio Del Mar Blvd, retaining the floodway width published in the Effective FIS (FEMA 2012). PROFILE: 1% effective elevation is at 7.8; apply coastal backwater to the profile and FDT. Location of tie-in is ~80' u/s of confluence (or 1,180' d/s of private bridge). Mapping: fill the effective FW back in, down to the confluence with the VE, based on the effective width published in the FDT (HUC , Monterey Bay) 757 (HUC , Monterey Bay) N/A 1 N/A N/A N/A Area is highly developed with properties in the floodplain. Yes 5 Watsonville Slough Santa Cruz Pajaro Dunes 605, ,080, AE 5 Floodway 5 na Along the VE zone/watsonville Slough interface, the Riverine 16 BFE zone should directly join the VE zone along the length of that mapped finger (no X Zones in between the VE and AE). The terrain along the boundary of the VE/AE is below the riverine AE BFE16. Where the PFD line dips in and out of the Watsonville Slough, can the PFD line be pulled back very slightly so it doesn't take a bite out of the FW? Small coastal community present, entire community in floodplain Yes 5 Pajaro River Santa Cruz Pajaro Dunes 605, ,080, AE 5 Floodway 5 12 (from tie-in SF)? The downstream portion of the effective 1-percent-annual-chance floodplain for the Pajaro River in the vicinity of Mapping Transect 73 at the Pajaro Dunes has been redelineated to the 13 ft contour using the new study terrain. On the coastal side, a transition Zone AE 16 propagates up the sandy beach until it connects with the floodway in the vicinity of the 13 ft BFE. The AE 16 penetrates north towards Mapping Transect 73 until it encounters the 16 ft contour. PROFILE: Effective profile (with levee consideration) starts at a 1% WSEL of 7.9'. Coastal Backwater must be applied on profile and FDT at 8.6'. See PFD Scenarios 1 & 2 for possible tie-in methods ,300 (HUC , Pajaro) 1,300 (HUC , Pajaro) & Yes 5 Pajaro River levee & Watsonville Slough levee N/A The effective FIS does provide a profile and FDT that include with and without levee effects. Levee is not accredited/certified. Effective mapping appears to reference the WITH LEVEE data (see FW width in FDT Small coastal community present, entire community in floodplain Yes 5 Big Sur River Monterey Big Sur ,015, A 1 1 n/a Area is undeveloped No 1 Bixby Creek Monterey Carmel 598, ,025, A 1 1 n/a Area is undeveloped No 1 Canyon Del Ray Monterey Sand City 602, ,052, AE (from tie-in SF) _ PROFILE: Effective profile starts at a 1% WSEL of 7.9' (in US HWY 1 culvert). No issues. MAPPING: Tie-in will occur at d/s face of Kolb Ave. Will need to update FDT (HUC , Monterey Bay) (HUC , Monterey Bay) N/A 1 N/A N/A N/A Area is highly developed, many houses in 500yr floodplain Yas 4 Carmel River Monterey Carmel 595, ,044, AE (from tie-in SF) _ At the Carmel River the coastal VE 28 experiences overtopping along the backshore where it transitions to a VE 20 before the tie-in to the effective 16 ft BFE. PROFILE: Effective profile starts at 1% WSEL of 15.8'. Major profile issue. Not sure how this can be handled. MAPPING: Tie-in will occur ~300' u/s of State HWY 1. Effective mapping is wider in ROB at d/s end than new ,924 (HUC , Central Coastal) 254 1,924 (HUC , Central Coastal) & 127 Yes 5?? From the eff FIS, it sounds like the eff data represents the north and south Area is highly developed, many houses in floodplain Yes 5 Castroville Boulevard Wash Monterey Moss Landing 608, ,073, A 1 1 n/a PROFILE: Effective profile begins at a 1% WSEL of 10.4', which is higher than the coastal stillwater elev. MAPPING: Tie-in will occur ~500' u/s of eff XS A (HUC , Monterey Bay) (HUC , Monterey Bay) Yes 4 Moro Cojo Slough levee N/A Area is mostly undeveloped, but adjacent rivers create large floodplain, which floods Castroville and some commerical properties Yes 2 Elkhorn Slough Monterey Moss Landing 606, ,074, AE 5 Floodway 5 8 ft static At Elkhorn Slough the coastal VE 15 transitions to a 9 ft BFE within the harbor entrance and reverts to the effective floodway at cross-section A. PROFILE: Effective profile begins at RS 44,000' due to VE zone controlling elevations below this point. The 1% WSEL at RS 44,000 is ~8.7'. May be close enough that it (HUC , Monterey Bay) (HUC , Monterey Bay) , & Yes 3? Levee effects were ignored in effective study because they Area is mostly undeveloped, but adjacent rivers create large floodplain, which floods Castroville and some commerical properties Yes 2 Little Sur River Monterey Carmel ,021, A 1 1 n/a Area is undeveloped No 1 Parajo River Monterey Moss Landing 606, ,079, AE 5 Floodway 5 11 (from tie-in SF) At the Pajaro River, the coastal VE 16 from runup carries across the spit to tie-in to the effective floodway. Tie-in location occurs at an elevation of approximately 400 feet upstream of the effective cross-section A. PROFILE: Effective profile (with levee consideration) starts at a 1% WSEL of 7.9'. Coastal Backwater must be applied on profile and FDT at 8.6'. See PFD Scenarios 1 & 2 for possible tie-in methods ,300 (HUC , Pajaro) ,300 (HUC , Pajaro) , , & Yes 3 Pajaro River levee & Watsonville Slough levee N/A The effective FIS does provide a profile and FDT that include with and without levee effects. Levee is not accredited/certified. Effective mapping appears to reference the WITH LEVEE data (see FW width in FDT versus effective FW mapped width at XS A, and see profile downstream elevation vs. BFEs in effective mapping.) Area is undeveloped No 1 Salinas River Monterey Salinas 606, ,074, AE (from tie-in SF) At the Salinas River, the coastal VE 23 transitions into an AE 23 before the tie-in location occurs at the end of the effective riverine floodway. Minor edits to the effective mapping have been made to convert the coastal VE zone to the backshore AE riverine and also to modify the very end of the floodway. PROFILE: Effective profile starts at a 1% WSEL of 8.6'. No issues. MAPPING: Point of tie-in will be ~200' u/s of eff XS E ,329 (HUC , Salinas) ,329 (HUC , Salinas) Yes 3? N/A very short, on ROB?? Area is mostly undeveloped, but adjacent rivers create large floodplain, which floods Castroville and some commerical properties Yes 2 San Jose Creek Monterey Carmel 596, ,042, A 1 1 n/a Area is undeveloped NO 1 Tembladero Slough Monterey Moss Landing 607, ,070, A 1 1 n/a PROFILE: Eff profile begins at RS 21,800 at a 1% WSEL of 12.1'. Runup is at 20'. The limit of eff detailed study ends at a WSEL of 16.2'. The entire eff study will be controlled by the new VE zone. MAPPING: Tie-in cannot occur. Entire eff study (including FW) will be overtaken by new VE Zone (HUC , Monterey Bay) (HUC , Monterey Bay) N/A N/A 1 N/A N/A Area is mostly undeveloped, but adjacent rivers create large floodplain, which floods Castroville and some commerical properties Yes 2 Alva Paul Creek San Luis Obispo Morro Bay AE (from tie-sf) _ Coastal wave effects were applied at the mouth of Alva Paula Creek to the TWL of 14 feet. North and south of the river mouth the mapping is controlled by the presence of a primary frontal dune feature. The PFD was not extended across the river mouth and a TWL of 14 feet was propagated upstream to a reasonable tie-in with the effective AE 15. No redelineation was performed at this location. A review of the effective mapping compared to the new topography used for the study revealed a disconnect between the effective riverine study and the new topography which would require extensive restudy to correct Area develeoped with houses in floddplain Yes 5 Arroyo de la Laguna San Luis Obispo A 1 1 n/a Area is undeveloped NO 1 Arroyo Grande Creek San Luis Obispo Oceano AE (from tie-in SF) Coastal wave effects were applied at the mouth of Arroyo Grande Creek to the TWL of 16 feet along the backshore before encountering the effective AE 13 limit. To the south and north of the mouth, the limit of flooding is controlled by the presence of primary frontal dunes Highly developed with houses in floodplain Yes 5 Broken Bridge Creek San Luis Obispo San Simeon A 1 1 n/a Area is undevelopd except for park facilities and a few commerical properties, which are in floodplain Yes 2 Cayucos Creek San Luis Obispo Cayucos AE 5 Floodway 5 10 (from tie-in SF) _ Coastal wave effects were applied at the mouth of Cayucos Creek to the TWL of 14 feet along the edges of the channel and truncated at the effective Zone AE floodway at Ocean Avenue. The backwater AE 13 at the Cayucos Creek Veteran s Hall parking lot was converted to 0.2-percent-annual-chance to reflect the effects of the overtopping analysis at Mapping Area develeoped with houses in floddplain Yes 5 Coon Creek San Luis Obispo Los Osos AE 5 1 static BFE 10 (from tiein SF) Coastal wave effects propagate into the immediate backshore at the mouth of Coon Creek to the TWL of 22 feet. The effective Zone A boundary was adjusted using the new Area is undeveloped NO 1 Islay Creek San Luis Obispo Los Osos AE 5 1 static BFE 10 (from tiein SF) The 1-percent-annual-chance stillwater elevation was applied within Morro Bay and the mouth of Islay Creek. The redelineation of the effective AE 13 to the stillwater AE Area is undeveloped NO 1 Leffingwell Creek San Luis Obispo San Simeon A 1 1 n/a Small coastal community adjacent to floodplain Yes 4 Little Cayucos Creek San Luis Obispo Cayucos AE 5 Floodway 5 9 (from tie-in SF) _ Coastal wave effects were applied at the mouth of Little Cayucos Creek to the TWL of 15 feet along the edges of the channel and truncated at the effective Zone AE floodway at Ocean Avenue. Portions of the effective 0.2-percent-annual-chance TWL and Zone AO were Area develeoped with houses in floddplain Yes 5 Little Pico Creek San Luis Obispo San Simeon A 1 1 n/a Area is undeveloped NO 1 Morro Creek San Luis Obispo Morro Bay AE (from tie-in SF) _ Coastal wave effects propagate into the immediate backshore at the mouth of Morro Creek to the TWL of 26 feet. The effective Zone A boundary was adjusted using the new topography and the TWL to create a reasonable tie-in at this location Area develeoped with houses in floddplain Yes 5 Oak Knoll Creek San Luis Obispo A 1 1 n/a Area is undeveloped NO 1 Old Creek San Luis Obispo Cayucos AE 5 1 static BFE 10 (from tiein SF) Area develeoped with 1-2 houses in floddplain Yes 4 Oso Flaco Creek San Luis Obispo AE 5 1 static BFE 10 (from tiein SF) Area is undeveloped NO 1 Osos Creek San Luis Obispo Morro Bay AE SW_ developed but no houses in floodplain Yes 3 Pico Creek San Luis Obispo San Simeon A 1 1 n/a Small coastal community adjacent to floodplain Yes 2 Pismo Creek San Luis Obispo Avila Beach AE 5 Floodway (from tie-in SF) _ Coastal wave effects were applied at the mouth of Pismo Creek to the TWL of 15 feet along the edges of the channel and truncated at the end the effective Zone AE floodway. South of the floodway the VE 15 transitions to AE 15 at Mapping Transect 57 where the wave height drops below 3 feet before encountering the seawall along Front Street Small community adjacent to floodplain, with some properties in 500yr floodplain Yes 3 San Bernado Creek San Luis Obispo Morro Bay AE SW_ Small community adjacent to floodplain, with few properties on the edge Yes 3 San Carpoforo Creek San Luis Obispo - 651, ,959, A 1 1 n/a Area is undeveloped No 1 San Luis Obispo Creek San Luis Obispo Pismo Beach AE 5 Floodway 5 10 (from tie-in SF) Coastal wave effects were applied at the mouth of San Luis Obispo Creek to the TWL of 15 feet transitioning to AE 15 across the spit where wave height drops below 3 feet. The effective VE 13 within the river mouth was superseded by the coastal mapping and combined with the effective AE 13 upstream. The downstream effective mapping was redelineated using the new topography to keep the AE 13 within the visible channel and remove the effective Zone X from the channel. The effective 0.2% within the channel was also re-established between the effective AE inland of the river channel and the AE 13 in the channel. The coastal VE 15 was limited where the mouth of San Luis Obispo Creek meets the beach using new topography on either side of the mouth to identify a reasonable tie-in location Highly developed with many houses in floodplain Yes 5 Santa Rosa Creek San Luis Obispo Cambria AE 5 Floodway 5 11 (from tie-in SF) Coastal wave effects were applied at the mouth of Santa Rosa Creek to the TWL of 20 feet. The effective Zone A at the Moonstone Beach parking lot has been re-delineated to tie into the new TWL. The effective Zone A has also been superseded to the backshore and maintained between the backshore and the effective Zone AE 14 floodway to create a reasonable tie-in Developed community with some houses in floodplain Yes 4 Toro Creek San Luis Obispo Morro Bay AE (from tie-in SF) _ Coastal wave effects were applied at the mouth of Toro Creek to the TWL of 17 feet. North of the inlet, the effective AE 13 was superseded by the new coastal VE 17. The lower portion of Toro Creek s effective Zone AE was re-delineated starting at the 21 ft contour and moving upstream, the Zone A was tapered to 18 feet to create a reasonable tie-in. The graphic element representing the effective 18 ft BFE which originally extended the width of the floodplain was clipped to the new boundary. The surrounding effective Zone AE was modified to a Zone X Area is undeveloped No 1 Unnamed Creek San Luis Obispo Morro Bay AE (from tie-in SF) _ Coastal wave effects were applied at the mouth of No Name Creek to the TWL of 19 feet, superseding the effective AE 13 along the shoreline. Using the new topography, redelineation of the downstream effective AE was performed at the 24 ft contour, tapering to 19 feet for a reasonable tie-in. Redelineation was also performed for the effective 0.2% using the new topography dataset to reconnect with Zone AE (EL 24-21) Area develeoped with houses in floddplain Yes 5 Van Gordon Creek San Luis Obispo San Simeon A 1 1 n/a Small coastal community adjacent, with some houses in floodplain Yes 4 Villa Creek San Luis Obispo A 1 1 n/a Area is undeveloped No 1 Willow Creek San Luis Obispo Cayucos 692, ,922, AE 5 Floodway 5 23 (from tie-in SF) Coastal wave effects were applied at the mouth of Willow Creek to the TWL of 17 feet. The effective Zone AE 13 at the creek inlet was superseded by Zone AE 17. The effective 0.2- percent-annual-chance mapping was extended to the revised limit of coastal mapping Area develeoped with houses in floddplain Yes 5


63
64


65
66 Stream County City SFHA Designation Floodway Score Community Rating (1-5) Map errors, New Terrain, etc Change in 1% Boundary Elevation Distance Upstream Study age Levee Scale (1-5) Scale (1-5) 1 = many homes in SFHA FINAL Rank Score Pajaro River Santa Cruz Pajaro Dunes Aptos Creek Santa Cruz Santa Cruz Willow Creek San Luis Obispo Cayucos Elkhorn Slough Monterey Moss Landing San Lorenzo River Santa Cruz Santa Cruz Parajo River Monterey Moss Landing San Luis Obispo Creek San Luis Obispo Pismo Beach Cayucos Creek San Luis Obispo Cayucos Little Cayucos Creek San Luis Obispo Cayucos Watsonville Slough Santa Cruz Pajaro Dunes Pismo Creek San Luis Obispo Avila Beach Carmel River Monterey Carmel Soquel Creek Santa Cruz Santa Cruz Pescadero Creek San Mateo Pescadero Unnamed Creek San Luis Obispo Morro Bay Salinas River Monterey Salinas Arroyo Grande Creek San Luis Obispo Oceano Morro Creek San Luis Obispo Morro Bay Moore Creek Santa Cruz Santa Cruz Santa Rosa Creek San Luis Obispo Cambria Canyon Del Ray Monterey Sand City Rodeo Creek Gulch Santa Cruz Santa Cruz Montara Creek San Mateo Montara Alva Paul Creek San Luis Obispo Morro Bay San Pedro Creek San Mateo Pacifica San Vincente Creek Santa Cruz Davenport Toro Creek San Luis Obispo Morro Bay San Vincente Creek San Mateo Montara Denniston Creek San Mateo Princeton San Bernado Creek San Luis Obispo Morro Bay Schwan Lagoon Santa Cruz Santa Cruz Old Creek San Luis Obispo Cayucos Osos Creek San Luis Obispo Morro Bay Castroville Boulevard Monterey Moss Landing Unnamed Creek San Mateo Montara Van Gordon Creek San Luis Obispo San Simeon Younger Lagoon Santa Cruz Santa Cruz Coon Creek San Luis Obispo Los Osos Islay Creek San Luis Obispo Los Osos Calera Creek San Mateo Pacifica Unnamed Creek San Mateo Pacifica Leffingwell Creek San Luis Obispo San Simeon Oso Flaco Creek San Luis Obispo Moran Lake Santa Cruz Santa Cruz Laguna Salada San Mateo Fairway Park Tembladero Slough Monterey Moss Landing Broken Bridge Creek San Luis Obispo San Simeon Frenchmans Creek San Mateo Halfmoon Bay Pico Creek San Luis Obispo San Simeon Gazos Creek San Mateo Pescadero Cascade Creek San Mateo Green Oaks Creek San Mateo Finney Creek San Mateo Davenport Elliot Creek San Mateo Davenport Waddell Creek Santa Cruz Swanton Scott Creek Santa Cruz Swanton Molino Creek Santa Cruz Swanton Laguna Creek Santa Cruz Davenport Majors Creek Santa Cruz Davenport Baldwin Creek Santa Cruz Santa Cruz Lombardi Gulch Santa Cruz Santa Cruz Old Dairy Gulch Santa Cruz Santa Cruz Wilder Creek Santa Cruz Santa Cruz Big Sur River Monterey Big Sur Bixby Creek Monterey Carmel Little Sur River Monterey Carmel San Jose Creek Monterey Carmel Arroyo de la Laguna San Luis Obispo Little Pico Creek San Luis Obispo San Simeon Pomponio Creek San Mateo San Gregorio Purisima Creek San Mateo Halfmoon Bay Tunitas Creek San Mateo Halfmoon Bay San Gregorio Creek San Mateo Halfmoon Bay Arroyo de los Frijoles San Mateo Pescadero Oak Knoll Creek San Luis Obispo San Carpoforo Creek San Luis Obispo Villa Creek San Luis Obispo
67 Stream County City FINAL Rank Score Pajaro River Santa Cruz Pajaro Dunes Aptos Creek Santa Cruz Santa Cruz 3000 Willow Creek San Luis Obispo Cayucos 3000 Elkhorn Slough Monterey Moss Landing 2700 San Lorenzo River Santa Cruz Santa Cruz 2500 Parajo River Monterey Moss Landing 2025 San Luis Obispo Creek San Luis Obispo Pismo Beach 1500 Cayucos Creek San Luis Obispo Cayucos 1125 Little Cayucos Creek San Luis Obispo Cayucos 1125 Watsonville Slough Santa Cruz Pajaro Dunes 1125 Pismo Creek San Luis Obispo Avila Beach 900 Carmel River Monterey Carmel 750 Soquel Creek Santa Cruz Santa Cruz 500 Pescadero Creek San Mateo Pescadero 375 Unnamed Creek San Luis Obispo Morro Bay 300 Salinas River Monterey Salinas 270 Arroyo Grande Creek San Luis Obispo Oceano 225 Morro Creek San Luis Obispo Morro Bay 225 Moore Creek Santa Cruz Santa Cruz 200 Santa Rosa Creek San Luis Obispo Cambria 200 Canyon Del Ray Monterey Sand City 180 Rodeo Creek Gulch Santa Cruz Santa Cruz 150 Montara Creek San Mateo Montara 100 Alva Paul Creek San Luis Obispo Morro Bay 75
68 Page 68


69

70 Proud Platinum Sponsor of the ASFPM 2017 Annual Conference ASFPM 2017 Annual Conference FLOOD RISK MANAGEMENT IN THE HEARTLAND Kansas City, Missouri, April 30 May 5
Open Pacific Coast Study. California Coastal Analysis and Mapping Project
 Open Pacific Coast Study California Coastal Analysis and Mapping Project September 2012 California Open Coast Counties California Coastal Analysis and Mapping Project This publication is an initiative
Photo by: Darryl Hatheway, 2011
 Photo by: Darryl Hatheway, 2011 September 11, 2015 Presentation Discussion Examine PFD V-Zone Mapping in Wave Runup Dominated West Coast Application of PFD V-Zone Mapping Criteria in Pacific G&S PFD V-Zone
FEMA West Coast Sea Level Rise Pilot Study
 FEMA West Coast Sea Level Rise Pilot Study Ed Curtis, P.E., CFM FEMA Region IX June 4, 2014 Presentation Objectives Present the goals of the FEMA West Coast Sea Level Rise Pilot Study Review the SLR Pilot
Sussex County, DE Preliminary Study Overview
 Sussex County, DE Preliminary Study Overview Coastal study scope: 102 miles of entire County shoreline Revised 102 panels for coastal study Riverine study scope: 14 streams, 67.1 miles, within the Nanticoke
San Luis Obispo County December 2, 2014
 Flood Risk Review Meeting: Open Pacific Coast Study San Luis Obispo County December 2, 2014 Welcome and Introductions Flood Risk Review Meeting San Luis Obispo County California Coastal Analysis and Mapping
Bay County, MI Coastal Hazard Analysis Flood Risk Review Meeting. May 14, 2018
 Bay County, MI Coastal Hazard Analysis Flood Risk Review Meeting May 14, 2018 Agenda Introductions Coastal Flood Risk Study and Mapping Program Current Status Technical Overview of Study and Mapping Floodplain
Monterey County December 3, 2014
 Flood Risk Review Meeting: Open Pacific Coast Study Monterey County December 3, 2014 Welcome and Introductions Flood Risk Review Meeting Monterey County California Coastal Analysis and Mapping Project
Ventura County. Open Pacific Coast Study. California Coastal Analysis and Mapping Project
 Ventura County Open Pacific Coast Study California Coastal Analysis and Mapping Project December 2011 Project Name: Meeting: Date and Time: Location: California Coastal Analysis and Mapping Project (CCAMP)/Open
2016 NC Coastal Local Governments Annual Meeting
 2016 NC Coastal Local Governments Annual Meeting Coastal Flood Study Modeling and Mapping 101 April 21, 2016 Tom Langan, PE, CFM Engineering Supervisor NCEM Floodplain Mapping Program FEMA Coastal Flood
VOLUME 2 OF 5 VOLUSIA COUNTY, FLORIDA AND INCORPORATED AREAS COMMUNITY NAME NUMBER COMMUNITY NAME NUMBER
 VOLUME 2 OF 5 VOLUSIA COUNTY, FLORIDA AND INCORPORATED AREAS COMMUNITY NAME NUMBER COMMUNITY NAME NUMBER DAYTONA BEACH, CITY OF 125099 NEW SMYRNA BEACH, CITY OF 125132 DAYTONA BEACH SHORES, CITY OF 125100
Physical Map Revisions in Connecticut due to Updated Coastal Flood Hazards F8: Maps in Transition
 Physical Map Revisions in Connecticut due to Updated Coastal Flood Hazards F8: Maps in Transition Brian Caufield, P.E., CFM Principal Engineer CDM Smith Kerry Bogdan, CFM Senior Engineer FEMA Region I
St. Louis County, MN Coastal Hazard Analysis Flood Risk Review Meeting. May 2, 2018
 St. Louis County, MN Coastal Hazard Analysis Flood Risk Review Meeting May 2, 2018 Agenda Introductions Coastal Flood Risk Study and Mapping Program Current Status Technical Overview of Study and Mapping
Bayfield & Ashland Counties, WI Coastal Hazard Analysis Flood Risk Review Meeting. June 05, 2018
 Bayfield & Ashland Counties, WI Coastal Hazard Analysis Flood Risk Review Meeting June 05, 2018 Agenda Introductions Coastal Flood Risk Study and Mapping Program Current Status Technical Overview of Study
Baraga County, MI Coastal Hazard Analysis Flood Risk Review Meeting. July 12, 2018
 Baraga County, MI Coastal Hazard Analysis Flood Risk Review Meeting July 12, 2018 Agenda Introductions Coastal Flood Risk Study and Mapping Program Current Status Technical Overview of Study and Mapping
Citrus, Hernando, and Pasco Coastal Hazard Analysis. Flood Risk Review Meeting Citrus, Hernando, and Pasco Counties, Florida December 14, 2017
 Citrus, Hernando, and Pasco Coastal Hazard Analysis Flood Risk Review Meeting Citrus, Hernando, and Pasco Counties, Florida December 14, 2017 Introductions Risk MAP Project Team FEMA Region IV RAMPP (study
APPENDIX D-2. Sea Level Rise Technical Memo
 APPENDIX D-2 Sea Level Rise Technical Memo 2185 N. California Blvd., Suite 500 Walnut Creek, CA 94596 (925) 944-5411 Fax: (925) 944-4732 www.moffattnichol.com DRAFT MEMORANDUM To: From: Neil Nichols,
Future Condi,ons coastal hazard modeling and mapping
 Future Condi,ons coastal hazard modeling and mapping Presented by Bob Ba:alio, PE Environmental Science Associates, Inc. (ESA) On behalf of the physical processes team (USGS, TerraCosta- Scripps, ESA)
City of Del Mar Local Coastal Plan (LCP) Amendment for Sea Level Rise and Coastal Flooding
 Amendment for Sea Level Rise and Coastal Flooding") City of Del Mar Local Coastal Plan (LCP) Amendment for Sea Level Rise and Coastal Flooding 6/22/17 Presentation to Sea Level Rise Stakeholder- Technical Advisory Committee (STAC) Nick Garrity, P.E. Lindsey
City of Del Mar Local Coastal Plan (LCP) Amendment for Sea Level Rise and Coastal Flooding 6/22/17 Presentation to Sea Level Rise Stakeholder- Technical Advisory Committee (STAC) Nick Garrity, P.E. Lindsey
Coastal Environments Oceanographic and Engineering Expertise
 Coastal Environments Oceanographic and Engineering Expertise Coastal Environments La Jolla, CA www.coastalenvironments.com 14 May 2004 CE Ref. No. 04-05 EcoSystems Management Associates, Inc. Carlsbad,
Door County, WI Coastal Hazard Analysis Flood Risk Review Meeting. August 21, 2017
 Door County, WI Coastal Hazard Analysis Flood Risk Review Meeting August 21, 2017 Agenda Introductions Coastal Flood Risk Study and Mapping Program Current Status Technical Overview of Study and Mapping
Evaluation of June 9, 2014 Federal Emergency Management Agency Flood Insurance Study for Town of Weymouth, Norfolk, Co, MA
 Evaluation of June 9, 2014 Federal Emergency Management Agency Flood Insurance Study for Town of Weymouth, Norfolk, Co, MA Prepared For: Woodard & Curran 95 Cedar Street, Suite 100 Providence, RI 02903
Heal the Bay s 2007 California Summer Beach Report Card SM
 Heal the Bay s 2007 California Summer Beach Report Card SM Heal the Bay s 2007 California Summer Beach Report Card provides beachgoers with essential water quality information by grading 494 monitoring
SUPPLEMENTAL DOCUMENT SEA LEVEL RISE SCENARIO SELECTION AND DESIGN TIDE CALCULATION
 SUPPLEMENTAL DOCUMENT SEA LEVEL RISE SCENARIO SELECTION AND DESIGN TIDE CALCULATION FOR THE GUIDANCE FOR INCORPORATING SEA LEVEL RISE INTO CAPITAL PLANNING IN SAN FRANCISCO: ASSESSING VULNERABILITY AND
SANTA ROSA COUNTY, FLORIDA AND INCORPORATED AREAS
 VOLUME 1 OF 1 SANTA ROSA COUNTY, FLORIDA AND INCORPORATED AREAS COMMUNITY NAME GULF BREEZE, CITY OF 120275 JAY, TOWN OF 120339 MILTON, CITY OF 120276 SANTA ROSA COUNTY, UNINCORPORATED AREAS COMMUNITY NUMBER
ADAPTATION TO SEA LEVEL RISE AND COASTAL IMPACTS
 ADAPTATION TO SEA LEVEL RISE AND COASTAL IMPACTS Miramar Inn, Half Moon Bay, March 1, 2014 Photo by Jack Sutton, all rights reserved 2/22/17 AdaptLA Workshop California Coastal Commission 2 Plans and regulates
AN OVERVIEW OF RECENT PROJECTS RELATED TO SAND BUDGETS, SOUTHERN CALIFORNIA BEACHES
 AN OVERVIEW OF RECENT PROJECTS RELATED TO SAND BUDGETS, SAND SUPPLY, COASTAL ARMORING, MANAGEMENT, AND VALUING SOUTHERN CALIFORNIA BEACHES Dr. Kiki Patsch California State University Channel Islands Environmental
13 Incredible Stops on a Pacific Coast Highway Road Trip - Gap Year
 To get to the Big Sur you ll travel over the Bixby Bridge one of the tallest single span concrete bridges in the world and one of the most photographed bridges on the West Coast. It s 714 feet long and
APPENDIX C. Fluvial and Tidal Hydraulics Report
 APPENDIX C Fluvial and Tidal Hydraulics Report BUENA VISTA LAGOON ENHANCEMENT PROJECT FLUVIAL AND TIDAL HYDRAULICS ANALYSES Prepared for: SANDAG 401 B Street, Suite 800 San Diego, California 92101 Contact:
Coastal Hazards Study
 Coastal Hazards Study 2212 Beach Boulevard, Pacifica Prepared for: EXECUTIVE SUMMARY City of Pacifica 170 Santa Maria Ave Pacifica, CA 94044 Prepared by: moffatt & nichol 2185 N. California Blvd. Walnut
Technical Report Culvert A Hydraulic Analysis
 DATE: November 3, 2011 Technical Report Culvert A Hydraulic Analysis TO: FROM: RE: Jim Reiser, P.E. Project Manager Parsons Brinckerhoff, Inc. Kurt Killian, P.E., CFM Parsons Brinckerhoff, Inc. Design
The History of Coastal Flood Hazard Assessments in the Great Lakes
 The History of Coastal Flood Hazard Assessments in the Great Lakes Brian A. Caufield, P.E., CFM June 23, 2016 2 The Great Lakes Some Statistics Courtesy of Great Lakes Information Network One-fifth of
VOLUME 1 OF 5 VOLUSIA COUNTY, FLORIDA AND INCORPORATED AREAS COMMUNITY NAME NUMBER COMMUNITY NAME NUMBER
 VOLUME 1 OF 5 VOLUSIA COUNTY, FLORIDA AND INCORPORATED AREAS COMMUNITY NAME NUMBER COMMUNITY NAME NUMBER DAYTONA BEACH, CITY OF 125099 DAYTONA BEACH SHORES, CITY OF NEW SMYRNA BEACH, CITY OF 125132 125100
VOLUME 4 OF 6 LOS ANGELES COUNTY, CALIFORNIA AND INCORPORATED AREAS
 VOLUME 4 OF 6 LOS ANGELES COUNTY, CALIFORNIA AND INCORPORATED AREAS COMMUNITY NAME NUMBER COMMUNITY NAME NUMBER LOS ANGELES COUNTY UNINCORPORATED AREAS 065043 CITY OF CLAREMONT* 060109 CITY OF AGOURA HILLS
Bob Battalio, PE Chief Engineer, ESA September 8, 2016
 RELATING FUTURE COASTAL CONDITIONS TO EXISTING FEMA FLOOD HAZARD MAPS Technical Methods Manual Bob Battalio, PE Chief Engineer, ESA September 8, 2016 FMA 2016 Sacramento, California DWR-OST-SIO PILOTING
2 nd Steelhead Summit. October 27 & 28, 2016 in San Luis Obispo, CA
 + 2 nd Steelhead Summit October 27 & 28, 2016 in San Luis Obispo, CA 1 + Session Overview Sponsors: California Trout City of San Luis Obispo Sustainable Conservation California Conservation Corps Cachuma
WMS 8.4 Tutorial Hydraulics and Floodplain Modeling HY-8 Modeling Wizard Learn how to model a culvert using HY-8 and WMS
 v. 8.4 WMS 8.4 Tutorial Hydraulics and Floodplain Modeling HY-8 Modeling Wizard Learn how to model a culvert using HY-8 and WMS Objectives Define a conceptual schematic of the roadway, invert, and downstream
VOLUME 1 OF 1 VOLUSIA COUNTY, FLORIDA AND INCORPORATED AREAS COMMUNITY NAME NUMBER COMMUNITY NAME NUMBER
 VOLUME 1 OF 1 VOLUSIA COUNTY, FLORIDA AND INCORPORATED AREAS COMMUNITY NAME NUMBER COMMUNITY NAME NUMBER DAYTONA BEACH, CITY OF 125099 DAYTONA BEACH SHORES, CITY OF NEW SMYRNA BEACH, CITY OF 125132 125100
FEMA Region V. Great Lakes Coastal Flood Study. Pilot Study Webinar. Berrien County, Michigan. February 26, 2014
 FEMA Region V Great Lakes Coastal Flood Study Pilot Study Webinar Berrien County, Michigan February 26, 2014 2 Pilot Study Webinar Agenda Great Lakes Coastal Flood Study Background Demonstration Project
March 2006 Technical Report No Cayucos Pier. San Luis Obispo. Santa Barbara. San Miguel. Santa Rosa Anacapa. Palos Verdes, Offshore
 CALIFORNIA DEPARTMENT OF HEALTH SERVICES 850 Marina Bay Parkway, Richmond, CA 94804 ENVIRONMENTAL MANAGEMENT BRANCH Marine Biotoxin Monitoring Program M o n t h l y Marine Biotoxin R e p o r t INTRODUCTION:
IFP HIPAA Guaranteed Issue plans monthly rates
 IFP HIPAA Guaranteed Issue plans monthly rates Effective March 1, 2012 for HMO and PPO plans HIPAA Guaranteed-issue plans are available to individuals who meet the requirements specified on the Blue Shield
This report will help to direct the next steps necessary to open all remaining vertical accessways that have yet to be opened.
 STATE OF CALIFORNIA THE NATURAL RESOURCES AGENCY Arnold Schwarzenegger, Governor CALIFORNIA COASTAL COMMISSION STATEWIDE COASTAL ACCESS PROGRAM 725 FRONT STREET, SUITE 300 SANTA CRUZ, CA 95060 (831) 427-4875
BEACH REPORT CARD. Overview of Heal the Bay's End of Summer Report Essential water quality information for beachgoers
 END OF SUMMER REPORT 2017 CALIFORNIA BEACH REPORT CARD Essential water quality information for beachgoers IN THIS REPORT Excellent Beach Grades Across Counties New Bacteria Standards Proposed for Local
SAN MATEO COUNTY SEA LEVEL RISE INITIATIVE
 SAN MATEO COUNTY SEA LEVEL RISE INITIATIVE OCEAN CLIMATE SUMMIT // MAY 17, 2016 Photo by Biking Nikon SF, all rights reserved San Mateo County has $24 billion in assets at risk from sea level rise Pacifica
WALTON COUNTY, FLORIDA
 VOLUME 1 OF 1 WALTON COUNTY, FLORIDA AND INCORPORATED AREAS COMMUNITY NAME DEFUNIAK SPRINGS, CITY OF NUMBER 120318 FREEPORT, CITY OF 120319 PAXTON, TOWN OF 120423 WALTON COUNTY, UNINCORPORATED AREAS 120317
Application of IP Models for Salmon and Steelhead Recovery Planning in California
 Application of IP Models for Salmon and Steelhead Recovery Planning in California Brian Spence and David Boughton NMFS Southwest Fisheries Science Center Uses of IP models in technical recovery planning
Figure 1 GE image of the Costa Sur & EcoEléctrica power plants, located inside Guayanilla and Tallaboa bay.
 1 7 - STORM SURGES IN PUERTO RICO_Power Plants-Costa Sur & EcoElectrica Costa Sur & EcoEléctrica Figure 1 shows a GE image of the Costa Sur (Guayanilla) and EcoElectrica site. Figure 2 shows the topographic
LOCAL COASTAL PROGRAM UPDATE
 LOCAL COASTAL PROGRAM UPDATE Agenda Meeting #1 General Information (1 1:45 pm) Introductions and Background Grants involved What is a Local Coastal Program? What is required? LCP Update tasks and schedule
MADISON COUNTY, ILLINOIS AND INCORPORATED AREAS
 VOLUME 2 OF 2 MADISON COUNTY, ILLINOIS AND INCORPORATED AREAS * * * COMMUNITY COMMUNITY NAME NUMBER ALHAMBRA, VILLAGE OF 170270 ALTON, CITY OF 170437 BETHALTO, VILLAGE OF 170438 COLLINSVILLE, CITY OF 170439
Heal the Bay s 12th Annual Beach Report Card SM
 001-00 Heal the Bay s 1th Annual Beach Report Card SM May 3, 00 Heal the Bay is a nonprofit environmental organization dedicated to making Santa Monica Bay and Southern California coastal waters safe and
Steelhead/rainbow trout resources of San Luis Obispo County
 Steelhead/rainbow trout resources of San Luis Obispo County San Carpoforo (San Carpojo) San Carpoforo Creek (San Carpojo Creek) consists of more than ten stream miles. It flows southwest, entering the
Boothbay Harbor Rotary Club May 12, 2016
 Mapping Potential Sea Level Rise and Storm Surge in Boothbay Harbor, ME Boothbay Harbor Rotary Club May 12, 2016 Peter A. Slovinsky, Marine Geologist Maine Geological Survey S.M. Dickson, MGS Quickly,
Barriers to Alternative Transportation Modes RTP Public Input Survey - Summary of Responses -
 Barriers to Alternative Transportation Modes RTP Public Input Survey - Summary of Responses - Survey Information: County Population 262,382 (2010) 274 survey participants Survey accessed online at www.sccrtc.org
PROFILE OF SACRAMENTO RIVER, FREEPORT TO VERONA, CALIFORNIA,
 PROFILE OF SACRAMENTO RIVER, FREEPORT TO VERONA, CALIFORNIA, FLOOD OF FEBRUARY 1986 By J.C. Blodgett and J.B. Lucas U.S. GEOLOGICAL SURVEY Open-File Report 88-82 CO CM I m r-h CM Sacramento, California
UPPER BEACH REPLENISHMENT PROJECT RELATED
 ASSESSMENT OF SAND VOLUME LOSS at the TOWNSHIP of UPPER BEACH REPLENISHMENT PROJECT RELATED to the LANDFALL OF HURRICANE SANDY - PURSUANT TO NJ-DR 4086 This assessment is in response to Hurricane Sandy
VENICE LOCAL COASTAL PROGRAM UPDATE: COASTAL HAZARDS WELCOME
 VENICE LOCAL COASTAL PROGRAM UPDATE: COASTAL HAZARDS WELCOME 1 Introducing the Team Hosted by the Department of City Planning and grant funded in part by the California Coastal Commission 2 Workshop Purpose
Survey of Surfing at Seaside Reef
 Survey of Surfing at Seaside Reef (continued from 1st survey page) *** = required field 1. Why did you choose to surf at Seaside Reef today? (Please rank their importance) A. This spot has better surf
Ocean Waves. Capillary. Gravity. Wind generated. Tides Tsunamis Seiches
 Ocean Waves Capillary Wind generated Gravity Tides Tsunamis Seiches Capillary waves are driven by the surface tension produced by electrically polarized water molecule San Pedro Lighthouse Waves are alternate
Bicycle Count Data. December 2008
 Bicycle Count Data December 28 Published By: San Luis Obispo Public Works Department 919 Palm Street, San Luis Obispo, California 9341 Telephone (85) 781 719; FAX (85) 781 7198 www.slocity.org Introduction
PUBLIC NOTICE (11-137)
") Commander Eleventh District U.S. Coast Guard Island Building 50-2 Alameda, CA 94501-5100 Staff Symbol: dpw Phone: (510) 437-3515 Fax: (510) 437-5836 February 13, 2012 PUBLIC NOTICE (11-137) All interested
Commander Eleventh District U.S. Coast Guard Island Building 50-2 Alameda, CA 94501-5100 Staff Symbol: dpw Phone: (510) 437-3515 Fax: (510) 437-5836 February 13, 2012 PUBLIC NOTICE (11-137) All interested
S E SKELLY ENGINEERING
 May 5, 2004 Mr. Joel Baldwin Earth Investigation Consultants P.O. Box 795 Pacifica, CA 94044 SUBJECT: Reference: Coastal Hazard Study Proposed Legacy Quest Condominiums, 1567 Beach Boulevard, Pacifica.
Observing and Explaining Coastal Fishery Dynamics : An Application to Ports in California
 Observing and Explaining Coastal Fishery Dynamics : An Application to Ports in California Cameron Speir, NMFS Caroline Pomeroy, California Sea Grant Jon G. Sutinen, University of Rhode Island Cynthia J.
Pier 8 Wave Overtopping Analysis (65 Guise Street East) Our File:
 Our File:") Shoreplan Engineering Limited 55 Eglinton Avenue E., Suite 800 Toronto, ON Canada M4P 1G8 T) 416.487.4756 F) 416.487.5129 E) mail@shoreplan.com March 31, 2016 Mr. Ed English Senior Project Manager Waterfront
Shoreplan Engineering Limited 55 Eglinton Avenue E., Suite 800 Toronto, ON Canada M4P 1G8 T) 416.487.4756 F) 416.487.5129 E) mail@shoreplan.com March 31, 2016 Mr. Ed English Senior Project Manager Waterfront
2015 DRAFT SUMMARY REPORT Juvenile Steelhead Densities in the San Lorenzo, Soquel, Aptos and Corralitos Watersheds, Santa Cruz County, CA
 215 DRAFT SUMMARY REPORT Juvenile Steelhead Densities in the San Lorenzo, Soquel, Aptos and Corralitos Watersheds, Santa Cruz County, CA Fall Creek Flowing from Left to Right under Stream-Side Redwood,
Figure79. Location map for the 10 NJBPN profile sites in Atlantic County, NJ 155
 154 Figure79. Location map for the 10 NJBPN profile sites in Atlantic County, NJ 155 ATLANTIC COUNTY SPRING 2009 to FALL 2010 The Atlantic County coastline consists of three barrier islands. Between Little
ADDENDA B Hydrologic and Hydraulic (H&H) Study Guidance 2019
 Study Guidance 2019") 09/25/2018 DRAFT FEMA Region I PA H&H Study ADDENDA B Hydrologic and Hydraulic (H&H) Study Guidance 2019 Region I Federal Emergency Management Agency (FEMA) Public Assistance Hydrologic and Hydraulic (H&H)
09/25/2018 DRAFT FEMA Region I PA H&H Study ADDENDA B Hydrologic and Hydraulic (H&H) Study Guidance 2019 Region I Federal Emergency Management Agency (FEMA) Public Assistance Hydrologic and Hydraulic (H&H)
Heal the Bay th Annual Report
 Heal the Bay 25 26 16th nnual Report Heal the Bay s 16th nnual Beach Report Card May 24, 26 Heal the Bay is a nonprofit environmental organization dedicated to making Southern California coastal waters
Steelhead. Lagoon Ecology of Central Coast
 The grow zone: ecology of central coast lagoons Lagoon Ecology of Central Coast Steelhead Jerry J. Smith San Jose State San Jose State University University Oral presentation at Salmonid Restoration Federation
Ellis Y. Byeon, PE Bryan VanderGheynst, PE 1
 Ellis Y. Byeon, PE Bryan VanderGheynst, PE 1 Background Information: City of Trenton, Mercer County Assunpink Creek, Pond Run and Delaware River Lower 2.5 miles of the Assunpink Creek Lower 0.6 miles of
 D.W. ALLEY & Associates Aquatic Biology -------------------------------------------------------------------------- 2006 Juvenile Steelhead Densities in the San Lorenzo, Soquel, Aptos and Corralitos Watersheds,
OFFICE OF STRUCTURES MANUAL FOR HYDROLOGIC AND HYDRAULIC DESIGN CHAPTER 11 APPENDIX B TIDEROUT 2 USERS MANUAL
 OFFICE OF STRUCTURES MANUAL FOR HYDROLOGIC AND HYDRAULIC DESIGN CHAPTER 11 APPENDIX B TIDEROUT 2 USERS MANUAL APRIL 2011 APRIL 2011 Page 1 Preface TIDEROUT 2, Build 1.22 dated June 29, 2006 is the current
SAN DIEGUITO WETLANDS RESTORATION PROJECT 08 JANUARY 2018 BEACH PROFILES CITY OF DEL MAR, CALIFORNIA. Data Report
 SAN DIEGUITO WETLANDS RESTORATION PROJECT 08 JANUARY 2018 BEACH PROFILES CITY OF DEL MAR, CALIFORNIA Data Report Prepared by Coastal Environments, Inc. 2166 Avenida de la Playa, Suite E La Jolla, CA 92037
New Jersey Coastal Zone Overview. The New Jersey Beach Profile Network (NJBPN) 3 Dimensional Assessments. Quantifying Shoreline Migration
 3 Dimensional Assessments. Quantifying Shoreline Migration") New Jersey Coastal Zone Overview The New Jersey Beach Profile Network (NJBPN) Objectives Profile Locations Data Collection Analyzing NJBPN Data Examples 3 Dimensional Assessments Methodology Examples Quantifying
New Jersey Coastal Zone Overview The New Jersey Beach Profile Network (NJBPN) Objectives Profile Locations Data Collection Analyzing NJBPN Data Examples 3 Dimensional Assessments Methodology Examples Quantifying
WASHINGTON COUNTY, MAINE (ALL JURISDICTIONS)
") VOLUME 1 OF 1 WASHINGTON COUNTY, MAINE (ALL JURISDICTIONS) COMMUNITY NAME CID COMMUNITY NAME CID TOWN OF ADDISON 230132 TOWNSHIP OF BROOKTON 230470 TOWN OF ALEXANDER 230303 CITY OF CALAIS 230134 TOWN OF
VOLUME 1 OF 1 WASHINGTON COUNTY, MAINE (ALL JURISDICTIONS) COMMUNITY NAME CID COMMUNITY NAME CID TOWN OF ADDISON 230132 TOWNSHIP OF BROOKTON 230470 TOWN OF ALEXANDER 230303 CITY OF CALAIS 230134 TOWN OF
RI Regulatory Setbacks & Buffers: Coastal Management Issues
 RI Regulatory Setbacks & Buffers: Coastal Management Issues New England Onsite Wastewater Training Program @ URI OWT 155 - November 29, 2012 James Boyd - Coastal Policy Analyst Photo: October 30, 2012
Technical Brief - Wave Uprush Analysis 129 South Street, Gananoque
 Technical Brief - Wave Uprush Analysis 129 South Street, Gananoque RIGGS ENGINEERING LTD. 1240 Commissioners Road West Suite 205 London, Ontario N6K 1C7 June 12, 2013 Table of Contents Section Page Table
PROCESSING RECORD SCRIPPS INSTITUTION OF OCEANOGRAPHY ARCHIVES. Douglas Lamar Inman Aerial Photographs,
 Accession No.: 87-26 PROCESSING RECORD SCRIPPS INSTITUTION OF OCEANOGRAPHY ARCHIVES Inman, Douglas Lamar 1920- Douglas Lamar Inman Aerial Photographs, 1884-1980 Bulk Dates; 1944-1959 PHYSICAL DESCRIPTION:
M a r i n e B i o t o x i n
 CALIFORNIA DEPARTMENT OF PUBLIC HEALTH 850 Marina Bay Parkway, Richmond, CA 94804 ENVIRONMENTAL MANAGEMENT BRANCH Marine Biotoxin Monitoring Program M o n t h l y M a r i n e B i o t o x i n R e p o r
HY-8 Version 7.2 Build Date January 17, Federal Highway Administration.
 HY-8 Version 7.2 Build Date January 17, 2012 Federal Highway Administration http://www.fhwa.dot.gov/engineering/hydraulics/software/hy8/index.cfm SIMPLE Simple to use Use for simple culverts and bridges
Mouth of the Columbia River Jetties Three-Phase Construction Plan
 Mouth of the Columbia River Jetties Three-Phase Construction Plan Project Overview October 9, 2012 US Army Corps of Engineers MCR Jetties Major Rehabilitation Sand Island pile dikes 1930-1935 Columbia
Volume and Shoreline Changes along Pinellas County Beaches during Tropical Storm Debby
 Volume and Shoreline Changes along Pinellas County Beaches during Tropical Storm Debby Ping Wang and Tiffany M. Roberts Coastal Research Laboratory University of South Florida July 24, 2012 Introduction
CONSERVATION AND MANAGEMENT OF COASTAL WETLANDS IN CALIFORNIA
 Studies in Avian Biology No. 2: 151-155, 1979. CONSERVATION AND MANAGEMENT OF COASTAL WETLANDS IN CALIFORNIA JOHN SPETH' The title, Conservation and Management of Coastal Wetlands in California, implies
OFFICE OF THE CITY ADMINISTRATOR
 OFFICE OF THE CITY ADMINISTRATOR Gavin Newsom, Mayor Edwin M. Lee, City Administrator December 21, 2007 Mr. Eric Simmons, CFM National Flood Insurance Program Region IX, Mitigation Division U.S. Department
GONE! Coastal Erosion Happens During Storms! Why Worry About Coastal Setbacks? Goals for Today
 RI Regulatory Setbacks & Buffers: Coastal Zone Management Issues New England Onsite Wastewater Training Program @ URI OWT 155 November 21, 2013 Goals for Today Understand the impacts of storms, coastal
Regulatory Language Sunfish. Includes bluegill, green sunfish, redear sunfish, pumpkinseed, warmouth, yellow perch and Sacramento perch.
 Regulatory Language Section 1.45, Title 14, CCR, is added as follows: 1.45, Filleting of Salmonids in Inland Waters. Except as otherwise required, all salmon and steelhead taken in inland waters where
Abundance of Steelhead and Coho Salmon in the Lagunitas Creek Drainage, Marin County, California
 scanned for KRIS Abundance of Steelhead and Coho Salmon in the Lagunitas Creek Drainage, Marin County, California Prepared for: Marin Municipal Water District 220 Nellen Drive Corte Madera, California
The proper location of the mouth of the Salinas River is a very difficult problem. - U.S. Surveyor General for California (1879)
") The proper location of the mouth of the Salinas River is a very difficult problem - U.S. Surveyor General for California (1879) 1854 1854 early 1830s early 1830s early 1830s late 1830s late 1830s early
The proper location of the mouth of the Salinas River is a very difficult problem - U.S. Surveyor General for California (1879) 1854 1854 early 1830s early 1830s early 1830s late 1830s late 1830s early
Final Report August 2005
 2.0 REGIONAL STUDY AREA 2.1 Regional Setting 2.1.1 Topography The Los Angeles Region is located within the western portion of the Transverse Ranges Geomorphic Province. The San Andreas transform fault
APPENDIX I-A Kings County Regional Transportation Plan. Appendix A Page A-1 STATE ROUTES
 APPENDIX I-A STATE ROUTES Interstate 5 SR 33 SR 41 SR 43 SR 137 SR 198 SR 269 (See under City of Avenal) (See Figure 4-2 and 4-3 for Rural and Urban Functional Classifications) Appendix A Page A-1 INTERSTATE
Feasibility Study for Restoration of Titlow Lagoon Fish Passage. South Puget Sound Salmon Enhancement Group
 Feasibility Study for Restoration of Titlow Lagoon Fish Passage South Puget Sound Salmon Enhancement Group January 2010 Feasibility Study for Restoration of Titlow Lagoon Fish Passage Prepared for South
DEDUCTIONS EFFECTIVE DECEMBER 1, NOVEMBER 30, MONTHLY PREMIUM
 BAY AREA REGION HEALTH NET SMARTCARE CONTRA COSTA HEALTH PLAN WESTERN HEALTH ADVANTAGE $831.44 $695.93 $135.51 $1,662.88 $1,391.85 $271.03 $2,161.74 $1,809.41 $352.33 $1,111.13 $800.23 $310.90 $2,222.26
Town of Duck, North Carolina
 Tracking No. 00.00.2010 Erosion Mitigation And Shoreline Management Feasibility Study Town of Duck, North Carolina Coastal Planning & Engineering of North Carolina February 28, 2013 Ken Willson 1 Tracking
Nearshore Dredged Material Placement Pilot Study at Noyo Harbor, CA
 1 Nearshore Dredged Material Placement Pilot Study at Noyo Harbor, CA Noyo Cove N 2011 National Conference on Beach Preservation Technology 9-11, February 2011 Lihwa Lin, Honghai Li, Mitchell Brown US
Beach, dune and development in the Borough of Mantoloking as of January Prepared for The Borough of Mantoloking: April 2, 2008
 Summary of 20-years of Shoreline Monitoring Between Maryland Avenue, Point Pleasant Beach, Bay Head, Mantoloking, Brick Township, to 1 st Avenue in Normandy Beach, Ocean County, New Jersey & an Evaluation
2017 Preliminary FEMA Flood Maps Old Orchard Beach Town Council Meeting. Old Orchard Beach, Town Hall July 18, 2017
 2017 Preliminary FEMA Flood Maps Old Orchard Beach Town Council Meeting Old Orchard Beach, Town Hall July 18, 2017 Overview Potential impacts of inaccurate Flood Insurance Rate Maps (FIRM) Why is appealing
STREAM SURVEY File form No..
 scanned for KRIS THE RESOURCES AGENCY OF CALIFORNIA California Department of Fish and Game STREAM SURVEY File form No.. Date: September 4, 1969. NAME: North Fork Schooner Gulch Creek COUNTY: Mendocino.
2nd Year. Addt'l Wage or Pension. Total Package 50% 1 Alameda $37.12 $24.13 $2.25 $4.50 $0.00 $6.24 $46.40 $30.16 $2.25 $4.50 $0.50 $8.
 > 0 to 1,600 OJT Hours 1,601 to 3,200 OJT Hours 40% 50% 1 Alameda $37.12 $24.13 $2.25 $4.50 $0.00 $6.24 $46.40 $30.16 $2.25 $4.50 $0.50 $8.99 2 Alpine $28.10 $18.27 $2.25 $4.50 $0.00 $3.08 $35.12 $22.83
Plan B Dam Breach Assessment
 Plan B Dam Breach Assessment Introduction In support of the Local Sponsor permit applications to the states of Minnesota and North Dakota, a dam breach analysis for the Plan B alignment of the Fargo-Moorhead
Reading Material. Inshore oceanography, Anikouchine and Sternberg The World Ocean, Prentice-Hall
 Reading Material Inshore oceanography, Anikouchine and Sternberg The World Ocean, Prentice-Hall BEACH PROCESSES AND COASTAL ENVIRONMENTS COASTAL FEATURES Cross section Map view Terminology for Coastal
Indiana LTAP Road Scholar Core Course #10 Culvert Drainage. Presented by Thomas T. Burke, Jr., PhD, PE Christopher B. Burke Engineering, Ltd.
 Indiana LTAP Road Scholar Core Course #10 Culvert Drainage Presented by Thomas T. Burke, Jr., PhD, PE Christopher B. Burke Engineering, Ltd. Objectives Review culvert shapes, end sections, and materials
Leaning Into Adaptation
 www.marinslr.org Leaning Into Adaptation GFNMS Ocean Summit, May 17, 2016 Jack Liebster, Planning Manager, Marin County Marin County C-SMART Sea Level Rise Adaptation Process Evaluate Science Info. Implement