Galveston Bay Area Land Barrier preliminary design. E.C. van Berchum; P.A.L. de Vries; R.P.J. de Kort. Draft version 0.9
|
|
|
- Barbara Arnold
- 5 years ago
- Views:
Transcription

1 Galveston Bay Area Land Barrier preliminary design E.C. van Berchum; P.A.L. de Vries; R.P.J. de Kort Draft version 0.9 February 2016
2 2
3 Contents Summary (In Final Version) Introduction Purpose of this report Galveston Bay Area project overview Earlier studies Report structure Basis of the design Hydraulic boundary conditions Overtopping Design formulas Concluding remarks Spatial analysis Spatial structure of the project area Characteristic cross sections Selection of cross sections for technical design Land barrier alternatives Technical design for Cross section C: Narrow residential corridor Technical design for cross section D: Wide residential corridor Summary of alternatives and concluding remarks Environmental considerations Ecological considerations Legal considerations Coastal system Land Barrier preliminary design Land Barrier overview Technical design Spatial and landscape design Cost analysis Land barrier western- and eastern ends Conclusions and recommendations List of references Appendices

4 1 Introduction 1.1. Purpose of this report The highly populated Galveston Bay Area lies in the eastern part of Texas, USA. This region is at significant risk from hurricane-induced flooding, as became clear in the wake of Hurricane Ike in Over the past years, the TU Delft has assisted in the design of a flood defence system to protect the Galveston Bay Area. The different solutions that are currently proposed all incorporate a land barrier into their flood defence system (SSPEED 2015). This report summarizes the first conceptual design efforts for the land barrier on Galveston Island and Bolivar Peninsula and identifies the future design challenges. This research follows from a collaboration of TU Delft, Defacto and Royal HaskoningDHV (RHDHV), with contributions from Texas A&M University and SSPEED Center. A special part of the design process is the Land barrier design workshop, which was held January 14 th, 2016 at TU Delft, the Netherlands. During this workshop, experts from a variety of research fields assessed the design alternatives of the land barrier in a broader perspective Galveston Bay Area project overview The Galveston Bay Area is characterized by a great diversity of land-use in a low-lying region. The eastern part of the bay primarily consists of marshland, while the western part is home to millions, mostly concentrated in the city of Houston. Other notable locations around the Galveston Bay are the city of Galveston, at the eastern tip of Galveston Island, and the Port of Houston, which hosts one of the largest petrochemical complexes in the world. When Hurricane Ike hit, it made landfall at Galveston. This meant that the most destructive side of the hurricane hit the easterly marshlands with a low density of population and industry. The damage was still significant at $25 billion in economic loss and more than 100 fatalities. However, several models show that a more western landfall location, with the destructive side of the hurricane hitting Houston and its port, would lead to a far more catastrophic event in terms of economic loss, fatalities and ecological impact (SSPEED 2015). Figure 1 - Overview of the Galveston Bay Area (Source: SSPEED) 4
 were completely overrun by the storm surge, which could run up to 4-5 meters (12-14 ft.). Hurricane Ike brought the topic of flood protection to the forefront of local issues. Prof. Dr.")
5 The bay is separated from the Gulf of Mexico by two land masses, Galveston Island and Bolivar Peninsula. During Hurricane Ike, the low-lying land masses (maximum elevation of 1.5-2m, 5-7 ft.) were completely overrun by the storm surge, which could run up to 4-5 meters (12-14 ft.). Hurricane Ike brought the topic of flood protection to the forefront of local issues. Prof. Dr. William Merrell of Texas A&M University at Galveston (TAMUG) proposed a coastal barrier named the Ike Dike, an artificial construction extending across Galveston Island and Bolivar Peninsula to provide a barrier against flooding due to surges from the Gulf of Mexico. This Ike Dike closes off the the bay from the Gulf of Mexico with land barriers on Galveston Island and Bolivar Peninsula and storm surge barriers in Bolivar Roads and San Luis Pass. Other solutions focus on protecting the Port of Houston with storm surge barriers in the upper part of the bay instead of Bolivar Roads (the Upper Bay -solution) or to include a part of the highly populated western side by separating the bay in two parts (the Mid Bay -solution). Although the locations of the storm surge barriers vary, all three of these options include the construction of a land barrier on Galveston Island and Bolivar Peninsula. This barrier should limit the water flowing into the Galveston Bay, leading to a significant decrease of surge and in turn a decrease of expected damages and losses Earlier studies Over the years, much research has been conducted on the designs of different flood defence components, primarily focussing on the Ike Dike (later referred to as Coastal Spine ). With this in mind, the Coastal Spine design report was drafted in June 2015 to summarize the research on different components of the flood defence system. Figure 2: Result of the initial sketch design/exploration. Covered sea wall with a wide coastal levee (Jonkman et al. 2015) The report (Jonkman et al. 2015) includes a preliminary design of the land barrier and three storm surge barriers which were part of the initial flood defence system. The design showed a (locally covered) extended seawall as a preferred alternative, which will also be discussed later in this report. An initial cost estimate showed that the land barrier comprises 40% of the total costs of the coastal spine system. The land barrier is still in a conceptual design phase while other elements of the Coastal Spine system have been designed in more detail. This report presents a more elaborate design and research of the land barrier Report structure The chapters in this report match the steps taken in the design of the land barrier on Galveston Island and Bolivar Peninsula. Chapter 2 presents the basis of the design. This includes hydraulic boundary conditions, design requirements and calculations methods. A spatial analysis is included in Chapter 3. Chapter 4 shows the technical alternatives that have been developed, based on the boundary conditions from chapters 2 and 3. Subsequently, Chapter 5 summarizes other relevant investigations that have been conducted during the design phase, which clarify other aspects, related to ecological- and legal impact and the impact on the coastal system. The findings from other research may be used in the choice of a preferred design. Lastly, Chapter 6 elaborates on the choice for the preferred design and explains its pros and cons and suggestions for additional research. More technical information is included in the appendices. 5
6 2 Basis of the design The land barrier is designed based on a chosen protection level together with a required service life. The protection level corresponds to a combination of hydraulic boundary conditions that the system should be able to cope with. The level of safety is characterised by a certain yearly probability of exceedance of the conditions linked to that situation. The land barrier will be designed with a design service lifetime of 100 years and a protection level of 1/100 per year. In other words, the structure shall be able to withstand the hydraulic conditions with an average return period of 100 years. It must do so until the end of its design service lifetime. This is a common service life for soil-based flood defence structures. In this design, the barrier crest height will be designed for the combination of surge and waves. The only failure mechanism that will be designed for in this design stage is overtopping. An analysis of the overtopping limits can be found in Chapter Hydraulic boundary conditions There are several (ongoing) studies on the hydraulic boundary conditions for the Galveston Island/Bolivar Peninsula shoreline (Jin et al. 2012; Lendering et al. 2014; Stoeten. 2013; Sebastian et al. 2014). For this design, the offshore conditions are based on the most recent, Almarshed (2015). The research analysed the wave conditions for a buoy located 32 km from the Bolivar Peninsula shoreline. It concerns uncoupled wave and water level data. The assessment is based on an Extreme Value Analysis of historical data, using a Peak-over-Threshold method. Almarshed (2015) mentions the significant wave height at the buoy location for different return periods. These offshore wave conditions do not take into account any near shore effects, such as shoaling and wave breaking. Because of these effects, the nearshore conditions differ significantly from the offshore conditions. As the water depth at the land barrier is lower than the breaking water depth, the highest possible waves will not reach the land barrier with all their energy. A one-dimensional SWAN model was set-up to assess the propagation of a hurricane-induced wave. The model shows different values for the significant wave height, depending on the water depth. The table below shows both the maximum water surge and peak wave period as derived by Almarshed, and the significant wave height which results from the SWAN model based on the significant wave height at the buoy and the local bottom level. Refraction and diffraction are not taken into account. An in-depth analysis of the offshore- and nearshore conditions can be found in Appendix A. Several considerations and limitations of the SWAN model are also added. The potential impact of beach erosion and other coastal sediment transport has not yet been investigated at the time of this research. Recommendations resulting from research on the coastal system should be added in a later design stage. Table 1 - Hydraulic boundary conditions for the land barrier design Buoy (32km offshore) 100m seaward At shoreline Island (100m landward) Island (>200m landward) Maximum water surge in 5.7 m 5.7 m 5.7 m 5.7 m 5.7 m Gulf* (m+msl**) Bottom level (m+msl) -16 m -1.4 m 0 m +1.5 m +1.5 m Significant wave height (H s ) 6.5 m 3.4 m 3.2 m 2.2 m 1.9 m Peak wave period (T p ) 13.7 s 13.7 s 13.7 s 13.7 s 13.7 s *Due to the design service life (100 years), the situation for 2116 is used for design. Therefore maximum water surge does include Sea Level Rise while this is not included in Almarshed (2015). Sea level rise is estimated to be 1.0m in 100 years and is based on De Vries (2014). ** MSL = Mean Sea Level, equal to 1.15 m+navd88 6
7 Protection level This design assumes a 1/100 year -1 protection level. This choice is mainly based on common practice in the US and its validity has been subject of discussion in earlier studies (Jonkman et al. 2015). These studies showed, with Dutch experience as reference, that higher protection levels could be economically desirable. Further research towards the economically optimized protection level has not yet been conducted and is highly recommended. As an indication of the impact of a different protection level, Almarshed (2015) provides the extreme storm surges and significant wave heights for different return periods. Table 2 - Extreme storm surges and significant wave heights for different return periods (Source: Almarshed (2015)) Return period Extreme storm surge Extreme H s (32 km offshore) (years) [m] [ft.] [m] [ft.] m 6.9 ft. 4.7 m 15.4 ft m 13.1 ft. 6.2 m 20.3 ft m 15.4 ft. 6.9 m 22.6 ft m 18.4 ft. 7.6 m 24.9 ft Overtopping The table below shows several limits for the mean discharge over seadikes and seawalls. Generally, dikes in the Netherlands and New Orleans are designed for overtopping rates of 1 to 3 l/s/m. For this location, a higher overtopping rate seems more suitable, as the Galveston Bay is sufficiently large store this overtopping volume and water which enters through a small breach. Furthermore, a large part of the risk of flooding is prevented when the forerunner does not enter the Galveston Bay. Therefore, an overtopping rate of 50 l/s/m, which could lead to progressive erosion of the embankment, is allowed in this case. This is applied for both the land barrier on Galveston Island and Bolivar Peninsula. To provide insight into the required dimensions of an overflow resistant barrier, the 200 l/s/m and 600 l/s/m cases, which require additional measures at the inner slope are also presented. Table 3 - Limits for overtopping for damage to the defense crest or rear slope (modified from Eurotop, 2007) Hazard type and reason Mean discharge (l/s/m) Mean discharge (ft 3 /s/m) Limited damage to inner slope (fully retaining barrier) No damage to crest and rear face of grass covered embankment of clay Limited damage to crest and rear face of grass covered embankment of clay No damage if crest and rear slope are well protected Extreme overtopping, major damage is accepted after a 1/100 yr -1 storm. Additional measures required for drainage on rear side Design formulas For the seadike calculations the TAW2002a overtopping method is used, see Rock Manual section pages (CIRIA, 2007). The vertical wall calculations are based on Design overtopping of Seawalls; Design and Assessment Manual (HR Wallingford Ltd., 1999). 7
8 2.4. Concluding remarks The design will be based on the hydraulic boundary conditions and overtopping rules stated above. The following considerations should be kept in mind: The amount of water that can be stored in the Galveston Bay before any inconveniences occur, depends on the total flood defence system. The allowable overtopping limit ( which is directly linked to the height of the barrier) can therefore be varied depending on different region-wide flood defence systems. From the hydraulic boundary conditions and the design service life, it can be concluded that the Galveston Seawall will need to be raised to be able to provide the same level of protection. Both the hydraulic boundary conditions and the chosen protection level are based on several assumptions which need additional research. The presented numbers are a reasonable approximation of research done on the 1/100 per year storm conditions. Future changes in hydraulic boundary conditions could lead to other potential alternatives and recommendations. 8
9 3 Spatial analysis The majority of the project area s shoreline is developed, though currently without flood protection infrastructure. The land barrier will have to be fitted in the existing spatial context, which might interfere with current land uses, e.g. the many residential areas along the shore. The spatial configuration and character varies strongly along the shores of the research area. The Galveston Island and Bolivar Peninsula shoreline is interspersed with buildings and infrastructure, although there are open stretches to be found as well. This section provides a better insight in the spatial context of the potential locations for the land barrier. A series of typical cross sections is explored, each of which is representative for one or more stretches along the shore. Ultimately, two specific design cross sections are identified for further use in the technical design of the land barrier Spatial structure of the project area Galveston Island Galveston Island is linearly shaped and enclosed by the Gulf of Mexico and West Bay. The city of Galveston is the main urban area of the island and is connected to the mainland through the interstate-45 bridge. The rest of the island is disclosed by FM3005 (San Luis Pass Road) that runs over the island s shores in parallel with the coastline from Galveston to the San Luis Pass in the east. Here a second bridge connects the Galveston Island to Follets Island and Freeport. The various residential areas along the island are connected to the City of Galveston through this main traffic artery. Galveston city has its own typical seafront in which the Seawall separates the city from the beach and the sea. This is different from the non-urbanized part of Galveston Island, where properties have been placed close to the beach. Most of this side of Galveston Island s shoreline has been developed with holiday beach homes, which are organized in communities. On the bay side, long stretches of natural marshes are found sparsely built with holiday homes as this side of the island is far less developed. In general the open landscape is uncultivated, several (state) parks can be found on the island. Bolivar Peninsula Bolivar peninsula is less populated and less developed compared to Galveston Island. It is somewhat secluded as it only has a road connection to the mainland on the northeast and a ferry connection to Galveston Island. The peninsula is wider than Galveston Island and is characterized by its undeveloped plains and marshes, long-stretched beach and small communities like Port Bolivar, Chrystal Beach, Gilchrist and Caplen. The residential areas are lined up along the beach or Galveston Bay and East Bay on the other side of the land mass and are connected through State Highway 87. The population density in these communities is relatively low, and the properties have lower value compared to those on Galveston Island. 9

10 3.2. Characteristic cross sections Figure 3 - Stretches represented in the characteristic cross sections The shores of Galveston Island and Bolivar Peninsula can roughly be structured in four typical spatial configurations. For each of these types the organization of infrastructure, buildings and geographic characteristics sets a distinct spatial context for the design of the land barrier. The sections represent multiple stretches along the shore. Figure 3 indicates where stretches of the representative cross sections are located within the project area. The following paragraphs discuss the four characteristic cross sections. In Appendix B, two possible infrastructural plans are mentioned for cross sections C and D: The first with a single two-way road and the second with separate roads. Cross section A is also divided in two possibilities, based on road placement. In all instances, a double road will leave more space for placement of a flood defence structure. This means that the single road infrastructure plan will be more critical and will therefore be used as representative for their respective configuration. 10

. As the area is absent of buildings, trees or large sized shrubbery, people experience a panoramic view of the island including the beach when driving on the road.")
11 A. Road in open landscape Figure 4 - Characteristic cross section: Road in open landscape Section A comprises the undeveloped areas along the shore, and comes in two sub-types. In type A1 the beach and dunes continue relatively far inland. The open landscape comprised of low dunes (south of the road) and plains (north) is crossed by the main road, which is located at a relatively large distance from the shoreline ( m or mi). As the area is absent of buildings, trees or large sized shrubbery, people experience a panoramic view of the island including the beach when driving on the road. This cross section is representative for some small stretches of Galveston Island and Bolivar Peninsula. Type A2 is only found on the shores of Bolivar Peninsula, at the eastern edge of the project area near High Island. In this section, the main road runs directly along the shoreline, over the dunes, secluding the beach from the hinterland. The seclusion is caused by both a lined ditch along the northern edge of the road is, as well as Jersey barriers along the beach-side to the south of the road which limits the entrance to the beach. The Jersey barrier line is opened every m ( mi) for traffic to enter. From a spatial perspective there are no elements in these sections that constrain the land barrier s footprint. The width of the main road varies between 10 13m (33 43ft.). The road s parcel width is approximately 30m (100ft.). B. Galveston Seawall Figure 5 - Characteristic cross section: Galveston Seawall The Galveston Seawall runs directly in front of Galveston city in a continuous stretch of approx. 16 km (10 mi). Although the seawall itself is uniform, its character can best be described in three sections west, centre and east. The seawall s western section runs in front of Scholes international airport from San Luis Pass road to 61 st street. It is constructed directly in the shoreline, in direct contact with the Gulf of Mexico without the presence of a beach. The seawall s crest holds Seawall Boulevard, a wide city road of about 30m (100ft.) that runs along its complete length. 11
12 Moving further eastward from 61 st street, groins are constructed every 300m (1000ft.), retaining sand to form a small beach of approx. 35m (115ft.) wide. The seawall is partly covered but still visible, protruding 2m (6ft) above the beach. On the northern side, the Seawall Boulevard is lined with hotels, restaurants and shops which benefit from the attractive view over the Gulf of Mexico, the beach and the Galveston Island Pleasure Pier. Only sporadically some palm trees are found along the northern side of the boulevard, whilst there is only little greenery found along its complete stretch. The properties along the Boulevard are constructed at level. As a connection between the Boulevard and Galveston s grid street plan, the landscape s elevation is pitched downwards until it reaches mean ground level after 100m (330ft.) from the seawall crest. Further to the east, the seawall diverts from the shoreline, directed more to the island s centre until arriving at Bolivar Roads where they abruptly end. As the seawall retracts from the shore, the beaches grow into a large spit, holding East Beach/Appfel Park, a popular tourist destination, and some large hotels. C: Narrow residential corridor Figure 6 - Characteristic cross section for C: Narrow residential corridor There are several locations where properties have been developed directly along the shore. In this section C, the main road is typically situated at about m ( ft.) from the shoreline. The area between the shore and the main road holds several houses, typically organised in one or two parallel rows along a secondary road. A small dune separates the houses from the beach, enabling home owners to walk directly from their property onto the beach. The width of the beach and dunes, measured from the shoreline to the parcel line of the adjoining properties varies between 15-50m (50-160ft.). The beach houses are elevated by concrete or wooden piles. Typically the shore side properties are larger than the houses on the northern side of the main road. In this cross section the northern side of the main road can be either developed or undeveloped. Developments on this side of the main road mainly consist of communities that can span the entire width of the island from the main road to the bay side. Jamaica Beach is a good example of such a community. The public area in this cross section is limited to the beach and the main road s parcel. The many private properties and associated parcels bring considerable restrictions to the land barrier s footprint. This cross section is mostly representative for stretches along Galveston Island, but can sparsely be found on Bolivar Peninsula as well. 12
.")
13 D: Wide residential corridor Figure 7 - Characteristic cross section D: Wide residential corridor Cross section D is the second section which shows properties directly along the shore. Contrary to section C, the main road is located at a significant distance from the shoreline, typically between m ( ft.). The intermediate space houses small residential communities arranged along perpendicular secondary roads, which are occasionally connected to the main road. Some of these secondary roads give access to the beach. The properties vary in size; the largest are placed nearest to the shore, the smallest closer to the main road. Most properties are typical beach houses which are raised on piles. The width of the beach and dunes varies from m (65-130ft.), measured from the shoreline to the outer parcel line of the local properties. This cross section is the most common form of development on Bolivar Peninsula, but also representative for several short stretches along Galveston Island. Share of cross sections along complete stretch The following table holds the length and the relative share of the presented cross sections for the complete project area. It shows that both land masses are a mix of cross section types. However, on Bolivar Peninsula cross section D is mostly present. Also, on Bolivar Peninsula there are no double main roads present and a large portion consist of open landscape, which is easy to design for. On Galveston Island, the variation is much larger. Here, a large percentage consists of Galveston Seawall and open landscape. The rest of the island can best be represented with cross section C: Narrow residential corridor. There are also parts with an inland road, but these are easier to design for, as they have double roads. Table 4 - Amount of km/miles per cross section on both Galveston Island and Bolivar Peninsula Galveston Island Bolivar Peninsula Total km mi % km mi % km mi % A1 Single road in open landscape - inland A2 Single road in open landscape - shore B Galveston Seawall C Narrow residential corridor D Wide residential corridor Total
14 3.3. Selection of cross sections for technical design Section A: Single road in open landscape will require special attention concerning its integration in the local environment. However, it does not seem to bring any large spatial restrictions on the design of the land barrier. Sections C and D prove to be more challenging, as they bring several spatial constraints for the land barriers footprint to the table. Both sections are therefore selected as design cross sections. The typical sections are made specific by selecting two actual cross sections along the Galveston Island and Bolivar Peninsula shore. Their exact locations are indicated in Appendix B. Section B, the Galveston Seawall, is not taken into account in this design as a barrier is already present here. This requires a more specific solution which is beyond the scope of this design work. Two design cross sections The land barrier design focuses on the two most challenging cross sections, in the previous paragraph noted as C: Narrow residential corridor and D: Wide residential corridor. The difference can be seen in the detailed parcel map. This shows that for both occasions, the single road requires less space in terms of parcel width than the cross section with two separate roads. For the construction of the dike, it is preferred to use public parcels, as these are already government-owned and no further buy outs are needed. Therefore, if the parcel of the main road is to be used for the construction of the flood defence, the situation with a single road is more problematic. Here it is more likely the flood defence will be partly constructed on a private parcel. If this location is used, all flood defence alternatives that can be placed in the single road alternative are also feasible in the double road alternative. Figure 8 Design cross section C: Narrow residential corridor single main road This cross section shows a single house facing the beach and sea, including its parcel, along a secondary road and a single main road. The beach is relatively wide, and the small dunes are part of the private property. Behind the main road, mainly housing and open land is present. Figure 9 Design cross section D: Wide residential corridor single main road The design cross section is shortened as the distance between the shoreline and the single main road is large. Both the profile of the beach and the main road is small. Interesting is the large distance between the coast and the main road. Use of public parcels will be more problematic than in the design cross section C, because the public parcel at the beach is much smaller and the main road is located at the bayside. Behind the main road, mostly open lands are present. These cross sections will be used in the next chapter as the blueprint for flood defence system design. 14
15 4 Land barrier alternatives This chapter discusses the different alternatives for the design of the land barrier. Because of the length of coastline along Galveston Island and Bolivar Peninsula, a land barrier placed on both land masses will have a major influence on the flood safety of the entire Galveston Bay Area. A major challenge for the design of the land barrier is the exact location: either on the beach or at the road. The available footprint on Galveston Island and Bolivar Peninsula has already been mentioned in Chapter 3. Another challenge is the way the coastal spine is closed; e.g. the connections to higher grounds on the mainland. This leads to a barrier length that optimises flood safety for the entire region while minimizing costs and environmental interference. Two cross sections will be addressed in this chapter: Cross section C: Narrow residential corridor and Cross section D: Wide residential corridor, as discussed in section 3.3. Extended Seawall Earlier reports already described the land barrier conceptually (Janssen et al. 2014), most recently in the Coastal Spine report (Jonkman et al. 2015). This design showed challenges and opportunities of several structural solutions. A seawall emerged as the preferred alternative. This was based on the requirement that its height was limited to the Galveston Seawall level of 5.2 meters (17 ft.). It would be easier to fit a concrete seawall with the same crest height, constructed as an overtopping-proof structure. In the current design it appears the height constraint of 5.2 meters is problematic, as the expected water level (including Sea Level Rise) is already above this elevation. To be able to withstand the adjusted boundary conditions as presented in chapter 2 the (covered) seawall would require to be raised significantly. This is very detrimental in terms of costs. A seawall (and other, more innovative, solutions) were evaluated during early stages of this design. However, these alternatives were considered unsuitable in terms of construction- and maintenance costs, spatial quality, flexibility and environmental impact compared to both the Coastal Dike and the Inland Dike. The main focus of the land barrier design is therefore a dike alternative. More information on the comparison with the other alternatives can be found in Appendix C Technical design for Cross section C: Narrow residential corridor The first cross section that will be covered in the technical design is cross section C: Narrow residential corridor, which has the infrastructure running close to the seashore and housing mainly on the bay-side of the road. Chapter 3 showed that the cross sections are divided in public and private parcels. As the influence and cooperation of home owners still unknown, the private parcels are ideally avoided. This shows two options: either constructing the barrier on the beach parcel or the public road parcel. These options can be seen in Figure 10. Both barriers are designed for a mean overtopping volume of 50 l/s/m. Other boundary conditions and design formulae are mentioned in Chapter 2. The overtopping calculations are added in Appendix D Figure 10 C: Narrow residential corridor cross section with both possible locations: Coastal dike on the beach (green) and Enforced Highway FM3005 (Blue) 15
16 Table 5 Required crest height coastal dike on beach and enforced highway FM3005 Mean overtopping discharge (l/s/m) Coastal dike on beach Enforced Highway FM3005 Crest height [m] [ft.] Crest height [m] [ft.] 1 MSL+11.6m MSL+38 ft. MSL+10.0m MSL+33 ft. 10 MSL+10.0m MSL+33 ft. MSL+8.7m MSL+29 ft. 50 MSL+8.8m MSL+29 ft. MSL+7.8m MSL+26 ft. 200 MSL+7.9m MSL+26 ft. MSL+7.0m MSL+23 ft. 600 MSL+7.1m MSL+23 ft. MSL+6.4m MSL+21 ft. Coastal dike on the beach The entire coastal dike is to be constructed beyond the private parcels. This dike needs a lot of material. Figure 10 shows that a dike has to be constructed with a crest height of 8.8 m (29 ft.) and a berm at the surge level of 5.7 m (19 ft.). The coastal dike brings opportunities to incorporate secondary functions or features such as dunes or integration with residential areas, although this complicates the design as well. A very important side note is the impact on the coastal system. The barrier is built out in the Gulf of Mexico, which will most likely cause (extra) erosion and large nourishment costs to maintain. More information can be found in Chapter 5.3. Enforced Highway FM3005 Technically the most feasible solution is the construction of the dike at the current location of Highway FM3005 across Galveston Island. The width of the road varies between 34 meters (110 ft.) and 62 meters (200 ft.). This limits the effective construction area and probably requires (parts of) private parcels to be raised, because the footprint width probably exceeds the public parcel width. A location further back from the sea means that waves are damped by the shallowness of the island. This results in a lower impacting wave on the barrier and subsequently a lower crest height is necessary. A raised main road is also a safer road during a surge event, as it will still be accessible during a storm, except for the most critical part of the storm. Therefore, safer evacuation is possible than on a road on ground level. Also, it is relatively easy and safe to construct. Downside of a barrier further inland is the fact that houses in front of the dike remain unprotected, although the presence of the barrier prevents large-scale flow towards the bay and the scour at the foundation piles that result from it Technical design for cross section D: Wide residential corridor The second cross section is cross section D: wide residential corridor, where the main road runs at the bayside of the islands and most of the houses are built between the road and the sea. This cross section is predominantly featured on Bolivar Peninsula. For this cross section two barrier locations are possible: at the beach and inland. Just like for cross section C the inland alternative leaves the houses between the sea and the dike unprotected. Both options are shown in the figure below. Figure 11 D Wide residential corridor cross section with both possible locations: Coastal dike on the beach (green) and Enforced Highway SH87 (Blue) The figure shows that the distance between the sea and the road is larger in comparison to cross section C; 535 m (1750 ft.) versus 144 m (470 ft.). The shallowness the waves have to cross before reaching the barrier is even greater than for cross section C. This results in a lower design crest height. See Table 6. 16
17 Refer to appendix D for the overtopping calculations. The available space for a coastal barrier is significantly smaller than for cross section C as the private parcels are closer to the shoreline. Table 6 Required crest height coastal dike on beach and enforced highway SH87 Mean overtopping discharge (l/s/m) Coastal dike on beach Enforced Highway SH87 Crest height [m] [ft.] Crest height [m] [ft.] 1 MSL+11.6m MSL+38 ft. MSL+9.3m MSL+31 ft. 10 MSL+10.0m MSL+33 ft. MSL+8.2m MSL+27 ft. 50 MSL+8.8m MSL+29 ft. MSL+7.4m MSL+24 ft. 200 MSL+7.9m MSL+26 ft. MSL+6.8m MSL+22 ft. 600 MSL+7.1m MSL+23 ft. MSL+6.4m MSL+21 ft. Coastal dike on the beach Just like for cross section C the entire coastal dike is to be constructed beyond the private parcels. The coastal dike protects all houses at the coast. The beach parcel is slightly smaller than for cross section C, which places the coastal barrier further seaward. This makes it more expensive. Because the coastal barrier will have to be placed further out into the sea, the impact on the coastal system will be even stronger and more material will be required. Enforced highway SH87 Because of the small beach parcel, the option where a dike is placed at the main road will be significantly cheaper. The long distance between the sea and the dike also means that waves are smaller and a relatively low dike height is sufficient to ensure its task to protect the hinterland. The obvious downside is the fact that the dike does not protect the houses between the beach and the road. However, nothing changes for the residents. They keep their view on the sea and they are in as much danger of flooding as they were before construction of the dike, although safe evacuation is easier. In this cross section, the difference in amount of people unprotected is higher Summary of alternatives and concluding remarks In this chapter, several options for a land barrier are presented as part of the coastal spine. All of these alternatives protect the hinterland against the destructive power of hurricane induced storm surges. These are listed in the table below. Table 7 Summary of alternatives (Allowed overtopping: 50 l/s/m) Cross section C. (Galveston Island) Cross section D. (Bolivar Peninsula) Alternatives Coastal barrier at MSL+8.8m Coastal barrier at MSL+8.8m Inland barrier FM3005 at MSL+7.8m Inland barrier SH87 at MSL+7.4m Figure 12 - cross sections of a Coastal dike and an inland dike (shown above is inland barrier FM3005) 17
18 The differences between the Coastal Barrier and the Inland barrier are summarized below: The coastal barrier does not interfere with private property, while an inland barrier requires local solutions to avoid the (partial) use of private parcels An inland barrier can be constructed with a lower crest, using less construction material, Furthermore, as the inland barrier can be constructed in the dry cheaper construction materials can be applied. A coastal barrier interferes with the coastal system Influence into the coastal system will lead to more maintenance, either at the land barrier itself, but more likely at the ends. Coastal placement protects all houses on the islands, while inland barrier leaves people on the shore side vulnerable With placement at the road, some houses will keep their panoramic view on the beach. The road on top enables inhabitants on the other side of the barrier to enjoy the view as well. Placement at the road will increase the possibility of safe evacuation Maintenance of the inland barrier can potentially cause hindrance at the road. The following remarks should be kept in mind: Most of these differences depend on the corresponding hydraulic boundary conditions are mentioned in Chapter 2. Alteration of these conditions, would lead to different dike cross sections and crest heights. The results as mentioned above are sensitive to the allowed overtopping. Examples of the sensitivity are shown earlier in this chapter. The allowable overtopping rate can be optimized further, although larger rates will require much larger revetments, which will be harder to include in landscape design and land use planning. The land barrier will have an impact on the living environment of the inhabitants. Sometimes it has to be (partially) constructed on private parcels. The owners of these private parcels probably have a high influence when it comes to decision making. The land barrier design allows for customization on a local scale, for example the construction of a seawall or movable/temporary barrier (see below). These options are not further investigated in this research. Additional modelling on the impact of different land barrier ends on the resulting flood risk reduction is required to enable a cost- and risk optimized land barrier design. Following from the calculated barrier crests, it appears that the height of Galveston Seawall is insufficient. This is based on the new hydraulic boundary conditions, which show an expected surge height above the current crest and the wish to limit the overtopping rate. This means the Seawall will also need to be raised if the same assumption would be used as for the land barrier. The design of the Seawall has not been considered in this report. More study is required to assess the existing structure and determine whether additional strengthening is required. Several innovations are being developed worldwide or already in place that could be interesting alternatives to the dikes. A possibility is a small dike in front of the houses with a moveable or temporary barrier on top of it. These are deployed during storms. Such solutions are probably too expensive to use on the entire island, but could be a possibility for special cases along the stretch of the coastal spine. Examples are the temporary barrier used in Central Europe or the Tsunami Barrier, which is still in development phase (Hofland et al., 2015). 18
19 5 Environmental considerations The land barrier will have a major influence on its surroundings. The design should therefore strive to incorporate as many viewpoints and other demands and wishes in the early design. This can prevent avoidable resistance and restrictions further along the way. This chapter will shed some light on the design from other, non-technical angles. In Chapter 5.1 and 5.2, the Environmental- and Legal considerations will be mentioned, mostly based on Blackburn et al. (2015). In Chapter 5.3, Dr. J. Figlus (Texas A&M University, Galveston) will elaborate on the coastal system and the effect on the land barrier design Ecological considerations When considering the environmental effects of a potential flood defence system, of which the land barrier will be a crucial piece, first the environmental effects of neglecting the risks will be clarified: The storm marked as the 1/100 year -1 storm by SSPEED Center (which differs somewhat from the 1/100 year -1 storm assumed in this report) will result in much higher water levels in the Galveston Bay as was experienced during Hurricane Ike in The Houston Ship Channel will experience 7.6 m (25 ft.), which is 3.7 m (12 ft.) higher than during Hurricane Ike. The economic and ecological damage of such a storm will most likely be more severe as well. A 7.3 m (24 ft.) surge in the HSP is estimated to result in 340 million litres (90 million gallons) of crude oil spilling in the nearby area and the Galveston Bay, one of the country s most productive fish and shellfish nurseries. For comparison, during the BP Deepwater Horizon oil-spill, around 800 million litres (210 million gallons) of crude oil spilled. (SSPEED, 2015) As put by Blackburn et al. (2015): The damage caused could easily become the worst environmental disaster in U.S. History. These points illustrate the importance of a region-wide solution. The problem is that a (structural) solution in the form of a network of storm surge barriers and land barriers will also have a major impact on the ecology of the entire Galveston Bay Area. A storm surge barrier may limit the flow of salt water into the basin, disrupting the brackish environment that supports the many special forms of wildlife. Although no major influences on the marine wildlife are expected (after all, the barrier will mostly be placed on land), the impact of a potential barrier at the coast can influence the sediment transport. The type of sediment varies locally depending on the source of the barrier material. When material is brought from outside the current bay environment (sand is in short supply), this will locally change the sediment structure. As clay from the bay is mentioned as a potential source for the land barrier core, this will most likely cause no problems, although the removal of this clay will have a temporary impact on the wildlife inside the bay. There are a few endangered species in the region. Various species of sea turtle use the beaches and bay shorelines for nesting. In the long term, this impact will probably be negligible as long as a beach is present, but the construction period could cause issues, should this include alteration of the coastline. Another endangered species is the Piping plover, which is a bird species that houses at the western- and eastern ends of both Galveston Island and Bolivar Peninsula. Altering the living environment of either the sea turtles or the piping plovers is protected under strict law, which is described in section 5.2. The Galveston Bay is also a crucial location for migratory birds when they migrate between North America and Mexico. The birds are attracted by the Galveston Bay because of the rich feeding grounds which are essential on their route to their summer or winter habitat. Commercial fishing and shell fishing are both important economic activities in the Gulf of Mexico. The wetlands along the Gulf coast are crucial for these types of fishing as about 97% of these species need these wetlands at some moment during their life span (Colbert, 2014). 19
20 When it comes to flood protection, non-structural solutions are preferred. By using nature-based solutions and using smarter land use planning, flood risk can be reduced while minimizing environmental impact. By adjusting the land use of flood-prone areas towards more environmental uses, e.g. farming or ranching, the residual flood damage can be limited and more nature-friendly solutions for to mitigation can become feasible (Blackburn, 2015). When designing a flood defense system, the added value of a solution that minimizes the ecological impact or even enhances the local ecology (e.g. a sand engine, natural wave mitigation) should be taken into account Legal considerations The land barrier will have a large impact on the appeal, the environment and the land use of the islands and around it. Because of the scale of the solution and the fact that there are no current flood defences in place, it is important to look to the legal aspects. Not only for to prevent the project from being closed down, but also because of the probable need for federal funding. These considerations have also been mentioned in Blackburn et al. (2015), on which the following points are based: The need of federal funding will require a closer look towards the Water Resource Development Act (WRDA), which has a central role as a guideline for the views of the federal government towards water related projects of this kind. A recent revision of this act stated its focus towards healthy, resilient ecosystems, sustainable economic growth, avoidance of unwise use of floodplains and flood-prone areas, mitigation of threats to public safety, fair treatment and the use of a watershed approach. This shows a change in the viewpoints of the federal government from purely economic towards an approach that requires the integration of social- and ecological effects. Understanding and explaining these effects will require substantial additional research. Another law that can have a large influence on the project is the Endangered Species Act. This law protects the living environments of species listed as threatened or endangered. A governmental agency is not allowed to jeopardize the continued existence of a listed species. The ESA has a great influence and is able to slow or terminate water-related projects. The existence of endangered species in the area will need to be mapped and by taken into account during design. Many different permits are required on both state- and federal level. This must be kept in mind, as federal environmental laws often reflect values not necessarily shared by local or state elected officials or by many of the residents in the area (Blackburn 2015). For example, this could lead to certain adjustment, needed for obtaining federal funding, being rejected for local permits. A clear statement of the choices and the underlying arguments is necessary. In the U.S., and Texas in particular, the individual homeowner has extensive power on the usage of their land. It must be assumed that it is impossible to force the owner of an individual private parcel to adjust or sacrifice (parts of) their land for the good of flood safety for the Galveston Bay. The solution comes in two parts: First of all, private parcels should be avoided when possible. Secondly, a clear and unambiguous message should inform the inhabitants on the necessity of the flood defence system, before the next hurricane does. Although this is only a small sample of the complicated legislation, laws and considerations for the project, it shows a trend that could help in future decisions. The land barrier location, the desired source of funding and the overall impact on the ecology and economy of Galveston Island and Bolivar Peninsula can significantly delay the project or not, depending on whether the requirements are taken into account early on Coastal system By Dr. J. Figlus. Assistant Professor, Department of Ocean Engineering, Texas A&M University, Galveston Galveston Island and the Bolivar Peninsula separate Galveston Bay from the Gulf of Mexico (GoM) and are part of the upper Texas coast which extends from Sabine Pass at the Texas-Louisiana border to San Luis Pass at the southwestern end of Galveston Island. The Galveston Island and Bolivar Peninsula unprotected 20
21 shoreline is retreating at moderate rates between 0.6 to 2.0 m/yr with some portions of Galveston s West End near the western end of the seawall retreating at rates higher than 2.0 m/yr (Pain et al., 2012; Gibeaut, 2011) whereas the portions protected by the seawall can be considered stable. Both ends of Galveston Island and the western end of the Bolivar Peninsula are accreting at rates up to 5 m/yr. If the trend observed over the last 50 years continues, the area could see approximately 68 cm or relative sea level rise over the next 100 years. The geologic framework of the area coupled with human intervention has produced a sand-limited coastal zone, consisting only of a thin sand veneer perched on a mud substrate, with minimal new supply entering the system (Frey et al., 2014). On average, the sediment in the nearshore zone is made up of sand (84 %) and fines (16 %). The coastal sand residing in the system is very fine with a median diameter around 0.15 mm (Frey et al., 2014). Offshore sediments outside the active surf zone along the coastline are largely mud-dominated but some limited pockets of beach quality sand exist (White et al., 1985; Siringan and Anderson, 1994; Anderson and Wellner, 2002; Finkl et al., 2004; Williams et al., 2012). Offshore beach quality sand is mainly contained within sand banks like Heald Bank (55 km offshore) or Sabine Bank (110 km offshore) with an estimated 585 million cubic meters and 1.2 billion cubic meters of material, respectively (Morton and Gibeaut, 1993). The general direction of net longshore sediment transport along most of the northern and central Texas coastline is to the southwest (Hall, 1976; Mason, 1981) but a divergent nodal zone (reversal in net direction) is present in the vicinity of the western portion of the Galveston seawall. East of this region net sediment transport is in a northeasterly direction toward the entrance of the Bolivar Roads ship channel (King, 2007; Morang, 2006), whereas west of the nodal zone net transport is directed toward the West End of Galveston Island and San Luis Pass (Frey et al., 2014). Most dramatic changes in morphology and sediment transport are experienced during extreme events such as tropical storms or hurricanes. These events redistribute sediment and often provide the only source of material to allow for barrier island transgression via roll-over mechanisms. Things to keep in mind for the design of the land barrier: The structure will be located on a transgressive barrier island, parts of which are fortified (Galveston seawall) and parts of which are not (Galveston West End, Bolivar Peninsula). The design needs to be able to address potential erosion issues. Surface sediments are mainly fine sands but they are perched over clay substrate sometimes already found at 1m depth only (or even as outcrops on the surface). Sand and clay do not follow the same sediment transport formulations. The system is sediment starved, or at least limited, due to the reduced introduction of new sandy sediment into the system. That means the persisting background erosion will likely continue or increase in the future and will have to be combatted with frequent re-nourishment efforts. The area has one of the largest subsidence rates in the country due to extraction of oil, gas, and water and the composition of the local soil. This leads to accelerated relative sea level rise that needs to be accounted for in the design. On a local level differential settling may also cause issues that need to be addressed through adequate design considerations. Sand resources are limited and/or expensive, but clay material can be obtained locally at a fraction of the cost of sand. The continental shelf is very wide (~ 200 km) and beaches have very shallow slopes (1/30 1/50). During storm surge events this may lead to extended periods of high water levels due to pronounced fore-runner surges. The land barrier needs to be adequately designed to prevent piping and wash out of material resulting from landward directed seepage flow. The general geometry of the coast (slope, profile) should be maintained to avoid excessive increase in background erosion rates. This means a barrier on the beach would need to be accompanied by extensive nourishment efforts to provide enough space for the footprint of the barrier where necessary. 21
22 6 Land Barrier preliminary design The main objective of this research is provide insight into the main dimensions of a land barrier, located on Galveston Island and Bolivar Peninsula, able to significantly reduce the flood risk of the region around the Galveston Bay. In Chapter 3, the land use of both Galveston Island and Bolivar Peninsula is represented by four characteristic cross sections. Two of these cross sections were labelled as the most challenging and were therefore selected for the land barrier design. Several designs for these cross sections are elaborated in Chapter 4. This chapter presents and explains the preferred design. The choice for the preferred design is mainly based on a cost estimate (section 6.4) and the findings of the Land Barrier design workshop, held at Delft, the Netherlands with a variety of experts. During this workshop, the design alternatives were reviewed and compared. The findings of the workshop can be found in Appendix C: Comparison of Alternatives. The considerations from the workshop were combined with a cost estimate to come to the preferred design, which is presented below Land Barrier overview This section shows a first look at the preferred land barrier design. This mainly concerns the location and sort of barrier. A more detailed look at the technical cross section and the landscape design can be found in sections 6.2 and 6.3 respectively. Lastly, a cost estimate is included in section 6.4. Location On both Galveston Island and the Bolivar Peninsula, the current location of the main road (FM3005 and SH87 respectively) is preferred over a barrier on the beach. This is based on the following arguments: The parcels are public property; this means that no buyouts are required. This is also true for a barrier at the coast, but any other location would run into major issues concerning property rights. The footprint of the barrier may be larger than the parcel width. In this case, local solutions are needed (steeper slopes or partial use of private property). The hydraulic loads are lower; because the waves break on the shallow part in front of the barrier, the barrier can be constructed lower and cheaper. This effect is stronger as the road is located further from the shore, up to a certain limit. Panoramic view on the beach remains; one of the main reasons to live on these islands is the view on the Gulf of Mexico. Contrary to the coastal barrier, some houses will keep their panoramic view on the beach. The road on top enables inhabitants on the other side of the barrier to enjoy the view as well. People can keep their direct view on the beach if they are willing to accept the risk of flooding. No influence of coastal system; A barrier location closer to the shore is more likely to influence the coastal system, which requires expensive nourishments, additional measurements and a much more expensive maintenance. An inland barrier does not have this disadvantage. Robust evacuation route; when a storm approaches, people may want to evacuate. Evacuation will become safer and will be possible for a longer time, because the road is placed on top of the barrier. Unfortunately there are some downsides to the use of this location, the most important one being vulnerability. Because of the placement of the barrier at the road, the part between the road and the shore will remain unprotected. These houses would be protected if the barrier is placed at the coast. This difference is larger at Cross section D: Wide residential corridor, where a bigger number of houses are present in the flood-prone area. Secondly, during construction and maintenance the road will have to be rerouted temporarily, probably through private terrain. However, in both cross sections the upsides of public property, cheaper construction and maintenance, partially remaining view, less influence of the coastal system and better evacuation are assumed to outweigh these issues. 22

23 Selecting a preferred alternative comes down to the question whether local decision makers are willing to invest a large additional sum of money to place a barrier at the beach in order to protect all houses on the islands. The alternative is to construct the more cost-effective barrier at the road, which leaves some houses unprotected, but does not affect coastal morphology. In case the latter is chosen, a lot of money can be saved, but some issues of interference with private parcels and private property need to be solved by custom-made solutions. Barrier type The barrier will preferably consist of a soil-based dike with a natural cover. The dike has a clay core, which is easily accessible and relatively cheap to obtain. To remain stable under hydraulic loading, the clay core has to be protected with a revetment. The revetment is assumed to consist of a large armour layer, because of the large waves hitting the dike. Whether this option is preferred over other forms of revetment (e.g. asphalt, concrete), requires additional research. More information on the cross section can be found in section 6.2. Figure 13 - Layered cross section of dike-in-dune concept for the preferred design This soil-based dike has been chosen instead of a concrete and steel structure, like the Galveston Seawall. Although this kind of barrier will most likely have a smaller footprint, its non-natural appeal and sharp separation of the landscape are clear drawbacks of the seawall-like structure. The seawall has been evaluated during the land barrier design workshop and compared to the soil-based barriers. This comparison can be seen in Appendix C. 23

24 6.2. Technical design The land barrier consists of a clay core, with a rock revetment to ensure the barrier s stability under wave attack. A cosmetic sand cover layer gives the barrier a more dune-like appearance. The barrier is designed for a maximum mean overtopping volume of 50 l/s/m. Refer to Appendix D for the overtopping calculations. A technical cross section of the preferred land barrier design at the FM3005 (Cross section C) and at the SH87 (Cross section D) can be seen in Figure 14. Figure 14 - Cross section for inland barrier at section C (FM3005, Galveston Island) and section D (SH87, Bolivar Peninsula) For aesthetic reasons, it is undesirable to implement a large man-made structure with rock layer in such a natural environment. Therefore, a dike-in-dune concept is preferred where the rock layer is hidden beneath a natural-looking cover of sand and small vegetation. This layer will not have to be thick (1-2m; 3-6ft.) and does not have any flood protection responsibilities. When a (near) design storm hits, this layer will be damaged and will need repair or replacement. Because this will probably happen with a large interval, the additional costs can be considered acceptable, due to the upside of a natural look and an assumed larger acceptance from local stakeholders. Revetment design Using the hydraulic boundary conditions as stated in Chapter 2, some initial calculations were performed to assess the required revetment dimensions. The composition of the revetment is shown in Figure 15. Figure 15 Revetment composition for a clay core barrier (Rock Manual 2007 fig 5.39) 24
25 The armour layer grading is the most costly component of the revetment. It is expected a lighter revetment is required at the inland barrier, compared to a coastal barrier due to the lower incoming waves. The required armour layer grading for all barriers is calculated using the Van der Meer formulas (The Rock Manual 2007, C683-section / CEM2002). Refer to Appendix E for an elaborated calculation. The filter layer dimensions are designed according to Rock Manual section Underneath the 2 nd filter layer a geotextile should be applied. The design of this geotextile is not included. Table 8 Armor layer dimensions Armor 1 st Filter 2 nd Filter Grading Thickness (2*Dn50A) Grading Thickness (0,5*Dn50A) Grading 45/180mm Inland dike section C kg 1,3m 10-60kg Galveston Island (Dn50A =0,63m) (Dn50F1=0,24m) 0,3m (Dn50F2 =0,09m) Inland dike section D kg 1,3m 10-60kg 0,3m 45/180mm Bolivar Peninsula (Dn50A =0,63m) (Dn50F1=0,24m) (Dn50F2 =0,09m) Coastal dike 1 1t-3t 1,8m kg 0,45m 90/250mm sections C + D (Dn50A=0,92m) (Dn50F1 =0,92m) (Dn50F2 =0,16m) 1) Revetment design for coastal dike added for comparison Thickness (0,5*Dn50-F1) 0,12m 0,12m 0,22m Here the following should be noted: An optimal composition of the revetment (armor layer, filter layer(s), geotextiles) should be designed in more detail. The paragraph concerns basic calculations, additional research is required. Alternative revetments have not been investigated (e.g. asphalt, custom elements). For a more detailed design it is recommended to take these into account. Before placing the armour elements a proper compaction of the clay core is essential in order to prevent (unequal) settlements. This compaction has not been investigated in this research. Design of toe construction is not included. Due to the required thicknesses of the armor and filter layers the cosmetic sand cover needs to be at least 2m thick. This is because the grains of sand will fill the space between the rocks 25

26 6.3. Spatial and landscape design Figure 16 - Overview of the land barrier location and the corresponding land barrier cross sections The spatial and landscape related aspects of the preferred land barrier design are discussed following the typological cross sections as explored in section 3; spatial analysis. Land barrier in open landscape The preferred design follows the main road s trajectory which in this case runs inland, away from the sea s shoreline. Local vegetation can fully overgrow both slopes of the barrier, it can be expected that both will fully be covered with grasses and low shrubs. As the road over the barrier will offer an impressive view over both sides of the island, the potential for creating viewpoints emerges, offering a new touristic feature to the area. These viewpoints could be combined with on and off-ramps from the road to the beach. Land barrier along a narrow residential corridor As the land barrier is placed behind the narrow residential corridor along the sea shoreline, the relation of the local properties with the beach and sea remains unaffected. The undeveloped plots and larger undeveloped areas in this corridor offer the potential to extend the dune landscape towards the land barrier s slopes. The barrier redefines the local spatial configuration as it walls off the sea-side properties from the main road and bay-side properties and communities. Instead the sea-side properties are now 26

27 offered a view on a large dune, which is larger as some of the smaller properties. Some properties at the first rows in the bay-side residential areas will lose their sea view. Various on and off-ramps will have to be constructed to connect the local residential areas and beach to the main road. Figure 17 - Eye level impression and cross section of inland dike Local solutions might be needed when private properties on both sides of the barrier constrain the available footprint. Next to design optimizations such as steepening the barriers slopes, there is also the possibility for the integral redesign of the area. For example; the local properties could be raised, allowing the construction of a wider dune landscape underneath. (explanatory image will be provided). As the properties value is relatively large in these sections, such an undertaking could be worthwhile. Land barrier along a wide residential corridor The main road runs relatively far inland in these sections, and thus the land barrier s position is far away from both shorelines. The barriers sandy slopes might be overgrown with grasses and low shrubs rather than typical dune vegetation. There are not many spatial constraints along these sections, and when necessary local solutions could further limit the barriers footprint to an acceptable size Cost analysis This section presents an analysis of the constructions costs of the preferred land barrier as displayed earlier in this chapter. Costs are estimated very roughly using a material based approach. Because of the early stage of design, there is a large uncertainty in the cost estimate (±50%). The following should be kept in mind: The cost estimate only accounts for the land barrier on Galveston Island and Bolivar Peninsula, from San Luis Pass to High Island. Any connections beyond these points are not included Road construction is not included Maintenance is not included Land buyouts are not included The cost estimate is done for three components of the land barrier: the clay core, the revetment and the cosmetic sand cover. A distinction is made between sections A (A1 and A2 combined), C and D, as the cost unit rates differ for the revetment. The cost estimate will assume that a dike, according to the preferred design presented in this chapter, is placed along Galveston Island and Bolivar Peninsula. This dike stretches from San Luis Pass to the Galveston Seawall and from Bolivar Roads to High Island for a total of 74 km (46 miles). For an optimized flood risk reduction, the barrier needs to be connected to higher grounds, to prevent water from running around the land barrier. This is discussed further in Chapter
28 Cost unit rates are assumed as: Clay embankment: $ 15/m 3 Revetment o Coastal barrier: $ 150/ton (grading 1t-3t, incl filter layer(s), transport, placement, etc.) o Inland barrier: $ 125/ton (grading kg, incl filter layer(s), transport, placement, etc.) Cosmetic sand cover (thickness 2m): $ 50/m 3 The cost unit rates include transportation, placement etc. Initial estimates of a kg grading from a Texas quarry amount $20 per ton (J. Figlus, personal communication ). As this does not include any filter layers and the material is not specifically suited to coastal applications, a cost unit rate of 125 $/ton is assumed. It is assumed the costs of a 1-3t grading are ~25% more expensive than the kg grading ($150/ton). The total costs for the inland barrier are USD 2.3 billion (+/-50%), which is 31 M$/km. For comparison, the total costs of the coastal barrier are roughly 50% higher at USD 3.5 billion (+/-50%) or 47 M$/km. Refer to appendix F for the cost calculation. The cost estimate for the inland barrier shows a large different with earlier estimates in the Coastal Spine report, which cost 45 M$/km 1, even though it was several meters lower (5.2 m/17 ft.). This difference can be explained by the costs of the reinforced concrete seawall and its foundation. Also, roadworks were included. In further design it is advised to assess the total Life Cycle Costs (LCC). An LCC will incorporate maintenance and all other costs during its design lifetime. This will give a much better view on the costs relative to other alternatives Land barrier western- and eastern ends The main objective of the land barrier on Galveston Island and Bolivar Peninsula is to dampen the effects of a major storm on the Houston Galveston Bay Area up to a point where it can easily be repelled with local measures. This objective has to be kept in mind when determining where the exact land barrier should be located and where it should end. Earlier modelling assumed the land barrier to be located on the entire Galveston Island and Bolivar Peninsula from the San Luis Pass in the west up to High Island in the east. However, these models showed that large portions of the natural refuges (east of Bolivar Peninsula) are heavily flooded in their role as the new route of the water from the sea to the bay. The water level in the San Luis Pass also rose significantly. The exact ending of the land barrier will have a large influence on the total project costs, as well as the overall effect of the land barrier on the flood prevention in the Bay. More detailed analysis of the possible land barrier ends on both the western- and the eastern side can be found in Appendix G. For both the ends, two realistic options are compared and the option of not building a land barrier past the already mentioned locations. They are shown in the figure below. 1 The difference is larger when totals are compared: 2.3 billion USD (land barrier design) vs 4.1 billion USD (Coastal Spine report). This difference results from the Bluewater Highway, which was included in the Coastal Spine report, increasing its length to 90 km (56 miles), compared to 74 km (46 miles) for the Land Barrier design. 28

.")
29 Figure 18 - Potential locations for the ends of the land barrier on both the western side (left) and the eastern side (right) The options of constructing an inland barrier will intervene with a natural reserve and will require the construction of another storm surge barrier. The land barrier along the coast (Bluewater HWY, CR-257) seems the best structural option, also because the estimated costs do not differ much from the inland option (1,230 M$ versus 1,080 M$ respectively 2 ). However, the relatively large distance from the bay and the rotation of the hurricanes may lead to the choice that the additional safety of any barrier west of Galveston Island does not offset the large costs. Therefore, leaving the San Luis Pass open should be considered as an option. Obviously, additional research is required to assess the impact of different options, especially regarding morphodynamics and ecology. This research should compare the difference in flood risk reduction for the different structural options, assess the economic rate of return of these extensions and decide whether the additional investment is worth it. The same choice applies for the eastern end. However, models show, combined with the rotation of the storm, that large amounts of water enter the bay through the nature reserve on the east side of Bolivar Peninsula. This strengthens the idea that a structural solution is necessary at the eastern end. As shown in Appendix G, both the inland and the coastal option have potential. The inland SH124 option is the shortest and therefore the cheapest, but runs through the nature reserve. The coastal SH87 option is more expensive, but could be used to enhance the local infrastructure and to combine with coastal solutions. However, because the shorter inland SH124 option also runs towards higher ground near Stowell, fewer measures are needed. This leads to a very significant difference in cost estimate: The 25 km SH124 inland option towards higher ground is estimated to cost around 560 M$, whereas the 50 km coastal SH87 option will cost roughly 2,250 M$. As this is still uncertain if it is possible and desired to use the SH87 land barrier as a coastal and infrastructural project (and because it is unlikely that these opportunities outweigh the large estimated costs difference), the inland option is preferred in the current design step. 2 The cost estimates are based on the costs per km from the Coastal Spine report (Jonkman et al. 2015). 29
30 7 Conclusions and recommendations This report presents the basic dimensions of a land barrier on Galveston Island and Bolivar Peninsula that is able to protect the region from major disasters. Challenge for this design is the consent and approval from all involved stakeholders such as local decision makers, inhabitants, companies, environmental institutions, etc. This report proposes a preliminary design with a clay-core dike with a natural cover, located at the current main roads (FM3005 and SH87) for both Galveston Island and Bolivar Peninsula. This option seems most suitable because of easier construction and maintenance, better evacuation and less impact on the coastal- and ecological system. This design is made for the two most challenging cross sections. To a lesser extent, these are also representative for the sections of open natural landscape. The research has indicated that the Galveston Seawall probably requires to be raised. Design of this element is, however, beyond the scope of this design work. The land barrier has a clay core, protected by a rock revetment. According to a dike-in-dune concept, the revetment will be covered by a sand layer in order to give the land barrier a natural appearance. This layer is meant to be replaced after a storm hits. A preliminary cost estimate shows that the construction costs of a 74 km (46 miles) long barrier from San Luis Pass up to High Island (excluding the Galveston Seawall) are roughly 2.3 billion dollars (±50%), which is roughly 31 M$/km. These costs may increase due to the need to connect the land barrier to higher grounds in order to prevent the water from circumventing the land barrier. Other notable conclusions are: The construction of a land barrier will have a significant effect on appearance and the activities on Galveston Island and Bolivar Peninsula. It will influence the placement, development rate and spatial planning of the urban areas on both land masses. The safer living environment may cause increased settlement, putting more stress on the special local ecology. The choice of the final location mainly depends on the wishes of inhabitants, companies and local decision makers concerning residual vulnerability. A land barrier at the roads will keep parts of the land masses (between the shore and the road) vulnerable to flooding. Building a land barrier at the current main roads will be cheaper (±50%) and will not influence the coastal system, but does fully not protect all houses on Galveston Island and Bolivar Peninsula. Given the hydraulic boundary conditions, a land barrier that exceeds the height of the Galveston Seawall is recommended. Due to the desired safety level of 1/100 year -1, combined with sea level rise (±1m, 3ft.), storm surges of up to 5.7m (19ft.) with waves of up to 3.2m (10ft.) at the shoreline can be expected. Constructing and maintaining a land barrier of maximum 5.2m (17ft.) will therefore lead to enormous overtopping rates, which is very expensive to design for. This design reveals a lot of areas where additional information is necessary before further design decisions can be taken. First, and most important, a stakeholder analysis will need to show the preferences, needs and wishes of the local inhabitants, companies, nature reserves and governments. Their willingness to cooperate and acceptance of risk is pivotal when it comes to the choice of the location, height and structure of the land barrier. A more detailed impact assessment of the land barrier on the situation of the bay is required. This should show whether the amount of overtopping is acceptable and how connections from the land barrier to higher elevations should be constructed. Other recommendations are stated below. 30
31 recommendations In order to come to a final design that incorporates all viewpoints, wishes and opportunities, more research is needed. The following points require more attention in future research: Overall design The design safety level is currently based on experience and common use. Further optimization of the protection level is highly recommended, also taking into account the uncertainty of the hydraulic boundary conditions. This can be done based on a so-called cost benefit analysis or economic optimization. In such an approach the additional costs of better protection vs. risk reduction benefits are considered and optimized. Criteria for risk to life can also be considered as a basis for design. A risk model needs to be developed to support this process. There are several different parties working on the hydraulic boundary conditions, either based on historical data or fictional storms. In order to be able to assess and compare all solutions as objective as possible, it is recommended to compute a single set of hydraulic boundary conditions for different protection levels. There is insufficient knowledge of the coastal system and the potential effects of a land barrier on the sediment transport and the coastal system as a whole. More research on the sediment transport and the current trends in- and outside of the bay can help the decision for placing a land barrier near or further from the shore. Additional research on the eastern- and western barrier ends is necessary. Whether and where the barrier should connect to higher grounds will greatly influence the required length of the barrier, the safety provided by the barrier and the total costs. More research on the additional safety of the land barrier extension towards higher ground is crucial in the search towards an economically optimized design. The construction phase has not been taken into account in this design step. Especially when the land barrier is placed on the only large roads on the islands, this requires additional attention. Accessibility and the possibility of evacuation should be ensured at all times. More attention is needed on the landscape integration. Cooperation of local inhabitants and governments depends greatly on the impact on their local space. Integrating the barrier on a more local scale and allowing variation along the length of the barrier could positively affect their judgement. Technical design The near shore conditions are computed with a one-dimensional SWAN analysis. More research in the form of a more detailed analysis can lead to a more accurate near shore wave height prediction by incorporating 2D- or 3D-effects, e.g. refraction. The current model uses uncoupled wave- and surge level data. A final assessment of hydraulic boundary conditions should use coupled data. The preferred design is constructed from clay and rock and covered with sand. The availability of useful sources of these materials is still unknown and questionable. Especially sand is mentioned as a scarce material to obtain. Whether it (and the other materials) can be obtained in these amounts and at what costs can have a major impact on the resulting cross section and should be further investigated. When constructing a road on top of a clay core dike, uneven settlements can cause damage to the road, leading to large maintenance costs. Whether this form of clay is subject to these settlements and what can be done to counter this problem, needs to be investigated before the final decision to place a road on top of it is made. One should consider the opportunity of resilience into this design. By constructing a barrier that is able to withstand overtopping levels beyond the current protection level, an optimisation could be possible that minimizes both the barrier height and the flood risk. 31
32 8 List of references Almarshed, B.F.; Figlus, J (2015). Hydrodynamic design conditions from measured data. Ocean Engineering department, Texas A&M University, Texas, USA. Anderson, J., & Wellner, J. S. (2003). Evaluation of beach nourishment sand resources along the central Texas coast (Report to the General Land Office) (p. 28). Houston, TX: Rice University. Berg, R. (2009) Hurricane Ike. Tropical Cyclone Report. Blackburn, J; Buono, R.M.; Dunbar, L. (2015). Emerging Legal Issues in Hurricane Damage Risk Abatement. James A. Bakker III Institute for Public Policy of Rice University, Texas, USA. Finkl, C. W., Andrews, J. L., Campbell, T. J., Benedet, L., & Waters, J. P. (2004). Coupling Geological Concepts with Historical Data Sets in a MIS Framework to Prospect for Beach-Compatible Sands on the Inner Continental Shelf: Experience on the Eastern Texas Gulf Coast 1. Journal of Coastal Research, Frey, A. E., Morang, A., & King, D. B. (2014). Galveston Island, Texas, Sand Management Strategies (No. ERDC/CHL TR-14-XX) (p. 201). Vicksburg, MS: U.S. Army Corps of Engineers. Gibeaut, J. (2011). Changes along the Texas barrier island coast. Presentation presented at the Gulf Coast Ecosystem. Restoration Task Force Meeting, Galveston, TX. Hofland, B.; Marissen, R.; Bergsma, O. (2015). Dynamic behaviour of a flexible membrane tsunami Barrier with Dyneema. Proceedings of Coastal Structures & Solutions to Coastal Disasters Joint Conference. Boston,USA. Jin, C. et al., Site Specific Wave Parameters for Texas Coastal Bridges: Final Report, College Station: Texas A&M. Jonkman, S.N.; Lendering, K.T.; Berchum, E.C. van; Nillesen, A.; Mooyaart, L.F.; Vries, P.A.L. de; Ledden, M. van; Willems, A.; Nooij, R. (2015). Coastal Spine System Interim design report. Delft University of Technology, the Netherlands. King, D. (2007). Wave and beach processes modeling: Sabine Pass to Galveston Bay, Texas, shoreline erosion feasibility study (Technical Report No. ERDC/CHL TR-07-6) (p. 150). Vicksburg, MS: U.S. Army Engineer Research and Development Center. Lendering, K.T.; Toorn, A. van der; Vries, P.A.L. de; Mooyaart, L.F.; Ledden, M. van; Willems, A.; Jonkman, S.N. (2014) Barge barrier design: Phase 3. Delft University of Technology, the Netherlands. Morang, A. (2006). North Texas Sediment Budget - Sabine Pass to San Luis Pass (Technical Report No. ERDC/CHL TR-06-17). Vicksburg, MS: U.S. Army Corps of Engineers Coastal Engineering Research Center. Morton, R. A., & Gibeaut, J. C. (1993). Physical and environmental assessment of sand resources - Texas continental shelf (Final Report) (p. 68). Austin, TX: Bureau of Economic Geology. 32
33 Paine, J. G., Mathew, S., & Caudle, T. (2012). Historical shoreline change through 2007, Texas Gulf Coast: rates, contributing causes, and Holocene context. Gulf Coast Association of Geological Societies Journal, 1, Sebastian, A., Proft, J., Dawson, C., & Bedient, P.B. (2014). Characterizing hurricane storm surge behavior in Galveston Bay using the SWAN+ADCIRC model. Coastal Engineering, 88, doi: Severe Storm Prediction, Education and Evacuation from Disaster Center (SSPEED) (2015). HGAPS Houston Galveston Area Protection System. Annual Report to Houston Endowment Siringan, F. P., & Anderson, J. B. (1994). Modern shoreface and inner-shelf storm deposits off the East Texas coast, Gulf of Mexico. Journal of Sedimentary Research, B64, Stoeten, K.J. (2013). Hurricane Surge Risk Reduction for Galveston Bay. M.Sc. Thesis. Delft University of Technology, the Netherlands. Vries, P.A.L. de (2014). The Bolivar Roads Surge Barrier: A Conceptual Design for the Environmental Section. M.Sc. Thesis. Delft University of Technology, the Netherlands. White, W. A., Calnan, T. R., Morton, R. A., Kimble, R. S., Littleton, T. G., McGowen, J. H., Schmedes, K. E. (1985). Submerged lands of Texas, Galveston-Houston area: sediments, geochemistry, benthic and macroinvertebrates, and associated wetlands (p. 145). Austin, TX: Bureau of Economic Geology. Williams, S. J., Flocks, J., Jenkins, C., Khalil, S., & Moya, J. (2012). Offshore Sediment Character and Sand Resource Assessment of the Northern Gulf of Mexico, Florida to Texas. Journal of Coastal Research, 60,
34 9 Appendices Appendix A: Nearshore SWAN model Appendix B: Design cross sections Appendix C: Comparison of alternatives Appendix D: Overtopping calculations Appendix E: Revetment armour layer calculations Appendix F: Cost calculation Appendix G: Land Barrier ends design 34
35 Appendix A: Nearshore SWAN model Almarshed (2015) mentions the significant wave height at the buoy location. As the water depth at the land barrier is lower than the breaking water depth, the highest possible waves will not reach the land barrier with all their energy. A one-dimensional SWAN model has been set-up to assess the propagation of a hurricane-induced wave. This is done for the 1/100 yr -1 conditions. SWAN is a full-spectral wave model suitable to simulate waves in the nearshore, hence the acronym SWAN: Simulating WAves Nearshore. The model can also calculate the wave height when propagating over the barrier islands during storm surge. The wave height gets significantly reduced; see Figure 19 and Table 9. This is useful information for designing the barriers; a barrier that is located at a distance from the shoreline benefits this wave breaking. This results in a lower design wave height and therefore a lower barrier when constructed landward Figure 19 SWAN results: wave transmission in the nearshore zone for the 1/100 year -1 storm 35
36 Table 9 - SWAN results: wave conditions for several points along the along the buoyisland transect Bottom level (m+msl) Significant wave height (H s ) Peak wave period (T p ) Buoy (32km offshore) Breaker depth (27km offshore) Nearshore (100m seaward) At shoreline Island (100m landward) Island (>200m landward) -16m -15m -1.4m 0m +1.5m +1.5m 6.5m 7.2m 3.4m 3.2m 2.2m 1.9m 13.7s 13.7s 13.7s 13.7s 13.7s 13.7s The applied SWAN model has the following characteristics and limitations: The 1D SWAN model is 35 km long consisting of 7000 grid cells of 5 m; On the offshore boundary, the hurricane-induced wave is imposed as a JONSWAP spectrum with a directional spreading of 30 ; Due to the 1D nature of the model, the wave direction is perpendicular to the shore; The imposed wind speed of 38 m/s is constant and uniform. This velocity corresponds to Hurricane Ike s maximum wind speed at landfall (Hope et al, 2013); The imposed wave has a significant wave height Hs of 6.54 m and a peak wave period Tp of 14.0 s; The frequency space consists of 37 frequencies ranging from a minimum frequency of Hz and a maximum frequency of 0.8 Hz; this discrete character of the frequency space is the cause of the difference between the imposed peak wave period of 14 s and the simulated one of 13.7 s. The imposed surge level is MSL+5.7m and is constant and uniform; The bottom profile is based on the local depth at the buoy (NBDC, 2015) and Google Earth elevation data (Google, 2015); The wind direction is equal to the direction of wave propagation; The SWAN model accounts for shoaling, bed friction, depth-induced and steepnessinduced breaking, non-linear wave interactions and wind growth; The SWAN model does not account for refraction (because it is a 1D model), (partial) reflection against steep slopes and diffraction (irrelevant in the considered situation); 36

37 Appendix B: design cross sections Overview of the selected design cross sections. Section C1 37

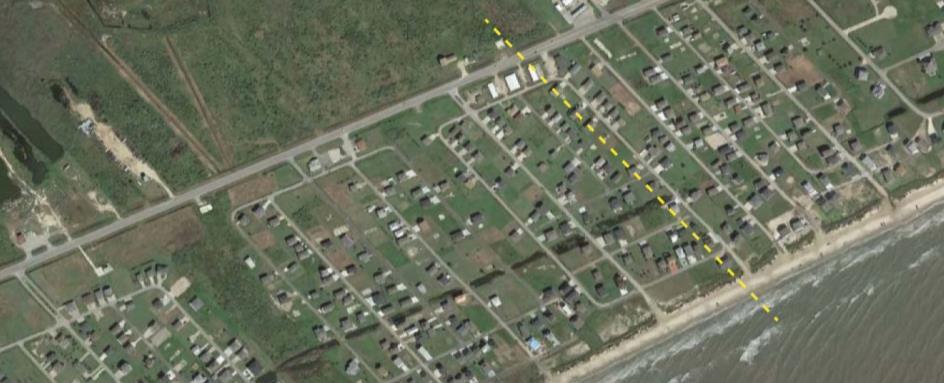
38 Section C2 Section D1 38

39 Section D2 39
40 Appendix C: Comparison of alternatives This comparison is based on the workshop Land Barrier design on 14 th of January, 2016 at TU Delft, the Netherlands. A large role in the preliminary land barrier design on Galveston Island and Bolivar Peninsula is reserved for a multidisciplinary review of the alternatives, which are explained earlier in this report. This review was done in the form of a workshop at TU Delft. At this workshop experts attended in the field of Hydraulic Engineering, Coastal Engineering, Coastal Modeling, Policy, Architecture and Urban Design. The goal of the workshop was to formulate criteria to base the discussion on and review the different alternatives on those criteria. The chosen criteria on which the comparison is made are: Vulnerability Morphological impact Environmental/ecological impact Legal issues Spatial quality: locals Spatial quality: tourists Evacuation Maintenance Flexibility The alternatives have deliberately not been graded on Public acceptance and Cost. This is chosen because the public acceptance is still mostly unknown with the reviewing group and it depends largely on the conclusions of other criteria. Cost will be quantified later and added to the comparison in order to formulate a Preferred Design. Both the cost estimate and the preferred design were not a part of the workshop. Note: The results per criterion are summarized in a table in the form of -/0/+. These scores should only be used in comparison to each other in the respective criterion. They should not be added across the different criteria, as the criteria are not weighed. Vulnerability This criterion addresses the safety provided by the barrier. The main goal of the barrier is to increase the safety of the entire Galveston Bay Area and maximally decrease the damage as a result of a hurricane. In this consideration, the criterion focusses on the safety of the people, infrastructure and housing on Galveston Island and Bolivar Peninsula itself. In the case of Cross section C: Narrow residential corridor, which is chosen on Galveston Island, this comparison shows that the provided safety of the Coastal Dike alternative is higher than the Enforced Highway FM3005 alternative, because everything behind the coast is protected. When the barrier is placed at the location of the highway however, all the housing between the highway and the coast will be affected. Because the Seawall alternative is also placed on the coast, the entire island will be protected as well, although the splashing of the waves will do more damage to anything built in front or on top of the wall. Raising the houses will also lead to every building and person being protected. At Bolivar Peninsula (Cross section D: Wide residential corridor), much more houses are placed between the coast and the road, making the difference in vulnerability between the two locations even larger. The movable barrier will be placed on the coast as well, which improves the safety of all inhabitants. 40
41 Table 10 - Comparison of alternatives for the land barrier on Galveston Island and Bolivar Peninsula on the vulnerability of local inhabitants to flooding from hurricanes Cross section: C Narrow residential corridor Cross section: D Wide residential corridor Coastal dike + Coastal dike + Enforced Highway - Enforced Highway SH87 -- FM3005 Seawall + Movable barrier + Raising houses + Raising houses + Morphological impact The morphological impact of a measure depends on the amount of change that the alternative initiates in the coastal system. This is a large advantage to the placement at the highway, as this does not change the coastal system at all. This means that any required coastal measures can be planned and executed independent of each other. The impact on the coastal system is much larger when the barrier is placed close to the coast. The raising houses -alternative will potentially affect this system and can possibly cause erosion on the shore when the footprint of the dike underneath the raised houses comes too close to the coastline. The Coastal Dike and the Seawall will probably have a large impact on the morphology and sediment transport in the coastal system. Both alternatives will occupy the current coast and extend this into the Gulf of Mexico in order to accommodate the footprint. This extension will probably increase the erosion and will therefore require large scale coastal measures to ensure that the erosion will not reach the land barrier. Placement of a movable barrier is most likely probable with minimal influence, although it does require the coast to be fixed and free of further erosion, which is also the case for the raising houses alternative on both cross sections. Table 11 - Comparison of alternatives for the land barrier on Galveston Island and Bolivar Peninsula on the criterion Morphological impact Cross section: C Narrow residential corridor Cross section: D Wide residential corridor Coastal dike - Coastal dike - Enforced Highway ++ Enforced Highway SH87 ++ FM3005 Seawall - Movable barrier 0 Raising houses -/0 Raising houses -/0 Environmental/ecological impact Constructing a land barrier will have a large effect on the local ecological system and the situation of the entire bay. The effect of the land barrier (and other flood prevention measures) on the ecosystem in the bay, which houses large amounts of marine- and land based wildlife, requires substantial additional research. However, in this consideration only the impact on the local ecosystem is addressed, as the impact on the environment of the entire Galveston Bay is considered equal for all land barrier alternatives. The first consideration on Galveston Island relates to the used material, where a concrete-based structure like the Seawall option would lead to a hard separation between the coastal system and the ecosystem on the island itself and the bay behind it. A soil-based barrier enables a more natural approach and could be used as a base to minimize environmental impact by developing a good landscape design. When constructed at the highway, a soil-based structure could even enhance the current exchange between wildlife at both sides of the highway by constructing ecoducts. The current exchange between sea- and terrestrial life will be affected when changes to the beach front are made. This part of the ecosystem will only be rebuilt when a beach is placed in front of the structure. Concluding, a structure near the coast will have a larger negative impact on the environment. 41
42 Table 12- Comparison of alternatives for the land barrier on Galveston Island and Bolivar Peninsula on the criterion Ecological impact Cross section: C Narrow residential corridor Cross section: D Wide residential corridor Coastal dike - Coastal dike - Enforced Highway + Enforced Highway SH87 + FM3005 Seawall -- Movable barrier 0 Raising houses - Raising houses - Legal Issues The land barrier has to be constructed on two land masses that currently have no place reserved for flood defenses. The placement of the land barrier could therefore lead to several legal issues, which can potentially be avoided when taken into consideration at an early stage in the design. This problem mainly concerns the use of public and private space. Private parcels on Galveston Island and the Bolivar Peninsula are owned by separate inhabitants or companies, which can use that parcel as they please. Placing a land barrier on these parcels will require permission of the land owners. This complicates the construction process significantly, as a small group of owners (or even an individual owner) will be able to greatly affect the construction of the land barrier. The legal issues will therefore be smallest when construction is concentrated at the coast, which is completely public property. The change of the coast can cause legal issues with environmental agencies, but this can be accounted for with a proper (compensation) plan. When constructing at the highway, the issues become much clearer. As the land barrier in its current form is not able to fit inside the public parcel reserved for the main road, interference with public property is always required. This is also the case when considering that a temporary road will have to be constructed during construction. Here, local solutions can be the answer. Because the crest and the largest part of the barrier will be placed inside the public parcel, only a small and low portion of the barrier will interfere with private parcel. In most cases, this will not affect any space under the houses themselves. When the coastal parcel is used to place movable barriers, no significant legal issues are expected as well. The largest issues are expected with the raising houses -alternative, as these are mainly placed on private property. Therefore, this option requires approval and cooperation of locals. Without the support of all the affected landowners this should be viewed as a major risk. Table 13- Comparison of alternatives for the land barrier on Galveston Island and Bolivar Peninsula on the criterion Legal issues Cross section: C Narrow residential corridor Cross section: D Wide residential corridor Coastal dike ++ Coastal dike ++ Enforced Highway - Enforced Highway SH87 - FM3005 Seawall ++ Movable barrier ++ Raising houses -- Raising houses -- Spatial Quality: Locals The spatial quality has a large influence on the public acceptance and the feasibility of the plan. After all, a design that actively tries to maximize the spatial quality will be accepted faster, will easier find financial support and will earlier be approved for permits. The concept of spatial quality can be divided into two forms: the spatial quality provided to locals and the spatial quality provided to tourists. This separation is needed, because these two groups can experience the same location and structure in very different ways. This part is focused on the spatial quality for locals. As these people knowingly chose to live in a flood prone area, it is understandable that they greatly value the overall quality and beauty of their 42
43 surroundings. How this compares to their appreciation of safety from flooding requires additional attention in later research. For now, it is assumed that the locals chose this location for its natural surroundings and the view on the sea/bay. The effect of the Coastal dike remains somewhat unclear. Here, the view of the Gulf of Mexico will almost certainly disappear. The surroundings will also change with the construction of a man made dike. It is possible to cover this dike in the form of an environmentally appealing structure in line with stakeholder preferences (e.g. a dune). The enforced highway options on both cross section show more options to increase spatial quality. For the locals that had view on the gulf (the people living on the gulf side of the road), the view remains. The people on the other side had little view on the gulf to begin with. The elevated road can be used to also enforce its function as the lifeline of the islands. In cooperation with local preferences, additional function in the form of e.g. nature, recreation, shops, and viewpoints can be added in the design plans. The seawall option will most likely show the least potential to increase spatial quality for locals. The concrete structure will heavily interfere with the natural environment. As the beach and the accessibility of the beach is assumed to be of great value to the locals, additional measures should be taken to ensure that these remain at least the same. The addition of a beach in front of the seawall will lead to erosion, which also requires other non-natural measures to contain. Ramps are needed to ensure the accessibility of the beach by car. In short, many measures are required to ensure that the spatial quality for locals does not worsen. The raising houses alternative is similar to the coastal dike, with the difference being that the houses will be higher and will largely keep their view on the Gulf. The movable barrier will require some change in the coastal part and regular checks and tests, which will have to be done in cooperation with locals. Table 14- Comparison of alternatives for the land barrier on Galveston Island and Bolivar Peninsula on the criterion spatial quality: locals Cross section: C Narrow residential corridor Cross section: D Wide residential corridor Coastal dike -/0 Coastal dike -/0 Enforced Highway + Enforced Highway SH87 + FM3005 Seawall - Movable barrier - Raising houses + Raising houses + Spatial Quality: Tourists This part focusses on the spatial quality for tourists. Tourists are only there (mostly on Galveston Island) for a short amount of time, are not or hardly affected by flooding and mostly need an incentive to choose this area as a vacation destination. A man made structure in the form of a dike will affect the natural appeal that could attract tourist. On the other hand, the structure can be used as a breeding/shelter place for animals or could be accompanied with viewpoints/information to enhance the experience for nature seekers. Also other additional functions can be added to improve tourism, e.g. restaurants/hotels on the crest with great view. The coastal dune, when covered with a natural layer, will increase the spatial quality for tourists, as it does show the natural dune and they don t care about the lost view for inhabitants. However, a positive effect is only possible when a new beach is constructed. The same holds for the raising houses alternative, although a truly naturally dune is hard when the raised houses are taken into account. The enforced highway option hardly affects the tourist experience. Because a non-natural part of the island (the highway) is used and adjusted, the incentive for tourists to come and their experience does not change. The design can however be used to add additional tourist functions. The Seawall option will largely have a negative effect, as the concrete will change the natural appeal of the islands. Due to its location, it is hard to combine the construction with other measures to offset this effect. 43
44 Lastly, the movable barrier will hardly have effect on tourist, as they will only be able to see it in special occasions. Table 15 - Comparison of alternatives for the land barrier on Galveston Island and Bolivar Peninsula on the criterion spatial quality: tourists. Cross section: C Narrow residential corridor Cross section: D Wide residential corridor Coastal dike + Coastal dike + Enforced Highway 0 Enforced Highway SH87 0 FM3005 Seawall - Movable barrier 0 Raising houses 0/+ Raising houses + Evacuation The criterion of evacuation takes several processes into account. First of all, there is the physical action of evacuation. How does the barrier change this? Secondly, the sense of safety is also important. Because a large, expensive structure is built near the houses, the people will automatically feel safer. It also takes away their view on the threat, the water in the Gulf. This will lead to the situation where, should evacuation be necessary, people will start to evacuate later and more people will stay behind. This feeling will only grow over the years, as the confidence in the flood protection grows and the memory of flooding fades. This effect will happen for all alternatives. However, when the barrier is built near the road, a part of the inhabitants will still be affected and the danger of the water is visible from the road, both reminding all inhabitants of Galveston Island and Bolivar Peninsula of the risk and the possible need for evacuation. An additional advantage of the enforced highway options is that the evacuation route is heightened and still accessible up to the last moment before the height of the storm. Table 16- Comparison of alternatives for the land barrier on Galveston Island and Bolivar Peninsula on the criterion Evacuation. Cross section: C Narrow residential corridor Cross section: D Wide residential corridor Coastal dike - Coastal dike - Enforced Highway +/++ Enforced Highway SH87 +/++ FM3005 Seawall - Movable barrier - Raising houses - Raising houses - Maintenance The maintenance is an important part in the lifecycle of the flood protection, which often gets too little attention during design. A badly maintained structure will severely limit the amount of time this structure can withstand design conditions. When it comes to maintenance, there is a great downside to coastal solutions. Because the barrier will be constructed seaward of the current coast, large amount of erosion will occur. This will require regular nourishments to maintain the wanted coast profile. This effect is the largest when using the Coastal Dike, as this reaches into the sea the most. The Seawall needs a smaller footprint, but has the added effect of the salt water on the reinforced concrete structure. The raised houses has the smallest amount of maintenance of the coastal solution, but a large portion of the maintenance need to be done on private property, which complicates the activities. The easiest alternative, in terms of maintenance, is the enforced highway. Here, the dike is very easy accessible and the amount of required maintenance will be minimal. The movable barrier will result in small adjustments to the coastline and will also require a fixed shoreline, which means that nourishments will have to be done. 44
45 Table 17 - Comparison of alternatives for the land barrier on Galveston Island and Bolivar Peninsula on the criterion Maintenance. Cross section: C Narrow residential corridor Cross section: D Wide residential corridor Coastal dike -- Coastal dike -- Enforced Highway + Enforced Highway SH87 + FM3005 Seawall -- Movable barrier - Raising houses -- Raising houses -- Flexibility The flexibility criterion compares the alternatives on their ability to adapt to future demands. If rates whether an alternative can easily be heightened or enforced. This shows a large advantage for the Coastal Dike. As it is soil-based, which can easily be enlarged or altered, and the lack for additional functions beside natural dune, makes it a structure than can be adapted without much problems. A Seawall can also easily be accessed, but has the problem of being a reinforced concrete structure. This means that almost any adjustment in height would require an entire replacement of the concrete element. This can be avoided by designing this component with the expansion in mind. By constructing an element with a width and amount of reinforcement that exceeds the requirements, an element can possibly be added on top without overstressing the base structure in design conditions. The Raised Houses-alternative can easily be heightened as well, although it requires access to private property again. The enforced highway will show other problems. Although the soil-based structure can easily be heightened or enforced, the road will have to be relocated during construction. Also, the location near the community will probably lead to the dike getting other function as well, besides flood protection. These additional functions will have to adjust as well. The movable barrier will show the most issues when it comes to flexibility, as probably the entire movable barrier will have to be replaced when these elements are not built to be extended. Table 18 - Comparison of alternatives for the land barrier on Galveston Island and Bolivar Peninsula on the criterion Flexibility Cross section: C Narrow residential corridor Cross section: D Wide residential corridor Coastal dike ++ Coastal dike ++ Enforced Highway - Enforced Highway SH87 - FM3005 Seawall - Movable barrier -- Raising houses + Raising houses + Comparison of alternatives Above, the alternatives are rated based on these nine criteria. This rating can aid to make a final decision. However, because there are many other aspects to the design and many criteria intertwine, these criteria cannot be added. On the other side, the criteria do quickly show the strong- and weak points of the alternatives. When this is combined with a cost estimate, it should be possible to point an alternative that can be presented as the preferred alternative for this stage of design. This analysis also shows that many different aspects still need additional research, in order to be able to make a better quantifiable choice in the future. 45
46 Vulnerability Morphological impact Environmental impact Legal issues Spatial Quality: Local Spatial Quality: Tourists Evacuation Maintenance Flexibility Cross section C: Narrow residential corridor Table 19 - Comparison of alternatives on all chosen criteria for cross section C: Narrow residential corridor Coastal Dike / Enforced Highway / FM3005 Seawall Raising Houses + 0/ / When cross section C: Narrow residential corridor (Galveston Island) is concerned, it shows that the Coastal Dike will probably be the easiest option to get permission, funding and the easiest to construct. The strong points include vulnerability (all people protected), legal issues (no private property), flexibility and the appeal to tourists. These are strong points that can easily persuade the (local) governments. However, the weak points can really be decisive in the long run. Especially morphological impact and maintenance will be large problems, which will leave a great mark on the projects costs over its entire lifetime. Combined with weak position on evacuation and the blocked view for people living near the Gulf, other option may be preferred. The Seawall option has hardly any advantages over the Coastal Dike, apart from its smaller footprint and resulting smaller morphological impact. The concrete structure, which will impact the environment, and subsequently tourism, will therefore need a clear cost benefit to be chosen over the other alternatives. It can be considered in special cases, e.g. in front of beach resorts as a form of special protection. The Raising Houses -alternative shows potential over the Coastal Dike, as it tries to minimize the weak points while keeping its strong points. However, it does add the need of constant informing of- and approval from local landowners. At this point in design, this is seen as a major factor. If future research shows that most landowners would approve of such collaboration, this can certainly be seen as a way to maximize the safety of everybody on the island without affecting the coastal system too much. The Enforced Highway FM3005 shows potential in totally different fields compared to the Coastal Dike. Although it does not protect the people at gulf-side of the road, it shows large potential by improving the Highway FM3005 into a real lifeline of the island. This increases the options on evacuation and connecting the ecology on both sides of the road, while also showing potential additional value in the form of local uses of the dike itself (enhancing tourism). But the biggest upside remains the fact that is has no effect on the coastal system whatsoever. Compared to the Coastal Dike, it does show more issues concerning the use of private lands near the road and any reconstruction would require the road to be relocated. However, based on the comments stated in this section, the Enforced Highway FM3005 would be preferred over the Coastal Dike, not accounting for any difference in costs. 46
47 Vulnerability Morphological impact Environmental impact Legal issues Spatial Quality: Local Spatial Quality: Tourists Evacuation Maintenance Flexibility Cross section D: Wide residential corridor Table 20 - Comparison of alternatives on all chosen criteria for cross section D: Wide residential corridor Coastal Dike / Enforced Highway / SH87 Movable barrier Raising Houses + 0/ The cross section D, which is mostly present on Bolivar Island, follows mainly the same considerations. One difference is the larger amount of people living between the Gulf coast and the road. This will mean that the difference in local safety provided by the flood defense is even bigger. On the other side, because the road is placed more inland, the crest height at the road (and subsequently costs and impact) will decrease more. Also, slightly less legal issues are expected with the Enforced Highway SH87, because the bay-side of the road is mostly uninhabited. Because the difference in vulnerability is higher than was the case at cross section C, it can be expected that homeowners will easier accept solutions near the coast, even if it blocks the view or uses their private property. Whether this shift actually occurs, is subject of later research. Here also the option of the movable barrier can be interesting. Although it has the lack of flexibility and a conditional safety (only safe if it moves/is constructed in time), the strong points of providing safety with minimal impact on the surroundings can lead to people preferring this option at certain locations. Because the topography and infrastructure of cross section D demands an even tougher choice between two of the most conflicting criteria (vulnerability versus morphological impact), more information on mostly costs and local preference is required to choose the preferred design. This can eventually lead to a fragmented set of solutions of pieces of land barrier where people are willing, or not, to pay more or allow construction activities on their private land. This could make the Coastal Dike (or Raising Houses, Movable Barrier) the preferred option, where other stretches lean towards the Enforced Highway SH87 based on easier construction, evacuation and less morphological and environmental impact. However, because of the limited knowledge of the local preferences and because of the early stage of design, the comments stated above will be added to the cost estimate to come up with a single preferred design. 47
48 Appendix D: Overtopping calculations Appendix D1 - overtopping coastal barrier section C+D 48
49 49
50 50
51 Appendix D2 - overtopping inland barrier section C 51
52 52
53 53
54 Appendix D3 - overtopping inland barrier section D 54
55 55
56 56

57 Appendix E: Revetment armor layer calculations Appendix E1 armor layer coastal barrier section C+D 57

58 Appendix E2 armor layer inland barrier section C 58

59 Appendix E3 armor layer inland barrier section D 59
60 Appendix F: Cost calculation Quantities Some general properties of the land barrier form the basis of the cost calculation. These are presented in the table below. Coastal dike Cross section A 1) C D Length [km] 27,1 19,9 27,0 Raise [m] 7,4 8,8 8,8 Berm level [m] N/A 2) 5,7 5,7 Barrier inland Cross section A 1) C D Length [km] 27,1 19,9 27,0 Raise [m] 7,4 7,8 7,4 Berm level [m] N/A 2) N/A 2) N/A 2) 1) Cross section A combines quantities for sections A1 & A2. 2) The berm is only applied for the coastal barrier sections. 60
61 Cost estimate alternative 1: coastal barrier Specification Quantity unit PPU Total 01 Clay Embankment Section A m3 $15,00 $ , Section C m3 $15,00 $ , Section D m3 $15,00 $ ,00 02 Revetment Section A ton $125,00 1) $ , Section C ton $150,00 1) $ , Section D ton $150,00 1) $ ,40 03 Cosmetic sand layer, thickness = 2m Section A m3 $50,00 $ , Section C m3 $50,00 $ , Section D m3 $50,00 $ ,33 Subtotal Direct Costs $ ,64 Incomplete design 25 % $ ,64 $ ,91 TDC Total Direct Construction Costs $ ,55 Construction site costs ( barrier location ) 10 % $ ,55 $ ,45 Overhead - Directional costs contractor 8 % $ ,00 $ ,08 Profit 5 % $ ,00 $ ,55 TIC Total Indirect Costs $ ,08 Total Estimated Costs ( TDC + TIC ) $ ,63 Unforeseen Project Risks 25 % $ ,63 $ ,16 Total construction costs $ ,00 1) The cost unit rate for the revetment of the coastal barrier sections (grading 1-3ton) are assumed to be 20% more expensive than for the inland barrier sections (grading kg). 61
62 Cost estimate alternative 2: inland barrier Specification Quantity unit PPU Total 01 Clay Embankment Section A m3 $15,00 $ , Section C m3 $15,00 $ , Section D m3 $15,00 $ ,00 02 Revetment Section A ton $125,00 1) $ , Section C ton $125,00 1) $ , Section D ton $125,00 1) $ ,93 03 Cosmetic sand layer, thickness = 2m Section A m3 $50,00 $ , Section C m3 $50,00 $ , Section D m3 $50,00 $ ,80 Subtotal Direct Costs $ ,67 Incomplete design 25 % $ ,67 $ ,17 TDC Total Direct Construction Costs $ ,84 Construction site costs ( barrier location ) 10 % $ ,84 $ ,58 Overhead - Directional costs contractor 8 % $ ,42 $ ,87 Profit 5 % $ ,42 $ ,42 TIC Total Indirect Costs $ ,88 Total Estimated Costs ( TDC + TIC ) $ ,71 Unforeseen Project Risks 25 % $ ,71 $ ,93 Total construction costs $ ,00 1) The cost unit rate for the revetment of the coastal barrier sections (grading 1-3ton) are assumed to be 20% more expensive than for the inland barrier sections (grading kg). 62
63 Appendix G: Land barrier ends design This appendix elaborates further on the design of the land barrier ends. On a very conceptual level, the different options in terms of location, height and cross section are considered. Land barrier western end This part of the land barrier concerns the part on the most western point of Galveston Island, starting with the San Luis Pass. In the first designs (e.g. Ike Dike) no structures were included here. The Coastal Spine Report included a storm surge barrier at San Luis Pass, as well as a land barrier along the Bluewater Highway to the west of the San Luis Pass. In order to fully close of the bay from the sea on this side, a land barrier up to Freetown was needed, 20 km (12.5 miles) long. This solution was obviously a very expensive one. Other options may be more profitable. However, directly north-west of the San Luis Pass, a national refuge is present, which complicates any construction inland. This also means that an inland shortcut of the dike would have to cross more waterways, which is much more expensive than a land barrier. Only a few alternatives seem feasible: No barrier at San Luis Pass and west of it Only a barrier at San Luis Pass Barrier at San Luis Pass and an inland barrier west of SLP Barrier at San Luis Pass and a land barrier up to Freetown Figure 20- Feasible alternatives for land barrier western end The choice whether a barrier at San Luis Pass is needed or not should be based on the additional gained safety compared with the extra costs. As the San Luis Pass is a barrier across an inlet, the costs are relatively high compared to a land barrier. The additional safety because of the San Luis Pass is still unknown. The flood will easily circumvent the barrier by flooding the lands, which will locally increase the water velocities and therefore worsen the dangerous situation for the residents west of San Luis Pass. When an additional barrier next to the San Luis Pass is needed, a choice has to be made whether a 20 km long land barrier or a shorter land/storm surge barrier combination through a nature reserve is preferred. As the shorter inland option will lead to additional environmental resistance, only a significant cost benefit compared to the extended land barrier could result in the inland option to be preferred. 63

64 For comparison, the costs of the options are estimated conceptually. The land barrier along Bluewater Highway was already evaluated at 45 Million dollar per kilometer. The inland option would be a combination of a land barrier and a storm surge barrier, crossing the Cold Pass and Bastrop Bay, northwest of San Luis Pass. The expected costs per option can be found in Table 21. Table 21 - Cost estimate for western land barrier end alternatives Element No Barrier SLP + Inland barrier SLP + Bluewater HWY San Luis Pass M$ 330 M$ Land Barrier M$ (13 km) 900 M$ (20 km) Storm surge barrier M$ (0.5 km) 1 - Total 0 M$ 1,080 M$ 1,230 M$ 1 Storm surge barrier costs are based on costs of San Luis Pass cost estimate from Coastal Spine report (Jonkman et al., 2015) The cost comparison shows a relatively small different between the costs of the inland barrier option and the Bluewater highway-option. However, in terms of environmental damage inflicted of the Inland barrier option and the additional infrastructural safety provided by the Bluewater Highway option, this option will be preferred over the Inland barrier, although both options show large costs. Whether the barrier along the Bluewater Highway is preferred over the option without any barrier depends on the additional safety of the barrier. Although the barrier doesn t directly protect any houses, only the additional safety of the bay should offset the costs. When the hurricane occurs that will lead to the maximum amount of damage in the bay, the main path will most likely be located slightly east of San Luis Pass. The shape of the bay, combined with the circulation of the hurricane can lead to a relatively small amount of water entering the bay through SLP. This has to be modelled more detailed in a later stage. Land barrier eastern end This part concerns the most eastern part of the area, east of Bolivar Peninsula. In earlier designs, the land barrier was placed up until High Island, a local elevated area. The entire region east and north of High Island consists of nature reserves and marshland. Models showed that during a hurricane, this region is entirely flooded. The total inundation of the area, combined with the rotation of the hurricane, shows the possibility that the water still floods the bay by circumventing the land barrier through the eastern nature reserves. Modelling different storms and their consequences should lead to more understanding of this phenomenon. When a local solution is required to prevent the water from entering the bay, there are two main solutions: The Inland option, which constructs a land barrier in the northern direction, along the State Highway 124 or the Coastal option, which constructs a land barrier along the partly eroded SH87. Figure 21 - Feasible alternatives for the eastern land barrier end 64
Important note To cite this publication, please use the final published version (if applicable). Please check the document version above.
. Please check the document version above.") Delft University of Technology Galveston Bay Area Land Barrier preliminary design van Berchum, Erik; de Vries, P.A.L.; de Kort, R.P.J. Publication date 2016 Document Version Publisher's PDF, also known
Delft University of Technology Galveston Bay Area Land Barrier preliminary design van Berchum, Erik; de Vries, P.A.L.; de Kort, R.P.J. Publication date 2016 Document Version Publisher's PDF, also known
SURGE SUPPRESSION ACHIEVED BY DIFFERENT COASTAL SPINE (IKE DIKE) ALIGNMENTS. Bruce A. Ebersole, Thomas W. Richardson and Robert W.
 ALIGNMENTS. Bruce A. Ebersole, Thomas W. Richardson and Robert W.") SURGE SUPPRESSION ACHIEVED BY DIFFERENT COASTAL SPINE (IKE DIKE) ALIGNMENTS Abstract Bruce A. Ebersole, Thomas W. Richardson and Robert W. Whalin, Jackson State University, Jackson, Mississippi The primary
SURGE SUPPRESSION ACHIEVED BY DIFFERENT COASTAL SPINE (IKE DIKE) ALIGNMENTS Abstract Bruce A. Ebersole, Thomas W. Richardson and Robert W. Whalin, Jackson State University, Jackson, Mississippi The primary
HURRICANE SANDY LIMITED REEVALUATION REPORT UNION BEACH, NEW JERSEY DRAFT ENGINEERING APPENDIX SUB APPENDIX D SBEACH MODELING
 HURRICANE SANDY LIMITED REEVALUATION REPORT UNION BEACH, NEW JERSEY DRAFT ENGINEERING APPENDIX SUB APPENDIX D SBEACH MODELING Rev. 18 Feb 2015 1 SBEACH Modeling 1.0 Introduction Following the methodology
Pier 8 Wave Overtopping Analysis (65 Guise Street East) Our File:
 Our File:") Shoreplan Engineering Limited 55 Eglinton Avenue E., Suite 800 Toronto, ON Canada M4P 1G8 T) 416.487.4756 F) 416.487.5129 E) mail@shoreplan.com March 31, 2016 Mr. Ed English Senior Project Manager Waterfront
Shoreplan Engineering Limited 55 Eglinton Avenue E., Suite 800 Toronto, ON Canada M4P 1G8 T) 416.487.4756 F) 416.487.5129 E) mail@shoreplan.com March 31, 2016 Mr. Ed English Senior Project Manager Waterfront
Volume and Shoreline Changes along Pinellas County Beaches during Tropical Storm Debby
 Volume and Shoreline Changes along Pinellas County Beaches during Tropical Storm Debby Ping Wang and Tiffany M. Roberts Coastal Research Laboratory University of South Florida July 24, 2012 Introduction
Inlet Management Study for Pass-A-Grille and Bunces Pass, Pinellas County, Florida
 Inlet Management Study for Pass-A-Grille and Bunces Pass, Pinellas County, Florida Final Report Submitted By Ping Wang, Ph.D., Jun Cheng Ph.D., Zachary Westfall, and Mathieu Vallee Coastal Research Laboratory
OECS Regional Engineering Workshop September 29 October 3, 2014
 B E A C H E S. M A R I N A S. D E S I G N. C O N S T R U C T I O N. OECS Regional Engineering Workshop September 29 October 3, 2014 Coastal Erosion and Sea Defense: Introduction to Coastal/Marine Structures
THE EFFECT OF VARIOUS DIKE REINFORCEMENT ALTERNATIVES ON THE FLOOD SAFETY ASPECTS OF THE DELTADIKE CONCEPT
 THE EFFECT OF VARIOUS DIKE REINFORCEMENT ALTERNATIVES ON THE FLOOD SAFETY ASPECTS OF THE DELTADIKE CONCEPT Preliminary Final Report Master Thesis Written by Simon den Hengst Delft, 08 December 2012 Recent
MESSOLOGI LAGOON AREA (GREECE)
") MESSOLOGI LAGOON AREA (GREECE) 20 Contact: Kyriakos SPYROPOULOS TRITON Consulting Engineers 90 Pratinou Str. 11634 Athens (GREECE) Tel: +32 10 729 57 61 Fax: +32 10 724 33 58 e-mail: kspyropoulos@tritonsa.gr
MESSOLOGI LAGOON AREA (GREECE) 20 Contact: Kyriakos SPYROPOULOS TRITON Consulting Engineers 90 Pratinou Str. 11634 Athens (GREECE) Tel: +32 10 729 57 61 Fax: +32 10 724 33 58 e-mail: kspyropoulos@tritonsa.gr
Modeling Sediment Transport Along the Upper Texas Coast
 Modeling Sediment Transport Along the Upper Texas Coast David B. King Jr. Jeffery P. Waters William R. Curtis Highway 87 roadbed, Jefferson County Galveston District Corps Sabine Pass to San Luis Pass
Beach profile surveys and morphological change, Otago Harbour entrance to Karitane May 2014 to June 2015
 Beach profile surveys and morphological change, Otago Harbour entrance to Karitane May 2014 to June 2015 Prepared for Port Otago Ltd Martin Single September 2015 Shore Processes and Management Ltd Contact
Figure79. Location map for the 10 NJBPN profile sites in Atlantic County, NJ 155
 154 Figure79. Location map for the 10 NJBPN profile sites in Atlantic County, NJ 155 ATLANTIC COUNTY SPRING 2009 to FALL 2010 The Atlantic County coastline consists of three barrier islands. Between Little
The Ike Dike. A Coastal Barrier Protecting the. Hurricane Storm Surge. Protecting the Houston/Galveston Region from Hurricane Storm Surge
 The Ike Dike A Coastal Barrier Protecting the Houston/Galveston A Coastal Barrier Region from Hurricane Storm Surge Protecting the Houston/Galveston Region from Hurricane Storm Surge The Houston/Galveston
Delaware Chapter Surfrider Foundation - Indian River Inlet Monitoring
 Delaware Chapter Surfrider Foundation - Indian River Inlet Monitoring In 2012, the Delaware Surfrider Foundation Chapter formed the Surf Quality and Access Committee to focus on issues such as surf spot
Chapter 10 Lecture Outline. The Restless Oceans
 Chapter 10 Lecture Outline The Restless Oceans Focus Question 10.1 How does the Coriolis effect influence ocean currents? The Ocean s Surface Circulation Ocean currents Masses of water that flow from one
Low-crested offshore breakwaters: a functional tool for beach management
 Environmental Problems in Coastal Regions VI 237 Low-crested offshore breakwaters: a functional tool for beach management K. Spyropoulos & E. Andrianis TRITON Consulting Engineers, Greece Abstract Beach
DUNE STABILIZATION AND BEACH EROSION
 DUNE STABILIZATION AND BEACH EROSION CAPE HATTERAS NATIONAL SEASHORE NORTH CAROLINA ROBERT DOLAN PAUL GODFREY U. S. DEPARTMENT OF INTERIOR NATIONAL PARK SERVICE OFFICE OF NATURAL SCIENCE WASHINGTON, D.
LAB: WHERE S THE BEACH
 Name: LAB: WHERE S THE BEACH Introduction When you build a sandcastle on the beach, you don't expect it to last forever. You spread out your towel to sunbathe, but you know you can't stay in the same spot
UPPER BEACH REPLENISHMENT PROJECT RELATED
 ASSESSMENT OF SAND VOLUME LOSS at the TOWNSHIP of UPPER BEACH REPLENISHMENT PROJECT RELATED to the LANDFALL OF HURRICANE SANDY - PURSUANT TO NJ-DR 4086 This assessment is in response to Hurricane Sandy
ALTERNATIVES FOR COASTAL STORM DAMAGE MITIGATION
 ALTERNATIVES FOR COASTAL STORM DAMAGE MITIGATION Dave Basco Old Dominion University, Norfolk, Virginia, USA National Park Service Photo STRUCTURAL (changes to natural, physical system) hardening (seawalls,
Figure 4, Photo mosaic taken on February 14 about an hour before sunset near low tide.
 The Impact on Great South Bay of the Breach at Old Inlet Charles N. Flagg and Roger Flood School of Marine and Atmospheric Sciences, Stony Brook University Since the last report was issued on January 31
Montserrat. Wise practices for coping with. i b bea n Se a
 Wise practices for coping with Montserrat Car i b bea n Se a Fisheries Division, Montserrat Physical Planning Department, Montserrat University of Puerto Rico, Sea Grant College Program Caribbean Development
ALTERNATIVES FOR COASTAL STORM DAMAGE MITIGATION AND FUNCTIONAL DESIGN OF COASTAL STRUCTURES
 The University of the West Indies Organization of American States PROFESSIONAL DEVELOPMENT PROGRAMME: COASTAL INFRASTRUCTURE DESIGN, CONSTRUCTION AND MAINTENANCE A COURSE IN COASTAL DEFENSE SYSTEMS I CHAPTER
4/20/17. #31 - Coastal Erosion. Coastal Erosion - Overview
 Writing Assignment Due Monday by 11:59 pm #31 - Coastal Erosion Beach front property! Great View! Buy now at a great price! See main class web pages for detailed instructions Essays will be submitted in
STATUS REPORT FOR THE SUBMERGED REEF BALL TM ARTIFICIAL REEF SUBMERGED BREAKWATER BEACH STABILIZATION PROJECT FOR THE GRAND CAYMAN MARRIOTT HOTEL
 August 23 STATUS REPORT FOR THE SUBMERGED REEF BALL TM ARTIFICIAL REEF SUBMERGED BREAKWATER BEACH STABILIZATION PROJECT FOR THE GRAND CAYMAN MARRIOTT HOTEL performed by Lee E. Harris, Ph.D., P.E. Consulting
The Masterplan Coastal Safety: a wave of opportunities
 The Masterplan Coastal Safety: a wave of opportunities In depth coastal research and state of the art maritime technology SPINCAM WEEK FLANDERS: OSTEND EVENT FEBRUARY 16-18th 2016 elias.vanquickelborne@mow.vlaanderen.be
Long Beach Island Holgate Spit Little Egg Inlet Historical Evolution Introduction Longshore Transport Map, Survey and Photo Historic Sequence
 Appendix B Long Beach Island Holgate Spit Little Egg Inlet Historical Evolution Introduction The undeveloped southern end of Long Beach Island (LBI) is referred to as the Holgate spit as it adjoins the
ATLANTIC COUNTY 2006 to 2008
 ATLANTIC COUNTY 2006 to 2008 The Atlantic County oceanfront shoreline consists of three barrier islands where the northern one, Little Beach Island and a third of the second, Brigantine Island, are undeveloped
North Shore of Long Island, Feasibility Study
 North Shore of Long Island, Asharoken New York Asharoken, Feasibility Study Asharoken, NY Public Meeting June 30, 2015 US Army Corps of Engineers US Army Corps of Engineers New York BUILDING STRONG BUILDING
New Jersey Coastal Zone Overview. The New Jersey Beach Profile Network (NJBPN) 3 Dimensional Assessments. Quantifying Shoreline Migration
 3 Dimensional Assessments. Quantifying Shoreline Migration") New Jersey Coastal Zone Overview The New Jersey Beach Profile Network (NJBPN) Objectives Profile Locations Data Collection Analyzing NJBPN Data Examples 3 Dimensional Assessments Methodology Examples Quantifying
New Jersey Coastal Zone Overview The New Jersey Beach Profile Network (NJBPN) Objectives Profile Locations Data Collection Analyzing NJBPN Data Examples 3 Dimensional Assessments Methodology Examples Quantifying
Figure 1. Schematic illustration of the major environments on Mustang Island.
 STOP #1: PACKERY CHANNEL BEACH TO BAY We will start this field guide near the north jetty of Packery Channel and hike across the island to Corpus Christi Bay (fig. 1). The island emerges from the Gulf
SACO RIVER AND CAMP ELLIS BEACH SACO, MAINE SECTION 111 SHORE DAMAGE MITIGATION PROJECT APPENDIX F ECONOMIC ASSESSMENT
 SACO RIVER AND CAMP ELLIS BEACH SACO, MAINE SECTION 111 SHORE DAMAGE MITIGATION PROJECT APPENDIX F ECONOMIC ASSESSMENT Department of the Army New England District, Corps of Engineers 696 Virginia Road
St Kitts. Wise practices for coping with
 Wise practices for coping with St Kitts Caribbean Sea Department of the Environment, St Kitts Fisheries Division, St Kitts Physical Planning and Development Division, St Kitts University of Puerto Rico,
Deep-water orbital waves
 What happens when waves approach shore? Deep-water orbital waves Fig. 9.16, p. 211 Wave motion is influenced by water depth and shape of the shoreline wave buildup zone surf zone beach Wave base deepwater
DELAWARE S VULNERABLE COASTAL AREAS. DELAWARE INLAND BAYS and DELAWARE BAY RECONNAISSANCE STUDY
 DELAWARE S VULNERABLE COASTAL AREAS and the DELAWARE INLAND BAYS and DELAWARE BAY RECONNAISSANCE STUDY Kimberly K. McKenna, PG Delaware Dept. of Natural Resources & Environmental Control Division of Watershed
Overview. Beach Features. Coastal Regions. Other Beach Profile Features. CHAPTER 10 The Coast: Beaches and Shoreline Processes.
 Overview CHAPTER 10 The Coast: Beaches and Shoreline Processes Coastal regions constantly change. The beach is a dominant coastal feature. Wave activity continually modifies the beach and coastal areas.
Appendix E Cat Island Borrow Area Analysis
 Appendix E Cat Island Borrow Area Analysis ERDC/CHL Letter Report 1 Cat Island Borrow Area Analysis Multiple borrow area configurations were considered for Cat Island restoration. Borrow area CI1 is located
Reading Material. Inshore oceanography, Anikouchine and Sternberg The World Ocean, Prentice-Hall
 Reading Material Inshore oceanography, Anikouchine and Sternberg The World Ocean, Prentice-Hall BEACH PROCESSES AND COASTAL ENVIRONMENTS COASTAL FEATURES Cross section Map view Terminology for Coastal
LAKKOPETRA (GREECE) EUROSION Case Study. Contact: Kyriakos SPYROPOULOS. TRITON Consulting Engineers. 90 Pratinou Str Athens (GREECE)
 EUROSION Case Study. Contact: Kyriakos SPYROPOULOS. TRITON Consulting Engineers. 90 Pratinou Str Athens (GREECE)") LAKKOPETRA (GREECE) Contact: Kyriakos SPYROPOULOS TRITON Consulting Engineers 90 Pratinou Str. 11634 Athens (GREECE) Tel: +32 10 729 57 61 Fax: +32 10 724 33 58 e-mail: kspyropoulos@tritonsa.gr 19 1 1.
LAKKOPETRA (GREECE) Contact: Kyriakos SPYROPOULOS TRITON Consulting Engineers 90 Pratinou Str. 11634 Athens (GREECE) Tel: +32 10 729 57 61 Fax: +32 10 724 33 58 e-mail: kspyropoulos@tritonsa.gr 19 1 1.
RE: Hurricane Matthew Beach Damage Assessment and Recommendations [CSE 2416]
![RE: Hurricane Matthew Beach Damage Assessment and Recommendations [CSE 2416]](/thumbs/83/87675702.jpg "RE: Hurricane Matthew Beach Damage Assessment and Recommendations [CSE 2416]") October 25, 2016 Iris Hill Town Administrator Town of Edisto Beach 2414 Murray St Edisto Beach SC 29438 RE: Hurricane Matthew Beach Damage Assessment and Recommendations [CSE 2416] Dear Iris, Hurricane
October 25, 2016 Iris Hill Town Administrator Town of Edisto Beach 2414 Murray St Edisto Beach SC 29438 RE: Hurricane Matthew Beach Damage Assessment and Recommendations [CSE 2416] Dear Iris, Hurricane
New Jersey Beach Profile Network Atlantic County Profile Site Locations
 215 RICHARD STOCKTON COLLEGE OF NEW JERSEY New Jersey Beach Profile Network Atlantic County Profile Site Locations COASTAL RESEARCH CENTER Figure 128 There are nine NJBPN survey sites on the Atlantic County
Today: Coastal Issues and Estuaries
 Today: Coastal Issues and Estuaries Coastal issues Human effect on coastlines What is an estuary Why are they so important? Circulation of water in estuary Environmental issues Coastal Issues: Problem
Building Coastal Resiliency at Plymouth Long Beach
 Building Coastal Resiliency at Plymouth Long Beach Department of Marine and Environmental Affairs March 30, 2017 Introducing Green Infrastructure for Coastal Resiliency Plymouth Long Beach & Warren s Cove
Coastal management has lagged behind the growth in population leading to problems with pollution
 Fifty percent of the population of the industrialized world lives within 100 km of a coast. Coastal management has lagged behind the growth in population leading to problems with pollution and natural
Cross-shore sediment transports on a cut profile for large scale land reclamations
 Cross-shore sediment transports on a cut profile for large scale land reclamations Martijn Onderwater 1 Dano Roelvink Jan van de Graaff 3 Abstract When building a large scale land reclamation, the safest
Australian Coastal Councils Conference
 Australian Coastal Councils Conference Kiama March 2019 Where Has My Beach Gone? (and what can I do about it?) Dr Andrew McCowan Water Technology Where Has My Beach Gone? Where Has My Beach Gone? Where
GONE! Coastal Erosion Happens During Storms! Why Worry About Coastal Setbacks? Goals for Today
 RI Regulatory Setbacks & Buffers: Coastal Zone Management Issues New England Onsite Wastewater Training Program @ URI OWT 155 November 21, 2013 Goals for Today Understand the impacts of storms, coastal
Texas passes, longshore transport, hurricanes, beach erosion and sea level
 Texas passes, longshore transport, hurricanes, beach erosion and sea level Richard L. Watson, Ph.D. (361) 749-4152 Field work can be strange! 120,000 years of sea level Years each zone exposed above S/L
April 7, Prepared for: The Caribbean Disaster Emergency Response Agency Prepared by: CEAC Solutions Co. Ltd.
 April 7, 2006 Prepared for: The Caribbean Disaster Emergency Response Agency Prepared by: Introduction CEAC Solutions Co. Ltd was commissioned in May 2005 to prepare coastal beach erosion hazard maps for
Atlantic Coast of Long Island, Jones Inlet to East Rockaway Inlet, Long Beach Island, NY Construction Update
 Atlantic Coast of Long Island, Jones Inlet to East Rockaway Inlet, Long Beach Island, NY Construction Update June 2016 US Army Corps of Engineers Project Purpose Three specific damage mechanisms of coastal
Exemplar for Internal Assessment Resource Geography Level 3. Resource title: The Coastal Environment Kaikoura
 Exemplar for internal assessment resource Geography 3.5A for Achievement Standard 91430 Exemplar for Internal Assessment Resource Geography Level 3 Resource title: The Coastal Environment Kaikoura This
METHODOLOGY. Signalized Intersection Average Control Delay (sec/veh)
") Chapter 5 Traffic Analysis 5.1 SUMMARY US /West 6 th Street assumes a unique role in the Lawrence Douglas County transportation system. This principal arterial street currently conveys commuter traffic
Chapter 5 Traffic Analysis 5.1 SUMMARY US /West 6 th Street assumes a unique role in the Lawrence Douglas County transportation system. This principal arterial street currently conveys commuter traffic
Louisiana CPRA SJB Group, Baton Rouge Coastal Engineering Consultants U.S. Army Corps of Engineers Federal and State PDT Members
 Louisiana CPRA SJB Group, Baton Rouge Coastal Engineering Consultants U.S. Army Corps of Engineers Federal and State PDT Members Project Setting and Background Island Restoration Plans Pre-Screening Analysis
Nevis. Wise practices for coping with
 Wise practices for coping with Nevis Caribbean Sea Nevis Historical and Conservation Society Department of Physical Planning, Natural Resources and Environment, Fisheries Division University of Puerto
EXISTING AND PLANNED STRATEGIES AND ACTIONS CONNECTED WITH COASTAL PROTECTION IN ASPECT OF PREDICTED SEA LEVEL RISE
 EXISTING AND PLANNED STRATEGIES AND ACTIONS CONNECTED WITH COASTAL PROTECTION IN ASPECT OF PREDICTED SEA LEVEL RISE Andrzej Cieślak Long term coastal protection strategy In 2000 a new 1 Polish long term
CHAPTER 8 ASSESSMENT OF COASTAL VULNERABILITY INDEX
 124 CHAPTER 8 ASSESSMENT OF COASTAL VULNERABILITY INDEX 8.1 INTRODUCTION In order to assess the vulnerability of the shoreline considered under this study against the changing environmental conditions,
CALCASIEU SALINITY STRUCTURES. HYDRODYNAMIC MODELING (To Support Design of Salinity Barriers)
") CALCASIEU SALINITY STRUCTURES HYDRODYNAMIC MODELING (To Support Design of Salinity Barriers) Presentation Overview 1 2 3 4 5 Project Overview and CEA Circulation Modeling Vessel Hydrodynamics Modeling
CALCASIEU SALINITY STRUCTURES HYDRODYNAMIC MODELING (To Support Design of Salinity Barriers) Presentation Overview 1 2 3 4 5 Project Overview and CEA Circulation Modeling Vessel Hydrodynamics Modeling
RI Regulatory Setbacks & Buffers: Coastal Management Issues
 RI Regulatory Setbacks & Buffers: Coastal Management Issues New England Onsite Wastewater Training Program @ URI OWT 155 - November 29, 2012 James Boyd - Coastal Policy Analyst Photo: October 30, 2012
SPECIAL SPRING 2018 STORM REPORT ON THE CONDITION OF THE MUNICIPAL BEACHES FOR THE BOROUGH OF STONE HARBOR, CAPE MAY COUNTY, NEW JERSEY
 SPECIAL SPRING 2018 STORM REPORT ON THE CONDITION OF THE MUNICIPAL BEACHES FOR THE BOROUGH OF STONE HARBOR, CAPE MAY COUNTY, NEW JERSEY Aerial photograph taken April 21, 2018 showing the view up the beach
Technical Brief - Wave Uprush Analysis 129 South Street, Gananoque
 Technical Brief - Wave Uprush Analysis 129 South Street, Gananoque RIGGS ENGINEERING LTD. 1240 Commissioners Road West Suite 205 London, Ontario N6K 1C7 June 12, 2013 Table of Contents Section Page Table
REVETMENTS. Purposes and Operational Constraints. Purposes Erosion control o o. Revetment Design 4/5/2016. CE A676 Coastal Engineering
 REVETMENTS Ijsseldam, the Netherlands Orson P. Smith, PE, Ph.D. Instructor Purposes and Operational Constraints Purposes Erosion control o o Embankment Toe protection for a seawall, retaining wall or other
The Sand Beaches of New Hampshire and Maine
 The Sand Beaches of New Hampshire and Maine Beach Preservation and Erosion Control Photographs provided by Joe Kelly and Steve Adams Cover photo: Reid State Park, ME Introduction The sand beaches of New
INTRODUCTION TO COASTAL ENGINEERING
 The University of the West Indies Organization of American States PROFESSIONAL DEVELOPMENT PROGRAMME: COASTAL INFRASTRUCTURE DESIGN, CONSTRUCTION AND MAINTENANCE A COURSE IN COASTAL DEFENSE SYSTEMS I CHAPTER
IMPACTS OF COASTAL PROTECTION STRATEGIES ON THE COASTS OF CRETE: NUMERICAL EXPERIMENTS
 IMPACTS OF COASTAL PROTECTION STRATEGIES ON THE COASTS OF CRETE: NUMERICAL EXPERIMENTS Tsanis, I.K., Saied, U.M., Valavanis V. Department of Environmental Engineering, Technical University of Crete, Chania,
DUXBURY WAVE MODELING STUDY
 DUXBURY WAVE MODELING STUDY 2008 Status Report Duncan M. FitzGerald Peter S. Rosen Boston University Northeaster University Boston, MA 02215 Boston, MA 02115 Submitted to: DUXBURY BEACH RESERVATION November
23- Year Sand Volume Changes at Site 132, 15th Street, Brigantine
 149 Figure75. Location map for the 9 NJBPN profile sites in Atlantic County, NJ ATLANTIC COUNTY SPRING 2008 to FALL 2009 150 The Atlantic County oceanfront shoreline consists of three barrier islands.
Technical Brief - Wave Uprush Analysis Island Harbour Club, Gananoque, Ontario
 Technical Brief - Wave Uprush Analysis RIGGS ENGINEERING LTD. 1240 Commissioners Road West Suite 205 London, Ontario N6K 1C7 October 31, 2014 Table of Contents Section Page Table of Contents... i List
NYS Coastal Waters. Water Resources of NYS: THE NATURE of the COASTAL ZONE. NYS Coastal Waters. NYS Coastal Atlas. Coastal Zone Management 10/10/2014
 Water Resources of NYS: THE NATURE of the COASTAL ZONE NYS Coastal Waters NYS is the only state to border the Atlantic Ocean and the Great Lakes (Lakes Erie and Ontario). Great Lakes shoreline: 577 miles
Controlling Coastal erosion
 Controlling Coastal erosion Coastal Erosion Rates in the U.S. Coastal Erosion and Stabilization Economic pressures demanding the stabilization of beaches and coastlines are immense Coastal Erosion and
Table 4. Volumetric Change Rates Pre-Project and Post-Project for the Town of Duck
 V. VOLUMETRIC CHANGES General Volumetric changes measured over the entire monitoring area for various time periods are provided in Table 4. The volume changes are given in terms of cubic yards/foot of
An Update of Coastal Erosion in Puerto Rico
 Jack Morelock and Maritza Barreto An Update of Coastal Erosion in Puerto Rico Department of Marine Sciences, University of Puerto Rico at Mayagüez and Geography Department, University of Puerto Rico at
A REVIEW OF THE CONDITION OF THE MUNICIPAL BEACHES AS A RESULT OF HURRICANE SANDY IN THE BOROUGH OF STONE HARBOR, CAPE MAY COUNTY, NEW JERSEY
 A REVIEW OF THE CONDITION OF THE MUNICIPAL BEACHES AS A RESULT OF HURRICANE SANDY IN THE BOROUGH OF STONE HARBOR, CAPE MAY COUNTY, NEW JERSEY View along the dune scarp from 103 rd Street on October 31,
Evaluation of Placement Alternatives for Matagorda Ship Channel Bottleneck Removal
 Evaluation of Placement Alternatives for Matagorda Ship Channel Bottleneck Removal James Rosati III Ashley E. Frey CPT Grays Harbor, WA Wood Wood chips Flour Other CMS Shark River Inlet, NJ US Army Corps
SELECTION OF THE PREFERRED MANAGEMENT OPTION FOR STOCKTON BEACH APPLICATION OF 2D COASTAL PROCESSES MODELLING
 SELECTION OF THE PREFERRED MANAGEMENT OPTION FOR STOCKTON BEACH APPLICATION OF 2D COASTAL PROCESSES MODELLING C Allery 1 1 DHI Water and Environment, Sydney, NSW Abstract This paper presents an approach
Comments The Plan for Port Whitby
 Comments The Plan for Port Whitby April 24th, 2013 Community Meeting #2 Summary Report Prepared by GLPi April 29th, 2013 1 Introduction The purpose of the Port Whitby Secondary Plan Update, Community Improvement
Request Number IR1-12: Flow Passage. Information Request
 Request Number IR1-12: Flow Passage Information Request Provide additional information about the 100 metre flow passage channel scenario between the Westshore Terminals and the proposed Project terminal
Performance of Upham Beach T-Groin Project and Its Impact to the Downdrift Beach
 Performance of Upham Beach T-Groin Project and Its Impact to the Downdrift Beach Progress Report for the Period of October 2008 to April 2009 Submitted by Ping Wang, Ph.D., and Tiffany M. Roberts Department
Shorelines Earth - Chapter 20 Stan Hatfield Southwestern Illinois College
 Shorelines Earth - Chapter 20 Stan Hatfield Southwestern Illinois College The Shoreline A Dynamic Interface The shoreline is a dynamic interface (common boundary) among air, land, and the ocean. The shoreline
4/20/17. #30 - Coastlines - General Principles Coastlines - Overview
 Writing Assignment Due one week from today by 11:59 pm See main class web pages for detailed instructions Essays will be submitted in Illinois Compass (instructions later) Pick one: Earthquakes, tsunamis,
THE WAVE CLIMATE IN THE BELGIAN COASTAL ZONE
 THE WAVE CLIMATE IN THE BELGIAN COASTAL ZONE Toon Verwaest, Flanders Hydraulics Research, toon.verwaest@mow.vlaanderen.be Sarah Doorme, IMDC, sarah.doorme@imdc.be Kristof Verelst, Flanders Hydraulics Research,
Figure 1, Chart showing the location of the Breach at Old Inlet and sensors deployed in Great South Bay.
 The Impact on Great South Bay of the Breach at Old Inlet Charles N. Flagg and Roger Flood School of Marine and Atmospheric Sciences, Stony Brook University The Great South Bay project (http://po.msrc.sunysb.edu/gsb/)
GLY 5888 Coastal Hazards & Mitigation
 GLY 5888 Coastal Hazards & Mitigation Florida International University Department of Earth and Environment Instructor: Dr. Stephen Leatherman; Office: ACH5 Room 385; Phone: 305-348-8364; Email: Leatherm@fiu.edu
Beach Profiles. Topics. Module 9b Beach Profiles and Crossshore Sediment Transport 3/23/2016. CE A676 Coastal Engineering
 Beach Profiles AND CROSS-SHORE TRANSPORT Orson P. Smith, PE, Ph.D., Professor Emeritus Topics Features of beach and nearshore profiles Equilibrium profiles Cross-shore transport References Text (Sorensen)
Impact of Hurricane Matthew on the Atlantic Coast of Florida
 Impact of Hurricane Matthew on the Atlantic Coast of Florida A coastal engineer was driving across country and his jeep broke down in front of a monastery. It was late in the day and the monks invited
CROSS-SHORE SEDIMENT PROCESSES
 The University of the West Indies Organization of American States PROFESSIONAL DEVELOPMENT PROGRAMME: COASTAL INFRASTRUCTURE DESIGN, CONSTRUCTION AND MAINTENANCE A COURSE IN COASTAL DEFENSE SYSTEMS I CHAPTER
ST. JOSEPH PENINSULA, GULF COUNTY, FLORIDA Beach Re-Nourishment and Environmental Enhancement Project RECOMMENDATIONS
 ST. JOSEPH PENINSULA, GULF COUNTY, FLORIDA Beach Re-Nourishment and Environmental Enhancement Project RECOMMENDATIONS January 23, 2018 543 Harbor Boulevard, Suite 204 Destin, Florida 32541 850.654.1555
OECS Regional Engineering Workshop September 29 October 3, 2014
 B E A C H E S. M A R I N A S. D E S I G N. C O N S T R U C T I O N. OECS Regional Engineering Workshop September 29 October 3, 2014 Coastal Erosion and Sea Defense: Introduction to Coastal Dynamics David
Coastal Change and Conflict
 Coastal Change and Conflict Outline of the Topic Contrasting Coasts why do all coasts not look the same? Geology of the coast the impact rock structure has on the coastline Waves Constructive and destructive
Case study 64. Shoreham Harbour Shingle Bypassing and Recycling
 Case study 64. Shoreham Harbour Shingle Bypassing and Recycling Authors: Tony Parker, Uwe Dornbusch Main driver: Improved defences Project stage: Ongoing construction/operation since 1992 Photo 1: Shoreham
Wind Blow-out Hollow Generated in Fukiage Dune Field, Kagoshima Prefecture, Japan
 R. Nishi Wind Blow-out Hollow Generated in Fukiage Dune Field, Kagoshima Prefecture, Japan Ryuichiro Nishi, Li Elikson and Myokhin PREFACE A sand dune is vulnerable to severe waves and wind. Therefore,
Town of Duck, North Carolina
 Tracking No. 00.00.2010 Erosion Mitigation And Shoreline Management Feasibility Study Town of Duck, North Carolina Coastal Planning & Engineering of North Carolina August 15, 2012 Tom Jarrett Robert Neal
ST. LUCIE COUNTY, FLORIDA
 ST. LUCIE COUNTY, FLORIDA COASTAL STORM RISK MANAGEMENT STUDY Draft Feasibility Study & Integrated Environmental Assessment Public Meeting Presented by U.S. Army Corps of Engineers Jacksonville District
4/20/17. #32 - Coastal Erosion Case Histories - Lake Michigan
 Writing Assignment Due Monday by 11:59 pm #32 - Coastal Erosion Case Histories - Lake Michigan See main class web pages for detailed instructions Submit papers Illinois Compass No copying: Compass will
Follets Island Nearshore Beach Nourishment Project
 Coast & Harbor Engineering A division of Hatch Mott MacDonald Follets Island Nearshore Beach Nourishment Project Arpit Agarwal, P.E. April 1, 2016 Project Site!"#$% &'(% &)*+% )#,'-+% Shoreline Erosion
NORTHERN CELL OPTIONS SHORTLIST RECOMMENDATIONS
 OPTIONS SHORTLIST RECOMMENDATIONS Coastal Unit C: Bayview Options recommended for MCDA scoring. Status quo. Planting 3. Renourishment (gravel) 6. Beach-scraping 7. Restore shingle crest. Inundation accommodation
page - Laboratory Exercise #5 Shoreline Processes
 page - Laboratory Exercise #5 Shoreline Processes Section A Shoreline Processes: Overview of Waves The ocean s surface is influenced by three types of motion (waves, tides and surface currents). Shorelines
Oceans and Coasts. Chapter 18
 Oceans and Coasts Chapter 18 Exploring the oceans The ocean floor Sediments thicken and the age of the seafloor increases from ridge to shore The continental shelf off the northeast United States Constituent
Lecture Outlines PowerPoint. Chapter 15 Earth Science, 12e Tarbuck/Lutgens
 Lecture Outlines PowerPoint Chapter 15 Earth Science, 12e Tarbuck/Lutgens 2009 Pearson Prentice Hall This work is protected by United States copyright laws and is provided solely for the use of instructors
INFLUENCE OF DAMAGED GROINS ON NOURISHED SEASHORE
 INFLUENCE OF DAMAGED GROINS ON NOURISHED SEASHORE Ostrowski R 1., Pruszak Z. 1, Schönhofer J. 1, Szmytkiewicz M. 1, Szmytkiewicz P. 1 The system of timber palisade groins can be very helpful as a measure
Redondo Beach Boat Launch Ramp Facility
 Redondo Beach Boat Launch Ramp Facility Feasibility Report for the California Department of Boating and Waterways 2015 Grant Cycle For the City of Redondo Beach Submitted by March 13, 2014 Table of Contents