The Coastal Geomorphology of North Cornwall: St. Ives Head to Trevose Head.
|
|
|
- Jared Fowler
- 5 years ago
- Views:
Transcription
1 The Coastal Geomorphology of North Cornwall: St. Ives Head to Trevose Head. by DANIEL D. BUSCOMBE & TIMOTHY M. SCOTT Wave Hub Impact on Seabed and Shoreline Processes (WHISSP) University of Plymouth. c University of Plymouth, 2008.
2 ii A review of the scenery and coastal geomorphology of north Cornwall between St. Ives and Trevose Head, an area in the potential shadow of the proposed Wave Hub wave farm. This report comes ahead of the Wave Hub s proposed installation offshore of St. Ives in early 2009, and is made as part of the WHISSP (Wave Hub Impact on Seabed and Shoreline Processes) project at the University of Plymouth. A special emphasis is given to the character and physical attributes of the fifty-three individual beaches and coves in the study area, as well as the physical coastal processes in the region. c University of Plymouth, 2008.
3 Table of Contents 1 Overview The Wave Hub and WHISSP Physiography and Geology Wave and tidal regime Sediment and sediment transport Morphodynamic classification of WHISSP beaches Human Intervention and Shoreline Management St Ives Head to Godrevy Head Porthmeor Porth Gwidden Harbour Sand Porth Minster Carbis Bay Porth Kidney Sands and Hayle Estuary Phillack Towans Upton or Mexico Towans Gwithian Towans Godrevy Cove Godrevy Head to St. Agnes Head Mutton Cove Fishing Cove Hudder Down Hell s Mouth Hudder Cove Basset s Cove Porth-Cadjack Cove Western Cove Portreath Gooden Heane Cove Sally s Bottom Porth Towan Chapel Porth iii
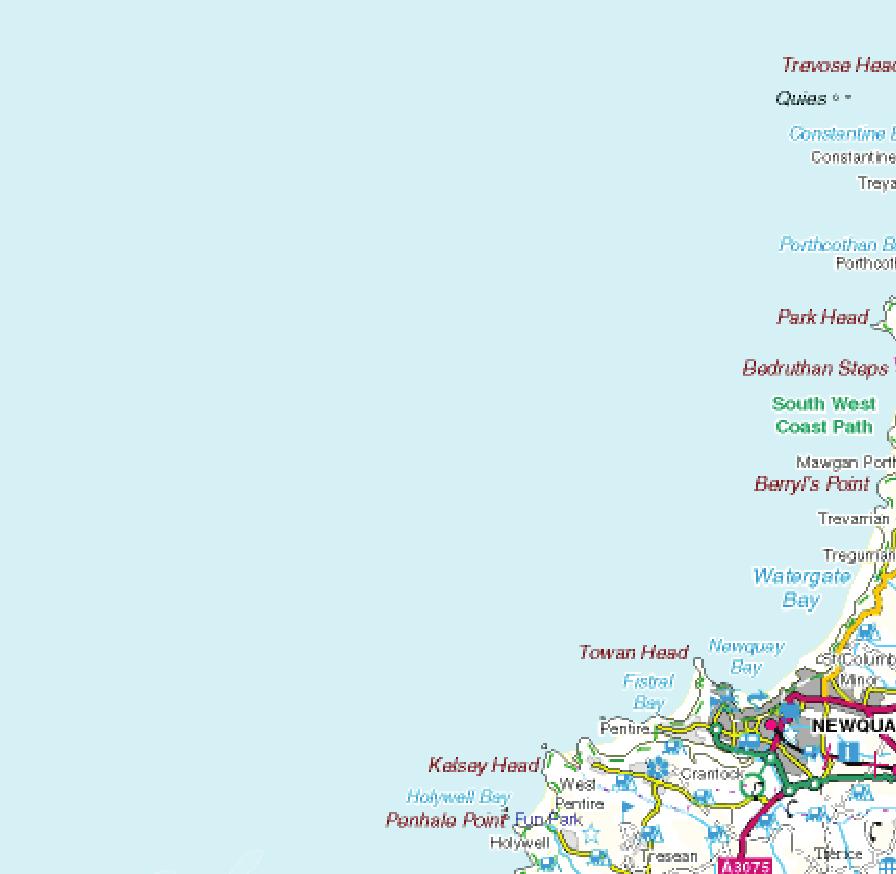
4 iv TABLE OF CONTENTS 4 St Agnes Head to Penhale Head Trevaunance Cove Grean Island Hanover Cove Perranporth Beach Hoblyn s Cove Holywell Beach Penhale Head to Porthcothan Porth Joke Crantock Beach Fistral beach Towan Beach Tolcarne Beach Lusty Glaze Porth Beach Whipsiderry Beach Watergate Beach Stem Cove Beacon Cove Mawgan Porth Trerathick Cove Whitestone Cove Bedruthan Steps or Pendarves Diggory s Island Pentire Steps The Saddle Porth Mear Porthcothan to Trevose Head Porthcothan Bay Fox Cove Pepper Cove Treyarnon Bay Constantine Bay Booby s Bay Bibliography 160
5 List of Figures & Plates 1.1 The proposed location of the wave hub site is marked with an arrow WHISSP study area (scale 1:230220) Tidal residuals within the study area, according to Halcrow [2002]. Arrow size is relative to magnitude of the tidal flux. Map extent is 100km Main rivers and tidal co-range lines in the WHISSP area. Source: Marine Digimap Bathymetric overview of the study area, according to Halcrow [2002]. The -5, -10, -20, -30, -50m depth contours are shown. Map extent is 100km Bathymetric contours of the WHISSP area. Source: Marine Digimap Overview of the seabed sediments in the study area, according to Halcrow [2002]. Darkest shading is bedrock, intermediate is gravel, and light shading is sand. Map extent is 100km, and the information has largely been gathered from the British Geological Survey of Morphodynamic classification of beach types (from Scott [in prep]) I: type and description Morphodynamic classification of beach types (from Scott [in prep]) II: conceptual matrix of beach types Protected areas and national limits. Source: Marine Digimap Locations of wrecked ships in the WHISSP study area. Source: Marine Digimap Locations of construction, obstructions and installations in the WHISSP study area. Source: Marine Digimap St Ives Head to Godrevy Head (scale 1:38794) Bathymetry of St Ives Bay. Source: Marine Digimap Digital Elevation Model of Porthmeor Beach, Elevations in m (ODN) 0 ODN (MSL) marked. Data courtesy of the Plymouth Coastal Observatory Porthmeor Beach (scale 1:7831) Porth Gwidden Beach (scale 1:7831) Digital Elevation Model of St Ives Harbour Beach, Elevations in m (ODN) 0 ODN (MSL) marked. Data courtesy of the Plymouth Coastal Observatory Harbour Sand Beach (scale 1:7831) Porthminster Beach (scale 1:7831) Digital Elevation Model of Carbis Bay Beach, Elevations in m (ODN) 0 ODN (MSL) marked. Data courtesy of the Plymouth Coastal Observatory Carbis Beach at low tide Carbis Bay or Barrepta Cove Beach (scale 1:7831) v
6 vi LIST OF FIGURES & PLATES 2.12 Digital Elevation Model of Hayle, Elevations in m (ODN) 0 ODN (MSL) marked. Data courtesy of the Plymouth Coastal Observatory Porth Kidney or Hayle Beach (scale 1:7831) Phillack Towans (scale 1:7831) Digital Elevation Model of Hayle to Gwithian, Elevations in m (ODN) 0 ODN (MSL) marked. Data courtesy of the Plymouth Coastal Observatory Upton Towans (scale 1:7831) Digital Elevation Model of Gwithian Beach, 11/02/2008. Elevations in m (ODN) 0 ODN (MSL) marked Gwithian Towans (scale 1:7831) Godrevy Beach at low tide Godrevy Cove (scale 1:7831) Godrevy Head to St. Agnes Head (scale 1:55358) Bathymetry of Godrevy to St Agnes. Source: Marine Digimap Mutton Cove (scale 1:7831) Fishing Cove to Hudder Cove (scale 1:7831) Basset s Cove to Porth-Cadjack Cove (scale 1:7831) Western Cove (scale 1:7831) Portreath Beach (scale 1:7831) Portreath Beach (at low tide Gooden Heane Cove (scale 1:7831) Sally s Bottom (scale 1:7831) Digital Elevation Model of Porth Towan Beach, 10/02/2008. Elevations in m (ODN) - 0 ODN (MSL) marked Porth Towan Beach at low tide Porth Towan Beach (scale 1:7831) Digital Elevation Model of Chapel Porth Beach, 09/02/2008. Elevations in m (ODN) - 0 ODN (MSL) marked Chapel Porth Beach at low tide Chapel Porth Beach (scale 1:7831) St. Agnes Head to Penhale Head (scale 1:55358) Bathymetry of St Agnes to Porthcothan. Source: Marine Digimap Trevaunance Cove Beach at low tide Trevaunance Cove and Grean Island (scale 1:7831) Hanover Cove (scale 1:7831) Digital Elevation Model of Perranporth Beach, 08/02/2008. Elevations in m (ODN) 0 ODN (MSL) marked Perranporth Beach at low tide Perran Sands/South Perranporth (scale 1:7831) Central Perranporth (scale 1:7831) North Perranporth (scale 1:7831) Hoblyn s Cove (scale 1:7831) Holywell Bay Beach (scale 1:7831) Penhale Head to Porthcothan (scale 1:67458) Porth Joke Beach (scale 1:7831) Digital Elevation Model of Crantock Beach, Elevations in m (ODN) - 0 ODN (MSL) marked. Data courtesy of the Plymouth Coastal Observatory
7 LIST OF FIGURES & PLATES Crantock Beach at low tide Crantock Beach (scale 1:7831) Digital Elevation Model of Fistral Beach, Elevations in m (ODN) - 0 ODN (MSL) marked. Data courtesy of the Plymouth Coastal Observatory Fistral Beach at low tide Fistral Beach (scale 1:7831) Towan Beach at low tide Towan Beach (scale 1:7831) Tolcarne and Lusty Glaze (scale 1:7831) Porth Beach and Whipsiderry (scale 1:7831) South Watergate or Tregurrian Beach (scale 1:7831) North Watergate or Tregurrian Beach (scale 1:7831) Stem Cove and Beacon Cove(scale 1:7831) Mawgan Porth Beach (scale 1:7831) Trerathick and Whitestone Coves (scale 1:7831) Bedruthan Steps Beach (scale 1:7831) Diggory s Island, Pentire Steps Beach and The Saddle (scale 1:7831) Porth Mear and Porthcothan Beach (scale 1:7831) Porthcothan to Trevose Head (scale 1:30747) Bathymetry of Porthcothan to Trevose. Source: Marine Digimap Fox Cove (scale 1:7831) Pepper Cove and Treyarnon Beach (scale 1:7831) Digital Elevation Model of Constantine Beach, summer Elevations in m (ODN) 0 ODN (MSL) marked Constantine and Boobys Beaches at low tide Constantine and Boobys Beaches (scale 1:7831)
8 2 LIST OF FIGURES & PLATES
9 Chapter 1 Overview 1.1 The Wave Hub and WHISSP On the 6th December 2007 the UK Secretary of State for Environment, Food and Rural Affairs permitted the South West of England Regional Development Agency (SWRDA) to provide the necessary infrastructure to support and encourage developers of wave energy converters (WECs) to trial clusters of renewable energy devices in a so-called wave-farm called the Wave Hub [SWRDA, 2008]. The proposed location is 20km northwest of St. Ives in north Cornwall, in 50-60m water depth [South West of England Regional Development Agency, 2006]. It will be able to generate 20 megawatts of electricity over a deployment area of 4 2 kilometres (see Figures 1.1 and 1.2), feeding to an electricity substation located behind the dunes at Hayle [South West of England Regional Development Agency, 2006]. It represents the world s first large scale wave farm, supporting up to 30 wave energy devices, expected to be operational in 2009 [SWRDA, 2008]. A modelling study carried out by South West of England Regional Development Agency [2006] suggested that the Wave Hub would cause between 3 and 5% reduction to wave height between Gwithian and Newquay, as well as minor changes to surface tidal currents and offshore bed elevations. However, due to the inherent uncertainty behind such coastal modelling approaches in this hydrodynamic data-poor region, the WHISSP (Wave Hub Impact on Seabed and Shoreline Processes) project has been commissioned at the University of Plymouth to model and monitor the impact on the sea bed and shoreline of devices deployed in the Wave Hub project [UoP, 2008]. One of the key areas for concern regarding Wave Hub is an estimated wave height attenuation and tidal current modification in the lee of the Hub, and the associated impact on sedimentation, beach topography and beach state. A particular focus of WHISSP will therefore be on those popular recreational beaches in the hub s shadow. While the extend of the shadow cannot be known until the WEC devices are installed, the maximum likely extend is the stretch of north Cornwall between St. Ives and Trevose (see Figure 1.2), which is therefore the subject of this manuscript. This report details fifty-three individual beaches and coves in the study area, which have been selected based on their area ( 1000 m 2 ). For each, a brief description of their character, physiography and physical attributes is given, based on the analysis of maps and secondary literature. The major beaches in the area, some fifteen in total, have also been sampled for their sediment and the results of particle size and carbonate analyses are given. Where available, 3
10 4 The Wave Hub and WHISSP Figure 1.1 The proposed location of the wave hub site is marked with an arrow.
11 Physiography and Geology 5 panoramic photos, beach profiles and digital elevation models are presented, based on recent surveys. Finally, these fifteen major beaches have been classified under a morphodynamic classification scheme. 1.2 Physiography and Geology No other English county has as long a coastline as Cornwall. The stretch of coast between St. Ives Head and Trevose Head is relatively straight, with high cliffs and rocky headlands and a high proportion of coastal sand dunes. The geology in this part of north Cornwall has been classified as resistant and as having a high average resistance by Clayton and Shamoon [1998], being composed of sandstones, shales, conglomerates, (Old Red Sandstone) slates and limestones which are Devonian ( Ma BP) in age. This relative resistance is aided by the fact that cornwall was not glaciated under any Pleistocene glaciation, therefore there is no cover of weathered glacial material. The primary control on the evolution and behaviour of this stretch of coastline is the resistant nature of the geology [Halcrow, 2002]. The geology of the western section between St Ives and Newquay is dominated by the Porthtowan formation which consists of slates interbedded with sandstones and siltstones. This outcrops at Black Cliff near Hayle, and again north-east past Godrevy Point, and between Porthtowan and Perranporth. This formation has undergone metamorphic modification at St Agnes Head and Cligga Head [Bird, 1998]. The geology east of Newquay is dominated by the Trevose Slates, composed of slates with thin bands of limestone and volcanics, common between Bedruthan Steps and Trevose Head. The geology around Pentire Point is unique in that it is made up of Devonian pillow lavas and intruded volcanic lithologies [Bird, 1998]. These Devonian rocks vary considerably in hardness locally: the bays such as St Ives and Constantine are the result of relatively weak geology, and the many smaller coves have developed along minor faults in the rocks. The form and height of the cliffs is governed to a certain extent by being erosion platforms of Tertiary age. Between 80ka BP and 120ka BP the sea level in Cornwall was 2 3m above its present position, and between 80ka BP and 6ka BP the sea level was lower than it is today. At the Last Glacial Maximum (LGM) the Cornish sea level was at least 120m lower than its present level [Bird, 1998; Scourse and Furze, 1999]. The mean sea level has been approximately stable since 6ka BP. North Cornwall is undergoing subsidence following the Lateglacial and Holocene deglaciation of the British Isles, at a rate of -1.1 mm a 1 [Shennan and Horton, 2002; UKCIP, 2006], recently revised down to -0.5 mm a 1 [DEFRA, 2006] based on new evidence by Gehrels [2006]. Whilst not glaciated during the Pleistocene (between 2 million and 10,000 years old), the landscape of north Cornwall is dominated by Pleistocene periglacial deposits, which locally can be important sources of sediment in the coastal system. Such sediments may be broadly classified into raised beach deposits, and head deposits. The raised beach deposits (found near Godrevy on the eastern side of St Ives Bay and Fistral near Newquay) were termed the Godrevy Formation by Scourse and Furze [1999] and were laid down 120,000 years ago during the high sea level phase of the Ipswichian interglacial. Their survival gives some indication of cliff recession rates, which must have been slow on these sections of coast. The Godrevy Formation is described in more detail by Campbell [1998]. Head deposits are extensive and consist of unconsolidated and poorly sorted mixtures of locally-derived rocks and sands/muds, formed by freeze-thaw and slumping/solifluction during glacial periods between 75ka BP and 25ka BP [Scourse and Furze, 1999]. In some locations, submerged forests may be found which


12 6 Physiography and Geology Wave Hub Area Figure 1.2 WHISSP study area (scale 1:230220)
13 Wave and tidal regime 7 are relict from past low sea levels (e.g. Portreath and Constantine). Periglacial deposits are variable in nature, being composed of varying proportions of sands, gravels, boulders and muds. This explains some of the intra-beach sedimentary variability along this stretch of coastline. Measurable rates of coastal erosion are generally only found where the head deposits covering the bedrock are relatively unconsolidated [Halcrow, 2002].The diverse scenery of sandy beaches and dunes is also influenced heavily by local rivers (e.g. Perranporth and Porth Towan) and high and low cliffs of varying lithology, into which erosional features such as stacks, arches and hanging valleys have been cut. The study area has a large proportion of hindshore sand dunes compared with the national average. These dunes, such as at Phillack to Gwithian Towans, Godrevy Towans, Penhale and Holywell, develop to some considerable distance inland above beaches develop in sediment-rich areas under strong onshore winds. Gravel and boulders is present in smaller coves and fluvially-dominated systems such as Porthtowan, Porth Joke and Mawgan Porth, but in largely insignificant quantities [JNCC, 2008]. Well developed gravel and boulder ridges are absent from the study area. The WHISSP beaches are characterised by low erosion rates (relative stability) due to high inputs of sediment from offshore. This makes the beach material unusually high in carbonate (up to 90%), especially since mineralgic contributions from local cliffs are relatively small. They are characterised by large tidal ranges and significant wave heights, thus large redistributions of material during storms and a strong seasonal component to beach change. On nearly all of the WHISSP beaches, dominant controls are also played by some combination of intertidal rock outcrops (for example constraining rip channels at high tide) and streams which discharge directly into the beach. For any given beach, exchanges of material on/offshore are likely to be more significant than exchanges alongshore. 1.3 Wave and tidal regime The spring tidal range of the study area is of the order 5 6m [UKHO, 2003], and the 10% exceedance significant wave height of 2.5 3m [Draper, 1991; NERC, 1998], characterised by a mixture of Atlatic swell and locally-generated fetch-limited sea. This is amongst the strongest wave action in UK coastal waters. Tidal currents (Figure 1.3) are generally weak ( 0.75m/s) except locally around headlands (such as Godrevy Head). The co-range lines are seen in Figure 1.4. A recent study [Millar et al., 2007] modelled the likely sensitivity of the wave climate to the proposed Wave Hub wave farm, concluding that the likely effects will be small. Table 1.1 reproduces some of the findings for wave height reduction associated with various transmission scenarios at different beaches along the study area (zero transmission refers to total wave absorption and is included purely for reference - note that a 90% transmission is a likely figure). This study concluded that at 90% transmission the average reduction in significant wave height was of the order 1cm, and that the stretch of the coast most likely to be affected was between Godrevy Head at the east of St Ives Bay and Towan Head to the west of Newquay Bay.
![8 Wave and tidal regime Figure 1.3 Tidal residuals within the study area, according to Halcrow [2002]. Arrow size is relative to magnitude of the tidal flux. Map extent is 100km. Table 1.](/docs-images/81/83871277/images/14-0.jpg "1 Summary of the model findings of Millar et al. [2007] Location Parameter 0% energy transmission 90% energy transmission Gwithian Max. H s /H s (%) 11.72 1.08 Av. H s /H s (%) 3.44 0.")
14 8 Wave and tidal regime Figure 1.3 Tidal residuals within the study area, according to Halcrow [2002]. Arrow size is relative to magnitude of the tidal flux. Map extent is 100km. Table 1.1 Summary of the model findings of Millar et al. [2007] Location Parameter 0% energy transmission 90% energy transmission Gwithian Max. H s /H s (%) Av. H s /H s (%) Porth Towan Max. H s /H s (%) Av. H s /H s (%) Perranporth Max. H s /H s (%) Av. H s /H s (%) Fistral Max. H s /H s (%) Av. H s /H s (%) Newquay Max. H s /H s (%) Av. H s /H s (%) Watergate Max. H s /H s (%) Av. H s /H s (%) Constantine Max. H s /H s (%) Av. H s /H s (%)
15 Wave and tidal regime 9 Figure 1.4 Main rivers and tidal co-range lines in the WHISSP area. Source: Marine Digimap.

16 10 Sediment and sediment transport 1.4 Sediment and sediment transport A numerical modelling study by Pingree and Griffiths [1979] suggested that the north coast of Cornwall undergoes net north-westerly sediment transport under prevailing westerly/southwesterly waves. It would appear, however, that there is a discrepancy in this well-supported point of view and evidence of bedform symmetry [Stride, 1963] which would suggest the opposite. Waves cause strong seasonal onshore/offshore movements of sediment at the shore [Scott et al., 2007], however there is thought to be limited movement in deeper water due to the low volume of sediment available, and the pattern on inlets and headlands [Halcrow, 2002]. According to Halcrow [2002], wave-induced currents are considerably more important than tide-induced currents in nearshore sediment transport affecting beaches. Based on what limited information there is on nearshore sediment circulation patterns in the study area, it is thought that sand stays close to the coast with its movement driven by south-westerly swell and north/easterly wind waves during storms. Figure 1.5 Bathymetric overview of the study area, according to Halcrow [2002]. The -5, -10, -20, -30, -50m depth contours are shown. Map extent is 100km. The seabed slopes quickly to the -50m bathymetric contour offshore (Figures 1.5 and 1.6), after which it flattens considerably to the inner continental shelf at about 1m/km. The bathymetry is relatively uncomplicated, being approximately parallel to shore until approximately -60m. Offshore, the bedrock consists of slates and sandstones of Devonian and
17 Sediment and sediment transport 11 Figure 1.6 Bathymetric contours of the WHISSP area. Source: Marine Digimap.
 layer of sand and gravel of Quaternary age.")
18 12 Sediment and sediment transport Carboniferous age. In places, submerged cliffs and valleys formed during Pleistocene glacial periods when sea levels were lower occur, covered by a thin ( 1m) layer of sand and gravel of Quaternary age. The reason for the sparse sedimentary covering offshore is probably because of the lack of terrestrial sediment supply from glacial weathering, as well as the relatively resistant bedrocks. Ancient fluvial channels have been detected offshore but are probably of minor hydrodynamic importance [Halcrow, 2002]. There is limited seismic seabed composition data available for this stretch of coast. The carbonate content of the beaches of the study area is unusually high, up to 80% [Goudie, 1990; Halcrow, 2002] to the west of the study area at St Ives. This material is sourced largely from offshore from the calcareous shells and cases of marine bryozoa and echinoid [Halcrow, 2002], broken up and driven onshore by large waves. North Cornwall has a long history of mining activity, which has supplied a significant proportion of muds and fine sands to the coastal system (Figure 1.7). Old mining sites such as around St Ives and St Agnes contain sediments rich in minerals such as tin, copper, lead, iron and antimony [JNCC, 2008]. The majority of beaches in the study area are influenced by rivers which discharge directly into the beaches, which affect the local sedmentary makeup as well as drainage and the position and size of rip channels. The influence of these rivers on the coast is poorly studied. Figure 1.7 Overview of the seabed sediments in the study area, according to Halcrow [2002]. Darkest shading is bedrock, intermediate is gravel, and light shading is sand. Map extent is 100km, and the information has largely been gathered from the British Geological Survey of 1987.
19 Morphodynamic classification of WHISSP beaches Morphodynamic classification of WHISSP beaches The main WHISSP beaches have been classified according to the classification scheme of Scott [in prep] which is specifically designed for macrotidal beaches of the UK. Reflective beaches are steep and have a reflective energy regime of plunging/surging breakers throughout a tidal cycle. Dissipative beaches have shallow slopes and tend to attenuate rather than reflect energy through spilling breakers in a wide surf zone. Consequently, relatively little energy reaches the shoreline. Intermediate beaches lie somewhere between reflective and dissipative beaches and tend to be morphologically more complicated or three-dimensional (varying alongshore). Figures 1.8 and 1.9 provide a detailed explanation of the classification scheme used. Table 1.2 Beaches in the study area classified according to a morphodynamic classification scheme Beach Type Sub-type Morphology HW LW Porthmeor Intermediate Reflective Intermediate Low tide terrace + bar/rip Carbis Dissipative Dissipative Dissipative Non-barred dissipative Hayle Dissipative Intermediate Intermediate Low tide bar/rip Gwithian Dissipative Intermediate Intermediate Low tide bar/rip Portreath Intermediate Reflective Intermediate Low tide terrace + bar/rip Porthtowan Dissipative Intermediate Intermediate Low tide bar/rip Chapelporth Dissipative Intermediate Intermediate Low tide bar/rip Crantock Dissipative Intermediate Intermediate Low tide bar/rip Fistral Intermediate Reflective Intermediate Low tide terrace + bar/rip Towan Dissipative Dissipative Dissipative Non-barred dissipative Watergate Dissipative Intermediate Intermediate Low tide bar/rip Porthcothan Dissipative Intermediate Intermediate Low tide bar/rip Constantine Intermediate Intermediate Intermediate Low tide terrace + bar/rip Boobys Intermediate Intermediate Intermediate Low tide terrace + bar/rip 1.6 Human Intervention and Shoreline Management The entire stretch from Lands End to Trevose Head comprises one subcell (b - St Ives Head to Hartland Point) of management unit 7 (Lands End to Hartland Point) in the Shoreline Management Plan (SMP - see Figure 1.3) for the UK [Motyka and Brampton, 1993; Cooper et al., 2002], under the responsibility of the Cornwall and Isles of Scilly Coastal Authorities Group, a consortium composed of Cornwall County Council, English Nature, the Environment Agency, and Caradon, Carrick, Isles of Scilly, Kerrier, Penwith, North Cornwall, and Restormel District Councils. Table 1.4 contains a summary of present shoreline management activities, which collectively amounts to not a great deal of hard defences compared to many other regions of England and Wales. JNCC [2008] have designated a number of GCRs (Geological Conservation Review sites) in a number of SSSIs (Sites of Special Scientific Interest) in the study area. In fact, most of the study area comprises one GCR or another (see Table 1.5). These are areas of geological interest which require special protection, mintenance, appreciation and research.
 I:")
20 14 Human Intervention and Shoreline Management Figure 1.8 Morphodynamic classification of beach types (from Scott [in prep]) I: type and description.
 II:")
21 Human Intervention and Shoreline Management 15 Figure 1.9 Morphodynamic classification of beach types (from Scott [in prep]) II: conceptual matrix of beach types.
22 16 Human Intervention and Shoreline Management Table 1.3 Halcrow [2002] divisions for SMP Cell 7b (St Ives Head to Hartland Point) SBS (Shoreline Behaviour Statement) St Ives Bay (St Ives Head to Godrevy Point) Godrevy Point to Pentire Point Pentire Point to Hartland Point LSRS (Local Scale Shoreline Response) St Ives Carbis Bay to Godrevy Godrevy Point to Perranporth Perranporth to Towan Head Towan Head to Trevose Head Trevose Head to Pentire Point Pentire Point to Widemouth Bay Widemouth Bay to Crooklets Crooklets to Hartland Point Figure 1.10 Protected areas and national limits. Source: Marine Digimap.
23 Human Intervention and Shoreline Management 17 Table 1.4 Summary of present shoreline management activities Beach Porthmeor Porth Gwidden Harbour Sand Porth Minster Carbis Bay Porth kidney and Hayle Phillack Upton Towans Gwithian Towans Godrevy Cove Mutton Cove Fishing Cove Hudder Fown Hell s Mouth Hudder Cove Basset s Cove Porth-cadjack Cove Western Cove Portreath Gooden Heane Cove Sally s Bottom Porth Towan Chapel Porth Trevaunance Cove Grean Island Hanover Cove Perranporth Hoblyn s Cove Holywell Porth Joke Crantock Fistral Towan Tolcarne Lusty Glaze Porth Whipsiderry Watergate Stem Cove Beacon Cove Mawgan Porth Trerathick Cove Whitestone Cove Bedruthan Steps Diggory s Island Pentire Steps The Saddle Porth Mear Porthcothan Bay Fox Cove Pepper Cove Treyarnon Bay Constantine Bay Booby s Bay Management stone gabion sea wall; harbour pier sea wall sea wall estuary dredging; sluicing dune management; sand extraction dune management; sand extraction dune management; gravel-sand bund sea wall; harbour pier sea wall; river training sea wall; river training sea wall sea wall; river training dune management dune management sea wall; stone gabion; harbour beach de-watering system; harbour sea wall; river training sea wall; gabion sea wall; gabion dune management sea wall
24 18 Human Intervention and Shoreline Management Table 1.5 GCR Sites between St Ives Head and Trevose Head [JNCC, 2008]. SSS1 GCR Grid Reference Aire Point to Carrick Du Porthmeor Cove SW Bedruthan Steps Bedruthan Steps SW Godrevy Head to St Agnes Godrevy SW Godrevy Point and Strap Rocks SW Wheal Coates SW Gwithian to Mexico Towans Upton and Gwithian Towans SW Harbour Cove Harbour Cove SW Penhale Dunes Cotty s Point, Perranporth SW Gravel Hill Mine SW Perran Beach to Holywell Bay SW Pentire Peninsula Pentire Head SW Pentire Point - Rumps Point SW Polzeath to Pentire Point SW St Agnes Beacon St Agnes Beacon Pits SW Trevaunance Cove Trevaunance Cove SW Trevone Bay Marble Cliff SW Pentonwarra Cliff SW Porthmissen Bridge SW Trevone Bay SW Trevose Head and Constantine Bay Booby s Head to Trevose Head SW Dinas Head to Trevose Head SW849764
25 Human Intervention and Shoreline Management 19 Coastal erosion is limited compared with the east and south-east coasts of England. Cliff recession is occuring at such a slow rate it is difficult to measure, however sand dune erosion is an increasing concern [JNCC, 2008; Halcrow, 2002]. The risk of coastal flooding is greatest when a storm surge amplifies the spring high tide. Portreath and Perranporth are considered to be at greatest risk from coastal flooding [JNCC, 2008].
26 20 Human Intervention and Shoreline Management Cell Site Foreshore Backshore Map Dates St. Ives Bay w103 widening short 1889, 1908, 1938, 1963, 1989, 2000 w104 no change no change 1908, 1963 w105 long widening 1889, 1908, 1938, 1963, 1979, 1989, 2000 w106 long no change 1908, 1963, 2000 Godrevy to Pentire Point w107 no change no change 1908, 1963, 2000 w108 widening no change 1888, 1908, 1963, 1982, 2000 w109 widening no change 1908, 1963, 2000 w110 widening long 1888, 1908, 1963, 1982, 2000 w111 widening no change 1908, 2000 w112 no change widening 1908, 1963, 2000 w113 long widening 1908, 1963, 2000 w114 long widening 1908, 1963, 2000 w115 long widening 1888, 1908, 1933, 1963, 1976, 2000 w116 long long 1888, 1908, 1933, 1963, 1973, 1993, 2000 w117 widening widening 1907, 1963, 2000 w118 long widening 1907, 1963, 2000 w119 widening widening 1888, 1907, 1963, 1974, 2000 w120 widening short 1888, 1907, 1933, 1963, 1974, 2000 w121 widening long 1888, 1907, 1933, 1963, 1974, 1983, 2000 w122 long short-medium 1888, 1907, 1933, 1963, 1974, 1983, 2000 w123 widening widening 1888, 1907, 1983, 2000 w124 long no change 1888, 1907, 1933, 1963, 1974, 1983, 2000 w125 long short-medium 1888, 1907, 1933, 1963, 1974, 1983, 2000 w126 long widening 1888, 1908, 1963, 1976, 2000 w127 long widening 1888, 1907, 1933, 1963, 1976, 2000 w128 long widening 1907, 1963, 2000 w129 long widening 1888, 1907, 1933, 1978, 2000 w130 long widening 1888, 1907, 1963, 1978, 2000 w131 no change no change 1907, 1962, 2000 w132 long no change 1907, 1962, 2000 Table 1.6 Halcrow [2002] shoreline trend analysis, from historical map analysis. No change refers to zero mean rate of shoreline change. Widening refers to a positive mean rate of shoreline change. Long refers to the projected life of an eroding shoreline being 100 years. Short refers to the projected life of an eroding shoreline being 20 years. Short-medium refers to the projected life of an eroding shoreline being years.
27 Location Behaviour Height Engineering Materials Failure Activity Supply (mod) Potential Porthmeor Beach Simple cliffs 20 Cliff stabilisation, Toe protection 1,9 1 Inactive 3m Porthminster Beach Simple cliffs 30 Cliff stabilisation, Toe protection 1,9 1,4 Marginally stable 3m Porthminster Point to Hayle Simple cliffs 40 None 9 1,4ds Marginally stable 3c Black Cliff, Phillack Simple cliffs 30 None 9 1,2,4ds Marginally stable 3c Gwithian Simple cliffs 15 None 4,9 1,4ds Active 2m Godrevy Point to Portreath Simple cliffs 80 None 7,9 1,2,4rs Active 1c Portreath to Porthtowan Simple cliffs 75 None 7,9 1,2,4rs Active 1c St Agnes Head Simple cliffs 90 None 9 1,2 Marginally stable 3c Travellas Simple cliffs 85 None 7,9 1,2,4rs Active 1c Perranporth Simple cliffs 80 None 9 1,2 Marginally stable 3c Penhale to Pentire Simple cliffs 40 None 9 1,2,4ds Marginally stable 3c Newquay Simple cliffs 40 None 9 1,2 Marginally stable 3c Whipsiderry to Treyarnon Simple cliffs 60 None 7,9 1,2,4ds Active 1c Constantine Bay Simple cliffs 20 None 9 1,2 Marginally stable 3c Trevose Head Simple cliffs 70 None 9 1,2 Marginally stable 3c Table 1.7 Cliff classification. Data modified from Halcrow [2002], from video and map analysis. Materials are classified as follows: 1. Weak superficial deposits (WSD); 2. WSD over jointed weak rock (JWR); 3. Stiff clays (SC); 4. Weak sandy strata (WSS); 5. SC over WSS; 6. SC overlain by hard caprock; 7. Jointed weak rock (JWR); 8. Weak rock (chalk); 9. Hard rock. Failure mechanisms are classified as follows: 1. Erosion; 2. Falls; 3. Flows; 4. Slides; sr. single rotational; mr. multi rotational; md. mudslide; ds. debris slide Sediment supply potential is classified as: 1. High; 2. Medium; 3. Low; f. fine; m. medium; c. coarse. Human Intervention and Shoreline Management 21
28 22 Human Intervention and Shoreline Management Location Sensitivity Recession Potential Recession Frequency Uncertainty Notes Porthmeor Beach Low 5 1 Moderate Cliffs regraded and protected for development Porthminster Beach Medium 5,8 1,3 Moderate Cliffs engineered for road access and development Porthminster Point to Hayle Low 5,8 1,3 High Degraded coastal slopes above rock sea cliff Black Cliff, Phillack Low 5,8 1,3 High Gwithian Medium 4,8 1,2 High Godrevy Point to Portreath Medium 4,7 1,3 High Large rockslides apparent 2001 Portreath to Porthtowan Medium 4,7 1,3 High Large rockslides apparent 2001 St Agnes Head Low 5,8 1,2 High Degraded slopes above rock sea cliff; quarry/mining works Travellas Medium 4,7 1,3 High Large rockslides apparent 2001; quarry/mining works Perranporth Low 5,8 1,2 High Degraded slopes above rock sea cliff; quarry/mining works Penhale to Pentire Low 5,8 1,2 High Cliffs obscured by blown sand in places Newquay Low 5,8 1,3 High Whipsiderry to Treyarnon Medium 4,7 1,3 High Large rockslides apparent 2001 Constantine Bay Low 5,8 1,2 High Table 1.8 Future behaviour of cliffs. Data modified from Halcrow [2002], from video and map analysis. Recession potential (annual erosion rate) is classified thus: 1. Very high 2m/yr; 2. High 1-2m/yr; 3. Medium 0.5-1m/yr; 4. Low m/yr; 5. Very low 0.1m/yr; 6. High 50m ( 1ha); 7. Medium 10-50m (0.2-1ha); 8. Low 10m ( 0.2ha) Recession (event) frequency is classified thus: 1. 1 year (erosion); years; years; years; years.
29 Human Intervention and Shoreline Management 23 Figure 1.11 Locations of wrecked ships in the WHISSP study area. Source: Marine Digimap.
30 24 Human Intervention and Shoreline Management Figure 1.12 Locations of construction, obstructions and installations in the WHISSP study area. Source: Marine Digimap.
St Ives Head to Godrevy Head
 Chapter 2 St Ives Head to Godrevy Head Figure 2.1 St Ives Head to Godrevy Head (scale 1:38794) The stretch of coast between St Ives and Godrevy contains 10 beaches, comprising a total area of 2,802,500
PDZ: 10 Clodgy Point to Godrevy Point Management Area 25 Management Area 26 Management Area 27 Management Area 28 DRAFT
 PDZ: 10 Clodgy Point to Godrevy Point Management Area 25 Management Area 26 Management Area 27 Management Area 28 Clodgy Point to Godrevy Point This area encompasses St Ives Bay and is made up of both
PDZ: 10 Clodgy Point to Godrevy Point Management Area 25 Management Area 26 Management Area 27 Management Area 28
 PDZ: 10 Clodgy Point to Godrevy Point Management Area 25 Management Area 26 Management Area 27 Management Area 28 Looking toward Hayle from Godrevy Towans Clodgy Point to Godrevy Point This area encompasses
Australian Coastal Councils Conference
 Australian Coastal Councils Conference Kiama March 2019 Where Has My Beach Gone? (and what can I do about it?) Dr Andrew McCowan Water Technology Where Has My Beach Gone? Where Has My Beach Gone? Where
Chapter - Oceans and Coasts
 Chapter - Oceans and Coasts Discussion: What do oceans contribute to the environment of Earth? How do Earth s major systems relate to the oceans? Oceans and Coasts Oceans are important - Thermal regulation
Chapter 10 Lecture Outline. The Restless Oceans
 Chapter 10 Lecture Outline The Restless Oceans Focus Question 10.1 How does the Coriolis effect influence ocean currents? The Ocean s Surface Circulation Ocean currents Masses of water that flow from one
HIGH VOLUME SEDIMENT TRANSPORT AND ITS IMPLICATIONS FOR RECREATIONAL BEACH RISK
 HIGH VOLUME SEDIMENT TRANSPORT AND ITS IMPLICATIONS FOR RECREATIONAL BEACH RISK Tim Scott 1, Paul Russell 1, Gerhard Masselink 1, Adam Wooler 2 and Andrew Short 3 In a coastal region where there are large
Beach profile surveys and morphological change, Otago Harbour entrance to Karitane May 2014 to June 2015
 Beach profile surveys and morphological change, Otago Harbour entrance to Karitane May 2014 to June 2015 Prepared for Port Otago Ltd Martin Single September 2015 Shore Processes and Management Ltd Contact
Coastal Change and Conflict
 Coastal Change and Conflict Outline of the Topic Contrasting Coasts why do all coasts not look the same? Geology of the coast the impact rock structure has on the coastline Waves Constructive and destructive
COASTAL ENVIRONMENTS. 454 lecture 12
 COASTAL ENVIRONMENTS Repeated movement of sediment & water constructs a beach profile reflecting the balance between average daily or seasonal wave forces and resistance of landmass to wave action Coasts
Oceans and Coasts. Chapter 18
 Oceans and Coasts Chapter 18 Exploring the oceans The ocean floor Sediments thicken and the age of the seafloor increases from ridge to shore The continental shelf off the northeast United States Constituent
There are many different kinds of beaches which are generally characterized by the dominance of waves, tides, rivers and currents, and in particular
 Fig. 11-11, p. 253 There are many different kinds of beaches which are generally characterized by the dominance of waves, tides, rivers and currents, and in particular differ by the amount of energy, which
COASTAL SYSTEMS WAVE ENERGY
 WAVE ENERGY The energy of a wave determines its ability to erode and transport material on the coast Wave energy depends on the fetch, the distance the wind has blown the wave Wind strength and wind duration
Shorelines Earth - Chapter 20 Stan Hatfield Southwestern Illinois College
 Shorelines Earth - Chapter 20 Stan Hatfield Southwestern Illinois College The Shoreline A Dynamic Interface The shoreline is a dynamic interface (common boundary) among air, land, and the ocean. The shoreline
Management Area 19 Management Area 20 Management Area 21 Management Area 22. Mount s Bay West (The Greeb to Point Spaniard)
") PDZ: 8 Mount s Bay West (The Greeb to Point Spaniard) (Including Marazion and St Michael s Mount) Management Area 19 Management Area 20 Management Area 21 Management Area 22 Mount s Bay West (The Greeb
PDZ: 8 Mount s Bay West (The Greeb to Point Spaniard) (Including Marazion and St Michael s Mount) Management Area 19 Management Area 20 Management Area 21 Management Area 22 Mount s Bay West (The Greeb
Shore - place where ocean meets land Coast - refers to the larger zone affected by the processes that occur at this boundary.
 Waves, Beaches, and Coasts Shore - place where ocean meets land Coast - refers to the larger zone affected by the processes that occur at this boundary. Waves: energy moving through water The height of
Coasts. 1. Coastal Processes. 1.1 Coastal erosion. 1.2 Sediment transport. Coastal Processes and Landforms. i. Hydraulic action
 Coasts Coastal Processes and Landforms 1. Coastal Processes 1.1 Coastal erosion i. Hydraulic action When waves strike against a rock surface, the waves trap air in the rock joints. This air is compressed
Overview. Beach Features. Coastal Regions. Other Beach Profile Features. CHAPTER 10 The Coast: Beaches and Shoreline Processes.
 Overview CHAPTER 10 The Coast: Beaches and Shoreline Processes Coastal regions constantly change. The beach is a dominant coastal feature. Wave activity continually modifies the beach and coastal areas.
IMPACTS OF COASTAL PROTECTION STRATEGIES ON THE COASTS OF CRETE: NUMERICAL EXPERIMENTS
 IMPACTS OF COASTAL PROTECTION STRATEGIES ON THE COASTS OF CRETE: NUMERICAL EXPERIMENTS Tsanis, I.K., Saied, U.M., Valavanis V. Department of Environmental Engineering, Technical University of Crete, Chania,
OECS Regional Engineering Workshop September 29 October 3, 2014
 B E A C H E S. M A R I N A S. D E S I G N. C O N S T R U C T I O N. OECS Regional Engineering Workshop September 29 October 3, 2014 Coastal Erosion and Sea Defense: Introduction to Coastal Dynamics David
Reading Material. Inshore oceanography, Anikouchine and Sternberg The World Ocean, Prentice-Hall
 Reading Material Inshore oceanography, Anikouchine and Sternberg The World Ocean, Prentice-Hall BEACH PROCESSES AND COASTAL ENVIRONMENTS COASTAL FEATURES Cross section Map view Terminology for Coastal
Appendix C Defences Assessment DRAFT
 Appendix C Defences Assessment Appendix C March 2010 Appendix C March 2010 Defences Assessment The following text summarises the coast protection and sea defences present in the Cornwall and Isles of Scilly
Map 8: Ayrshire Coast: Ardrossan North Bay to Stevenston Pier Map Content Descriptions
 Map 8: Ayrshire Coast: Ardrossan North Bay to Stevenston Pier Map Content Descriptions 1. Built Heritage and Archaeology A total of twenty four sites were recorded in the area covered by Map 8. Of these
Label the diagram below with long fetch and short fetch:
 Coastal Processes Coasts are shaped by the sea and the action of waves. The processes that take place are erosion, transportation and deposition. The power of waves is one of the most significant forces
The Physical and Human Causes of Erosion. The Holderness Coast
 The Physical and Human Causes of Erosion The Holderness Coast By The British Geographer Situation The Holderness coast is located on the east coast of England and is part of the East Riding of Yorkshire;
page - Laboratory Exercise #5 Shoreline Processes
 page - Laboratory Exercise #5 Shoreline Processes Section A Shoreline Processes: Overview of Waves The ocean s surface is influenced by three types of motion (waves, tides and surface currents). Shorelines
DRAFT. Management Area 19 Management Area 20 Management Area 21 Management Area 22
 PDZ: 8 Mounts Bay West (The Greeb to Point Spaniard) (Including Marazion and St Michael s Mount) Management Area 19 Management Area 20 Management Area 21 Management Area 22 Mounts Bay West (The Greeb to
Natural Bridges Field Trip Activity
 Natural Bridges Field Trip Activity This is due in class on MONDAY- March 1 - not in sections! Name TA: NOTE ON THE GRADING OF THIS ASSIGNMENT: Many of the questions below (especially in the tidepool part)
General Coastal Notes + Landforms! 1
 General Coastal Notes + Landforms! 1 Types of Coastlines: Type Description Primary Coast which is essentially in the same condition when sea level stabilized Coastline after the last ice age, younger.
Define the key terms: - Abrasion - Attrition - Hydraulic action - Solution. Y11 Coasts
 Define the key terms: - Abrasion - Attrition - Hydraulic action - Solution Abrasion caused by waves picking up material which is forced against the cliff face wearing it away Attrition where stones and
Beach Nourishment Impact on Beach Safety and Surfing in the North Reach of Brevard County, Florida
 Beach Nourishment Impact on Beach Safety and Surfing in the North Reach of Brevard County, Florida Prepared by John Hearin, Ph.D. Coastal Engineering Vice Chairman Cocoa Beach Chapter Port Canaveral Patrick
Chapter. The Dynamic Ocean
 Chapter The Dynamic Ocean An ocean current is the mass of ocean water that flows from one place to another. 16.1 The Composition of Seawater Surface Circulation Surface Currents Surface currents are movements
Coastal management has lagged behind the growth in population leading to problems with pollution
 Fifty percent of the population of the industrialized world lives within 100 km of a coast. Coastal management has lagged behind the growth in population leading to problems with pollution and natural
Nearshore Morphodynamics. Bars and Nearshore Bathymetry. Sediment packages parallel to shore, that store beach sediment
 Nearshore Morphodynamics http://coastal.er.usgs.gov/bier/images/chandeleur-xbeach-lg.jpg Bars and Nearshore Bathymetry Sediment packages parallel to shore, that store beach sediment Can be up to 50 km
Inlet Management Study for Pass-A-Grille and Bunces Pass, Pinellas County, Florida
 Inlet Management Study for Pass-A-Grille and Bunces Pass, Pinellas County, Florida Final Report Submitted By Ping Wang, Ph.D., Jun Cheng Ph.D., Zachary Westfall, and Mathieu Vallee Coastal Research Laboratory
Lecture Outlines PowerPoint. Chapter 15 Earth Science, 12e Tarbuck/Lutgens
 Lecture Outlines PowerPoint Chapter 15 Earth Science, 12e Tarbuck/Lutgens 2009 Pearson Prentice Hall This work is protected by United States copyright laws and is provided solely for the use of instructors
The Sea Geography Notes JC-Learn. JC-Learn. Geography Notes The Sea. 1 P a g e
 JC-Learn Geography Notes The Sea 1 P a g e The Sea *Here, you can choose to study the chapter on glaciation or the one on the sea, or even both, because whenever these topics come up in the Junior Cert
Request Number IR1-12: Flow Passage. Information Request
 Request Number IR1-12: Flow Passage Information Request Provide additional information about the 100 metre flow passage channel scenario between the Westshore Terminals and the proposed Project terminal
1.5 How do ocean waves and currents change the face of coastal areas? (Chapter 3)
") 1.5 How do ocean waves and currents change the face of coastal areas? (Chapter 3) 1. Hydraulic Action/Pressure - air being forced into crack in rocks. 2. Corrosion (Solution) Minerals such as calcium carbonate
1.5 How do ocean waves and currents change the face of coastal areas? (Chapter 3) 1. Hydraulic Action/Pressure - air being forced into crack in rocks. 2. Corrosion (Solution) Minerals such as calcium carbonate
CHAPTER 8 ASSESSMENT OF COASTAL VULNERABILITY INDEX
 124 CHAPTER 8 ASSESSMENT OF COASTAL VULNERABILITY INDEX 8.1 INTRODUCTION In order to assess the vulnerability of the shoreline considered under this study against the changing environmental conditions,
Essentials of Oceanography Eleventh Edition
 Chapter Chapter 1 10 Clickers Lecture Essentials of Oceanography Eleventh Edition The Coast: Beaches and Shoreline Processes Alan P. Trujillo Harold V. Thurman Chapter Overview Coastal regions have distinct
Chapter 20 Lecture. Earth: An Introduction to Physical Geology. Eleventh Edition. Shorelines. Tarbuck and Lutgens Pearson Education, Inc.
 Chapter 20 Lecture Earth: An Introduction to Physical Geology Eleventh Edition Shorelines Tarbuck and Lutgens The Shoreline: A Dynamic Interface The Coastal Zone The shoreline is constantly modified by
Improving predictions of nearshore processes and shoreline dynamics for beaches along Australia s rocky and coral reef coasts
 Improving predictions of nearshore processes and shoreline dynamics for beaches along Australia s rocky and coral reef coasts Ryan Lowe Jeff Hansen, Graham Symonds, Mark Buckley, Andrew Pomeroy, Gundula
DEPTH OF CLOSURE ALONG AN EMBAYED, MACRO-TIDAL AND EXPOSED COAST: A MULTI-CRITERIA APPROACH. Abstract
 DEPTH OF CLOSURE ALONG AN EMBAYED, MACRO-TIDAL AND EXPOSED COAST: A MULTI-CRITERIA APPROACH Nieves Garcia Valiente 1, Gerd Masselink 2, Tim Scott 3 and Daniel Conley 4 Abstract The concept of depth of
Coastal Processes and Landforms
 Coastal Processes and Landforms These icons indicate that teacher s notes or useful web addresses are available in the Notes Page. This icon indicates that the slide contains activities created in Flash.
Coastal Processes Day Criccieth
 Coastal Processes Rivers (Conwy) Rivers (Peris) Urban Studies Lowland Glaciation Tourism and National Parks Soils Sand Dunes Upland Glaciation Rural Settlements The Centre and Staff Fieldwork Equipment
The evolution of beachrock morphology and its influence on beach morphodynamics
 The evolution of beachrock morphology and its influence on beach morphodynamics Robert J. Turner Division of Natural Sciences, Southampton College, 239 Montauk Highway, Southampton, NY 11968, U.S.A. email:
Beach Wizard: Development of an Operational Nowcast, Short-Term Forecast System for Nearshore Hydrodynamics and Bathymetric Evolution
 Beach Wizard: Development of an Operational Nowcast, Short-Term Forecast System for Nearshore Hydrodynamics and Bathymetric Evolution Ad Reniers Civil Engineering and Geosciences, Delft University of Technology
1.5 Understand how ocean waves and currents change the face of coastal areas. (Chapter 3)
") 1.5 Understand how ocean waves and currents change the face of coastal areas. (Chapter 3) 1. Hydraulic Action/Pressure - air being forced into crack in rocks. 2. Corrosion (Solution) Minerals such as calcium
1.5 Understand how ocean waves and currents change the face of coastal areas. (Chapter 3) 1. Hydraulic Action/Pressure - air being forced into crack in rocks. 2. Corrosion (Solution) Minerals such as calcium
Just a Balloon BALLOON DEBRIS ON CORNISH BEACHES
 Just a Balloon BALLOON DEBRIS ON CORNISH BEACHES Cornish Plastic Pollution Coalition January 2017 BACKGROUND This report has been compiled by the Cornish Plastic Pollution Coalition (CPPC), a sub-group
The Impact on Great South Bay of the Breach at Old Inlet Charles N. Flagg School of Marine and Atmospheric Sciences, Stony Brook University
 The Impact on Great South Bay of the Breach at Old Inlet Charles N. Flagg School of Marine and Atmospheric Sciences, Stony Brook University The previous report provided a detailed look at the conditions
Identify one factor which influences wave strength (1 Mark) Factors which affect wave strength
 Factors which affect wave strength") Coasts revision Identify one factor which influences wave strength (1 Mark) Factors which affect wave strength Identify one factor which influences wave strength (1 Mark) Factors which affect wave strength
Coasts revision Identify one factor which influences wave strength (1 Mark) Factors which affect wave strength Identify one factor which influences wave strength (1 Mark) Factors which affect wave strength
DUXBURY WAVE MODELING STUDY
 DUXBURY WAVE MODELING STUDY 2008 Status Report Duncan M. FitzGerald Peter S. Rosen Boston University Northeaster University Boston, MA 02215 Boston, MA 02115 Submitted to: DUXBURY BEACH RESERVATION November
CROSS-SHORE SEDIMENT PROCESSES
 The University of the West Indies Organization of American States PROFESSIONAL DEVELOPMENT PROGRAMME: COASTAL INFRASTRUCTURE DESIGN, CONSTRUCTION AND MAINTENANCE A COURSE IN COASTAL DEFENSE SYSTEMS I CHAPTER
Concepts & Phenomena
 Concepts & Phenomena in coastal and port sedimentation R. Kamalian Ports and Maritime Organization of Iran and PIANC-Iran 7 9 December 2015 What is the problem? Many harbours have sedimentation problems
LAKKOPETRA (GREECE) EUROSION Case Study. Contact: Kyriakos SPYROPOULOS. TRITON Consulting Engineers. 90 Pratinou Str Athens (GREECE)
 EUROSION Case Study. Contact: Kyriakos SPYROPOULOS. TRITON Consulting Engineers. 90 Pratinou Str Athens (GREECE)") LAKKOPETRA (GREECE) Contact: Kyriakos SPYROPOULOS TRITON Consulting Engineers 90 Pratinou Str. 11634 Athens (GREECE) Tel: +32 10 729 57 61 Fax: +32 10 724 33 58 e-mail: kspyropoulos@tritonsa.gr 19 1 1.
LAKKOPETRA (GREECE) Contact: Kyriakos SPYROPOULOS TRITON Consulting Engineers 90 Pratinou Str. 11634 Athens (GREECE) Tel: +32 10 729 57 61 Fax: +32 10 724 33 58 e-mail: kspyropoulos@tritonsa.gr 19 1 1.
LAB: WHERE S THE BEACH
 Name: LAB: WHERE S THE BEACH Introduction When you build a sandcastle on the beach, you don't expect it to last forever. You spread out your towel to sunbathe, but you know you can't stay in the same spot
Beach Rescue Statistics and their Relation to Nearshore Morphology and Hazards: A Case Study for Southwest England
 Journal of Coastal Research SI 50 1-6 ICS2007 (Proceedings) Australia ISSN 0749.0208 Beach Rescue Statistics and their Relation to Nearshore Morphology and Hazards: A Case Study for Southwest England T.
TITLE: COASTAL EROSION AND LANDFORMS.
 TITLE: COASTAL EROSION AND LANDFORMS. AIM: What are the factors that influence the formation of coastal features along Fishing Pond beach Trinidad? LOCATION OF FIELD STUDY: The study was carried out in
HURRICANE SANDY LIMITED REEVALUATION REPORT UNION BEACH, NEW JERSEY DRAFT ENGINEERING APPENDIX SUB APPENDIX D SBEACH MODELING
 HURRICANE SANDY LIMITED REEVALUATION REPORT UNION BEACH, NEW JERSEY DRAFT ENGINEERING APPENDIX SUB APPENDIX D SBEACH MODELING Rev. 18 Feb 2015 1 SBEACH Modeling 1.0 Introduction Following the methodology
Nearshore Sediment Transport What influences the loss of sediment on Beaches? - Waves - Winds - Tidal Currents - River discharge - Runoff
 Tides & Beaches Nearshore Sediment Transport What influences the loss of sediment on Beaches? - Waves - Winds - Tidal Currents - River discharge - Runoff Oceans Ocean Topography Physical Structure of the
An Update of Coastal Erosion in Puerto Rico
 Jack Morelock and Maritza Barreto An Update of Coastal Erosion in Puerto Rico Department of Marine Sciences, University of Puerto Rico at Mayagüez and Geography Department, University of Puerto Rico at
Chapter 12: Coasts (after a brief review of Tides)
") Chapter 12: Coasts (after a brief review of Tides) 1 Questions from previous classes: What happens when a wave meets a current? wave = people walking current = bus If wave goes with the current, the wave
Chapter 12: Coasts (after a brief review of Tides) 1 Questions from previous classes: What happens when a wave meets a current? wave = people walking current = bus If wave goes with the current, the wave
Marginal Marine Environments
 Marginal Marine Environments Delta: discrete shoreline protuberances formed where rivers enter oceans, semi-enclosed seas, lakes or lagoons and supply sediment more rapidly than it can be redistributed
Compiled by Uwe Dornbusch. Edited by Cherith Moses
 REPORT ON WAVE AND TIDE MEASUREMENTS Compiled by Uwe Dornbusch. Edited by Cherith Moses 1 Aims...1 2 Summary...1 3 Introduction...1 4 Site selection...1 5 Wave recorder settings...2 6 Results...2 6.1 Water
1 Shoreline Erosion and Deposition
 CHAPTER 12 1 Shoreline Erosion and Deposition SECTION Agents of Erosion and Deposition BEFORE YOU READ After you read this section, you should be able to answer these questions: What is a shoreline? How
The Case of the Disappearing Shoreline
 Name The Case of the Disappearing Shoreline Humans change the earth's climate in many ways. One change is the increase of carbon dioxide in the atmosphere. As we burn more fossil fuels, we release more
SAND BOTTOM EROSION AND CHANGES OF AN ACTIVE LAYER THICKNESS IN THE SURF ZONE OF THE NORDERNEY ISLAND
 SAND BOTTOM EROSION AND CHANGES OF AN ACTIVE LAYER THICKNESS IN THE SURF ZONE OF THE NORDERNEY ISLAND Kos'yan R. 1, Kunz H. 2, Podymov l. 3 1 Prof.Dr.,The Southern Branch of the P.P.Shirshov Institute
/50. Physical Geology Shorelines
 Physical Geology Shorelines Multiple Guess: (You know the drill 2 points each) 1. The path of movement of a water particle in a wave at sea is 1. circular 2. horizontal 3. vertical 4. elliptical 5. none
Taranaki Tsunami Inundation Analysis. Prepared for Taranaki Civil Defence Emergency Management Group. Final Version
 Taranaki Tsunami Inundation Analysis Prepared for Taranaki Civil Defence Emergency Management Group Final Version June 2012 AM 12/07 HBRC Plan Number 4362 Asset Management Group Technical Report Prepared
Chesil Beach, Dorset UK High energy, shingle coastline. Brighton Beach, Sussex UK Pebble beach
 Beaches: Depositional landform Extends from the highest high tide to the lowest low tide. Very important temporary store in coastal system. Accretion: sediment returning to the visible portion of a beach
Q1. What are the primary causes/contributors to coastal erosion at Westshore and the concept of longshore / littoral drift.
 Q1. What are the primary causes/contributors to coastal erosion at Westshore and the concept of longshore / littoral drift. In order of (timing related) contribution to present problem 1. Beach is too
CMS Modeling of the North Coast of Puerto Rico
 CMS Modeling of the North Coast of Puerto Rico PRESENTED BY: Dr. Kelly Rankin Legault, Ph.D., P.E. 1 Dr. Alfredo Torruella, Ph.D. 2 1 USACE Jacksonville District 2 University of Puerto Rico October 2016
April 7, Prepared for: The Caribbean Disaster Emergency Response Agency Prepared by: CEAC Solutions Co. Ltd.
 April 7, 2006 Prepared for: The Caribbean Disaster Emergency Response Agency Prepared by: Introduction CEAC Solutions Co. Ltd was commissioned in May 2005 to prepare coastal beach erosion hazard maps for
Studland Bay Context and Learning Aims
 Studland Bay Enquiry 7: How are coastal processes affecting Studland Bay? Context and Learning Aims Pupils will be supported in and outside of the classroom to: Identify; describe and explain the physical
Low-crested offshore breakwaters: a functional tool for beach management
 Environmental Problems in Coastal Regions VI 237 Low-crested offshore breakwaters: a functional tool for beach management K. Spyropoulos & E. Andrianis TRITON Consulting Engineers, Greece Abstract Beach
BEACH PROCESSES AND COASTAL ENVIRONMENTS
 BEACH PROCESSES AND COASTAL ENVIRONMENTS COASTAL FEATURES Cross section Map view TOPICS: Terminology Waves Beach Morphology Barriers Coastal Migration Tides Tidal Flats and Marshes Sediment Budgets Human
Julebæk Strand. Effect full beach nourishment
 Julebæk Strand Effect full beach nourishment Aim of Study This study is a part of the COADAPT funding and the aim of the study is to analyze the effect of beach nourishment. In order to investigate the
Wave-dominated embayed beaches. Andrew D Short School of Geosciences University of Sydney
 Wave-dominated embayed beaches Andrew D Short School of Geosciences University of Sydney Wave-dominated embayed beaches wave-dominated beaches embayed beaches morphodynamics of W-D embayed beaches circulation,
INTRODUCTION TO COASTAL ENGINEERING
 The University of the West Indies Organization of American States PROFESSIONAL DEVELOPMENT PROGRAMME: COASTAL INFRASTRUCTURE DESIGN, CONSTRUCTION AND MAINTENANCE A COURSE IN COASTAL DEFENSE SYSTEMS I CHAPTER
Undertow - Zonation of Flow in Broken Wave Bores
 Nearshore Circulation Undertow and Rip Cells Undertow - Zonation of Flow in Broken Wave Bores In the wave breaking process, the landward transfer of water, associated with bore and surface roller decay
BEFORE THE ENVIRONMENTAL PROTECTION AUTHORITY. of an Application under Section 38 of the Act for Marine Consents by Trans-Tasman Resources Limited
 BEFORE THE ENVIRONMENTAL PROTECTION AUTHORITY IN THE MATTER of the Exclusive Economic Zone and Continental Shelf (Environmental Effects) Act 2012 AND IN THE MATTER of an Application under Section 38 of
Appendix E Cat Island Borrow Area Analysis
 Appendix E Cat Island Borrow Area Analysis ERDC/CHL Letter Report 1 Cat Island Borrow Area Analysis Multiple borrow area configurations were considered for Cat Island restoration. Borrow area CI1 is located
SELECTION OF THE PREFERRED MANAGEMENT OPTION FOR STOCKTON BEACH APPLICATION OF 2D COASTAL PROCESSES MODELLING
 SELECTION OF THE PREFERRED MANAGEMENT OPTION FOR STOCKTON BEACH APPLICATION OF 2D COASTAL PROCESSES MODELLING C Allery 1 1 DHI Water and Environment, Sydney, NSW Abstract This paper presents an approach
Earth Science Chapter 16 Section 3 Review
 Name: Class: Date: Earth Science Chapter 16 Section 3 Review Multiple Choice Identify the choice that best completes the statement or answers the question. 1. The movement of water that parallels the shore
1. What is a Shoreline Management Plan?
 Our coastline is changing We live in a part of the country with a unique and dramatic coastline, with coastal landscapes and seascapes that have been shaped by natural processes over geological timescales.
The Dynamic Coast. Right Place Resources. A presentation about the interaction between the dynamic coast and people
 The Dynamic Coast Houses threatened by coastal erosion in California Right Place Resources A presentation about the interaction between the dynamic coast and people For the rest of the presentations in
Follets Island Nearshore Beach Nourishment Project
 Coast & Harbor Engineering A division of Hatch Mott MacDonald Follets Island Nearshore Beach Nourishment Project Arpit Agarwal, P.E. April 1, 2016 Project Site!"#$% &'(% &)*+% )#,'-+% Shoreline Erosion
Läna i is a single shield that formed from summit eruptions and along
 Läna i is a single shield that formed from summit eruptions and along three rift zones between 1.2 and 1.46 Ma; a classic example of a Hawaiian shield with a gently sloping profile. The small sub-circular
HARBOUR SEDIMENTATION - COMPARISON WITH MODEL
 HARBOUR SEDIMENTATION - COMPARISON WITH MODEL ABSTRACT A mobile-bed model study of Pointe Sapin Harbour, in the Gulf of St. Lawrence, resulted in construction of a detached breakwater and sand trap to
Among the numerous reasons to develop an understanding of LST are:
 Longshore Sediment Transport Among the numerous reasons to develop an understanding of LST are: Process by which the products of terrestrial erosion (riverine sediments, sea cliff failures, etc.) are removed
Figure 4, Photo mosaic taken on February 14 about an hour before sunset near low tide.
 The Impact on Great South Bay of the Breach at Old Inlet Charles N. Flagg and Roger Flood School of Marine and Atmospheric Sciences, Stony Brook University Since the last report was issued on January 31
Variation in Beach Profile and Sediment Characteristics at Popham Beach, Phippsburg, ME
 Colby College Digital Commons @ Colby Undergraduate Research Symposium Student Research 2006 Variation in Beach Profile and Sediment Characteristics at Popham Beach, Phippsburg, ME Kathryn Lidington Colby
Wave energy converter effects on wave and sediment circulation
 Wave energy converter effects on wave and sediment circulation Grace Chang and Craig Jones Integral Consulting Inc. cjones@integral-corp.com; gchang@integral-corp.com Jesse Roberts, Kelley Ruehl, and Chris
MESSOLOGI LAGOON AREA (GREECE)
") MESSOLOGI LAGOON AREA (GREECE) 20 Contact: Kyriakos SPYROPOULOS TRITON Consulting Engineers 90 Pratinou Str. 11634 Athens (GREECE) Tel: +32 10 729 57 61 Fax: +32 10 724 33 58 e-mail: kspyropoulos@tritonsa.gr
MESSOLOGI LAGOON AREA (GREECE) 20 Contact: Kyriakos SPYROPOULOS TRITON Consulting Engineers 90 Pratinou Str. 11634 Athens (GREECE) Tel: +32 10 729 57 61 Fax: +32 10 724 33 58 e-mail: kspyropoulos@tritonsa.gr
Marine Character Areas MCA 23 SOUTH PEMBROKESHIRE OPEN WATERS. Location and boundaries
 Marine Character Areas MCA 23 SOUTH PEMBROKESHIRE OPEN WATERS Location and boundaries This Marine Character Area (MCA) encompasses the waters surrounding the southern coast the Pembrokeshire Peninsula.
2. Water levels and wave conditions. 2.1 Introduction
 18 2. Water levels and wave conditions 2.1 Introduction This Overtopping Manual has a focus on the aspects of wave run-up and wave overtopping only. It is not a design manual, giving the whole design process
New Jersey Coastal Zone Overview. The New Jersey Beach Profile Network (NJBPN) 3 Dimensional Assessments. Quantifying Shoreline Migration
 3 Dimensional Assessments. Quantifying Shoreline Migration") New Jersey Coastal Zone Overview The New Jersey Beach Profile Network (NJBPN) Objectives Profile Locations Data Collection Analyzing NJBPN Data Examples 3 Dimensional Assessments Methodology Examples Quantifying
New Jersey Coastal Zone Overview The New Jersey Beach Profile Network (NJBPN) Objectives Profile Locations Data Collection Analyzing NJBPN Data Examples 3 Dimensional Assessments Methodology Examples Quantifying
4/20/17. #30 - Coastlines - General Principles Coastlines - Overview
 Writing Assignment Due one week from today by 11:59 pm See main class web pages for detailed instructions Essays will be submitted in Illinois Compass (instructions later) Pick one: Earthquakes, tsunamis,
Anatomy of Coastal Regions
 The Coast I. BEACH ANATOMY Anatomy of Coastal Regions Terms for different parts of beaches and coastal regions Are all about ENERGY- ie, where the ocean s energy Mostly through tides and waves, and shape