Counting Pedestrians and. and Other Facilities
|
|
|
- Brett Welch
- 6 years ago
- Views:
Transcription
1 Counting Pedestrians and Cyclists on Multiuse Trails and Other Facilities
2 Trail Counting Workshop How many are researchers? How many are policy-makers, public managers, or advocates? How many are now counting users? Why count? Goal is exchange of information. Please ask questions.
3 Why Count? Document use of facilities Allocate resources Assess efficiency of investments Optimize trail operations & maintenance Assess exposure rates and need for safety interventions Improve systems planning Inform and conduct research

4 The Scientific Method and Public Management n Research Paradigm Scientific Method: focused on producing knowledge; knowledge is end. Management Paradigm Problem Solving Process: focused on changing status quo; knowledge is instrumental. 1. Observation 1. Goals / Problem Definition 2. Hypothesis 2. Data collection and analysis 3. Experiment 3. Development of alternatives 4. Data collection and analysis 4. Evaluation of alternatives 5. Accept orreject reject hypothesis 5. Selectionof of alternative 6. Publish results 6. Implementation
5 Using Counts in Public Management Documenting facility use: Greenways Division, City of Indianapolis, IN Resource allocation: Indiana Department of Natural Resources Traffic control: Department of Public Works, Minneapolis, MN Bike facility planning: St. Paul, MN


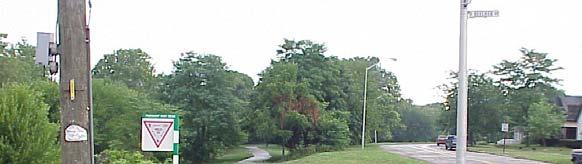
6 Monon Trail Canal Towpath White River Trail Pleasant Run


7 Mon non Trail Understand Spatial & Temporal Variation in Trail Traffic, Indianapolis, IN (9/04) Min Max Mean Week Days 79 2, Weekend Days 105 3, Annual Trail Traffic Monon Trail Maximum: 606,900 Minimum : 21,700 Mean: 146,438 Median: 101,578 Mean Daily Count ,500 3,500
8 Inform Resource Allocation Demand (potential use) of facilities typically y not estimated Indiana Trail Funding Program 66 applications; $73 million requested Only 20 applicants estimated use in proposal Mean predicted use: 22% higher than segment in Indianapolis with highest traffic volume Median predicted use more than double median traffic volume on 30 sites Estimates of potential trail use can inform and increase efficiency of investment decisions
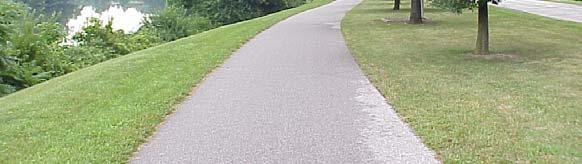
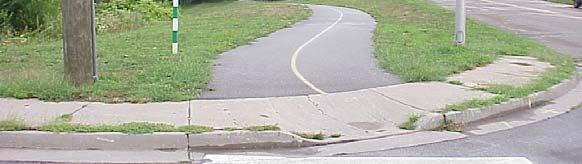
9 Inform Traffic Safety: Street-Trail Crossings Street t Street t Trail Recommendations (midblock Average Estimated (selected) crossing) Daily Traffic Daily Traffic Local ,280 Add street stop sign; remove trail stop sign Local 2 2,026 3,280 Add street stop sign; remove trail stop sign Local 3 2,400 3,280 Add street stop sign; remove trail stop sign Local 4 1,680 2,900 Add street yield sign; remove trail stop sign Minor 7,267 2,740 Trail stop sign, add overhead flasher; Arterial reduce vehicles lanes from 4 to 2 at crossing Minneapolis Dept. of Public Works, Feb. 15, 2010
10 Inform Bike Facility Planning Proposed Bike Boulevard, St. Paul Nihb Neighbors concerned about tincreases in bike traffic No estimates of potential use available; no methods for estimating Use counts from Minneapolis to guestimate Local Street with Bike Facility (n=11) Local Street with no Bike Facility (n=52) 12-hour traffic Presence of bike lane: 40% greater bike traffic 100 events / 12 hour day = 8 more bikes / hour = 1 more bike / 7 minutes Key assumption: bike traffic on local streets with and without bike facilities similar across cities (not good but better than nothing)
11 Learning Objectives How counts of pedestrians and cyclists can inform research, policy, and management, How to assess strengths and weaknesses of different methods of counting How to develop and use simple planning ratios for extrapolating counts of pedestrians and cyclists How to understand approaches to modeling pedestrian and bicycle traffic on facilities How to participate i t in the National Bicycle & Pedestrian Documentation Project
12 Before Counting Define problems or questions Different information needed for different questions Facility traffic counts needed for planning, design, and operations Visitor trips needed for benefit-cost analysis Frequency, intensity, and duration of individual trips for health impact analysis Choose appropriate methods (e.g., counts vs. surveys)
13 Some Terms Traffic count: user past a point; may be same user multiple times on single trip User visit: distinct trip by an individual to a facility (may be multiple trips in a day or week by same individual) Individual physical activity: frequency, intensity, and duration of use of facility within specified time period
14 National Bicycle and Pedestrian Documentation Project Institute t of Traffic Engineers; Alta Planning & Design Initiated in 2002, volunteer (not funded) Goal is standard methods and national database Consistent count dates, times, methods, procedures Purposive (not random) sampling Volunteer training guides Forms for counting Formats for spreadsheets and methods for tabulating Guidelines for submitting
15 Methods of Counting Field observation Active infrared Passive infrared Magnetic loop detectors (in pavement) Pressure sensors (piezometric) Video imaging, i ultrasonic, dopplar radar
16 Factors to Consider How counters work Type of data generated Quality of data generated; need for calibration Ease of deployment (e.g., location, type of facility, relocation) Cost of deployment Choice of methods is all about trade-offs
17 Minneapolis Example: Methods of Counting Method of Manual Magnetic Loop Active Infrared Counters observation Detector (beam/sensors) Traffic Cyclists (bi directional) Cyclists only Cyclists & Peds combined observed Peds (bi directional) (bi directional, (no directional) potentially) Output Choice of time units 15 minute blocks Time of event Locations for deployment Length of observations On and off street facilities &no facilities Based on staff availability (often two hour blocks) Off street facilities Continuous: 24 hours Depends on counter type and facility characteristics Continuous: 24 hours Limitations Human error Must calibrate Must calibrate; systematic undercount (beam counters)
18 Minneapolis Example: Methods of Counting, con t. Method of Manual Magnetic Loop Active Infrared Counters observation Detector (beam/sensors) Sources of Distractions Misses riders on edge Misses users passing error of trail. simultaneously l Direction of riders in wrong lanes recorded incorrectly Data recorded 5 60 minute time intervals 15 minute counts Time of event ; can be aggregated to any time period Other considerations Can record groups, some user characteristics Can t measure user characteristics Can t measure user characteristics
19 Considerations in Field Observations Need to determine length of sample (< one hour, 1-2 hours, peak hour(s), 12 hours) Need to choose locations, number of samples Very difficult to collect all information of interest from research perspective: p count, gender, race, age, direction, group size, helmet, Traffic volumes can be very high, distractions common Errors in counting are common
20 Field Observation: Counting Sheet (Indianapolis, IN, 2004) Five minute intervals Walkers, cyclists, runners, skaters, babies, other, total, groups, males, females Hour Walk Cycle Run Skate Babies Other Total Groups Male Female 00:00-04:59 05:00-09:59
21 NBPDP Standard Form Count for two hours in 15 minute increments. Count bicyclists who ride on sidewalk. Count number of people on bicycle, not number of bicycles. Pedestrians include people in wheelchairs or strollers People using equipment rollerblades in other 00 - : : : :00 1:00 1:15 Bikes Pedestrians Others Female Male Female Male
22 Assess Reliability of Manual Counts Average hourly inter-observer error = 1.4% (n=8) Comparison Hour Date Start Time End Time Counter #1 Counter #2 Abs Val Error Abs Val % Error 1 29 July :00 10: % 2 29 July :00 11: % 3 29 July :00 12: % 4 29 July :00 13: % 5 29 July :00 14: % 6 29 July :00 15: % 7 05 August :00 12: % 8 05 August :00 13: % 0.5%
23 Estimating Hourly Counts from Samples Predicting Pedestrian Crosswalk Volumes (Davis, King, and Robertson 1991) Used 5, 10, 15, and 30 minute counts to predict hourly crosswalk volumes Middle 30 minutes is most accurate, but middle 5 is most efficient Expansion equations tested for trail traffic Expansion equations tested for trail traffic (Lindsey & Lindsey 2004)
24 Expansion Equations for Sample Counts Davis, King, and Robertson (1988) Lindsey & Lindsey (2004) Counting Intervals (minutes) Equations R 2 Counting Intervals (minutes) Equations R 2 Middle 5 V 1 =19.91*I Random 5 V 1 =23.196*I Middle 10 V 1 =9.82*I First 10 V 1 =11.472*I Middle 10 V 1 =12.543*I Middle 15 V 1 =5.75*I Last 15 V 1 =7.252*I Middle 30 V 37*I 1 = Middle 30 V 41*I 1 = Last 30 Random 30 V 1 =2.624*I V 1 =2.82*I
25 Estimating Hourly Counts from Samples Pedestrian cross-walk expansion equations are a-theoretical fit data better than equations estimated from trail traffic counts (larger samples) Indicate hourly volumes are essentially double half-hour volumes Decision on length of sample period depends on information needs, costs


26 Magnetic Loop Detector Raw Data Data reported in comma- separated-value (.csv) file in 15- minute increments Report two channels one for each painted lane Cyclists riding in wrong lane can confound directionality results Holds 3 months of data Can be imported to Excel Counter error may differ among locations
27 l1 Calibrating Magnetic Loop Detector Counts (bikes) Magnetic Loop Total Bikes Hennepin Avenue Manua al Hourly Count (Best Es stimate of True) y = x R² = y = x R² = West River Parkway 1:1 Hypothetical Linear Regression Magnetic Loop Hourly Count
28 Slide 27 l1 On all these, I understand the ppt title is a more general category. Even so, -since the ppt slide title and the graph title are essentially the same, I would just go with the graph, drop the ppt title, and make the image bigger so people can read it. see next slide.- linds301, 8/31/2010


29 Active Infrared Trail Monitors (Trailmaster, bikes & peds) Raw Data Detects each trail user as infrared beam is broken and records timestamp Maximum 16,000 observations Data reported in text file as stream of dates/times C b i t d t E l Can be imported to Excel as space-delimited text file


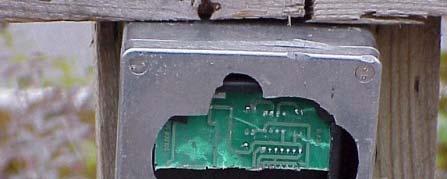

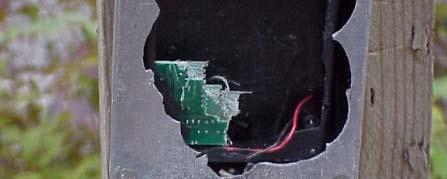


30 Active Infrared Monitors: O&M may be challenging
31 l2 Calibrating Active Infrared Counts (bikes & peds) y = x R² = Manual Count 300 Hennepin Avenue West River Parkway 1:1 Hypothetical 200 y = x Linear (Hennepin Avenue) R² = Trailmaster Count
32 Slide 30 l2 For this graph, I'd return to the blue dots and red crosses for locations. THis is clearer, and there's no reason to change. By using the same color fo the dots in the scatter plot (i.e., for the same location) you'll add consistency and it will be easier for viewers to interpret. linds301, 8/31/2010
")

 Holds one year")

33 Passive Infrared Counters (Eco-Counter, bikes & peds) Raw Data Detects trail users infrared heat signatures Differentiates direction (i.e. left-to-right vs. right-to-left) Holds one year of data Data imported in Excel in 15-minute increments
34 Calibrating Passive Infrared Counter 600 Eco-Counter SB y = x R² = Manu ual Count Manual versus Eco-Counter 1:1 Hypothetical Linear Regression Eco-Counter Count (SB004)
35 Counter Correction Equations: 2 Variation in Adj. R 2 Counter and Bike & Ped Bike & Ped Bike & Ped Bike Bikes Bikes Unit Count Eastbound Westbound Count Eastbound Westbound Magnetic Loop (Hennepin) Magnetic Loop (W R Parkway) Passive Infrared #004 Passive Infrared # 003 Passive Infrared #001 Active Infrared (Hennepin) Active Infrared (W RParkway)
36 A Calibration Problem: Loop Detector Counts (bikes) > Infrared Counts (bikes & peds) Hennepin Ave. Counter Site (Dec 2009 & Jan 2010) aily Traffic Coun nt D loop detector infrared Date
37 Working with Counts Objective is to understand and use of patterns in data Seasonality and monthly variation Day of week (weekend and weekday) Time of day (peak hour) Patterns differ by mode bike vs. pedestrian type of facility (on-street vs. off-street)
38 Temporal Patterns in Trail Traffic Counts Daily Traffic vs Weekday / Weekend Traffic , Monon 67th St. Max:6155 Min: 52 0 Jan Feb Mar Apr May Jun Jul Aug Sep Oct Nov Dec Daily Traffic Weekday Traffic Weekend Traffic Daily Traffic Average Daily Traffic by Day of Week, Monon 67th St Sat Sun Mon Tue Wed Thu Fri Monthly Traffic Monthly Total Traffic at 4 Locations on Monon, ,000 90,000 67th 80,000 70,000 HC 60,000 50,000 Kes 40,000 30,000 20,000 38th 10, Month ffic Hourly Traf Mean Hourly Traffic on Weekday & Weekend, Sep th on Monon & Mich on White River Hour
39 Seasonal Variation in Daily Counts (Indianapolis, IN) Daily Traffic vs Weekday / Weekend Traffic , Monon 67th St Max:6155 Min: C ounts Jan Feb Mar Apr May Jun Jul Aug Sep Oct Nov Dec Daily Traffic Weekday Traffic Weekend Traffic
40 Dec Monthly Traffic Ratios (Indianapolis) (Indianapolis, n= + 30/month) Max Mean Median Min Jan Feb Mar Apr May Jun Jul Aug Sep Oct Nov Traffic Rati o (Jan. Base)


41 Mean Daily Bike Traffic Volumes (Midtown Greenway, Minneapolis MN)
42 Monthly Scaling Factors (Monthly Traffic Bike Traffic /December Bike Traffic) Monthly Traffic/Dec c Traffic Hennepin Cedar West River Pkwy Example: July traffic is 10 to 30 times December traffic depending on year and location 0 January-07 October-07 July-08 April-09 January-10
43 Monthly Traffic Ratios (scaling factors) for Greenways in Minneapolis and Indianapolis Minneapolis 14 Minneapolis traffic 12 ratios show greater 10 seasonality. 8 Differences could be 6 associated with 4 Indianapolis differences in counts (bikes vs. bikes & 2 peds), characteristics 0 of trails, or cultural or geographic factors.
44 Hourly Bike & Ped Counts Hourly bike and ped traffic varies by facility type day of week (weekend-weekday) season Weekday peak hour traffic typically occurs between 5:00 p.m. and 7:00 p.m. Weekend peak hour typically traffic occurs in late morning or early afternoon Peak hour higher for off-street facilities with more recreational use
45 Time of Day (Hourly) Traffic Patterns Vary by Mode and Facility (Minneapolis MN) our count (6:30-18:30 0) 15% 10% Bike: Greenway Bike: Manual count Pedestrian: Manual count Perce ent of 12-h 5% 0% 0:00 6:00 12:00 18:00 0:00 Time of Day
46 Trail Peak Hour Counts Mean Hourly Traffic on Weekday & Weekend, Sep th on Monon & Mich on White River Hourl ly Traffic 400 Weekday Weekend Hour
47 Weekday Peak Hour Trail Traffic Varies Seasonally (11% - 17%) (Indianapolis, n=30) Weekd day Peak Hour 20% 15% 10% 5% 0% Mean Median Jan Feb Mar Apr May Jun Jul Aug Sep Oct Nov Dec
48 Weekend Peak Hour Trail Traffic Varies Seaonally (10% - 16%) (Indianapolis, n=30) 20% 15% 10% 5% 0% Mean Median Weekend Peak Hour Ja an Feb Mar Apr May Ju un Jul Aug Sep Oct Nov Dec
49 Time period Hourly Adjustment Factors: 12 Hour On street Traffic Volumes (Minneapolis MN) Percent of 12-hour count Bicycle Adj. factor R 2 Percent of 12-hour count Pedestrian Adj. factor 7-8am 75% 7.5% % 6.9% am 9.3% % am 7.8% % R 2 Example: Multiplying 10-11am 6.4% % pmtraffic 11-noon 5.9% % noon-1pm 5.2% % by 8.4 yields 1-2pm 7.2% % hour 2-3pm 7.5% % traffic volume. 3-4pm 9.3% % pm 12.0% % pm 12.6% %
50 Estimated 12 hour Bike Traffic Highly Correlated with Actual 12 hour Traffic Predicted d 12-hour count 1,500 1, pm 4-5pm 5-6pm 5-6 pm 4-6 pm y = x R 2 = y = 1.012x R 2 = pm y = 0.905x R 2 = ,200 1,500 Actual 12-hour count
51 Weekend-Weekday Trail Traffic Ratios (bikes& (bikes & peds; Indianapolis, n=30) Max Mean Median Min Jan Feb Mar Apr May Jun Jul Aug Sep Oct Nov Dec Weekend-Wee kday Ratio
52 Weekend Weekday Trail Traffic Ratios (bikes; Minneapolis) Mean Wee ekend Cou unt/mean Weekday Count Hennepin Cedar W River Pkwy 0.0 January-07 October-07 July-08 April-09 January-10 Ratios > 1 indicate mean weekend traffic > mean weekday traffic
53 Using Traffic Ratios to Extrapolate 1. Sample trail traffic during weekday peak hour 2. Use peak hour proportions to estimate weekday daily traffic 3. Use weekend-weekday traffic ratios to estimate weekend daily traffic 4. Aggregate daily estimates to obtain monthly traffic; 5. Use monthly traffic ratios to estimate traffic for other months and annual traffic; and 6. Impute annual visits from annual traffic. Example: Using mean peak hour traffic 9/12-9/16 to estimate monthly and annual traffic
54 Monthly and Annual Traffic Estimates ( Monon Trail with site (M67) and median ratios) Counter M67 ratios Median ratio (actual) (% error) (% error)*** Weekday 255 mean peak hour traffic Weekday 1,534 1,567 1,851 (2.1%) (20.7%) average estimate Weekend -- 2,820 2,961 Day Traffic Monthly Traffic 68,647 57,035 64,406 (-16.9%) (-6.2%) Annual Traffic 606, ,067 (-22.4%) 484,489 (-20.2%)
55 A Conceptual Model of Trail Use For individual i living in zone j, P ijkl = f(c i, R j, S k, D jk, T kl ) P ijkl = probability of individual i in zone j traveling to access point k and then using the trail to destination l. C i = characteristics of individual i R j = characteristics of area j S k = characteristics of access points k D jk = distance and other characteristics of trip from j to k T kl = characteristics of trail from k to l 53
56 Modeling Multiuse Trail Traffic Primary Aims 1. Establish objective measures of urban trail traffic 2. Identify correlates of trail traffic 3. Explain and predict spatial variation in trail traffic
57 The General Approach (Indianapolis) Model traffic on facility (not individuals) Observe trail traffic in field Monitor trail traffic with infrared counters Collect secondary data Measure neighborhood and trail characteristics using remote sensing and GIS Estimate statistical models
58 Traffic Counts: Infrared Counters 30 locations in diverse neighborhoods on a five trail, 33 mile network 4 locations: November 2000 December locations: September December locations: May 2004 December 2005 Analyses 18,142 daily counts (92.7% of days through 7/05) 24,177 through 12/05
59 Models of Trail Traffic Trail traffic modeled as function of Day of week Month of year Daily weather (temperature, precipitation, p sunshine, snow: deviations from normal) Neighborhood socio-demographics Neighborhood urban form Trail characteristics including viewsheds Socio-demographic and urban form variables measured for neighborhoods h along trail or pedestrian access zones Models explain > 80% of variation in daily trail traffic (bikes & peds)
60 Neighborhood Delineation Segment Delineation ½ Mile Route Roads Monitor Trail Trail Segments ½ Mile Routes Monitor
61 !(!(!(!( Trail Monitor Neighborhoods Monon Trail Pedestrian access zones or catchments!(!(!(!(!(!(!( Defined by ½ mile street network from monitor locations!(!(!(!(!(!(!(!(!(!( Monon Census data aggregated for neighborhood sociodemographic characteristics!(!(!( Trail!(!( Greenways! Counter Locations Counter Neighborhoods!(!(!( Major Roads Counter Networks (1/2 mile) Miles!( Marion County Boundary
62 Correlates of Trail Traffic (controls) Measured Temporal Hypothetical Effect Effect Weekend positive positive Jan Nov positive positive StateFair positive positive Weather Temperature deviation from normal (squared term) positive positive Precipitation deviation from normal negative negative Snow deviation from normal negative negative Sunshine deviation from normal positive positive
63 Neighborhood Variables Socio-demographics Characteristics Hypothetical Effect Measured Effect % Population less than 5 and greater than 64 negative negative % African American negative e depends ds on model % other ethnicity, exclude White and African American negative depends on model Mean % Population 25+ with College Degree positive positive Mean Median Household Income, in dollars positive positive Urban Form Population density in 1/2 mile network distance to monitor positive positive Percentage of commercial land use in trail neighborhood positive positive Parking lots (Square Feet) in trail neighborhood positive positive Average length of network street segments within 1/2 mile of counter; negative positive
64 Trail Segment Characteristics Hypothetical Description of Trail Segment Characteristics Effect Measured Effect Openness: Percent total area visible within ½ mile of trail segment positive positive Interconnectedness: Average value of visual magnitude for segment positive positive Land Use Diversity: it Shannon s Diversity it Index of land use in viewshed positive positive Greenness: Difference between mean NDVI in neighborhood and trail viewshed positive positive Percent Not Paved: Percent trail length with non-paved surface (e.g., gravel) negative negative Railroad Xing: Number of railroad crossings at grade negative negative Trail Intersection positive negative Amenity Density: Number art, bench, signs divided by segment length positive positive Average slope along trail segments? depends on model? (positive for Sinuosity of trail segment nature trails) depends on model Road Xing Density: Segment length / number of road crossings at grade negative (interrupts use) positive (access) depends on model
65 Effect of Temperature Varies Seasonally Temperature 10F > daily average correlated with significant change in daily trail traffic 80% of traffic Increase 60% 40% 20% 0% -20% -40% Month
66 Effect of Precipitation Varies Seasonally Precipitation 1 inch > daily average correlated with significant drop in daily trail traffic 20% In ncrease e of traff ic 0% -20% -40% -60% -80% Month
67 Effect of Sunshine Varies Seasonally Sunshine 10% > daily average correlated with significant increase in daily trail traffic In crease of traffic 20% 10% 0% -10% Month
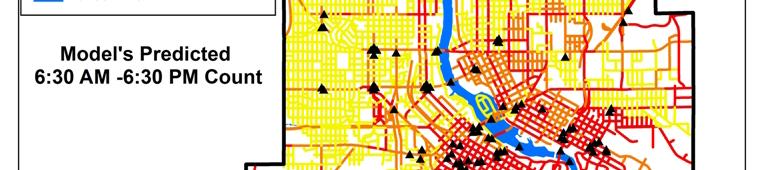
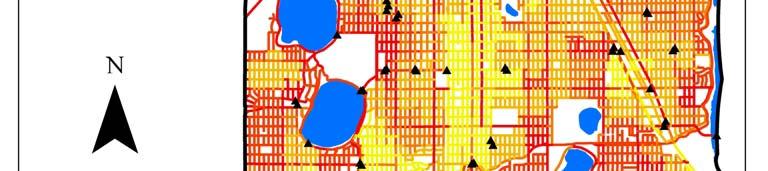
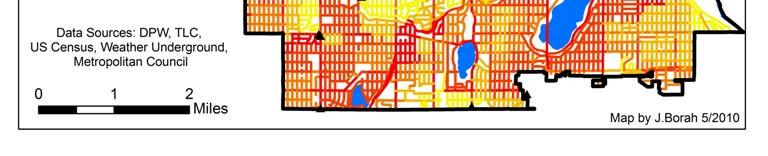
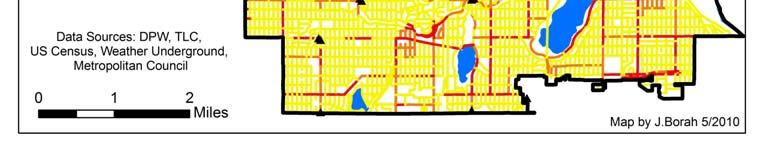
68 Model with Neighborhood Access Zones: Predicted & Actual Traffic Monon Trail (M67 Site), 9/11-9/ actual counts predicted counts
69 Tract Model (no urban form variables) Predicted and Actual Traffic (Monon Trail (M67) Site, 9/11-9/17) actual counts predicted counts
70 Model Error in Traffic Estimates: Ranges from 18% - 39% Best Model Tract Model Mean Mean Mean Actual Predicted Predicted Daily Traffic Daily Traffic Error (%) Daily Traffic Error (%) M67 Site PLR3 Site
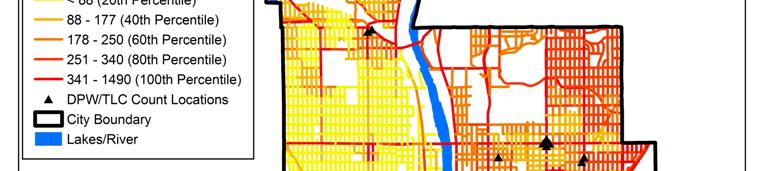
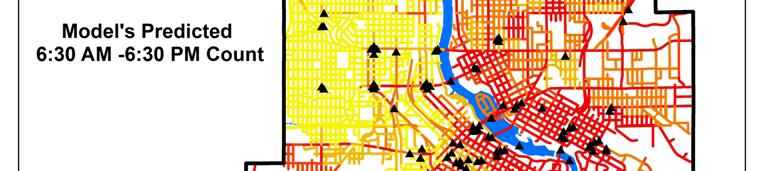
71 Predicting Bike & Ped Traffic on Streets & Sidewalks (Minneapolis) 12 hour traffic volume = f( Daily weather (temperature, deviation from average temperature, precipitation, wind speed) Neighborhood characteristics and form (population age, income, education, race, population density, land use mix, employment accessibility, crime) Traffic infrastructure type (street type, presence of bike facility, type of bike facility) Other factors (variables to be added) d) Bike traffic model: Adj. R 2 = Pedestrian traffic model: Adj. R 2 = 0.377
72 Data and Methods: Counts and Correlates of Traffic Counts: Minneapolis DPW and TransitforLivable Communities (manual; n=458) Type of bike facility: Minneapolis DPW Street/road classification: Metropolitan Council Bus lines: Metro Transit Daily weather: Nti National loceanic and Atmospheric Administration (NOAA) Neighborhood demographics: U.S. Bureau of the Census Neighborhood land use: City of Minneapolis
73 Mean Bike Traffic Volumes by Street & Facility Type (Minneapolis, 12 hour observations (6:30 a.m. 6:30 p.m.; n=458) Mean Daily Traffic Volume Principal Arterial A-Minor B-Minor Collector Local Street Functional Class On-Street Bike Lane None
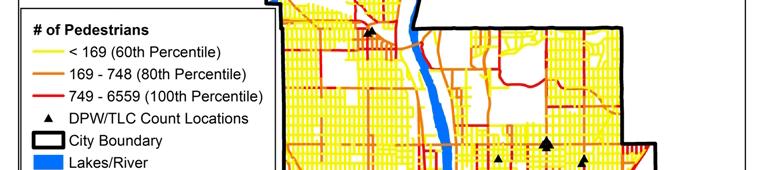
74 Pedestrian Traffic Volumes by Street Type (Minneaposlis, 12 hour observations (6:30 a.m. 6:30 p.m.; n=453) Principal Arterial A Minor B Minor Collector Local All Streets Trails Observations Maximum volume , ,230 13,424 1,476 18, ,779 Mean 12 hour volume 87 1, , Median volume Minimum i volume Average hourly volume
75 Pedestrian Volumes, Bus Lines, & Trails (Minneaposli, 12 hour observations (6:30 a.m. 6:30 p.m.; n=453) On Bus Route None Observations Maximum volume 18, ,492 Mean 12 hour volume 1, Median volume Minimum volume 0 0 Average hourly volume 94 44
76 Regression Model Results Weather Variables Effect on Bicycle Traffic Effect on Pedestrian Traffic Maximum daily temperature Deviation from average temperature +++ Not significant -- Not significant Precipitation (any) - Not significant Wind speed (average) Not significant ifi Not significant ifi -, + significant at 10% level --, ++ significant at 5% level ---,+++ significant ifi at 1% level l
77 Neighborhood Variables* Model Results, cont. Effect on Bicycle Traffic Effect on Pedestrian Traffic % Population > 65, < 5 ++ Not significant Median household h income Not significant ifi -- % Population with college degree ++ + % Black population - Not significant % Other race Not significant Not significant Population density Not significant Not significant *Estimated for Census block group where counting location falls -, + significant at 10% level --, ++ significant at 5% level ---,+++ significant at 1% level
78 Model Results, cont. Neighborhood Variable* Effect on Bicycle Traffic Effect on Pedestrian Traffic Violent crimes per capita Employment accessibility Land use mix *Estimated for Census block group where counting location falls Estimated for Census block group where counting location falls -, + significant at 10% level --, ++ significant at 5% level ---,+++ significant at 1% level
79 Model Results, cont. Road Infrastructure Variable Effect on Bicycles (relative to local street, no bike facility) Principal arterial with bike facility No counts Minor arterial with bike facility +++ Collector with bike facility Local with bike facility Principal arterial, no facility Minor arterial, no facility Not significant Not significant Not significant Not significant Collector, no facility Not significant Off-street bike facility +++ Presence of bus line Not significant Local, no facility (base case) -, + significant at 10% level --, ++ significant at 5% level ---,+++ significant at 1% level
80 Model Results, cont. Road Infrastructure Variable Effect on Peds (relative to off-street facility) Principal arterial Not significant Minor arterial Not significant Collector +++ Local Not significant Presence of bus line Not significant Off-street bike facility (base case) -, + significant at 10% level --, ++ significant at 5% level ---,+++ significant at 1% level

81
82 Observations Bike and ped traffic varies temporally and spatially in consistent patterns Bike and ped traffic is highly correlated with: Weather, month, day of week Socioeconomic status of neighborhoods Some aspects of urban form and facility characteristics Models have limitations Theoretical models are incomplete (e.g., crime) Correlation is not causation
83 Potential Uses of Counts and Models Inform counting and evaluation strategies (e.g., increase efficiency of field sampling) Generalize ad hoc counts using seasonal, day ofweek, and time of day ratios (i.e., scaling factors) Inform planning and investment decisions about future bicycle and pedestrian infrastructure Inform safety management (e.g., stoplight warrants) Improve urban design Facilitate interdisciplinary research (e.g.,health impacts of cycling or walking on busy streets) Support initiatives to enhance quality of life
84 Observations All counts and models are wrong Modest efforts can produce useful estimates Estimates helpful for many policy, managerial, and operational decisions Research can inform policy and management
85 A Call to Count! National Bicycle and Pedestrian Documentation Project Faculty researchers and instructors Great opportunity for civic engagement Engage g students in counting Modular approaches to collection of data
86 National Bicycle & Pedestrian Documentation Project Bike-Pedestrian Counting Equipment 101 Adjustment Factors NBPD Counts Training i NBPD Survey Training NBPD Facts and FAQs Alta Design (
Neighborhood Influences on Use of Urban Trails
 Neighborhood Influences on Use of Urban Trails Greg Lindsey, Yuling Han, Jeff Wilson Center for Urban Policy and the Environment Indiana University Purdue University Indianapolis Objectives Present new
Temporal and Spatial Variation in Non-motorized Traffic in Minneapolis: Some Preliminary Analyses
 Temporal and Spatial Variation in Non-motorized Traffic in Minneapolis: Some Preliminary Analyses Spencer Agnew, Jason Borah, Steve Hankey, Kristopher Hoff, Brad Utecht, Zhiyi Xu, Greg Lindsey Thanks to:
Designing a Bicycle and Pedestrian Count Program in Blacksburg, VA
 Designing a Bicycle and Pedestrian Count Program in Blacksburg, VA Steve Hankey (Virginia Tech) Andrew Mondschein (U or Virginia) Ralph Buehler (Virginia Tech) Issue/objective Issue No systematic traffic
For Information Only. Pedestrian Collisions (2011 to 2015) Resolution. Presented: Monday, Apr 18, Report Date Tuesday, Apr 05, 2016
 Resolution. Presented: Monday, Apr 18, Report Date Tuesday, Apr 05, 2016") Presented To: Operations Committee For Information Only Pedestrian Collisions (0 to 0) Presented: Monday, Apr 8, 06 Report Date Tuesday, Apr 0, 06 Type: Correspondence for Information Only Resolution For
Presented To: Operations Committee For Information Only Pedestrian Collisions (0 to 0) Presented: Monday, Apr 8, 06 Report Date Tuesday, Apr 0, 06 Type: Correspondence for Information Only Resolution For
Ben Timerson, MnDOT Erik Minge, SRF Consulting Group Greg Lindsey, University of Minnesota
 Ben Timerson, MnDOT Erik Minge, SRF Consulting Group Greg Lindsey, University of Minnesota 2050 Vision Minnesota Go Multimodal transportation system maximizes the health of people, the environment and
Conducting Bicycle and Pedestrian Counts in Your Community: Count Manager Training. MnDOT and MDH Bicycle and Pedestrian Counting Initiative 2015
 Conducting Bicycle and Pedestrian Counts in Your Community: Count Manager Training MnDOT and MDH Bicycle and Pedestrian Counting Initiative 2015 Objectives 1. Understand what the Bike/Ped Count Program
Transportation Planning Division
 Transportation Planning Division Presentation Outline Study Tasks Recap of Previous Meeting Stakeholder Interviews Data Collection Design Principles Tool Box Recommendations Schedule Moving Forward North
2010 Pedestrian and Bicyclist Special Districts Study Update
 2010 Pedestrian and Bicyclist Special Districts Study Update Pedestrian and Bicyclist Special Districts Program Overview H-GAC s Special Districts Program aims to provide strategic investments in pedestrian
Active Travel and Exposure to Air Pollution: Implications for Transportation and Land Use Planning
 Active Travel and Exposure to Air Pollution: Implications for Transportation and Land Use Planning Steve Hankey School of Public and International Affairs, Virginia Tech, 140 Otey Street, Blacksburg, VA
2017 North Texas Regional Bicycle Opinion Survey
 2017 North Texas Regional Bicycle Opinion Survey Sustainable Development Program Kevin Kokes, AICP Public Meetings April, 2018 North Central Texas Council of Governments MPO for the Dallas-Fort Worth Region
Midtown Corridor Alternatives Analysis
 Midtown Corridor Alternatives Analysis Ridership Forecast Methodology and Results December 2013 Prepared by the SRF Consulting Group Team for Table of Contents Introduction... 1 Methodology... 1 Assumptions...
Summary of NWA Trail Usage Report November 2, 2015
 Summary of NWA Trail Usage Report November 2, 2015 Summary Findings: The study showed that Northwest Arkansas (NWA) had relatively high cyclist user counts per capita aggregated across the top three usage
2017 Northwest Arkansas Trail Usage Monitoring Report
 2017 Northwest Arkansas Trail Usage Monitoring Report Summary Findings: The study showed that average daily weekday bicycle volumes per study site increased by about 32% between 2015 and 2017, from 142
Instructions for Counting Pedestrians at Intersections. September 2014
 Instructions for Counting Pedestrians at Intersections September 2014 Purpose This document introduces the concept of the pedestrian count and provides instructions for performing a manual intersection
The Traffic Monitoring Guide: Counting Bicyclists and Pedestrians. APBP 2017 June 28: 11:15am-12:45pm
 The Traffic Monitoring Guide: Counting Bicyclists and Pedestrians APBP 2017 June 28: 11:15am-12:45pm 2 Presentation Organization Why count bicyclists and pedestrians? Why report count data? What resources
Market Factors and Demand Analysis. World Bank
 Market Factors and Demand Analysis Bank Workshop and Training on Urban Transport Planning and Reform. Baku, April 14-16, 2009 Market Factors The market for Public Transport is affected by a variety of
Exploring the relationship between Strava cyclists and all cyclists*.
 Exploring the relationship between Strava cyclists and all cyclists*. Dr. David McArthur, Dr. Jinhyun Hong, Dr. Mark Livingston, Kirstie English *This presentation contains preliminary results which are
An Assessment of Potential Greenhouse Gas Emissions Reductions from Proposed On Street Bikeways
 An Assessment of Potential Greenhouse Gas Emissions Reductions from Proposed On Street Bikeways Through the Sustainable Bethlehem Initiative, the Town of Bethlehem has identified both the improvement of
Route 79/Davol Street Corridor Study
 Route 79/Davol Street Corridor Study Fall River, MA Public Information Meeting #2 November 21, 2013 Fall River Heritage State Park Fall River, MA Agenda Welcome and Introductions Overview of Study Process
Congestion Reduction in Europe: Advancing Transport Efficiency. MG Tackling urban road congestion D3.4
 Congestion Reduction in Europe: Advancing Transport Efficiency MG-5.3-2014 Tackling urban road congestion D3.4 Patterns of congestion in European cities Multiple-indicator analysis using real-time GPS
2014 Fishers Trail Count
 2014 Fishers Trail Count July 2014 Table of Contents Introduction...1 Trail Count Locations...3 Ellipse Parkway at Holland Drive...4 Lantern Road at Sunblest Boulevard...5 126th Street at Cumberland Road...6
Traffic Impact Study. Westlake Elementary School Westlake, Ohio. TMS Engineers, Inc. June 5, 2017
 TMS Engineers, Inc. Traffic Impact Study Westlake Elementary School Westlake, Ohio June 5, 2017 Prepared for: Westlake City Schools - Board of Education 27200 Hilliard Boulevard Westlake, OH 44145 TRAFFIC
CAPITOL REGION COUNCIL OF GOVERNMENTS. Bike / Pedestrian Count Project
 CAPITOL REGION COUNCIL OF GOVERNMENTS Bike / Pedestrian Count Project October 2009 Introduction In 2008, the Capitol Region Council of Governments (CRCOG) updated the Regional Bike/Ped Plan, The CRCOG
Guidelines for Providing Access to Public Transportation Stations APPENDIX C TRANSIT STATION ACCESS PLANNING TOOL INSTRUCTIONS
 APPENDIX C TRANSIT STATION ACCESS PLANNING TOOL INSTRUCTIONS Transit Station Access Planning Tool Instructions Page C-1 Revised Final Report September 2011 TRANSIT STATION ACCESS PLANNING TOOL INSTRUCTIONS
Cycling and risk. Cycle facilities and risk management
 Cycling and risk Cycle facilities and risk management Failure to recognize possibilities is the most dangerous and common mistake one can make. Mae Jemison, astronaut 6/11/2010 York Regional Council Cycling
National Bicycle and Pedestrian Documentation Project INSTRUCTIONS
 National Bicycle and Pedestrian Documentation Project INSTRUCTIONS The National Documentation Project (NBPD) is an annual bicycle and pedestrian count and survey effort sponsored by the Institute of Transportation
Bicycle Crashes. Number of Bike Crashes. Total Bike Crashes. are down 21% and severe bike crashes down 8% since 2013 (5 years).
.") Bicycle Crashes The City of Fort Collins is well known for its bike culture, and there is a strong focus on encouraging increased riding. Bike safety is an important component of supporting these efforts.
Bicycle Crashes The City of Fort Collins is well known for its bike culture, and there is a strong focus on encouraging increased riding. Bike safety is an important component of supporting these efforts.
ADOT Statewide Bicycle and Pedestrian Program Summary of Phase IV Activities APPENDIX B PEDESTRIAN DEMAND INDEX
 ADOT Statewide Bicycle and Pedestrian Program Summary of Activities APPENDIX B PEDESTRIAN DEMAND INDEX May 24, 2009 Pedestrian Demand Index for State Highway Facilities Revised: May 29, 2007 Introduction
SR 693 (Pasadena Avenue) Corridor Study from Shore Drive South to 66 th Street
 Corridor Study from Shore Drive South to 66 th Street") Welcome and Introduction Sign-in and comment sheets Restrooms and exits Meeting agenda and timeline Meeting goals / expectations Provide input to guide study recommendations Actively participate throughout
Welcome and Introduction Sign-in and comment sheets Restrooms and exits Meeting agenda and timeline Meeting goals / expectations Provide input to guide study recommendations Actively participate throughout
Traffic Safety Plan Traffic Safety Plan 2015
 Traffic Safety Plan 2015 Purpose Airdrie s last Traffic Safety Plan was created in 2011. The 2015 Traffic Safety Plan is a revised model of the traffic operations for the City of Airdrie. The purpose of
City of Wayzata Comprehensive Plan 2030 Transportation Chapter: Appendix A
 A1. Functional Classification Table A-1 illustrates the Metropolitan Council s detailed criteria established for the functional classification of roadways within the Twin Cities Metropolitan Area. Table
A GIS APPROACH TO EVALUATE BUS STOP ACCESSIBILITY
 Advanced OR and AI Methods in Transportation A GIS APPROACH TO EVALUATE BUS STOP ACCESSIBILITY Giuseppe SALVO 1, Simona SABATINI 2 Abstract. This paper proposes a methodology to assess public transportation
Child Road Safety in Great Britain,
 Child Road Safety in Great Britain, 21-214 Bhavin Makwana March 216 Summary This short report looks at child road casualties in Great Britain between 21 and 214. It looks at how children travel, the geographical
WIM #36 MN 36 MP 15.0 LAKE ELMO APRIL 2014 MONTHLY REPORT
 WIM #36 MN 36 MP 15.0 LAKE ELMO APRIL 2014 MONTHLY REPORT In order to understand the vehicle classes and groupings, the MnDOT Vehicle Classification Scheme and the Vehicle Class Groupings for Forecasting
Kevin Manaugh Department of Geography McGill School of Environment
 Kevin Manaugh Department of Geography McGill School of Environment Outline Why do people use active modes? Physical (Built environment) Factors Psychological Factors Empirical Work Neighbourhood Walkability
TRAFFIC IMPACT ANALYSIS
 TRAFFIC IMPACT ANALYSIS FOR THE CHAMPAIGN UNIT#4 SCHOOL DISTRICT PROPOSED HIGH SCHOOL (SPALDING PARK SITE) IN THE CITY OF CHAMPAIGN Final Report Champaign Urbana Urbanized Area Transportation Study 6/24/2014
Bicycle Friendly Niagara Falls
 Bicycle Friendly Niagara Falls STAKEHOLDER COMMITTEE MEETING 2 SUPPORTED BY THE OATH COMMUNITY FUND AT THE COMMUNITY FOUNDATION FOR GREATER BUFFALO Develop a Bicycle Master Plan to document the city s
Defining Purpose and Need
 Advanced Design Flexibility Pilot Workshop Session 4 Jack Broz, PE, HR Green May 5-6, 2010 Defining Purpose and Need In your agency s project development process, when do design engineers typically get
VI. Market Factors and Deamnd Analysis
 VI. Market Factors and Deamnd Analysis Introduction to Public Transport Planning and Reform VI-1 Market Factors The market for Public Transport is affected by a variety of factors No two cities or even
County of Spartanburg South Carolina
 County of Spartanburg South Carolina Traffic Calming Program June 2012 (Revised/Program on Hold) PURPOSE The potential negative impacts from vehicular traffic on residential roads have been a longstanding
MOUNTAIN HOUSE SPECIFIC PLAN I 9.1 INTRODUCTION ASSUMPTIONS TRANSPORTATION FACILITIES TRANSPORTATION IMPROVEMENTS PHASING 9.
 CHAPTER NINE: TRANSPORTATION AND CIRCULATION 9.1 INTRODUCTION 9.1 9.2 ASSUMPTIONS 9.1 9.3 TRANSPORTATION FACILITIES 9.1 9.4 TRANSPORTATION IMPROVEMENTS PHASING 9.3 LIST OF FIGURES LIST OF TABLES Figure
DEPARTMENT OF ENVIRONMENTAL SERVICES. North Harrison Street (Lee Highway to Little Falls Road) Comparative Analysis. Prepared for:
 Comparative Analysis. Prepared for:") DEPARTMENT OF ENVIRONMENTAL SERVICES North Harrison Street (Lee Highway to Little Falls Road) Comparative Analysis Prepared for: Arlington County Department of Environmental Services 2100 Clarendon Boulevard,
DEPARTMENT OF ENVIRONMENTAL SERVICES North Harrison Street (Lee Highway to Little Falls Road) Comparative Analysis Prepared for: Arlington County Department of Environmental Services 2100 Clarendon Boulevard,
Cycling Volume Estimation Methods for Safety Analysis
 Cycling Volume Estimation Methods for Safety Analysis XI ICTCT extra Workshop in Vancouver, Canada Session: Methods and Simulation Date: March, 01 The Highway Safety Manual (HSM) documents many safety
APPENDIX A: Complete Streets Checklist DRAFT NOVEMBER 2016
 APPENDIX A: Complete Streets Checklist DRAFT NOVEMBER 2016 Complete Streets Checklist MetroPlan Orlando s Complete Streets Checklist is an internal planning tool for staff to further implementation of
Pedestrian Project List and Prioritization
 To: Kyle Wagenschutz, City of Memphis CC: From: Anne Conlon and John Cock, Alta Planning + Design Date: December, 2014 Re: Project List Development (Task 3.1-3.2) and Project List Prioritization (Task
Downtown Denver Summer 2013 Pedestrian Count Report
 Downtown Denver Summer 2013 Pedestrian Report Funded by the Downtown Denver Business Improvement District Downtown Denver Partnership, Inc. Research Department Research Department 511 16 th Street, Suite
Chapter 14 PARLIER RELATIONSHIP TO CITY PLANS AND POLICIES. Recommendations to Improve Pedestrian Safety in the City of Parlier (2014)
") Chapter 14 PARLIER This chapter describes the current status and future plans for biking and walking in the City of Parlier. RELATIONSHIP TO CITY PLANS AND POLICIES The Parlier General Plan is the primary
Chapter 14 PARLIER This chapter describes the current status and future plans for biking and walking in the City of Parlier. RELATIONSHIP TO CITY PLANS AND POLICIES The Parlier General Plan is the primary
Bicycle and Pedestrian Connectivity Study. Old Colony Planning Council
 Bicycle and Pedestrian Connectivity Study Old Colony Planning Council Outline Why consider bike/peds in road designs? Why are measures needed? Connecting Land Use with Transportation Evaluation Tools:
Traffic Safety Barriers to Walking and Bicycling Analysis of CA Add-On Responses to the 2009 NHTS
 Traffic Safety Barriers to Walking and Bicycling Analysis of CA Add-On Responses to the 2009 NHTS NHTS Users Conference June 2011 Robert Schneider, Swati Pande, & John Bigham, University of California
Bike Share Social Equity and Inclusion Target Neighborhoods
 Bike Share Social Equity and Inclusion Target Neighborhoods Target Neighborhoods West End/Visitation Park/Academy/Hamilton Heights Wellsgoodfellow/Kingsway West The Ville/Greater Ville Kingsway East/Fountain
Enclosure 1. Crimson Drive Traffic Safety and Calming Review Report
 Enclosure 1 Crimson Drive Traffic Safety and Calming Review Report Prepared by: Tahir Hameed, P.Eng. Traffic Safety Engineer Planning Engineering and Safety Transportation Planning and Engineering Date:
Transportation Planning Division
 Transportation Planning Division Presentation Outline Study Tasks Recap of Previous Meetings Data Collected Focus Areas within Study Limits Design Principles Tool Box Recommended Concepts Schedule Moving
Methods and Technologies for Pedestrian and Bicycle Volume Data Collection NCHRP 7-19
 Methods and Technologies for Pedestrian and Bicycle Volume Data Collection NCHRP 7-19 ITS Maryland 2013 Annual Meeting Kelly M. Laustsen October 8, 2013 1 MOVING FORWARD THINKING Presentation Overview
Developing a Bike/Pedestrian Plan Using ArcInfo and Public Participation Rob Shumowsky, Madison County Council of Governments
 Developing a Bike/Pedestrian Plan Using ArcInfo and Public Participation Rob Shumowsky, Madison County Council of Governments Abstract: The Madison County Council of Governments is creating a bike/pedestrian
Hennepin County Pedestrian Plan Public Comment Report
 Hennepin County Pedestrian Plan Public Comment Report On May 31, 2013, the draft Hennepin County Pedestrian Plan was released for a 45-day public comment period ending July 15, 2013. The county received
Rolling Out Measures of Non-Motorized Accessibility: What Can We Now Say? Kevin J. Krizek University of Colorado
 Rolling Out Measures of Non-Motorized Accessibility: What Can We Now Say? Kevin J. Krizek University of Colorado www.kevinjkrizek.org Acknowledgements Mike Iacono Ahmed El-Geneidy Chen-Fu Liao Outline
Building a bike friendly Chicago
 CASE STUDY Miovision Scout Building a bike friendly Chicago How video data is moving Chicago forward Chicago 2020 Becoming the Most Bike-Friendly City in the United States In 2011, Mayor Rahm Emanuel set
I-105 Corridor Sustainability Study (CSS)
") I-105 Corridor Sustainability Study (CSS) Metro Streets and Freeways Subcommittee March 21, 2019 Gary Hamrick Cambridge Systematics, Inc. I-105 CSS Project History & Background Funded by Caltrans Sustainable
I-105 Corridor Sustainability Study (CSS) Metro Streets and Freeways Subcommittee March 21, 2019 Gary Hamrick Cambridge Systematics, Inc. I-105 CSS Project History & Background Funded by Caltrans Sustainable
ACTIVE TRANSPORTATION
 ACTIVE TRANSPORTATION Mobility 2040 Supported Goals Improve the availability of transportation options for people and goods. Support travel efficiency measures and system enhancements targeted at congestion
World Leading Traffic Analysis
 World Leading Traffic Analysis Over the past 25 years, has worked closely with road authorities and traffic managers around the world to deliver leading traffic monitoring equipment. With products now
TAKOMA METRO STATION
 TKOM METRO STTION Traffic nalysis Technical Memorandum Station Planning in Support of Joint evelopment Job No. 13-FQ165-LN-2 November 213 WSHINGTON METROPOLITN RE TRNSIT UTHORITY (WMT) Takoma Metro Station
Appendix ELP El Paso, Texas 2003 Annual Report on Freeway Mobility and Reliability
 (http://mobility.tamu.edu/mmp) Office of Operations, Federal Highway Administration Appendix ELP El Paso, Texas 2003 Annual Report on Freeway Mobility and Reliability This report is a supplement to: Monitoring
95 Express Annual Operations Report: Fiscal Year
 95 Express Annual Operations Report: Fiscal Year 2014-2015 General The 95 Express Program completed its sixth full Fiscal Year of operations in June 2015. For the FDOT, its Fiscal Year (FY) is from July
to the Public Information Centre for the Downtown Traffic Study
 to the Public Information Centre for the Downtown Traffic Study City of Sault Ste. Marie July 25, 2018 Purpose of Study Determine if changes to one-way corridors can enhance downtown s character and spaces
Downtown Denver Summer 2012 Pedestrian Count Report
 Downtown Denver Summer 2012 Pedestrian Report Funded by the Downtown Denver Business Improvement District Downtown Denver Partnership, Inc. Research Department Research Department 511 16 th Street, Suite
Planning Guidance in the 2012 AASHTO Bike Guide
 Planning Guidance in the 2012 AASHTO Bike Guide Presentation by: RJ Eldridge Peter Lagerwey August 22, 2012 WEBINAR 2: PLANNING GUIDANCE IN THE 2012 AASHTO BIKE GUIDE Today s Webinar Significant Updates
KC Scout Kansas City s Bi-State Transportation Management Center
 KC Scout Kansas City s Bi-State Transportation Management Center Operations Report August- 215 This report contains statistical and operational data of activities at the Scout TMC for the period Saturday,
Understanding Rider Differences in Mileage and Riding Frequency through the MSF100 Motorcyclists Naturalistic Study.
 2/18/216 Understanding Rider Differences in Mileage and Riding through the MSF1 Motorcyclists Naturalistic Study January 13, 214 Mac McCall Shane McLaughlin Motorcycle Research Group 1 Overview Objective
A Traffic Operations Method for Assessing Automobile and Bicycle Shared Roadways
 A Traffic Operations Method for Assessing Automobile and Bicycle Shared Roadways A Thesis Proposal By James A. Robertson Submitted to the Office of Graduate Studies Texas A&M University in partial fulfillment
GIS Based Non-Motorized Transportation Planning APA Ohio Statewide Planning Conference. GIS Assisted Non-Motorized Transportation Planning
 The Purpose of GIS Assisted Network GIS Assisted Non-Motorized Transportation 2011 APA Ohio Statewide Conference Friday, 10:45 AM to Noon Focus on near-term projects wwwgreenwaycollabcom The purpose of
Application of Demographic Analysis to Pedestrian Safety. Center for Urban Transportation Research University of South Florida
 Application of Demographic Analysis to Pedestrian Safety BDV25 TWO 977 30 Pei Sung Lin, Ph.D., P.E., PTOE, FITE Program Director Achilleas Kourtellis, Ph.D. Senior Research Associate CUTR, University of
EXECUTIVE SUMMARY. Vision
 Vision Walking and bicycling in Salt Lake City will be safe, convenient, comfortable, and viable transportation options that connect people to places, foster recreational and economic development opportunities,
Roadway Bicycle Compatibility, Livability, and Environmental Justice Performance Measures
 Roadway Bicycle Compatibility, Livability, and Environmental Justice Performance Measures Conference on Performance Measures for Transportation and Livable Communities September 7-8, 2011, Austin, Texas
Forthcoming 2015 Transportation Research Record
 Blanc, Johnson, Figliozzi, Monsere, and Nordback 7 9 0 7 9 0 7 9 Leveraging Signal Infrastructure for Non-Motorized Counts in a Statewide Program: A Pilot Study Bryan Blanc, Graduate Research Assistant
US287 Asset Inventory Fort Collins. Figure 5-1 Fort Collins Bridges and Traffic Signals
 Chapter 5: City of Fort Collins US287 through Fort Collins is known as College Avenue, runs for approximately 9.25 miles, and bisects the City north to south. Within the City, US287 is a principal arterial.
OFFICE/RETAIL DEVELOPMENT 1625 BANK STREET OTTAWA, ONTARIO TRANSPORTATION BRIEF. Prepared for: Canada Inc.
 OFFICE/RETAIL DEVELOPMENT 1625 BANK STREET OTTAWA, ONTARIO TRANSPORTATION BRIEF Prepared for: 9402209 Canada Inc. December 15, 2015 115-625 Report_2.doc D. J. Halpenny & Associates Ltd. Consulting Transportation
An Analysis of the Travel Conditions on the U. S. 52 Bypass. Bypass in Lafayette, Indiana.
 An Analysis of the Travel Conditions on the U. S. 52 Bypass in Lafayette, Indiana T. B. T readway Research Assistant J. C. O ppenlander Research Engineer Joint Highway Research Project Purdue University
 Community and Business Outreach November 2015 Goal #1: Improve safety in the corridor Goal #2: Make a more livable corridor Goal #3: Improve mobility for all Data Collection Alternatives Recommendations
Freeway ramp intersection study
 Freeway ramp intersection study Supporting Vision Zero: Zero traffic deaths in San Francisco by 2024 Study Goals: Primary Improve Safety Improve Accessibility Secondary Provide Efficient Circulation Accommodate
Arlington Public Schools Thomas Jefferson Site Evaluation Transportation Networks. Thomas Jefferson Working Group Meeting #6 November 10, 2014
 Arlington Public Schools Thomas Jefferson Site Evaluation Transportation Networks Thomas Jefferson Working Group Meeting #6 November 10, 2014 2 3 INTRODUCTION 4 Goal of our work: Identify and assess multi-modal
6.0 PEDESTRIAN AND BICYCLE FACILITIES 6.1 INTRODUCTION 6.2 BICYCLE DEMAND AND SUITABILITY Bicycle Demand
 6.0 PEDESTRIAN AND BICYCLE FACILITIES 6.1 INTRODUCTION Bicycle and pedestrian travel along and in the vicinity of the corridor is part of the vision of Somerset and Hunterdon counties and the integrated
Multimodal Analysis in the 2010 Highway Capacity Manual
 Multimodal Analysis in the 2010 Highway Capacity Manual It s not just cars anymore! Jamie Parks, AICP HCAT Conference May 9-10, 2011 Multimodal LOS in the 2010 HCM History and background Overview of methods
Chapter 6 Transportation Plan
 Chapter 6 Transportation Plan Transportation Plan Introduction Chapter 6 Transportation Plan Transportation Plan Introduction This chapter describes the components of Arvada s transportation system, comprised
City of Novi Non-Motorized Master Plan 2011 Executive Summary
 City of Novi Non-Motorized Master Plan 2011 Executive Summary Prepared by: February 28, 2011 Why Plan? Encouraging healthy, active lifestyles through pathway and sidewalk connectivity has been a focus
TRANSPORTATION & MOBILITY
 TRANSPORTATION & MOBILITY ROADWAY SYSTEM There are approximately 40 miles of roadways in Manitou Springs. For planning purposes, roadways are typically assigned a functional classification which defines
Citywide Sidewalk and Crosswalk Programs
 Citywide Sidewalk and Crosswalk Programs Council Meeting October 20, 2015 Presented by Rita Hu and Jamal Mahmoud Program Goals Implement the City s comprehensive plan. Provide pedestrian with safe walking
Bicycle Boulevards and Neighborhood Greenways
 Bicycle Boulevards and Neighborhood Greenways Traffic Safety is Improving for Everyone 90 80 70 60 50 40 30 20 10 0 PORTLAND: TOTAL TRAFFIC FATALITIES 1986-2008 1986 1987 1988 1989 1990 1991 1992 1993
Tonight is for you. Learn everything you can. Share all your ideas.
 Strathcona Neighbourhood Renewal Draft Concept Design Tonight is for you. Learn everything you can. Share all your ideas. What is Neighbourhood Renewal? Creating a design with you for your neighbourhood.
AAMPO Regional Transportation Attitude Survey
 AAMPO Regional Transportation Attitude Survey Traditionally Underserved Populations helping organizations make better decisions since 1982 2018 Submitted to the AAMPO By: ETC Institute 725 W. Frontier
Bicycle + Pedestrian Connectivity Gap Analysis
 Accelerated Bridge Program Bicycle + Pedestrian Connectivity Gap Analysis Tuesday, October 11 Shriners Hospital, Boston 6:30-8:00 PM Thursday, October 13 Community Rowing, Brighton 6:30-8:00 PM Tuesday,
In station areas, new pedestrian links can increase network connectivity and provide direct access to stations.
 The Last Mile Planning for Pedestrians Planning around stations will put pedestrians first. Making walking to stations safe and easy is important; walking will be a part of every rapid transit Accessible
Agenda. Overview PRINCE GEORGE S PLAZA METRO AREA PEDESTRIAN PLAN
 PRINCE GEORGE S PLAZA METRO AREA PEDESTRIAN PLAN May 28, 2008 Agenda Welcome and introductions Project overview and issue identification Planning context and strengths Design challenges and initial recommendations
SECTION 1 - TRAFFIC PLANNING
 SECTION 1 - TRAFFIC PLANNING 1.1 TRAFFIC OPERATIONS 1.1.1 Roadway Functional Classification The Multnomah County Comprehensive Framework Plan s Policy 34: Trafficways and the Functional Classification
Financial Project ID No(s).: and ETDM No(s).: and 14181
.: and ETDM No(s).: and 14181") Palm Beach Metropolitan Planning Organization (MPO) Presentation I-95 at Boynton Beach Boulevard Interchange and I-95 at Gateway Boulevard Interchange Project Development and Environment Study Palm Beach
Palm Beach Metropolitan Planning Organization (MPO) Presentation I-95 at Boynton Beach Boulevard Interchange and I-95 at Gateway Boulevard Interchange Project Development and Environment Study Palm Beach
A Matter of Fairness: ROCOG s Environmental Justice Protocol. What is Mobility Limitation?
 No Person Left Behind What is Mobility Limitation? What is the Access Limitation? Environmental Justice population should be provided adequate mobility & access to meet their needs; Identify acceptable
THIS PAGE LEFT BLANK INTENTIONALLY
 GA SR 25 Spur at Canal Road Transportation Impact Analysis PREPARED FOR GLYNN COUNTY, GEORGIA 1725 Reynolds Street, Suite 300 Brunswick, Georgia 31520 PREPARED BY 217 Arrowhead Boulevard Suite 26 Jonesboro,
Notes to Benefit-Cost Analysis
 Executive Summary Project Matrix Current Status/ Problem to Be Addressed University Avenue not user friendly or safe for cars, pedestrians, bicyclists, or bus riders. Notes to Benefit-Cost Analysis Change
Capitol Region Council of Governments Bike/Pedestrian Count Project
 Capitol Region Council of Governments Bike/Pedestrian Count Project 2015 REPORT CAPITOL REGION COUNCIL OF GOVERNMENTS Bike / Pedestrian Count Project 2015 Count Introduction This report presents an analysis
Perryville TOD and Greenway Plan
 Perryville TOD and Greenway Plan Greenway Glossary Pathway: A bicycle and pedestrian path separated from motorized vehicular traffic by an open space, barrier or curb. Multi-use paths may be within the
Environment and Public Works Committee Presentation
 Mixed Use Centers Complete Streets Guidelines Project Environment and Public Works Committee Presentation December 10, 2008 Project Objectives: Conduct an inter-departmental and agency process to study