Ministry of Transportation of Ontario Travel Time Study Results
|
|
|
- Dinah Melton
- 6 years ago
- Views:
Transcription
1 Clause 2 in Report No. 1 of Committee of the Whole was adopted, without amendment, by the Council of The Regional Municipality of York at its meeting held on January 21, Ministry of Transportation of Ontario Travel Time Study Results Committee of the Whole recommends: 1. Receipt of the presentation by Stephen Collins, Director, Infrastructure Management and Project Management Office. 2. Adoption of the following recommendation contained in the report dated December 17, 2015 from the Commissioner of Transportation Services: 1. The Regional Clerk circulate this report to the Clerks of the local municipalities and Ontario Ministry of Transportation. 1. Recommendation It is recommended that: 1. The Regional Clerk circulate this report to the Clerks of the local municipalities and Ontario Ministry of Transportation. 2. Purpose This report highlights the findings of the Ontario Ministry of Transportation s (MTO) 2014 Travel Time Study; a comprehensive survey of travel time, speed and delay across the Greater Toronto-Hamilton Area (GTHA). Committee of the Whole 1 Transportation Services January 14, 2016
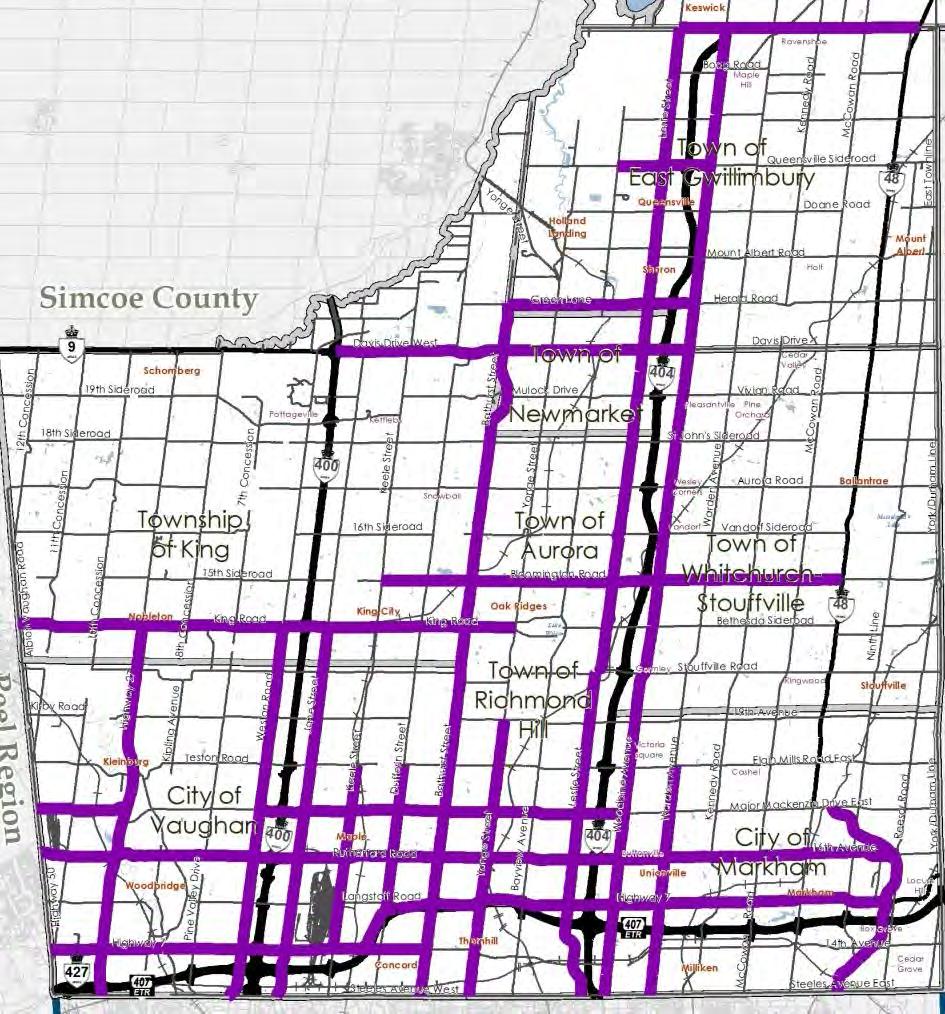
2 2014 Ministry of Transportation of Ontario Travel Time Study Results 3. Background York Region has participated in Travel Time Studies since 2008 MTO has conducted a biennial travel time study of the major provincial highways in the Greater Toronto Area since The biennial comprehensive study measures travel speeds and travel times, which have become important indicators for traffic congestion. York Region participated in the 2008 and 2010 Travel Time Studies. However, did not participate in the 2012 Travel Time Study as some of the Region s major corridors were under construction. MTO s 2014 Travel Time Study (Study) included approximately 22 arterial corridors in York Region including but not limited to Yonge Street, Highway 27, Highway 7, Bloomington Road and Ravenshoe Road, covering approximately 800 km (two-way distance). Regional corridors included in the 2014 Study are illustrated in Attachment 1. Attachment 2 contains the final report s Executive Summary. Identifying significant travel delay locations informs the prioritization of future transportation projects and traffic management strategies The results of the Travel Time Study provide data to monitor roadway performance and help identify critical road sections to be considered in future road and transit improvement projects and traffic management strategies. The travel time measure is used by staff and many transportation agencies as a performance measure for highways and major roadways. The data also provides consistent and reliable historical data on travel speeds and delays that can be used for transportation planning, as well as traffic operational analysis in York Region to effectively manage traffic congestion under existing and future conditions. York Region uses the findings of the Study as one of the aids in: Understanding variability and reliability of travel time Identifying bottleneck improvements locations to relieve the most congested areas and if/how these locations have changed over time Committee of the Whole 2 Transportation Services January 14, 2016
3 2014 Ministry of Transportation of Ontario Travel Time Study Results Identifying opportunities for improvements to signal timings on major arterial corridors to improve traffic flow Assessing effectiveness of recently-completed capital road improvement projects Since completion of the MTO s 2010 Travel Time Study, roadway capital improvement projects have been completed on York Region arterials. Several important corridors were under construction at the time of the Study, such as Highway 7, Davis Drive, Warden Avenue and Bloomington Road. In some cases, the Study results may not show improvements in the travel speeds on the improved corridors because traffic volumes and latent demands in these corridors have increased significantly since Travel time data will be shared with appropriate groups within York Region for their information and analysis. The Study is part of the Region s traffic monitoring program Prior to 2008, the Region conducted adhoc travel time studies using various methods to inform the traffic monitoring program. In October 2009, Council authorized York Region s participation in 2010 and subsequent Travel Time Studies. City of Toronto and Regions of Durham and Peel also participated in MTO s 2014 Study Participating municipalities in the 2014 Study include City of Toronto and the Regional Municipalities of Durham, Peel and York. The 2014 Study surveyed approximately 29 corridors (816 km) for Toronto, 27 corridors (652 km) for Durham Region, 36 corridors (1,155 km) for Peel Region and 22 corridors (800 km) for York Region. Further it covered approximately 340 kilometres of MTO 400-series highways within York Region such as Highway 404, Highway 400, Highway 427, and Highway Analysis and Options The 2014 Study used GPS field surveys and purchased data from TomTom for analysis Data for the Study was collected using a combination of two survey methods. The first method utilized survey vehicles equipped with GPS technology to record travel data on selected corridors. The second method sourced travel time and Committee of the Whole 3 Transportation Services January 14, 2016
4 2014 Ministry of Transportation of Ontario Travel Time Study Results speed data from the private data provider TomTom, which provided a database of traffic data aggregated by personal GPS devices located in passenger vehicles and individual smartphone navigation mobile applications. In 2014, Cities of Markham and Vaughan and the Town of Richmond Hill had roads with highest travel times Road segments were ranked by average speed surveyed during peak periods to identify roadways with longest travel time. The ranking does not account for the effects of the posted speed limit or the free flow speed. Generally, the Travel Time Index (TTI) is a comparison between peak period and free flow speeds to indicate additional travel time required during peak periods. For example, a TTI of 3.0 indicates that a motorist s trip will take three times longer during peak periods than during off peak. Free flow speeds may be higher than posted speeds. Table 1 summarizes the 10 highest travel time segments for AM peak period. The AM peak period is 6:30 AM to 9:30 AM Tuesday through Friday. Of note, Davis Drive was under construction during the survey period. Table 1 10 Highest Travel Time Segments (AM Peak Period) Rank Route Begins At Ends At Posted Speed (km/h) Surveyed Average Speed (km/h) Travel Time Index (TTI) 1 Keele St SB Langstaff Rd Highway Centre St WB Dufferin St Highway Keele St SB Major Mackenzie Dr Rutherford Rd Yonge St SB Highway 7 Steeles Ave Highway 7 WB Woodbine Ave Leslie St Davis Dr EB Yonge St Leslie St Donald Cousens Parkway SB Highway 407 Steeles Ave Highway 7 EB Leslie St Woodbine Ave Davis Dr WB Leslie St Yonge St th Ave WB Woodbine Ave Leslie St Note: WB = Westbound SB = Southbound EB = Eastbound Committee of the Whole 4 Transportation Services January 14, 2016
5 2014 Ministry of Transportation of Ontario Travel Time Study Results It should be noted that TTI cannot be simply calculated using the posted speed limit divided by the average surveyed speed. Flow speed is estimated based on the posted speed and could be higher than posted speed. Table 2 summarizes the 10 highest travel time segments for PM peak period. PM peak period is 3:30 PM to 6:30 PM, Monday through Thursday. Table 2 10 Highest Travel Time Segments (PM Peak Period) Rank Route Begins At Ends At Posted Speed (km/h) Surveyed Average Speed (km/h) Travel Time Index (TTI) 1 Leslie St NB Highway th Ave Rutherford Rd WB Keele St Weston Rd Woodbine Ave NB Steeles Ave Highway Highway 7 WB Woodbine Ave Leslie St Keele St SB Langstaff Rd Highway Davis Dr WB Leslie St Yonge St Rutherford Rd EB Weston Rd Keele St Highway 7 EB Woodbine Ave Kennedy Rd Highway 7 WB Keele St Weston Rd th Ave EB Leslie St Woodbine Ave Note: WB = Westbound SB = Southbound EB = Eastbound The Travel Time Index of 4.49 on Leslie Street northbound from Highway 407 to 16 th Avenue means that motorists travelling on this section of Leslie Street should expect peak travel times to be almost four and half times longer than travelling at the free flow conditions. The results of the 2014 Study indicate PM peak period generally has lower average speed than the AM peak period. In the 2010 Study, AM and PM peak period speeds were similar. This indicates PM peak period conditions have deteriorated the past four years. Staff will continue to monitor these conditions and make adjustments to future model forecasting efforts. Committee of the Whole 5 Transportation Services January 14, 2016
6 2014 Ministry of Transportation of Ontario Travel Time Study Results Highway 404 between 16th Avenue and Highway 401 is the slowest among the 400-series highways in the GTHA During AM and PM peak periods, trips on 400-series highways in York Region can take more than three times longer. Table 3 summarizes the 400-series highway performance in York Region for the AM peak period. During the AM peak period, Highway 404 general purpose lanes between 16 th Avenue and Highway 401 exhibited a TTI value of 3.4, the highest in the GTHA. This means motorists travelling on this section of Highway 404 should expect peak travel times 3.4 times longer than when travelling at the free flow speed. Table series Highway Performance in York Region (AM Peak) Route Begins At Ends At Segment Length (km) Surveyed Average Speed (km/h) Travel Time Index (TTI) Highway 404 GPL SB 16 th Avenue Highway km Highway 404 SB Green Lane 16 th Ave 25 km Highway 404 HOV SB 16 th Ave Highway km Highway 427 SB Highway 7 Highway km Highway 400 SB Langstaff Rd Highway km Highway 404 NB Highway th Ave 11 km Note: GPL = General Purpose Lane SB = Southbound HOV = High Occupancy Vehicle Lane NB = Northbound Table 4 summarizes the 400-series highway performance in York Region during the PM peak period. During the PM peak period, the highest TTI was found on Highway 404 northbound GPL with a value of 3.0. This means travellers on this section of Highway 404 should expect peak travel times 3.0 times longer than when travelling at the free flow speed. When compared to the 2012 Study, the TTI of this Highway 404 northbound section was 2.7, meaning traffic conditions have slightly worsened. Committee of the Whole 6 Transportation Services January 14, 2016
7 2014 Ministry of Transportation of Ontario Travel Time Study Results Table series Highway Performance in York Region (PM Peak) Route Begins At Ends At Segment Length (km) Surveyed Average Speed (km/h) Travel Time Index (TTI) Highway 404 GPL NB Highway th Ave 11 km Highway 404 HOV NB Sheppard Ave 16 th Ave 10 km Highway 404 GPL SB 16 th Ave Highway km Highway 427 NB Highway 401 Highway 7 12 km Highway 404 HOV SB 16 th Ave Highway km Highway 400 NB Highway 401 Langstaff Rd 45 km Note: GPL = General Purpose Lane HOV = High Occupancy Vehicle Lane SB = Southbound NB = Northbound Drivers can save up to 10 minutes when using the High Occupancy Vehicle lanes on Highway 404 in peak directions During the AM peak period, southbound travel time on the Highway 404 High Occupancy Vehicle (HOV) lane (between 16 th Avenue and Highway 401) resulted in a travel time reduction of more than nine minutes compared to GPL. HOV travel time advantage increased by four minutes between 2012 and The northbound HOV lane reduced travel time by 37 seconds when compared to the GPL. The travel time savings in this direction on the HOV lane were similar to the savings in the 2012 Travel Time Study. During the PM peak period, the northbound travel time of the Highway 404 HOV lane was approximately 10 minutes shorter than the travel time on the GPL. HOV travel time advantage increased by approximately five minutes between 2012 and Travel time on the southbound HOV lane was about four minutes shorter than the travel time on GPL, which is similar to the results found in Travel time survey data will be used in the Transportation Master Plan Update to identify areas of significant congestion As the Region is currently undertaking the Transportation Master Plan Update, travel time information can be used to identify areas of significant congestion along Regional corridors. Committee of the Whole 7 Transportation Services January 14, 2016
8 2014 Ministry of Transportation of Ontario Travel Time Study Results The technical information developed as part of this Study will assist staff to identify areas of significant congestion and the presence of queuing (the extent of traffic back up) on Regional roads. The 2014 MTO Travel Time Study results also provide Regional staff with additional tools and information to assess road closure requests, road construction activities and other initiatives, such as transportation model calibrations, review of traffic impact studies submitted by the consultants and analysis for future conditions. York Region will participate in the next biennial Travel Time Study in 2016 York Region will participate in MTO s 2016 Travel Time Study to continue to build the database for performance comparison and testing of new technologies to help congestion management. Link to key Council-approved plans The goals of providing sustainable transportation and developing livable cities and complete communities, as stated in Vision 2051, are supported by this report. This report also supports the 2015 to 2019 Strategic Plan s priority area of managing environmentally sustainable growth, as well as the Regional Official Plan s related policies of moving people and goods. MTO s 2014 Study results will assist in supporting the Region s Transportation Master Plan Update, congestion management and roadway monitoring. 5. Financial Implications York Region s share of MTO s 2014 Study was $40,750 and was included in the 2014 Capital Budget. 6. Local Municipal Impact MTO s 2014 Travel Time Study data and final report are available to local municipalities, stakeholders and other Regional departments. Local municipalities can use the data to assist in their transportation planning, traffic operational activities and to achieve a better understanding of traffic congestion and road network performance in their communities. Committee of the Whole 8 Transportation Services January 14, 2016
9 2014 Ministry of Transportation of Ontario Travel Time Study Results 7. Conclusion The partnership with MTO on travel time studies has provided York Region consistent and reliable historical data on travel speeds that will be used for transportation planning and traffic operational planning, to effectively manage traffic congestion under existing and future conditions. The data will also assist staff to identify significant areas of congestion and the presence of queuing on Regional roads, as part of the Transportation Master Plan Update process. For more information on this report, please contact Stephen Collins, Director Infrastructure Management and PMO, at ext The Senior Management Group has reviewed this report. December 17, 2015 Attachments (2) # Accessible formats or communication supports are available upon request Committee of the Whole 9 Transportation Services January 14, 2016
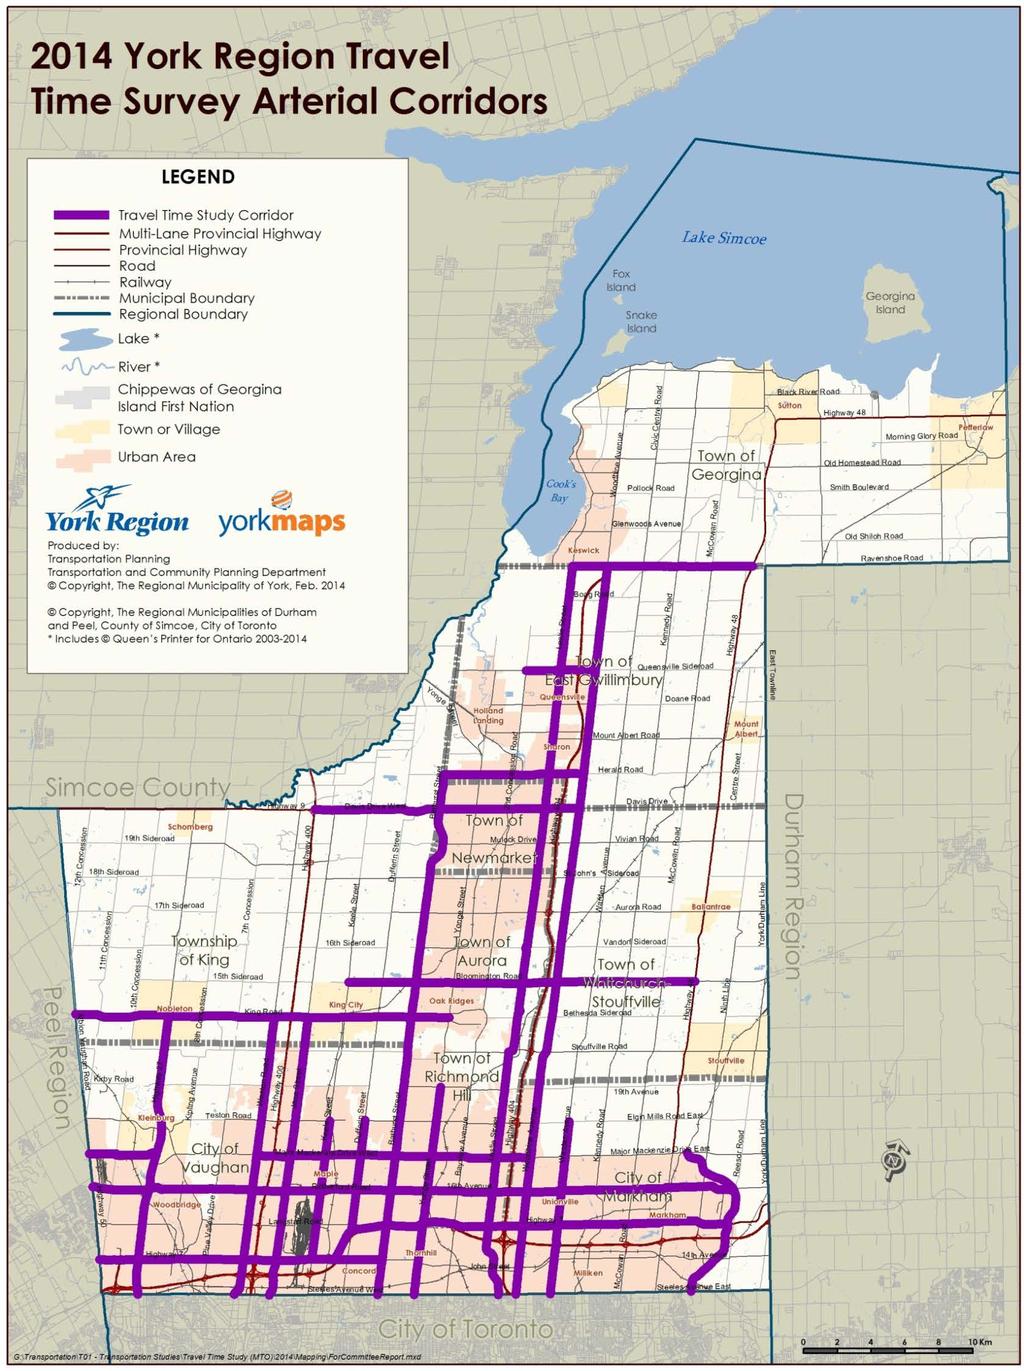
10 Attachment 1

11 Attachment 2 Executive Summary 2014 Travel Time Study Prepared for Ministry of Transportation Ontario, the City of Toronto, and the Regional Municipalities of Durham, Peel, and York By IBI Group October 2015
12 IBI GROUP EXECUTIVE SUMMARY 2014 TRAVEL TIME STUDY Prepared for Ministry of Transportation Ontario, the City of Toronto, and the Regional Municipalities of Durham, Peel, and York Document Control Page CLIENT: PROJECT NAME: REPORT TITLE: IBI REFERENCE: VERSION: 1.0 Ministry of Transportation Ontario, the City of Toronto, and the Regional Municipalities of Durham, Peel, and York 2014 Travel Time Study 2014 Travel Time Study DIGITAL MASTER: ORIGINATOR: REVIEWER: AUTHORIZATION: J:\37035_MTO_TTS2014\10.0 Reports\Executive Summary\ TTR_2014TTS_Executive Summary_ docx Marc Tan, Andrew Wong, Daniel Cierpka Ron Stewart Ron Stewart CIRCULATION LIST: HISTORY: October 2015
13 IBI GROUP EXECUTIVE SUMMARY 2014 TRAVEL TIME STUDY Prepared for Ministry of Transportation Ontario, the City of Toronto, and the Regional Municipalities of Durham, Peel, and York Table of Contents 1 Overview Methodology Performance Measures Major Findings City of Toronto Durham Region Peel Region York Region October 2015 i
14 IBI GROUP EXECUTIVE SUMMARY 2014 TRAVEL TIME STUDY Prepared for Ministry of Transportation Ontario, the City of Toronto, and the Regional Municipalities of Durham, Peel, and York 1 Overview The Ministry of Transportation Ontario (MTO) has undertaken a biennial travel time study of major provincial roadways in the Greater Toronto Area (GTA) since The results of the studies provide metrics for assessing facility performance and identifying critical road sections to be considered in future improvement projects and traffic management strategies. The 2014 Travel Time Study (TTS) includes surveys of 12 provincial 400 series highways in the GTA, three (3) provincial highways, two (2) expressways in the City of Toronto, and 114 arterial corridors from within the City of Toronto and the Regional Municipalities of Durham, Peel, and York. High occupancy vehicle (HOV) lanes and a total of 113 freeway ramps were also surveyed. This report includes analysis of daily, weekly, monthly, and weekend traffic patterns during fall of 2014, and is supplemented with special analyses of selected holiday weekends and seasonal traffic variation. Additional analysis includes: Travel time and delays on freeways and principal arterials within the City of Toronto and the Regional Municipalities of Durham, Peel, and York; Ramps between 400 series highways; HOV facilities; Inter-municipal arterial corridors; Parallel 400 series highway/arterial routes; Major origin-destination pairs; Rail freight access routes; Impacts of construction and operational improvements; and Validation of purchased data using Bluetooth and Global Positioning System (GPS) probe surveys. 1.1 Methodology Data for the 2014 TTS was collected using a combination of two survey methods. The first source of data was the purchase of travel time and speed data from the private data provider, TomTom, which provides a database of traffic data aggregated by personal GPS devices located in passenger vehicles and individual s smartphone navigation mobile apps. A second method consisted of survey vehicles equipped with GPS devices dispatched to record travel data on selected corridors. For each survey, the traffic data source was selected based on survey requirements, with some requiring a combination of both sources as shown in Exhibit 1. An additional data source, consisting of roadside Bluetooth transceivers, was applied as a means of validation of purchased data along selected 400 series highway segments. All collected traffic data underwent a verification process prior to application in travel time analysis. October
15 IBI GROUP EXECUTIVE SUMMARY 2014 TRAVEL TIME STUDY Prepared for Ministry of Transportation Ontario, the City of Toronto, and the Regional Municipalities of Durham, Peel, and York Exhibit 1: Application of Survey Data Sources Survey 400 Series Highways and Expressways Report Section(s) 3.1 to 3.5, 3.10 GPS Auto Probe Data Purchased Data Operational Improvements 3.6 and 3.7 Lane Closures 3.8 Comparison of Seasonal Factors 3.9 Comparison of Monthly Factors 3.9 Comparison of Weekly Factors 3.9 Ramps 4 Arterials 5 Inter-Municipal Arterial Analysis 6 Parallel Routes 7 Origin-Destination Pairs 8 Rail Access Routes 9 HOV Facilities 10 Weekends 11 Canada Day weekend 12 Labour Day weekend 13 Validation of Purchased Data* 14 Primary data source Used for comparison only * Validation of the purchased data using GPS probe surveys and Bluetooth surveys along eight segments that included Highways 400, 401, 404, and 406. Weekday surveys were conducted during the AM peak, Midday, and PM peak periods (excluding Monday AM and Friday PM peak periods), while weekend surveys were conducted during Saturday and Sunday midday and afternoon. The Canada Day survey was completed on Friday June 27, 2014, Saturday June 28, 2014, and Tuesday, July 1, 2014, while the Labour Day survey was completed on Friday and Monday of the holiday weekend (i.e. August 29, 2014 and September 1, 2014). The sampling times of surveys were deliberately varied within each survey period to capture the temporal variability of traffic conditions inherent to each road segment. 1.2 Performance Measures The following performance measures were used to track trends in freeway and municipal arterial congestion over time, based on travel time and speed data: Level of Service (LOS) Determines the effectiveness of roadways using criteria defined in the Highway Capacity Manual (HCM) The letter-grade criteria are based on a comparison of free-flow speed to measured speed for each segment; Travel Time Index (TTI) Compares peak period to free-flow travel conditions in order to provide a relative indication of the additional travel time incurred at peak October
16 IBI GROUP EXECUTIVE SUMMARY 2014 TRAVEL TIME STUDY Prepared for Ministry of Transportation Ontario, the City of Toronto, and the Regional Municipalities of Durham, Peel, and York flow conditions (i.e. a TTI of 1.4 indicates that a trip will take 40% longer on average than at the free flow speed); Buffer Time Index (BTI) A measure of travel time reliability, the BTI represents the extra travel time (or buffer) that a motorist needs to consistently arrive on time with a high degree of confidence (i.e. a BTI of 24% means that a motorist should allow 24% more travel time for a trip in order to arrive on time 19 times out of 20, or at a 95% level of confidence); and Travel Delay Compares observed travel time to theoretical free-flow travel time, and consists of two measures of delay: Total Delay is a measure of overall delay impacts on a roadway, and is defined as the product of per-vehicle delay and hourly traffic volume; and Average Delay per Signal is the delay per vehicle at a traffic signal, broken down into delay caused by the traffic signal and delay caused by traffic congestion. 1.3 Major Findings General findings of the 2014 TTS are highlighted below, followed by individual sections on notable survey results. Overall Network Congestion There was a similar level of overall congestion when compared to the 2012 TTS of the roadway and highway system in the GTA. This excluded York Region arterials, as those were not surveyed during the 2012 TTS; Despite additions to roadway capacity, the 2014 TTS showed that adequate network capacity continued to be a limiting factor; While congestion remained a prevalent issue in the core of the GTA with a number of key highways (i.e. Highway 427 and Highway 401) that degraded in operations, outer areas experienced similar travel times when compared to the 2012 TTS; and Congestion during AM and PM peak periods is occurring over a similar duration to the 2012 TTS. However, congestion during the Midday period has worsened. The Highway Network Since 2012, the number of segments operating at LOS A/B/C remained almost unchanged during the AM and PM peak periods, while it increased during the Midday period by 16%. At the same time, the number of segments operating at LOS E/F has decreased by 3% and 6% in the AM peak and Midday periods respectively, while it increased by 5% in the PM peak period; The system-wide TTI have remained largely unchanged since 2010, The systemwide BTI dropped significantly since 2012 in both the AM and PM peak periods; When compared to the 2012 TTS, during the AM peak periods, there was a slightly larger portion of the network that experienced a noticeable deterioration in average speed (18%) than a noticeable improvement (14%) Similarly, during the PM peak period, a larger portion of the network experienced a noticeable deterioration in average speed (26%) when compared to noticeable improvements in average speed (13%); In terms of speed variance comparison to the 2012 TTS, the majority of the segments (i.e. 159 of 171 in the AM peak period and 161 of 171 in the PM peak October
17 IBI GROUP EXECUTIVE SUMMARY 2014 TRAVEL TIME STUDY Prepared for Ministry of Transportation Ontario, the City of Toronto, and the Regional Municipalities of Durham, Peel, and York period) experienced deterioration representing 98% for both peak periods of the analyzed distance. This was due to the change in calculation methodology of the variance of the samples by the purchased data provider in the 2014 and 2012 studies. As a result, the variance provided was noticeably higher than what was used in the 2012 TTS; and The true peak period for the vast majority of highway corridors falls between 8:00 AM and 9:00 AM for the AM peak period, and between 5:00 PM and 6:00 PM for the PM peak period. Specific Highway Corridors and Routes On Highway 401 at Keele Street, the magnitude of volumes reported during the Midday period has grown remarkably since As a result, the highway section is operating near capacity for much of the working day; During the AM peak period, the Highway 404 General Purpose Lanes (GPL) southbound from 16 th Avenue to Highway 401 exhibited the highest TTI with a value of 3.4; During the PM peak period, the highest TTI was found on the Highway 404 northbound GPL from Highway 401 to 16 th Avenue with a value of 3.0; The highest BTI for the AM peak period was found on the Highway 404 GPL southbound from 16 th Avenue to Highway 401 with value of 126%; During the PM peak period, the highest BTI was found on Highway 401 Collector eastbound from Sheppard Avenue to Brock Road with a value of 173%; The Express lanes of the Highway 401 eastbound between Guelph Line and Newtonville Road experienced the largest total delay in the AM peak period; and The eastbound lanes of Highway 401 Collector between Mississauga Road and Brock Road experienced the largest total delay in the PM peak period. Weekly, Monthly, and Seasonal Variations in Traffic All speeds were compared to the average fall speeds to calculate factors. Speeds during the AM peak period were on average 4% and 6% higher in the spring and summer, respectively. For the winter season, the speeds were 3% slower than those during the fall; During the PM peak period, speeds were generally 2% to 3% higher than fall speeds for all seasons; During the AM peak period, the month with the fastest speeds was August (averaging 10% faster), while the months with the slowest speeds were January and February (averaging 5% and 6% slower, respectively); During the PM peak period, the months with the fastest speeds were March and April, averaging 4% and 5% faster, respectively. The only months to record a decrease in speeds were November and December, where the speeds averaged 6% and 4% slower, respectively; The fastest speeds observed in a week during both the AM peak period and PM peak period occurred during week 52 (December 22, 2014 to December 28, 2014), where speeds averaged 26% and 14% faster, respectively. However, during the PM peak period, the remaining weeks of December were observed to operate at speeds 6% to 9% slower than the fall average, causing the month of December to average a decrease in speeds; October
18 IBI GROUP EXECUTIVE SUMMARY 2014 TRAVEL TIME STUDY Prepared for Ministry of Transportation Ontario, the City of Toronto, and the Regional Municipalities of Durham, Peel, and York The slowest speeds observed in a week during both the AM peak period and PM peak period occurred during the second week of December (week 50) and the third week of November (week 47), respectively. During the AM and PM peak periods, recorded speeds were 15% and 17% slower, respectively. Operational Improvements The QEW Niagara bound lane widening and rehabilitations project near the Brant Street interchange showed no changes during the AM peak period, and slower HOV lane operations by 15 km/h during the PM peak period. This can likely be attributed to the increase in traffic volume; The rehabilitation and lane addition on Highway 401 between Jane Street and Kipling Avenue resulted with no speed changes during the Midday and PM peak periods. The only changes were during the AM peak period, where the eastbound Collector has decreased in speed by 36 km/h and the westbound Collector has increased in speed by 13 km/h since 2008; The rehabilitation and lane addition on Highway 401 Collector expansion and rehabilitation near Hurontario Street has improved operations in the eastbound direction during the AM peak period by 10 km/h since However, speeds have decreased by 20 km/h in the westbound direction since During the PM peak period, operations also improved in the eastbound direction, by 8 km/h since Weekends and Holidays During the weekend studies: On Sunday, there were 5% more segments that reported a LOS of A/B/C compared to Saturday. Furthermore, 22% of highway sections operated at LOS E or F on Sunday, compared to 24% on Saturday; The slowest Saturday segment was Highway 401 Collector eastbound from Dixie Road to Highway 400, operating at 64 km/h, while the slowest Sunday segment was Highway 401 Express eastbound from Dixie Road to Highway 400, at 70 km/h; and For both days analyzed, there were a significant amount of segments that noticeably improved, when compared to the 2012 TTS. This included 33% and 39% of the network on Saturday and Sunday, respectively. There were significantly more segments that improved than deteriorated. Only 6% and 11% of the network noticeably deteriorated for Saturday and Sunday, respectively. For the Canada Day survey, all road segments on July 1, 2014 operated at LOS A/B/C. On June 27, 2014 and June 28, 2014, 35% and 43% of segments, respectively, operated at a LOS A/B/C; and On the Labour Day weekend, the road sections on Monday, September 1, 2014 operated at a better LOS (i.e. LOS A/B/C) than on Friday, August 29, 2014, with 13% more segments. For road segments that operated poorly (i.e. LOS E or F), the Monday results had 11% fewer road sections compared to Friday. Most of the road sections that operated poorer on Friday compared to Monday were on Highway 401 and Highway 404 close to the City of Toronto. Other Special Study Findings HOV lanes were shown to be effective in reducing travel time for HOV lane users along Highway 403, Highway 404, and the QEW. Increased traffic volume has October
19 IBI GROUP EXECUTIVE SUMMARY 2014 TRAVEL TIME STUDY Prepared for Ministry of Transportation Ontario, the City of Toronto, and the Regional Municipalities of Durham, Peel, and York resulted in a slight deterioration of the HOV lane performance along Highway 403 in the eastbound direction, while the Highway 404 and QEW HOV performance has remained consistent since 2012; In an analysis of construction related lane closures, it was found that night time lane closures did not generally result in a significant reduction in speed, with most lanes still operating close to the speed limit. The largest difference observed was operations that slowed to 7 km/h below the posted speed limit at QEW eastbound between Royal Windsor Drive and Winston Churchill Boulevard; From the analysis of different ramps between major 400 series highways, it was seen that the ramp from Highway 401 Collector westbound to DVP southbound reported the slowest travel speed during the AM peak period at 21 km/h. The ramp from Highway 409 eastbound to Highway 427 northbound reported the slowest travel speed during the PM peak period at 25 km/h; The results of the parallel route analysis showed that correlation between mean speeds on the 400 series highway and its parallel arterial corridor(s) cannot always be predicted, due to factors such as differing segment lengths and unknown travel time between parallel routes; Of the rail access routes surveyed, the majority of these routes experienced similar or improved travel times as in 2012, except for the access route from CN Torbram Road Terminal (Brampton) to Highway 427, where the speed reduced by 14 km/h; and A special origin-destination survey for Highway 401 was conducted along both Collector and Express lanes between Mississauga Road and Brock Road. PM peak period travel time was generally found to be worse than travel time during the AM peak period. All travel time comparisons to the 2012 TTS have worsened, except for the Collector lanes in the westbound direction which showed a slight improvement during all periods. October
20 IBI GROUP EXECUTIVE SUMMARY 2014 TRAVEL TIME STUDY Prepared for Ministry of Transportation Ontario, the City of Toronto, and the Regional Municipalities of Durham, Peel, and York 2 City of Toronto The 2014 TTS covered approximately 270 km of MTO 400 series highways within the City of Toronto, the entire Don Valley Parkway (DVP) and F. G. Gardiner Expressway, as well as 816 km of arterial corridors. These included major downtown routes such as Lake Shore Boulevard, Queen Street, and Yonge Street, in addition to arterials throughout the City. The primary findings within the City of Toronto are highlighted below. 400 Series Highways and Expressways Arterials The City of Toronto Expressways (i.e. Gardiner Expressway and Don Valley Parkway) operated at a better LOS in 2014 compared to The number of segments operating at LOS A/B/C increased by 20%, 19%, and 3% during the AM peak, Midday, and PM peak period respectively. The improved sections were reported mostly downstream of the construction area in both directions between South Kingsway and Spadina Avenue on the Gardiner Expressway; During both the AM and PM peak periods, there has been a significant increase in TTI values for City of Toronto Expressways since the 2012 TTS, from 1.7 to 2.1 and from 1.8 to 2.8, respectively. This was likely the results of the construction on the City of Toronto Expressways, specifically the Gardiner Expressway, during the survey period for the 2014 TTS; During the AM peak period for 400 series highways in the City of Toronto, the TTI was very similar to the value from the 2012 TTS. However, during the PM peak period, the TTI slightly increased when compared to the 2012 TTS, increasing from 1.7 to 1.8; During both the AM and PM peak periods, there was a significant decrease in BTI values for the City of Toronto 400 series highways and Expressways. The drop ranged from 14% to 55%. The decrease in BTI signifies that travel times on major highways and Expressways in the City of Toronto are becoming more consistent and predictable; The slowest segments on the City of Toronto Expressways were on the F.G. Gardiner Expressway eastbound approaching South Kingsway during the AM peak period and westbound approaching Spadina Avenue during the PM peak period. This was mainly due to the lane reductions from the construction between South Kingsway and Spadina Avenue; and The 400 series highway section that operated the poorest within the City of Toronto was the Highway 404 GPL between Highway 401 and 16 th Avenue in the southbound direction during the AM peak period (52 km/h), and in the northbound direction during the PM peak period (41 km/h). In the City of Toronto, there are 68%, 70%, and 43% of the arterials operating at LOS C or better during the AM peak period, Midday period, and PM peak period respectively; Sections of Yonge Street, Eglinton Avenue, and Queen Street experienced slow speeds in both directions during the AM and PM peak periods; TTI values were greater than 1.5 for 89% of the surveyed corridors during the AM and PM peak periods, and were above 1.0 for all the surveyed corridors; October
21 IBI GROUP EXECUTIVE SUMMARY 2014 TRAVEL TIME STUDY Prepared for Ministry of Transportation Ontario, the City of Toronto, and the Regional Municipalities of Durham, Peel, and York Based on the TTI, there are significantly longer travel times observed in the PM peak period compared to the AM peak period. During the PM peak period, 56% of the surveyed corridors had a TTI above 2.0, compared to only 20% during the AM peak period; The regional BTI values for AM and PM peak periods were 44% and 39% respectively, as calculated by the distance-based weighting system. These results were compared to the 2012 TTS, where they were 38% and 33% for the AM and PM peak periods respectively; Similar to the 2012 TTS, William R Allen Road southbound from Steeprock Drive to Eglinton Avenue experienced large congestion delays in both AM and PM peak periods. This was mainly due to traffic signals and the construction at the terminus of the William R Allen Road expressway section; Eglinton Avenue experienced the highest total delay in both the AM peak period and PM peak period. This was mainly due to the Eglinton Crosstown Light Rail Transit (LRT) construction. These led to significantly high total delays observed on Eglinton Avenue; During the AM peak period and Midday period, the majority of segments (86%) did not experience a noticeable change in speeds when compared to the 2012 TTS; During the PM peak period, 31 segments had a noticeable improvement when compared to the 2012 TTS, translating to 10% of the total distance analyzed. However, 36 segments experienced a noticeable deterioration in speeds, representing 11% of the total distance analyzed; and The majority of the segments (averaging 87%) across all periods did not experience a statistically significant change in terms of speed variance. October
22 IBI GROUP EXECUTIVE SUMMARY 2014 TRAVEL TIME STUDY Prepared for Ministry of Transportation Ontario, the City of Toronto, and the Regional Municipalities of Durham, Peel, and York 3 Durham Region The 2014 TTS covered approximately 190 km of MTO 400 series highways within the Regional Municipality of Durham, and 27 arterial corridors covering approximately 652 km in both directions. The Durham Region arterial analysis included major corridors such as Brock Road, Rossland Road, Brock Street/Baldwin Street, and Taunton Road, among others. The primary findings within Durham Region are highlighted below. 400 Series Highways Arterials For 400 series highways in Durham Region, similarly to Peel and York Regions, the TTI values have stayed relatively similar to the 2012 level. Only minor changes were evident for TTI values over the course of the studies for these jurisdictions. Durham Region TTI values were typically higher in the PM peak period (1.2) when compared to the AM peak period (1.0); There was an increase of BTI during the PM peak period on the 400 series highways in Durham Region by 8%. The increase of BTI can be attributed to a longterm construction project that has begun on a large stretch of Highway 401 in both directions through the region; and The segment in the region that had the slowest speed was Highway 401 Collector westbound between the Brock Road and the Highway 404/DVP interchange during the AM peak period (57 km/h). During the PM peak period, the slowest section was on Highway 401 Express eastbound from Brock Road to Brock Street, averaging 43 km/h. In Durham Region arterials, 96%, 95%, and 83% of the surveyed corridors operated at LOS C or higher during the AM peak period, Midday period, and PM peak period respectively. This result was slightly better compared to the 2012 TTS; The slowest segment in both AM and PM peak periods was Brock Road in the northbound direction between Bayly Road and Highway 2. The interchange of Brock Road at Highway 401 was a location of congestion during the PM peak period, as both the northbound and southbound segments originating from Highway 401 were listed in the top 10 slowest speeds; During the AM peak period, only 23% of surveyed arterials had a TTI greater than 1.5, compared to 48% during the PM peak period; The regional TTI values were similar between the AM and PM peak periods, with a distance based weighted average of 1.3 in the AM peak period, and 1.5 in the PM peak period; The BTI values on a regional level were relatively low for both AM and PM peak periods in Durham Region. The BTI values for the AM and PM peak periods were 28% and 30% respectively, as calculated by the distance-based weighting system; The corridor of Courtice Road experienced relatively long congestion delay for both directions during both AM and PM peak periods. This could be mainly attributed to construction projects and lane closures occurring along Courtice Road; Durham Region operational improvements resulted in speed improvements for a variety of roadways that included Highway 7/Winchester road, Bayly Street/Victoria Street/Bloor Street, and Thickson Road; October
23 IBI GROUP EXECUTIVE SUMMARY 2014 TRAVEL TIME STUDY Prepared for Ministry of Transportation Ontario, the City of Toronto, and the Regional Municipalities of Durham, Peel, and York Taunton Road between York-Durham Line and Martin Road experienced the highest total delay in the westbound direction during the AM peak period, and the second highest total delay in the eastbound direction during the PM peak period. This is due to large traffic volumes experienced on Taunton Road; During the AM peak period, 43 segments had a noticeable improvement in harmonic mean speed, totalling to 20% of the surveyed distance when compared to the 2012 TTS; During the PM peak period, 26 segments experienced a noticeable improvement, representing 12% of the analyzed distance when compared to the harmonic mean speeds in the 2012 TTS. However, 39 segments underwent noticeable deterioration in speeds, totaling to 18% of the analyzed distance; and In terms of speed variance, for both AM and PM peak periods, the majority of segments (82%) have not experienced a statistically significant change when compared to the 2012 study. October
24 IBI GROUP EXECUTIVE SUMMARY 2014 TRAVEL TIME STUDY Prepared for Ministry of Transportation Ontario, the City of Toronto, and the Regional Municipalities of Durham, Peel, and York 4 Peel Region The 2014 TTS covered approximately 470 km of MTO 400 series highways within the Regional Municipalities of Peel and Halton, as well as approximately 1,155 km of arterial roads in Peel Region. The Peel Region arterial analysis included major corridors such as Dixie Road, Hurontario Street, Burnhamthorpe Road, and Eglinton Avenue, among others. The primary findings within Peel Region are highlighted below. 400 Series Highways Arterials In Peel Region, similar to Durham and York Regions, the TTI values have stayed relatively similar to the 2012 level. Only minor changes were evident for TTI values over the course of the studies for these jurisdictions. The PM peak period TTI values (1.3) were slightly higher than the AM peak period (1.2) for Peel Region; There was a decrease in BTI during both the AM and PM peak periods along the 400 series highways in Peel Region, by 9% and 5% respectively; and The slowest highway section in Peel Region was Highway 401 Express eastbound between Dixie Road and Highway 400 during the AM peak period (38 km/h) and during the PM peak period (32 km/h). The weekday survey shows that 82%, 85%, and 57% of the arterials operated at LOS C or higher during the AM peak, Midday, and PM peak periods, respectively. The results are similar to those found in the 2012 TTS; The results indicate that the PM peak period was worse than the AM peak period as many corridors TTI values were higher. Similar observations were made in many of the other regions and also in the 2012 TTS; Dixie Road northbound from Lakeshore Road to The Queensway experienced the highest TTI during the AM peak period. This was mainly due to the Hanlan Watermain construction project that took place during the survey period. Kennedy Road northbound from Britannia Road to Derry Road experienced the highest TTI during the PM peak period; Among the surveyed corridors in Peel Region, 8% and 40% had TTI values above 2.0 in the AM peak period and the PM peak period, respectively. This means that on 8% of the corridors in the AM peak period and 40% of the corridors in the PM peak period, the expected travel time was more than double the travel time under free flow speed; The regional distance weighted average TTI was higher in the PM peak period at 1.9 compared to 1.6 in the AM peak period; The regional BTI values were 32% in both the AM and PM peak periods, as calculated by the distance-based weighting system. Similar results were presented in 2012 TTS; The Gore Road between Mayfield Road and King Street had the longest average delay per signal in both directions in the AM peak period, in the eastbound direction specifically. This was due to the fact that there is a large distance between signals; Embleton Road between Winston Churchill Road and Mississauga Road had the longest average delay per signal in both directions in the PM peak period. This was October
25 IBI GROUP EXECUTIVE SUMMARY 2014 TRAVEL TIME STUDY Prepared for Ministry of Transportation Ontario, the City of Toronto, and the Regional Municipalities of Durham, Peel, and York due to a combination of factors including construction, long distance between signals, and number of lanes; Operational improvement projects in Peel Region resulted in performance improvements on Burnhamthorpe Road, Mississauga Road, and Hurontario Street; and During the AM peak period, 41 and 43 segments had a noticeable improvement and deterioration in harmonic mean speed, respectively. This translates to 13% and 12% of the analyzed distance experiencing an improvement and deterioration respectively, when compared to the 2012 TTS; During the PM peak period, 36 segments had a noticeable improvement in speed, representing 11% of the analyzed distance. However, 53 segments experienced a noticeable deterioration in speed, which represents 16% of the analyzed distance in Peel Region; and The majority of the segments (85%) across all periods did not experience a statistically significant change in terms of speed variance; October
26 IBI GROUP EXECUTIVE SUMMARY 2014 TRAVEL TIME STUDY Prepared for Ministry of Transportation Ontario, the City of Toronto, and the Regional Municipalities of Durham, Peel, and York 5 York Region The 2014 TTS covered approximately 330 km of MTO 400 series highways within the Regional Municipalities of York and Simcoe County, as well as approximately 801 km of arterial roads in York Region. The York Region arterial analysis included major corridors such as Highway 7, Davis Drive, Keele Street, and Yonge Street, among others. The primary findings within York Region are highlighted below. 400 Series Highways Arterials In York Region, similar to Durham and Peel Regions, the TTI values have stayed relatively similar to the 2012 level. Only minor changes were evident for TTI values over the course of the studies for these jurisdictions. The TTI values for the AM and PM peak periods were fairly similar for this region; During the AM peak period, there was a decrease in BTI when compared to the 2012 TTS, from 38% to 29%. The PM peak period BTI results were fairly similar to those from the 2012 TTS; and The slowest highway segment was on Highway 404 GPL between 16 th Avenue and Highway 401 in the southbound direction during the AM peak period (52 km/h) and in the northbound direction during the PM peak period (41 km/h). In York Region, it was noted that 79%, 82%, and 65% of the arterials operated at LOS C or higher during the AM peak, Midday, and PM peak periods, respectively; The majority of the slow segments were in the southern portion of York Region near Highway 7. Surveyed arterials in this area were impacted by the vivanext Bus Rapid Transit (BRT) Rapidway construction on Highway 7. Similarly, the vivanext BRT construction on Davis Drive had a significant impact on the traffic operations, which led Davis Drive to become one of the slowest segments in York Region; The slowest segment during the AM peak period was Keele Street southbound from Langstaff Road to Highway 7. During the PM peak period, the slowest segment was Leslie Street northbound from Highway 407 to 16th Avenue; Among the surveyed corridors during the AM peak period in York Region, 9% had TTI values above 2.0. This means that on 9% of the corridors, the expected travel time was more than double the travel time at free flow speed; Among the surveyed corridors during the PM peak period in York Region, 25% had TTI values above 2.0; The regional distance weighted average TTI was higher in the PM peak period at 1.7, compared to 1.5 in the AM peak period; The regional distance weighted average BTI was higher in the AM peak period at 31%, compared to 24% in the PM peak period; Major Mackenzie Drive between Highway 27 and Highway 50 had the longest summed and congestion delays per signal in both directions, during both AM and PM peak periods. This was due to the fact that there is a large distance between signals; Highway 7 eastbound and westbound experienced the highest total delays in both AM and PM peak periods. This is because Highway 7 is a high capacity corridor carrying three lanes of traffic in both directions for much of the corridor; and October
27 IBI GROUP EXECUTIVE SUMMARY 2014 TRAVEL TIME STUDY Prepared for Ministry of Transportation Ontario, the City of Toronto, and the Regional Municipalities of Durham, Peel, and York The operational improvement that was analyzed was the lane addition on Highway 7 from Rouge River to Town Centre Boulevard. When compared to the harmonic mean speeds from the 2010 TTS, the operational improvement project along Highway 7 yielded minimal or minor negative impacts. During the AM peak period, mean speeds dropped by 9 km/h and 5 km/h for the eastbound and westbound directions, respectively. During the PM peak period, mean speeds dropped by 3 km/h and 14 km/h for the eastbound and westbound directions, respectively. J:\37035_MTO_TTS2014\10.0 Reports\Executive Summary\TTR_2014TTS_Executive Summary_ docx\ \AW October

28 Presentation 2014 MTO Travel Time Study Results Presentation to Committee of the Whole Stephen Collins January 14,

29 Presentation Outline This presentation accompanies Agenda Item D Study Overview and Area 2. Study Methodology 3. Study Results 4. Summary 2

30 Study Overview Travel time study of highways and arterial roadways is done every 2 years 400 Series Highways and Arterial Roads Covered in the 2014 MTO Travel Time Study Includes 12 provincial 400-series highways, 3 provincial highways, 2 expressways and 114 arterial corridors Assessment and analysis of daily, weekly, monthly and weekend traffic patterns during

31 Study Area York Region 4
 Validation and verification of data by: Bluetooth transceivers")

32 Methodology Data Collection Collection of traffic data: Measuring travel times using specialized survey vehicles Purchasing data from private vehicle GPS devices (TomTom) Validation and verification of data by: Bluetooth transceivers Random sampling Weekday surveys include AM Peak, Midday and PM Peak periods Weekend and holiday surveys include midday and random sampling More than 125,000 vehicle-km surveyed Achieved 95% level of statistical confidence in the data Photo Courtesy of: DCL 5

33 York Region Average Mean Speeds AM and PM Peak AM PM Peak AM Peak PM Peak 6
34 AM Peak Period 10 Slowest Moving Roads Comparison between 2014 and 2010 Survey Keele St SB (Langstaff Rd to Hwy 7) Centre St WB (Dufferin St to Hwy 7) Keele St SB (Major Mackenzie Dr to Rutherford Rd) Yonge St SB (Hwy 7 to Steeles Ave) Highway 7 WB (Woodbine Ave to Leslie St) Davis Dr EB (Yonge St to Leslie St) Donald Cousens Parkway SB (Hwy 7 to Steeles Ave) Highway 7 EB (Leslie St to Woodbine Ave) Davis Dr WB (Leslie St to Yonge St) 16th Ave WB (Woodbine Ave to Leslie St) Average Survyed Speed km/h Survey 2010 Survey Travel speed was reduced by 50% during the AM peak period General Speed Limit 7
35 PM Peak Period - 10 Slowest Moving Roads Comparison between 2014 and 2010 Leslie St NB (Hwy 407 to 16th Ave) Rutherford Rd WB (Keele St to Weston Rd) Woodbine Ave NB (Steeles Ave to Hwy 7) Highway 7 WB (Woodbine Ave to Leslie St) Keele St SB (Langstaff Rd to Hwy 7) Davis Dr WB (Leslie St to Yonge St) Rutherford Rd EB (Weston Rd to Keele St) Highway 7 EB (Woodbine Ave to Kennedy Rd) Highway 7 WB (Keele St to Weston Rd) 16th Ave EB (Leslie St to Woodbine Ave) Average Survyed Speed km/h Survey 2010 Survey Travel speed was reduced by nearly 70% during the PM peak period General Speed Limit 8
36 AM and PM Peak Periods - Comparison of Travel Time Index TTI % TTI % AM TTI % PM TTI % During the AM peak period, about 91% of the surveyed corridors within the reasonable range of Travel Time Index (between 1.0 and 2.0) PM peak period is worse than the AM peak period, with only 75% of the surveyed corridors within the reasonable range of the Travel Time Index between (1.0 and 2.0) 9
 and PM (3.")
37 400 Series Highways Areas of Congestion The Travel Time Index exceeds three in both the AM (3.4) and PM (3.0) peak periods Slowest section in GTHA is Highway 404 between Hwy 401 to 16 th Avenue 10
38 Summary The slowest segments in both AM & PM peak periods were in the southern portion of York Region near Highway 7 Some arterials were impacted by construction activity Congestion and delay have increased between 2010 and % of York Region roads have a Travel Time Index greater than 2.0 during the morning rush hour 25% of York Region roads have a Travel Time Index greater than 2.0 during the evening rush hour The Travel Time Study is one part of our overall data collection and system monitoring York Region is investing in all transportation modes to provide travel choices and manage congestion 11


39 What is Being Done to Manage Increases in Travel Time? Short Term Congestion management strategy Traffic controller upgrades Signal optimization Traffic Management Centre 12


40 What is Being Done to Manage Increases in Travel Time? Long Term Regional investment in network expansion Provincial investments in highway expansion Regional Express Rail TMP policy and network directions Provincial Investments In York Region 13

41 Report Recommendation: Agenda Item D.2.1: It is recommended that: 1. The Regional Clerk circulate this report to the Clerks of the local municipalities and Ontario Ministry of Transportation
42 York Region Arterial Travel Time Indices AM Peak Period AM Peak Period Travel Time Index (TTI) Centre Street WB (Bathurst Street to Highway 7) Keele Street SB (Teston Road to Highway 7) Highway 7 WB (Donald Cousens Pkwy to Highway 50) Centre Street EB (Highway 7 to Bathurst Street) Warden Avenue SB (Elgin Mills Road to Steeles Avenue) Top 5 corridors that require double the time to travel 9% of the arterials surveyed had a Travel Time Index greater than 2.0 Centre Street WB has the highest Travel Time Index of 2.15 AM travel times are highly influenced by work and school trips 15
43 York Region Arterial Travel Time Indices PM Peak Period PM Peak Period Travel Time Index (TTI) Highway 7 WB (Donald Cousens Pkwy to Hwy 50) Warden Avenue NB (Steeles Avenue to Elgin Mills Road) Major Mackenzie Drive EB (Weston Road to Woodbine Avenue) Highway 7 EB (Highway 50 to Donald Cousens Pkwy) Yonge Street NB (Steeles Avenue to Gamble Road) Top 5 corridors that require double the time to travel 25% of the arterials had a Travel Time Index greater than 2.0 Highway 7 WB has the highest Travel Time Index of 2.44 PM travels times are higher because of discretionary and non-work trips 16

44 Aggregate TTI Values for Arterials by Jurisdiction Note: This comparison is only based on the arterials that were surveyed as part of this Study for each municipality York Region arterials rank the second lowest by aggregate TTI in all three periods The TTI in the AM Peak and Midday period are similar, while the TTI is slightly higher in the PM Peak period 17

45 Aggregate BTI Values for Arterials by Jurisdiction Note: This comparison is only based on the arterials that were surveyed as part of this Study for each municipality York Region arterials rank the lowest by aggregate BTI during the Midday and PM peak periods, but average higher BTI values than Durham Region in the AM peak period The BTI during the AM and PM Peak periods are noticeably higher than the Midday period 18
TRANSPORTATION TOMORROW SURVEY
 Clause No. 15 in Report No. 7 of was adopted, without amendment, by the Council of The Regional Municipality of York at its meeting held on April 17, 2014. 15 2011 TRANSPORTATION TOMORROW SURVEY recommends
4 Ridership Growth Study
 Clause 4 in Report No. 15 of Committee of the Whole was adopted, without amendment, by the Council of The Regional Municipality of York at its meeting held on November 16, 2017. 4 Ridership Growth Study
4 DISRUPTION MANAGEMENT PLAN HIGHWAY 7 RAPIDWAY CONSTRUCTION BETWEEN BAYVIEW AVENUE AND WARDEN AVENUE TOWNS OF MARKHAM AND RICHMOND HILL
 4 DISRUPTION MANAGEMENT PLAN HIGHWAY 7 RAPIDWAY CONSTRUCTION BETWEEN BAYVIEW AVENUE AND WARDEN AVENUE TOWNS OF MARKHAM AND RICHMOND HILL The Transportation Services Committee recommends the adoption of
EXECUTIVE SUMMARY OF CALEDON TRANSPORTATION NEEDS STUDY
 EXECUTIVE SUMMARY OF CALEDON TRANSPORTATION NEEDS STUDY The Caledon Transportation Needs Study has been undertaken as a joint project by the Town of Caledon and the Region of Peel to determine the existing
3 TRAFFIC CONTROL SIGNAL TIMING AND SYNCHRONIZATION
 Report No. 8 of the Transportation Services Committee Regional Council Meeting of October 20, 2011 3 TRAFFIC CONTROL SIGNAL TIMING AND SYNCHRONIZATION The Transportation Services Committee recommends:
York Region Population and Employment Growth
 March 1, 2016 1 York Region Population and Employment Growth York Region needs to comply with The Provincial Growth Plan and new forecasts introduced to 2036 and 2041 2 Regional Official Plan Review York
MoPac South: Impact on Cesar Chavez Street and the Downtown Network
 MoPac South: Impact on Cesar Chavez Street and the Downtown Network Prepared by: The University of Texas at Austin Center for Transportation Research Prepared for: Central Texas Regional Mobility Authority
Welcome. The Brooklin Secondary Plan and Transportation Master Plan are collectively referred to as the Brooklin Study.
 Welcome The Town of Whitby is undertaking a study to prepare a Secondary Plan and Transportation Master Plan to guide and manage growth in the Brooklin area. The Brooklin Secondary Plan and Transportation
KING STREET TRANSIT PILOT
 STREET TRANSIT PILOT Update toronto.ca/kingstreetpilot #kingstreetpilot HIGHLIGHTS PREVIOUS HIGHLIGHTS TRANSIT RELIABILITY TRANSIT TRAVEL TIMES 85% of streetcars arriving within 4 minutes westbound during
3.2.2 Proposed Road Network within Phase 1B Lands
 3.2.2 Proposed Road Network within Phase 1B Lands Figure 3.1 also shows the proposed road network within the Premier Gateway Phase 1B Employment Area lands, which features two collector roads providing
WELCOME TO OPEN HOUSE # 1 June 14, 2017
 Langstaff Road Weston Road to Highway 7 Class Environmental Assessment Study WELCOME TO OPEN HOUSE # 1 June 14, 2017 Please sign in and join our mailing list Purpose of Open House #1 & Study Area York
Markham Sports, Entertainment and Cultural Centre Transportation Overview
 Markham Sports, Entertainment and Cultural Centre Transportation Overview ARENA LOCATION 2 3 TRANSPORTATION VISION IN MARKHAM On April 12, 2011, Markham Council adopted a long-term Transportation Vision
AMEC Earth and Environmental. Bovaird Drive Environmental Assessment. Traffic Study Final Report. August Excellence in Transportation Planning
 AMEC Earth and Environmental Bovaird Drive Environmental Assessment Traffic Study Final Report August Excellence in Transportation Planning AMEC Earth and Environmental Bovaird Drive Class EA Traffic
Appendix A. Road Classification Review of Outstanding Issues and Proposed Classifications (All Wards) Staff Report Road Classification System
 Staff Report Road Classification System") Appendix A Road Classification Review of Outstanding Issues and Proposed Classifications (All Wards) Staff Report 2000 A.1 of A.10 A.2 of A.10 STAFF REPORT January 26, 2000 To: From: Works Committee Barry
Appendix A Road Classification Review of Outstanding Issues and Proposed Classifications (All Wards) Staff Report 2000 A.1 of A.10 A.2 of A.10 STAFF REPORT January 26, 2000 To: From: Works Committee Barry
Travel Patterns and Characteristics
 DRAFT 2006 Transportation Fact Book SECTION 4 Travel Patterns and Characteristics 43 2006 Transportation Fact Book DRAFT 44 DRAFT 2006 Transportation Fact Book Why do we conduct travel surveys? The main
Chapter 4 Traffic Analysis
 Chapter 4 Traffic Analysis PURPOSE The traffic analysis component of the K-68 Corridor Management Plan incorporates information on the existing transportation network, such as traffic volumes and intersection
2011 Transportation Tomorrow Survey. Data Presentation
 2011 Transportation Tomorrow Survey Data Presentation Participating Agencies Conduct of the Survey Supporting Agencies of TTS Agency 1986 1991 1996 2001 2006 2011 Mininstry of Transportation, Ontario Y
2 BOLTON COMMUTER RAIL SERVICE FEASIBILITY STUDY
 2 BOLTON COMMUTER RAIL SERVICE FEASIBILITY STUDY The Planning and Economic Development Committee recommends the adoption of the recommendations contained in the following report dated April 15, 2011 from
Congestion Management Report
 Congestion Management Report F.E. EVERETT TURNPIKE (NORTH), MERRIMACK Segment Length: 7.0 miles Daily Traffic Volumes: 60,000-69,000 Analysis Period: May 2015 Number of Traffic Signals: 0 Number of travel
QUEEN ELIZABETH WAY / MARTINDALE ROAD BRIDGE DEMOLITION DETOUR ANALYSIS
 QUEEN ELIZABETH WAY / MARTINDALE ROAD BRIDGE DEMOLITION DETOUR ANALYSIS Fabio Saccon, P.Eng Area Traffic Manager Bernard James Engineer in Training Martin Sneep Senior Project Manager Lance Dutchak Traffic
APPENDIX 2 LAKESHORE ROAD TRANSPORTATION REVIEW STUDY EXECUTIVE SUMMARY
 APPENDIX 2 LAKESHORE ROAD TRANSPORTATION REVIEW STUDY EXECUTIVE SUMMARY Appendix 2 City of Mississauga Lakeshore Road FINAL REPORT Transportation Review Study December 2010 EXECUTIVE SUMMARY Study Purpose
Appendix 1 Transit Network Analysis
 Appendix 1 Transit Network Analysis APPENDIX 1 TRANSIT NETWORK ANALYSIS The purpose of this appendix is to provide an update on the transit network analysis as it pertains to: i. SmartTrack ii. Scarborough
Appendix PIT Pittsburgh, Pennsylvania 2003 Annual Report on Freeway Mobility and Reliability
 (http://mobility.tamu.edu/mmp) Office of Operations, Federal Highway Administration Appendix PIT Pittsburgh, Pennsylvania 2003 Annual Report on Freeway Mobility and Reliability This report is a supplement
TO\fH,:>-1 0 ::: 'l, Regional Clerk's Office
 YLgion I TO\fH,:>-1 0 ::: E 'l, Regional Clerk's Office A;..::S:_:T_G:::::":.!.W~I~L~l:'!IM~B~U~R!JYC..'.J Corporate Services Department March 27, 2015 Mr. Fernando Lamanna Town Clerk Town of East Gwillimbury
Appendix C. NORTH METRO STATION AREA TRAFFIC IMPACT STATEMENT 88th Avenue Station
 Appendix C NORTH METRO STATION AREA TRAFFIC IMPACT STATEMENT 88th Avenue Station Prepared for: Regional Transportation Department and URS Corporation as part of the North Metro EIS David Evans and Associates,
NO BUILD TRAFFIC OPERATIONS
 3. 23 NO BUILD TRAFFIC OPERATIONS This section addresses the operations of the transportation system and details how it would be expected to function under year 23 No Build conditions with the projected
4 Level of Service Results: HOV and Express Lanes
 4 Level of Service Results: HOV and Express Lanes Considering the importance of managed lanes (such as HOV and express lanes) in improving the overall performance of a corridor, Alameda CTC started monitoring
Transportation Master Plan Advisory Task Force
 Transportation Master Plan Advisory Task Force Draft Network Alternatives January 2016 INTRODUCTION Table of Contents Purpose 2 Linking major initiatives to key council approved plans 2 Disclaimer for
Traffic Congestion Management and Traffic Signal Coordination
 STAFF REPORT ACTION REQUIRED Traffic Congestion Management and Traffic Signal Coordination Date: April 30, 2013 To: From: Wards: Reference Number: Public Works and Infrastructure Committee General Manager,
8 PROPOSED ROUNDABOUT DUFFERIN STREET AND KING VAUGHAN ROAD INTERSECTION CITY OF VAUGHAN
 8 PROPOSED ROUNDABOUT DUFFERIN STREET AND KING VAUGHAN ROAD INTERSECTION CITY OF VAUGHAN The Transportation Services Committee recommends the adoption of the recommendation contained in the following report
Public Event 1 Community Workshops
 Public Event 1 Community Workshops Nov. 24 & Dec. 3, 2016 Welcome Workshop Purpose We re looking to you for ideas and insights to help guide future transportation infrastructure planning in the Park Lawn
Durham Region TMP Durham Region Transportation Planning Model Documentation
 If this information is required in an accessible format, please contact 1-800-372-1102 ext. 3753 Background Report Durham Region Transportation Planning Model Documentation by IBI Group January 2018 Table
3 ROADWAYS 3.1 CMS ROADWAY NETWORK 3.2 TRAVEL-TIME-BASED PERFORMANCE MEASURES Roadway Travel Time Measures
 ROADWAYS Approximately 6 million trips are made in the Boston metropolitan region every day. The vast majority of these trips (80 to percent, depending on trip type) involve the use of the roadway network
NEW YORK CENTRAL PARK SUBDIVISION BLAIS STREET/ST-PIERRE STREET EMBRUN, ONTARIO TRAFFIC IMPACT STUDY. Prepared for:
 NEW YORK CENTRAL PARK SUBDIVISION BLAIS STREET/ST-PIERRE STREET EMBRUN, ONTARIO TRAFFIC IMPACT STUDY Prepared for: Solidex Holdings Limited & Investissement Maurice Lemieux Investments Attn: Mr. Anthony
APPENDIX F SUPPLEMENTAL TRAFFIC DATA
 APPENDIX F SUPPLEMENTAL TRAFFIC DATA Environmental and Planning Consultants 440 Park Avenue South 7th Floor New York, NY 10016 tel: 212 696-0670 fax: 212 213-3191 www.akrf.com Draft Memorandum To: Michael
3. EXISTING TRANSPORTATION CONDITIONS
 3. EXISTING TRANSPORTATION CONDITIONS Eglinton Avenue spans 35 kilometres across the centre of Toronto, from Kingston Road near Lake Ontario in the east to the Pearson Airport in the west. The corridor
Maryland State Highway Mobility Report. Morteza Tadayon
 Maryland State Highway Mobility Report Morteza Tadayon Background Mobility is a Key Performance Area (KPA) in the SHA Business Plan SHA adopts a performance based approach Monitors Highway System to identify
Transportation Impacts: Toronto York Spadina Subway Extension
 STAFF REPORT ACTION REQUIRED Transportation Impacts: Toronto York Spadina Subway Extension Date: June 6, 2011 To: From: Wards: Reference Number: North York Community Council Director, Transportation Services
WEST AND SOUTH WEST RING ROAD DOWNSTREAM TRAFFIC IMPACTS
 Page 1 of 9 EXECUTIVE SUMMARY Alberta Transportation ( AT ) is preparing to construct the final sections of the Calgary Ring Road. This includes the South West Ring Road ( SWRR ) (from Lott Creek Blvd
Transportation Master Plan Advisory Task Force
 Transportation Master Plan Advisory Task Force Network Alternatives & Phasing Strategy February 2016 BACKGROUND Table of Contents BACKGROUND Purpose & Introduction 2 Linking the TMP to Key Council Approved
South King County High-Capacity Transit Corridor Study
 HIGH-CAPACITY TRANSIT CORRIDOR STUDY South King County Corridor South King County High-Capacity Transit Corridor Study Corridor Report August 2014 South King County High Capacity Transit Corridor Report
Revised Draft 2017 Development Charge Background Study and Bylaw
 Revised Draft 2017 Development Charge Background Study and Bylaw Presentation to Regional Council Paul Jankowski, Commissioner of Transportation Services March 23, 2017 1 Touchpoints with Council in the
Institute of Transportation Engineers
 Institute of Transportation Engineers May 1, 2015 Title Date AGENDA 1. 1. Games Overview 2. Transportation Planning Overview 2. Transportation 3. Games Route Network Planning Overview 4. Plan Ahead 3.
Appendix B: Forecasting and Traffic Operations Analysis Framework Document
 Existing Conditions Report - Appendix Appendix B: Forecasting and Traffic Operations Analysis Framework Document This document defines the methodology and assumptions that will be used in the traffic forecasting
Appendix MSP Minneapolis-St. Paul, Minnesota 2003 Annual Report on Freeway Mobility and Reliability
 (http://mobility.tamu.edu/mmp) Office of Operations, Federal Highway Administration Appendix MSP Minneapolis-St. Paul, Minnesota 2003 Annual Report on Freeway Mobility and Reliability This report is a
Glenn Avenue Corridor Traffic Operational Evaluation
 Glenn Avenue Corridor Traffic Operational Evaluation PREPARED FOR: THE CITY OF AUBURN PREPARED BY: DECEMBER 2007 Glenn Avenue Corridor Study--Auburn, Alabama TABLE OF CONTENTS Introduction... 1 Background
2136 And 2148 Trafalgar Road Townhouse Development Traffic Brief. Paradigm Transportation Solutions Limited
 2136 And 2148 Trafalgar Road Townhouse Development Traffic Brief Paradigm Transportation Solutions Limited March 217 March 217 Project: 1627 Diana Vlasic, M.C.I.P., R.P.P Metropolitan Consulting 445 Paletta
Subject: Solberg Avenue / I-229 Grade Separation: Traffic Analysis
 MEMORANDUM Transportation Bill Troe, AICP Jason Carbee, AICP 12120 Shamrock Plaza Suite 300 Omaha, NE 68154 (402) 334-8181 (402) 334-1984 (Fax) To: Project File Date: Subject: Solberg Avenue / I-229 Grade
Toronto and East York Community Council. Director, Transportation Services, Toronto and East York District
 No Turn on Red Regulations STAFF REPORT ACTION REQUIRED Date: June 1, 2010 To: From: Toronto and East York Community Council Director, Transportation Services, Toronto and East York District Wards: Trinity
Simulating Street-Running LRT Terminus Station Options in Dense Urban Environments Shaumik Pal, Rajat Parashar and Michael Meyer
 Simulating Street-Running LRT Terminus Station Options in Dense Urban Environments Shaumik Pal, Rajat Parashar and Michael Meyer Abstract The Exposition Corridor transit project is a light rail project
Project Details and Summary Sheets
 Background Report Project Details and Summary Sheets York Region Transportation Master Plan by IBI Group October 2016 Table of Contents 1 Introduction... 1 2 Project Details and Summary Sheets... 2 2.1
UBC Vancouver Transportation Status Report Fall 2014
 UBC Vancouver Transportation Status Report Fall 2014 July 2015 1. Introduction... 1 1.1. Context... 1 1.2. Transportation Monitoring Program... 2 1.3. Changes at UBC Affecting Travel Patterns... 4 1.4.
TRAFFIC IMPACT STUDY COMPREHENSIVE UPDATE TOWN OF THOMPSON S STATION, TENNESSEE PREPARED FOR: THE TOWN OF THOMPSON S STATION
 TRAFFIC IMPACT STUDY COMPREHENSIVE UPDATE TOWN OF THOMPSON S STATION, TENNESSEE PREPARED FOR: THE TOWN OF THOMPSON S STATION Transportation Consultants, LLC 1101 17 TH AVENUE SOUTH NASHVILLE, TN 37212
Southwest Bus Rapid Transit (SW BRT) Functional Planning Study - Executive Summary January 19 LPT ATTACHMENT 2.
 Functional Planning Study - Executive Summary January 19 LPT ATTACHMENT 2.") Southwest Bus Rapid Transit (SW BRT) Functional Planning Study - Executive Summary 2011 January 19 1 of 19 Introduction This executive summary presents the results of the Southwest Bus Rapid Transit (SW
Southwest Bus Rapid Transit (SW BRT) Functional Planning Study - Executive Summary 2011 January 19 1 of 19 Introduction This executive summary presents the results of the Southwest Bus Rapid Transit (SW
Chapter 16: Traffic and Parking A. INTRODUCTION
 Chapter 6: Traffic and Parking A. ITRODUCTIO This chapter examines the potential traffic and parking impacts of the proposed Fresh Kills Park roads. The analysis of transit and pedestrians is presented
OTTAWA TRAIN YARDS PHASE 3 DEVELOPMENT CITY OF OTTAWA TRANSPORTATION IMPACT STUDY. Prepared for:
 OTTAWA TRAIN YARDS PHASE 3 DEVELOPMENT CITY OF OTTAWA TRANSPORTATION IMPACT STUDY Prepared for: The Ottawa Train Yards Inc. 223 Colonnade Road South, Suite 212 Nepean, Ontario K2E 7K3 January 17, 2012
Premier Gateway West Scoped Area Transportation Study Interim Report (Secondary Plan) Paradigm Transportation Solutions Limited
 Paradigm Transportation Solutions Limited") Premier Gateway West Scoped Area Transportation Study Interim Report (Secondary Plan) Paradigm Transportation Solutions Limited April 2018 Project Summary Project Number 170050 April 2018 Client Town
Premier Gateway West Scoped Area Transportation Study Interim Report (Secondary Plan) Paradigm Transportation Solutions Limited April 2018 Project Summary Project Number 170050 April 2018 Client Town
DON MILLS-EGLINTON Mobility Hub Profile
 Mobility Hub Profile Dundas Don Mills-Eglinton West-Bloor Anchor Hub Gateway Hub N MOBILITY HUBS: Places of connectivity between regional and rapid transit services, where different modes of transportation
CITY OF HAMILTON PLANNING AND ECONOMIC DEVELOPMENT DEPARTMENT Transportation Planning and Parking Division
 CITY OF HAMILTON PLANNING AND ECONOMIC DEVELOPMENT DEPARTMENT Transportation Planning and Parking Division TO: Chair and Members Public Works Committee COMMITTEE DATE: June 18, 2018 SUBJECT/REPORT NO:
NEWMARKET CENTRE Mobility Hub Profile
 Mobility Hub Profile Dundas Newmarket West-Bloor Centre Anchor Hub Gateway Hub N MOBILITY HUBS: Places of connectivity between regional and rapid transit services, where different modes of transportation
Walmart (Store # ) 60 th Street North and Marion Road Sioux Falls, South Dakota
 60 th Street North and Marion Road Sioux Falls, South Dakota") Walmart (Store #4865-00) 60 th Street North and Marion Road Sioux Falls, South Dakota Prepared for: Wal-Mart Stores, Inc. Bentonville, Arkansas Prepared by: Kimley-Horn and Associates, Inc. ã2013 Kimley-Horn
Walmart (Store #4865-00) 60 th Street North and Marion Road Sioux Falls, South Dakota Prepared for: Wal-Mart Stores, Inc. Bentonville, Arkansas Prepared by: Kimley-Horn and Associates, Inc. ã2013 Kimley-Horn
Appendix SEA Seattle, Washington 2003 Annual Report on Freeway Mobility and Reliability
 (http://mobility.tamu.edu/mmp) Office of Operations, Federal Highway Administration Appendix SEA Seattle, Washington 2003 Annual Report on Freeway Mobility and Reliability This report is a supplement to:
HIGHWAY 401 WIDENING SECOND LINE WEST STRUCTURE
 HIGHWAY 401 WIDENING SECOND LINE WEST STRUCTURE Public Meeting November 16, 2011 OVERVIEW BACKGROUND DISCUSSION ITEMS TRAFFIC ANALYSIS CYCLIST / PEDESTRIAN CONNECTION BACKGROUND February 1982 Ministry
Route 7 Corridor Study
 Route 7 Corridor Study Executive Summary Study Area The following report analyzes a segment of the Virginia State Route 7 corridor. The corridor study area, spanning over 5 miles in length, is a multi
Appendix LOU Louisville, Kentucky 2003 Annual Report on Freeway Mobility and Reliability
 (http://mobility.tamu.edu/mmp) Office of Operations, Federal Highway Administration Appendix LOU Louisville, Kentucky 2003 Annual Report on Freeway Mobility and Reliability This report is a supplement
VIVA RETIREMENT COMMUNITIES OAKVILLE TRAFFIC IMPACT STUDY
 VIVA RETIREMENT COMMUNITIES OAKVILLE TRAFFIC IMPACT STUDY VIVA RETIREMENT COMMUNITIES OAKVILLE TRAFFIC IMPACT STUDY DECEMBER 2012 READ, VOORHEES & ASSOCIATES TORONTO, ONTARIO Read, Voorhees & Associates
Santa Clara I-280 CORRIDOR STUDY
 Santa Clara I-280 CORRIDOR STUDY OCTOBER 2017 PREPARED BY: 1.1 Background The I-280 Corridor Study within Santa Clara County is a high-level highway planning study led by the Santa Clara VTA, in partnership
Highway 217 Corridor Study. Phase I Overview Report
 Highway 217 Corridor Study Phase I Overview Report November 3, 24 BACKGROUND AND OVERVIEW Study purpose The Highway 217 Corridor Study is developing multi-modal transportation solutions for traffic problems
Evaluation and Changes to Pedestrian Priority Phase Signal (Scramble Crossing) at Bay Street and Bloor Street
 at Bay Street and Bloor Street") PW2.2 STAFF REPORT ACTION REQUIRED Evaluation and Changes to Pedestrian Priority Phase Signal (Scramble Crossing) at Bay Street and Bloor Street Date: February 12, 2015 To: From: Public Works and Infrastructure
PW2.2 STAFF REPORT ACTION REQUIRED Evaluation and Changes to Pedestrian Priority Phase Signal (Scramble Crossing) at Bay Street and Bloor Street Date: February 12, 2015 To: From: Public Works and Infrastructure
2. AJAX TODAY: EXISTING TRANSPORTATION CONDITIONS
 2. AJAX TODAY: EXISTING TRANSPORTATION CONDITIONS 2.1 Socio-Economic Profile The 2011 Census of Canada reported a population of approximately 110,000 people in the Town of Ajax, which represents an increase
Congestion Management Report
 Congestion Management Report NH 101A (Amherst St and Canal/Bridge St), NASHUA Segment Length: 2.7 miles Daily Traffic Volumes: 9,000-40,000 Analysis Period: August 2015 Number of Traffic Signals: 9 Number
Public Works and Infrastructure Committee. General Manager, Transportation Services. P:\2016\Cluster B\TRA\TIM\pw16009tim.docx
 Ten Year Cycling Network Plan Date: May 3, 2016 STAFF REPORT ACTION REQUIRED PW13.11 To: From: Wards: Reference Number: Public Works and Infrastructure Committee General Manager, Transportation Services
Purpose and Need. Chapter Introduction. 2.2 Project Purpose and Need Project Purpose Project Need
 Chapter 2 Purpose and Need 2.1 Introduction The El Camino Real Bus Rapid Transit (BRT) Project (Project) would make transit and other transportation improvements along a 17.6-mile segment of the El Camino
Traffic Circulation Study for Neighborhood Southwest of Mockingbird Lane and Airline Road, Highland Park, Texas
 ARIZONA TEXAS NEW MEXICO OKLAHOMA February 13, 2015 Mr. Meran Dadgostar P.E., R.S. Town of Highland Park 4700 Drexel Dr. Highland Park, Texas 75205 Re: Traffic Circulation Study for Neighborhood Southwest
7.0 FREEWAYS CONGESTION HOT SPOT PROBLEM & IMPROVEMENT PROJECT ANALYSIS & DEFINITION
 7.0 FREEWAYS CONGESTION HOT SPOT PROBLEM & IMPROVEMENT PROJECT ANALYSIS & DEFINITION 7.1 INTRODUCTION & METHODOLOGY FEASIBILITY REPORT Congestion hot spot problem locations have been assessed using the
Appendix ELP El Paso, Texas 2003 Annual Report on Freeway Mobility and Reliability
 (http://mobility.tamu.edu/mmp) Office of Operations, Federal Highway Administration Appendix ELP El Paso, Texas 2003 Annual Report on Freeway Mobility and Reliability This report is a supplement to: Monitoring
U NIVERSITY OF B RITISH C OLUMBIA. Fall 2010 Transportation Status Report
 U NIVERSITY OF B RITISH C OLUMBIA Fall 2010 Transportation Status Report 1 April 2011 U NIVERSITY OF B RITISH C OLUMBIA Fall 2010 Transportation Status Report Contents 1. INTRODUCTION... 1 1.1. Context...
Discussion Paper 1 June 2014 Current State of Transportation in Burlington
 Discussion Paper 1 June 2014 Current State of Transportation in Burlington www.burlington.ca/goyourway Discussion Paper 1: Current State of Transportation in Burlington The City of Burlington is developing
Mayfield West Phase 2 Stage 2 Transportation Assessment. Town of Caledon. Paradigm Transportation Solutions Limited
 Mayfield West Phase 2 Stage 2 Transportation Assessment Town of Caledon Paradigm Transportation Solutions Limited January 2018 Project Summary Project Number 180001 January 2018 Client Town of Caledon
Operational Comparison of Transit Signal Priority Strategies
 Operational Comparison of Transit Signal Priority Strategies Revision Submitted on: November, 0 Author: Adriana Rodriguez, E.I Assistant Engineer Parsons Brinckerhoff 0 South Orange Avenue, Suite 00 Orlando,
APPENDIXB. Traffic Operations Technical Memorandum
 APPENDIXB Traffic Operations Technical Memorandum Environmental Assessment - Lincoln County, SD 85 th Street: Sundowner Avenue to Louise Avenue November 2017 MEMORANDUM Transportation Jim Kollbaum, PE
DUNBOW ROAD FUNCTIONAL PLANNING
 DUNBOW ROAD FUNCTIONAL PLANNING Final Report August 3, 216 #31, 316 5th Avenue NE Calgary, AB T2A 6K4 Phone: 43.273.91 Fax: 43.273.344 wattconsultinggroup.com Dunbow Road Functional Planning Final Report
MEMORANDUM. Charlotte Fleetwood, Transportation Planner
 MEMORANDUM Date: Updated August 22, 2017 To: Organization: Charlotte Fleetwood, Transportation Planner Boston Transportation Department From: Jason DeGray, P.E., PTOE, Regional Director of Engineering
4. ENVIRONMENTAL IMPACT ANALYSIS 9. TRANSPORTATION AND TRAFFIC
 4. ENVIRONMENTAL IMPACT ANALYSIS 9. TRANSPORTATION AND TRAFFIC 4.9.1 INTRODUCTION The following section addresses the Proposed Project s impact on transportation and traffic based on the Traffic Study
Using GPS Data for Arterial Mobility Performance Measures
 Using GPS Data for Arterial Mobility Performance Measures Paul Czech, MnDOT Shawn Turner, TTI CTS Research Conference May 22, 2014 ~ St. Paul, MN Methodology & Results INRIX GPS Data + = Road Inventory
Complete Street Analysis of a Road Diet: Orange Grove Boulevard, Pasadena, CA
 Complete Street Analysis of a Road Diet: Orange Grove Boulevard, Pasadena, CA Aaron Elias, Bill Cisco Abstract As part of evaluating the feasibility of a road diet on Orange Grove Boulevard in Pasadena,
DRAFT. Memo. Range of the Alternatives Considered in the EIS
 Memo Date: Friday, December 09, 2016 Project: To: From: Subject: State Route 30 EIS UDOT Vince Izzo This memorandum summarizes the draft State Route (S.R.) 30 Level 1 screening results. A more detailed
Corridor Advisory Group and Task Force Meeting #10. July 27, 2011
 Corridor Advisory Group and Task Force Meeting #10 July 27, 2011 1 Agenda Recap CAG/TF #9 Public Meeting #2 Summary Single Mode Alternatives Evaluation Results Next Steps 2 3 CAG/TF #9 Recap CAG /TF #9
5858 N COLLEGE, LLC N College Avenue Traffic Impact Study
 5858 N COLLEGE, LLC nue Traffic Impact Study August 22, 2016 Contents Traffic Impact Study Page Preparer Qualifications... 1 Introduction... 2 Existing Roadway Conditions... 5 Existing Traffic Conditions...
TABLE TRAFFIC ANALYSIS SCENARIOS
 4.11 TRANSPORTATION The potential traffic impacts of the proposed project are evaluated in the Buena Park Beach/Orangethorpe Mixed Use Project Traffic Analysis (Traffic Analysis) by Austin-Foust Associates
Intersection LOS Intersection level of service (LOS) is defined by the Highway Capacity Manual (HCM) by the following criteria:
 is defined by the Highway Capacity Manual (HCM) by the following criteria:") Page 2 of 9 Intersection LOS Intersection level of service (LOS) is defined by the Highway Capacity Manual (HCM) by the following criteria: Table 1 LOS Definitions Level of Signalized Un-Signalized Definition
Page 2 of 9 Intersection LOS Intersection level of service (LOS) is defined by the Highway Capacity Manual (HCM) by the following criteria: Table 1 LOS Definitions Level of Signalized Un-Signalized Definition
Northwest Corridor Project Interchange Modification, Interchange Justification and System Analysis Report Reassessment (Phase I)
") Northwest Corridor Project Interchange Modification, Interchange Justification and System Analysis Report Reassessment (Phase I) Introduction The Georgia Department of Transportation (GDOT) prepared a
Northwest Corridor Project Interchange Modification, Interchange Justification and System Analysis Report Reassessment (Phase I) Introduction The Georgia Department of Transportation (GDOT) prepared a
NORTH YORK CENTRE Mobility Hub Profile
 Mobility Hub Profile Dundas North York West-Bloor Centre Anchor Hub Gateway Hub N MOBILITY HUBS: Places of connectivity between regional and rapid transit services, where different modes of transportation
HILTON GARDEN INN HOTEL HOTEL EXPANSION 2400 ALERT ROAD, OTTAWA TRANSPORTATION BRIEF. Prepared for:
 HILTON GARDEN INN HOTEL HOTEL EXPANSION 2400 ALERT ROAD, OTTAWA TRANSPORTATION BRIEF Prepared for: Bona Building & Management Co. Ltd. Place Vanier, 333 North River Road Vanier, Ontario K1L 8B9 October
Planning Committee STAFF REPORT March 7, 2018 Page 2 of 4 The following MTSOs are being used across the five subregions: Intersection Level of Service
 Planning Committee STAFF REPORT Meeting Date: March 7, 2018 Subject Summary of Issues Recommendations Financial Implications Options Attachments Changes from Committee Review Draft 2017 Multimodal Transportation
Calgary Transit Route 302 Southeast BRT Year One Review June
 Calgary Transit Route 302 Southeast BRT Year One Review 2011 June Calgary Transit Route 302 Southeast BRT: Year One Review 2011 April Table of Contents 1.0 Executive Summary... 1 2.0 Introduction... 3
CHAPTER 8 APPLICATION AND INTERPRETATION OF CONGESTION MEASURES
 CHAPTER 8 APPLICATION AND INTERPRETATION OF CONGESTION MEASURES Chapter Summary The focus of this chapter is to provide the reader with practical applications and interpretation of the congestion measures
EXECUTIVE SUMMARY... vii 1 STUDY OVERVIEW Study Scope Study Area Study Objectives
 Contents EXECUTIVE SUMMARY... vii 1 STUDY OVERVIEW... 1-1 1.1 Study Scope... 1-1 1.2 Study Area... 1-1 1.3 Study Objectives... 1-3 2 EXISTING CONDITIONS... 2-1 2.1 Existing Freeway Conditions... 2-4 2.1.1
7 Yonge and Steeles Area Regional Transportation Study City of Markham and City of Vaughan
 Clause 7 in Report No. 17 of Committee of the Whole was adopted, without amendment, by the Council of The Regional Municipality of York at its meeting held on November 19, 2015. 7 Yonge and Steeles Area
Appendix J Transportation Master Plan Assessment
 Appendix J 2002 Transportation Master Plan Assessment York Region Transportation Master Plan October 2009 ASSESSMENT OF 2002 YORK REGION TMP ACTION PLAN A Background Report By Cansult Limited December