Freeway Performance Report 2015, 3 rd Quarter. Photo courtesy of
|
|
|
- Christian Chase
- 5 years ago
- Views:
Transcription
1 Freeway Performance Report 2015, 3 rd Quarter Photo courtesy of NDOT Facebook page 1
2 Table of contents 1. Title page 2. Table of Contents 3. Objective 4. Corridor Map 5. Performance Details Performance Narratives 6. Terms and Concept 7. I 15 NB, PM 8. I 515 / US 95 NB, AM 9. I 515 / US 95 NB, PM WB Beltway, AM WB Blt Beltway, PM 12. US 95 SB to I 15 SB, AM 13. US 95 SB to I 15 SB, PM EB to Eastern, PM EB from Eastern to I 515, PM 16. I 15 SB to I 215, AM 17. I 15 SB to I 215, PM Performance Tables and Graphs 18. Discussion 19. Color Descriptions 20. Congestion Duration tables, PM 23. Congestion Duration tables, AM 24. Delay per Congestion Event, PM 26. Delay per Congestion Event, AM 27. Days per Crash 29. Percent Change in Daily Avg Volume 33. Percent Change in Daily Avg Speed Thresholds and Buffer Index 37. Threshold discussion 38. Threshold table 39. Threshold attainment 42. Buffer Index 44. Next Report and Beyond Appendix 45. Seasons 2
3 Report Objective: Monitor, measure and understand all performance data that fully describes travel time reliability; use this information to address travel problems According to FHWA, travel time reliability is the consistency or dependability in travel times, asmeasured from day to day and/or across different times of the day 1. Our reliability efforts are currently the most developed in describing maximum delay experienced during a congestion event. This tells us whether a corridor s delay is predictable or an outlier. As we continue our reporting, reliability measurement and analysis will improve
4 Freeway Corridors evaluated for Performance 3 rd Quarter I 15 NB, PM 2. Southern Beltway WB, AM & PM 3. I 515 NB, AM & PM 4. US 95 SB to I 15 SB, AM & PM 5. I 15 SB, AM & PM 6. Southern Beltway EB to Eastern, PM 7. Southern Beltway EB to I 515, PM 2 Additional corridors will be included in future reports. Maroon arrows have AM & PM congestion; purple arrows have PM congestion only. 4
5 Performance Details Performance details are described with narratives and in tables & charts. Pages 6 to 17 contain the narrative information. Pages 18 to 33 display the tables and charts. Photo courtesy of Raymond Yu, Flickr
6 Terms and concepts used in narratives Seasonal coverage is from Early Summer 2013 through Summer 2015 for most subcorridors. This provides data for 14 seasons (four in 2013, six in 2014, and four, to date, in 2015). A description of seasons is provided on page 45. Congestionevents events are quantified using travel times posted onlasvegas area freeway signs. To qualify as a congestion event, the delays need to exceed three to five minutes depending on the subcorridor. More details on congestion events are described in the st Quarter Report. Current best practice in travel time reliability uses a Buffer Index (BI) to quantify this measure. BIs have been calculated and ranked using four quartiles: the upper two are for reliability worse than average, and the lower two are for better than average reliability. Page 3 provides more information onthe reliability concept. Pages 42and 43shows the BIs used in this report. Freeway incidents are classified as a crash or a bad crash. A crash has vehicles cleared from travel lanes in less than 30 minutes for property damage only or less than 60 minutes for crashes with injuries. If clearance time exceeds these values, the incident id is a bad bdcrash. The FAST Dashboard archives the crash data used to make these calculations. Weekly average volumes and speeds at select locations in the subcorridors are calculated for each season. Please contact FAST if you would like additional details on the data summarized for these performance reports. 6
7 PM: I 15 NB Congestion events normallybegin before 3 pm and lastuntil 530. Average maximum delay has been 12 minutes since 2014, despite an increase in volume of 16 percent. The 95 percentile delays during a month are usually 22 minutes. Despite being such a critical and prolific corridor, only five of the 14 seasons have unreliability in the upper percentiles. Effective traffic incident management is the key: although crashes occur almost every day, most of them are safely and quickly moved from the travel lanes. Once every 10 days, a bad crash occurs. Photo source: 7
8 Prior to the 215 widening between Warm Springs and I 15 that ended in 2013, AM WB delays occurred to the east of Eastern Avenue. Those delays have diminished, 215 wb 1 and the recurring congestion now occurs between Eastern and I 515. The tables and graphs in this report describe this newer congestion trends, using just the 2015 seasons. The 4 th Quarter performance report will contain Fall and Holiday 2015 data and provide additional analysis on this performance. AM: 215 WB Beltway Traffic volumes have increased significantly, rising by 25 percent between St Rose / Pecos and I 15. This is largely l due the beltway blt widening i project completed in Further to the west, volumes have increased by 15 percent at Decatur. Photo courtesy of Raymond Yu, Flickr 8
9 PM: 215 WB Beltway On all weekdays, delays are virtually guaranteed between 430 and 630 pm. During the past 12 months, the summer max average delay has been shorter (10 mins) than the other season delays (14 16 mins). Reliability on this corridor is the poorest in the valley, with most seasons being in the upper quartile of unreliable performance. Photo courtesy of Raymond Yu, Flickr 9
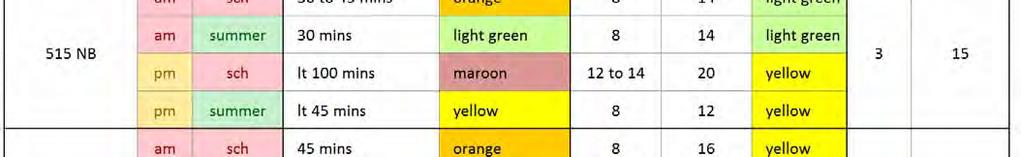
10 AM: I 515 / US 95 NB Am 515 / 95 nb y Congestion event duration has consistently been in the 30 to 60 minute range. During school seasons, congestion occurs on most work days as opposed to only two or three days during summer. Delays begin around 730 and end before 830. Average max delay has held steady at eight minutes, and reliability is good with only two of 14 seasons falling in the highest quartile. Five of the past seven seasons have hd had better than average reliability. Crashes on this subcorridor occur every three days on average, and bad crashes occur once or twice a month. Average weekly volume growth has been 17 percent. Photo courtesy of Raymond Yu, Flickr 10
11 PM: I 515 / US 95 NB Congestion events during the summer are half as long as those during other seasons (1 hr vs 2 + hrs). The longer events begin by 330 and end before 6 pm. With school in session, delays occur Mon Fri; during summer and other long vacation periods, noticeable delays may occur only three days a week. Maximum average delays range from 10 to 14 minutes. The corridor is unreliable compared with the rest of the valley, with four of the past six seasons falling in the upper quartiles. Many of the crashes that contribute to this problem occur between Charleston and Eastern. Photo courtesy of Raymond Yu, Flickr 11
12 Summer and holiday season congestion events are shorter than other seasons. In 2015, the schoolbased seasons experienced congestion every weekday that lasted 90 minutes noticeably longer than in previous years. This corridor displays an increasing trend of delay. In 2013, the average max delay was six minutes, in 2014 it ranged between 8 to 10 minutes, and in 2015 it has consistently been 12 minutes. Between mid 2013 through summer 2014 reliability was the best in the valley. With increased volumes, reliability is still good, but has worsened slightly. Crashes are frequent every other day or more but are cleared relatively quickly as shown by the reliability values. Volume increases are 12 percent on 95 at Rancho. AM: US 95 SB to I 15 SB Photo courtesy of Raymond Yu, Flickr 12
13 Summer congestion, as with the AM period, is lighter than when school is in session. Delay patterns since the end of F Street construction begin earlier in the afternoon. The average max delay has held steady since mid The reliability trend is average for the valley, although the Summer 2015 period was the most unreliable one for the corridor during the past year. PM: US 95 SB to I 15 SB Photo courtesy of Raymond Yu, Flickr 13
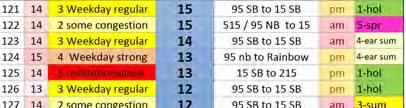
14 In 2015, following F Street construction, congestion event duration between Washington and Sahara has been 90 minutes and occurred every weekday and some Saturdays. Average maximum delay has been 12 minutes and the corridor has been moderately unreliable. Crashes normally occur every other day and bad crashes occur, on average, once a week. Volume growth is 25 percent at Lake Mead Blvd and 18 percent between Flamingo and Tropicana. AM: I 15 SB Photo source: vegas/2 crashes causingmajor traffic delays i 15 and sahara 14
15 Since Spring 2015, PM congestion events have consistently lasted between 2:45 and 4 PM. Most days, including Saturdays, experience congestion during these timeframes. Summer 2015 showed a noticeable increase in maximum average delay, from 10 to 14 minutes. Reliability also took a hit, with more frequent unreliable events and a 95 percentile maximum delay of 24 minutes (up from 15 minutes). Photo source Cheryl Snow PM: I 15 SB 15
16 Congestion events are a regular Monday through Friday occurrence, and the duration now exceeds an hour each day. The max average delay has increased to eight minutes since early 2015, and summer 2015 had the worst reliability, some of the valley s worst in eb at windmill Congestion is caused by capacity reduction at Windmill. Fall 2015 will show increased dl delays through h the Airport Connector and Warm Springs area due to construction. ti Incidents have been relatively infrequent, averaging just over one per week for crashes and three per month for bad crashes. Volumes between Airport Connector and Eastern are 30 percent higher than prior to the 2013 widening. Photo courtesy of Raymond Yu, Flickr PM: 215 EB to Eastern 16
17 Congestion events used to occur almost daily in this subcorridor, but now traffic is metered by the delays further to the west and events occur a few times per week. There is a lot of on ramp traffic at Pecos / St Rose that contributes to a slow weave between that ramp and Green Valley Parkway. 215 eb at 515 Five of the past eight seasons have had very high unreliability, mainly due to crashes between Stephanie and I 515. The max average delay has held steady at six minutes. Crashes occur once a week or so, and bad crashes normally occur once per month. Even though crashes are relatively infrequent and most cleared within criteria, the beltway still experiences some of the highest levels of unreliability. Despite no capacity increases, growth has been 20 percent. PM: 215 EB, from Eastern to 515 Photo courtesy of Raymond Yu, Flickr 17
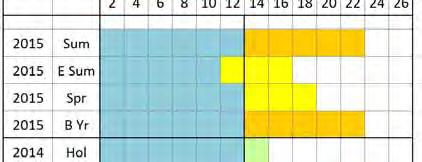
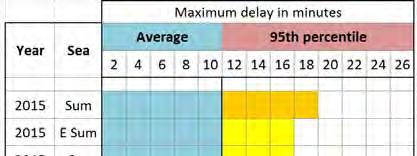
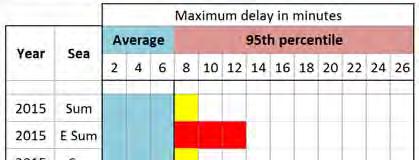
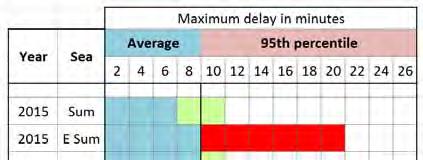
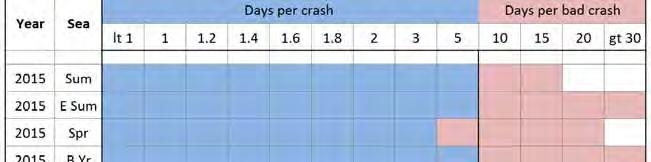
18 Performance Tables and Graphs Pages 20 through 23 display average duration by season of congestion events. The color of each bar is described on the next slide. Pages 24 through 26 display the average maximum delay and 95 th percentile maximum delay for each season. Pages 27 and 28 display the number of days between each crash and bad crash. Pages 29 through 36 show the changes in weekly average volume and speed. Photo from 18
19 Color Descriptions Congestion Duration the bar color shows which days normally experience peak period congestion Red: Weekdays and sometimes on Saturdays and Sundays Maroon: Weekdays Orange: Monday through Thursday Yellow: Tuesday through Thursday Light Green: two or fewer events per week Congestion Delay, 95 th percentile Red: most unreliable Orange: moderately unreliable Yellow: moderately reliable Light Green: most reliable 19


20 Congestion Duration tables (PM congestion) I 15 NB I 515 NB 20


21 Congestion Duration tables cont.(pm congestion) 215 Beltway Blt WB US 95 SB to I 15 SB 21


22 Congestion Duration tables cont. (PM congestion) I 15 SB to 215 at Eastern 215 EB to I 515 I 15 SB to 215 Beltway 22


23 Congestion Duration tables (AM congestion) I 515 NB 215 Beltway WB (between 515 & Eastern) US 95 SB to I 15 SB I 15 SB to 215 Beltway 23


24 Maximum Congestion Delay per event (PM Average and 95 th Percentile) I 15 NB I 515 NB 215 Beltway WB 24


25 Maximum Congestion Delay per event cont. (PM Average and 95 th Percentile) US 95 SB to I 15 SB I 15 SB to 215 at Eastern 215 EB to I 515 I 15 SB to 215 Beltway 25


26 Maximum Congestion Delay per event (AM Average and 95 th Percentile) 215 Beltway WB I 515 NB US 95 SB to I 15 SB I 15 SB to 215 Beltway 26


27 Days per crash I 15 NB I 515 NB 215 Beltway WB US 95 SB to I 15 SB 27


28 Days per crash cont. I 15 SB to 215 at Eastern 215 EB to I 515 I 15 SB to 215 Beltway 28


 I")
29 Percent Change in Daily Average Volume Compare season s value with previous year (e.g. Spr 15 vs Spr 14) I 15 NB I 515 NB Volumes in 000s 29


30 Percent Change in Daily Average Volume cont. 215 Beltway WB Volumes in 000s US 95 SB to I 15 SB 30


31 Percent Change in Daily Average Volume cont. I 15 SB to 215 at Eastern Volumes in 000s 215 EB to I


32 Percent Change in Daily Average Volume cont. Volumes in 000s I 15 SB to 215 Beltway 32


33 Percent Change in Daily Average Speed Compare season s value with previous year (e.g. Spr 15 with Spr 14) I 15 NB I 515 NB 33


34 Percent Change in Daily Average Speed cont. 215 Blt Beltway WB US 95 SB to I 15 SB US 95 SB to I 15 SB 34


35 Percent Change in Daily Average Speed cont. I 15 SB to 215 at Eastern 215 EB to I


36 Percent Change in Daily Average Speed cont. I 15 SB to 215 Beltway 36
37 Thresholds In late 2014, the FHWA Office of Transportation Performance Management (TPM) launched a technical assistance program that will provide a variety of products related to performance management. FAST is part of the stakeholder group advising on this effort. These materials will help shape the performance reporting for the Las Vegas area freeways. Draft documents from this report define target setting g as a data driven, collaborative process. It makes the link between investment decisions and performance expectations transparent for all stakeholders. The nd Quarter Report introduced the concept of Performance Thresholds which is our initial step in moving towards our TPM program and effective target setting. In this report we summarize thresholds identifiedinin previous reports and identify whether they were met (green yes) or not (red no). Additional analysis will be available in future reports. 37


38 Threshold Summary 38
39 Threshold Attainment 39
40 Threshold Attainment (cont) 40
41 Comments on Threshold results Thresholds were developed based on historical performance between mid 2013 and March Subsequent performance is compared against thesevalues to establish initial performance trends. Performance in Spring, Early Summer and Summer 2015 seasons has been compared to the thresholds. If performance has lessdelay or lower crash frequency, the threshold is met and receives a yes. More analysis will occur in future reports. 41

")


42 Buffer Index (most unreliable and unreliable tiers) TheBuffer Index (BI), expressed asa a percent, is the extra time added to a trip to reasonably assure an on time arrival. Higher BIs mean the corridor is less reliable. 42


 43")


43 Buffer Index (reliable and most reliable tiers) 43
44 The next report & beyond will highlight thefall and holiday seasons. The 2015 fall fllseason, based on anecdotal observation, has featured the highest volumes and dl delays we have seen since we began tracking the data at this level. 44
45 Seasons: Based on review of several years of traffic volumes and patterns from ITS data, FAST arranges performance analysis as shown below. There are six seasons per year; details on the most recent seasons are shown. 45
Appendix SEA Seattle, Washington 2003 Annual Report on Freeway Mobility and Reliability
 (http://mobility.tamu.edu/mmp) Office of Operations, Federal Highway Administration Appendix SEA Seattle, Washington 2003 Annual Report on Freeway Mobility and Reliability This report is a supplement to:
Appendix MSP Minneapolis-St. Paul, Minnesota 2003 Annual Report on Freeway Mobility and Reliability
 (http://mobility.tamu.edu/mmp) Office of Operations, Federal Highway Administration Appendix MSP Minneapolis-St. Paul, Minnesota 2003 Annual Report on Freeway Mobility and Reliability This report is a
Appendix PIT Pittsburgh, Pennsylvania 2003 Annual Report on Freeway Mobility and Reliability
 (http://mobility.tamu.edu/mmp) Office of Operations, Federal Highway Administration Appendix PIT Pittsburgh, Pennsylvania 2003 Annual Report on Freeway Mobility and Reliability This report is a supplement
Appendix PDX Portland, Oregon 2003 Annual Report on Freeway Mobility and Reliability
 (http://mobility.tamu.edu/mmp) Office of Operations, Federal Highway Administration Appendix PDX Portland, Oregon 2003 Annual Report on Freeway Mobility and Reliability This report is a supplement to:
Appendix LOU Louisville, Kentucky 2003 Annual Report on Freeway Mobility and Reliability
 (http://mobility.tamu.edu/mmp) Office of Operations, Federal Highway Administration Appendix LOU Louisville, Kentucky 2003 Annual Report on Freeway Mobility and Reliability This report is a supplement
Appendix ELP El Paso, Texas 2003 Annual Report on Freeway Mobility and Reliability
 (http://mobility.tamu.edu/mmp) Office of Operations, Federal Highway Administration Appendix ELP El Paso, Texas 2003 Annual Report on Freeway Mobility and Reliability This report is a supplement to: Monitoring
KC Scout Kansas City s Bi-State Transportation Management Center
 KC Scout Kansas City s Bi-State Transportation Management Center Operations Report August- 215 This report contains statistical and operational data of activities at the Scout TMC for the period Saturday,
Maryland State Highway Mobility Report. Morteza Tadayon
 Maryland State Highway Mobility Report Morteza Tadayon Background Mobility is a Key Performance Area (KPA) in the SHA Business Plan SHA adopts a performance based approach Monitors Highway System to identify
7.0 FREEWAYS CONGESTION HOT SPOT PROBLEM & IMPROVEMENT PROJECT ANALYSIS & DEFINITION
 7.0 FREEWAYS CONGESTION HOT SPOT PROBLEM & IMPROVEMENT PROJECT ANALYSIS & DEFINITION 7.1 INTRODUCTION & METHODOLOGY FEASIBILITY REPORT Congestion hot spot problem locations have been assessed using the
Concurrent Monitoring, Analysis, and Visualization of Freeway and Arterial Performance for Recurring and Non-recurring Congestion
 Concurrent Monitoring, Analysis, and Visualization of Freeway and Arterial Performance for Recurring and Non-recurring Congestion For Presentation at the NATMEC 2010 Session on: Congestion Monitoring and
KC Scout Kansas City s Bi-State Transportation Management Center
 KC Scout Kansas City s Bi-State Transportation Management Center Operations Report May 216 This report contains statistical and operational data of activities at the Scout TMC for the period Sunday, May
ICM Monthly Performance Measures
 March 219 ICM Monthly Performance Measures DISTRICT 5 Table of Contents Incident Spotlight... 1 SunGuide Incident Clearance Time............ 2 Road Ranger Program........ 3 Secondary Crashes........ 4
National Capital Region Congestion Report
 NATIONAL CAPITAL REGION TRANSPORTATION PLANNING BOARD National Capital Region Congestion Report 2nd Quarter 2015 Metropolitan Washington Council of Governments 777 North Capitol Street, N.E., Suite 300,
Enclosure 1. Crimson Drive Traffic Safety and Calming Review Report
 Enclosure 1 Crimson Drive Traffic Safety and Calming Review Report Prepared by: Tahir Hameed, P.Eng. Traffic Safety Engineer Planning Engineering and Safety Transportation Planning and Engineering Date:
MEASUREMENT OF RECURRING VERSUS NON-RECURRING CONGESTION
 Final Report Research Project T2695, Task 36 Congestion Measurement MEASUREMENT OF RECURRING VERSUS NON-RECURRING CONGESTION by John M. Ishimaru Senior Research Engineer Mark E. Hallenbeck Director Jennifer
Mid-Hudson Valley TMA Travel Time Survey
 Mid-Hudson Valley TMA Travel Time Survey Draft Report August 2011 Prepared For: Mid-Hudson Valley Transportation Management Area (TMA) Prepared By: Traffic & Transportation Consultants Two Penn Plaza,
Chapter 4 Traffic Analysis
 Chapter 4 Traffic Analysis PURPOSE The traffic analysis component of the K-68 Corridor Management Plan incorporates information on the existing transportation network, such as traffic volumes and intersection
MEMORANDUM. Charlotte Fleetwood, Transportation Planner
 MEMORANDUM Date: Updated August 22, 2017 To: Organization: Charlotte Fleetwood, Transportation Planner Boston Transportation Department From: Jason DeGray, P.E., PTOE, Regional Director of Engineering
CONGESTION REPORT 4 th Quarter 2016
 CONGESTION REPORT 4 th Quarter 2016 A quarterly update of the National Capital Region s traffic congestion, travel time reliability, top-10 bottlenecks and featured spotlight January 16, 2018 ABOUT TPB
Understanding Rail and Bus Ridership
 Finance Committee Information Item III-A October 12, 2017 Understanding Rail and Bus Ridership Washington Metropolitan Area Transit Authority Board Action/Information Summary Action Information MEAD Number:
National Capital Region Congestion Report
 NATIONAL CAPITAL REGION TRANSPORTATION PLANNING BOARD National Capital Region Congestion Report 4th Quarter 2015 Metropolitan Washington Council of Governments 777 North Capitol Street, N.E., Suite 300,
Intersection LOS Intersection level of service (LOS) is defined by the Highway Capacity Manual (HCM) by the following criteria:
 is defined by the Highway Capacity Manual (HCM) by the following criteria:") Page 2 of 9 Intersection LOS Intersection level of service (LOS) is defined by the Highway Capacity Manual (HCM) by the following criteria: Table 1 LOS Definitions Level of Signalized Un-Signalized Definition
Page 2 of 9 Intersection LOS Intersection level of service (LOS) is defined by the Highway Capacity Manual (HCM) by the following criteria: Table 1 LOS Definitions Level of Signalized Un-Signalized Definition
Planning Daily Work Trip under Congested Abuja Keffi Road Corridor
 ISBN 978-93-84468-19-4 Proceedings of International Conference on Transportation and Civil Engineering (ICTCE'15) London, March 21-22, 2015, pp. 43-47 Planning Daily Work Trip under Congested Abuja Keffi
FINAL DESIGN TRAFFIC TECHNICAL MEMORANDUM
 FINAL DESIGN TRAFFIC TECHNICAL MEMORANDUM July 2014 FINAL (SR 43) Project Development and Environment Study From State Road 60 (Adamo Drive) to I-4 (SR 400) Hillsborough County, Florida Work Program Item
Los Angeles Congested Corridor Study and Comparisons with Texas Transportation Institute Congestion Estimates
 Proceedings of the 2013 Industrial and Systems Engineering Research Conference A. Krishnamurthy and W.K.V. Chan, eds. Los Angeles Congested Corridor Study and Comparisons with Texas Transportation Institute
Glenn Avenue Corridor Traffic Operational Evaluation
 Glenn Avenue Corridor Traffic Operational Evaluation PREPARED FOR: THE CITY OF AUBURN PREPARED BY: DECEMBER 2007 Glenn Avenue Corridor Study--Auburn, Alabama TABLE OF CONTENTS Introduction... 1 Background
3 ROADWAYS 3.1 CMS ROADWAY NETWORK 3.2 TRAVEL-TIME-BASED PERFORMANCE MEASURES Roadway Travel Time Measures
 ROADWAYS Approximately 6 million trips are made in the Boston metropolitan region every day. The vast majority of these trips (80 to percent, depending on trip type) involve the use of the roadway network
Traffic Circulation Study for Neighborhood Southwest of Mockingbird Lane and Airline Road, Highland Park, Texas
 ARIZONA TEXAS NEW MEXICO OKLAHOMA February 13, 2015 Mr. Meran Dadgostar P.E., R.S. Town of Highland Park 4700 Drexel Dr. Highland Park, Texas 75205 Re: Traffic Circulation Study for Neighborhood Southwest
Truck Climbing Lane Traffic Justification Report
 ROUTE 7 (HARRY BYRD HIGHWAY) WESTBOUND FROM WEST MARKET STREET TO ROUTE 9 (CHARLES TOWN PIKE) Truck Climbing Lane Traffic Justification Report Project No. 6007-053-133, P 101 Ι UPC No. 58599 Prepared by:
HILTON GARDEN INN HOTEL HOTEL EXPANSION 2400 ALERT ROAD, OTTAWA TRANSPORTATION BRIEF. Prepared for:
 HILTON GARDEN INN HOTEL HOTEL EXPANSION 2400 ALERT ROAD, OTTAWA TRANSPORTATION BRIEF Prepared for: Bona Building & Management Co. Ltd. Place Vanier, 333 North River Road Vanier, Ontario K1L 8B9 October
Northbound San Jose Avenue & I-280 Off-Ramp Road Diet Pilot Project
 Project Overview Fed by a two-lane Interstate-280 (I-280) off-ramp, high vehicular volumes and speeds are longstanding issues along San Jose Avenue. Residents in the surrounding neighborhoods have expressed
Geometric and Trafc Conditions Summary
 2 Geometric and Trafc Conditions Summary m, RETHNKNG -94 APPENDX T2 GEOMETRC AND TRAFFC CONDTONS SUMMARY ntroduction This memorandum summarizes the geometric and traffic conditions within the Rethinking
MoPac South: Impact on Cesar Chavez Street and the Downtown Network
 MoPac South: Impact on Cesar Chavez Street and the Downtown Network Prepared by: The University of Texas at Austin Center for Transportation Research Prepared for: Central Texas Regional Mobility Authority
Harrah s Station Square Casino
 Transportation Analysis Harrah s Station Square Casino Pittsburgh, Pennsylvania Submitted To: City of Pittsburgh and Pennsylvania Gaming Control Board Prepared By: DKS Associates GAI Consultants December
KING STREET TRANSIT PILOT
 STREET TRANSIT PILOT Update toronto.ca/kingstreetpilot #kingstreetpilot HIGHLIGHTS PREVIOUS HIGHLIGHTS TRANSIT RELIABILITY TRANSIT TRAVEL TIMES 85% of streetcars arriving within 4 minutes westbound during
Albany Shaker Road Corridor Study Public Meeting # 2
 Albany Shaker Road Corridor Study Public Meeting # 2 Scope / Meeting Purpose This project is a CDTC Linkage Study. The Linkage Program is designed to implement the adopted planning and investment principles
MEASURING RECURRENT AND NON-RECURRENT TRAFFIC CONGESTION
 MEASURING RECURRENT AND NON-RECURRENT TRAFFIC CONGESTION DRAFT Alexander Skabardonis* Institute of Transportation Studies University of California, Berkeley CA 970-170 Tel: (510) 6-9166, Fax: (510) 6-16
METHODOLOGY. Signalized Intersection Average Control Delay (sec/veh)
") Chapter 5 Traffic Analysis 5.1 SUMMARY US /West 6 th Street assumes a unique role in the Lawrence Douglas County transportation system. This principal arterial street currently conveys commuter traffic
Chapter 5 Traffic Analysis 5.1 SUMMARY US /West 6 th Street assumes a unique role in the Lawrence Douglas County transportation system. This principal arterial street currently conveys commuter traffic
Hard Shoulder Running is a valuable tool July 14, Dean H. Gustafson, PE, PTOE State Operations Engineer VDOT Operations Division
 Hard Shoulder Running is a valuable tool July 14, 2016 Dean H. Gustafson, PE, PTOE State Operations Engineer VDOT Operations Division Virginia 2 VDOT s Statewide Operations Program Operations Statistics
Idea-66: Westbound I-66 Inside the Beltway
 Southeastern Institute of Research Idea-66: Westbound I-66 Inside the Beltway Stakeholder Telephone Survey Pulsar Advertising December 22, 2004 G 1 Agenda I. Objectives II. Methodology III. Key Findings
Final Report. Evaluation of Flashing Yellow Right Turn Arrow at Silverbell Rd and Cortaro Rd. FHWA Experimentation #4-329(E)
") Final Report Evaluation of Flashing Yellow Right Turn Arrow at Silverbell Rd and Cortaro Rd FHWA Experimentation #4-329(E) Marana, Arizona January 2009 Submitted To: Submitted By: FINAL REPORT EVALUATION
Final Report Evaluation of Flashing Yellow Right Turn Arrow at Silverbell Rd and Cortaro Rd FHWA Experimentation #4-329(E) Marana, Arizona January 2009 Submitted To: Submitted By: FINAL REPORT EVALUATION
CONGESTED LOS ANGELES
 CONGESTED LOS ANGELES Prepared For: Mayor Antonio Villaraigosa and City Council City of Los Angeles Prepared By: Jacki Murdock Transportation Analyst LADOT December 11 th, 2011 Outline What causes congestion?
Congestion Management Report
 Congestion Management Report F.E. EVERETT TURNPIKE (NORTH), MERRIMACK Segment Length: 7.0 miles Daily Traffic Volumes: 60,000-69,000 Analysis Period: May 2015 Number of Traffic Signals: 0 Number of travel
Traffic Impact Analysis Walton Acres at Riverwood Athletic Club Clayton, NC
 Traffic Impact Analysis Walton Acres at Riverwood Athletic Club Clayton, NC 1. TABLE OF CONTENTS INTRODUCTION...1 1.1. Site Location and Study Area...1 1.2. Proposed Land Use and Site Access...2 1.3.
State Route 160 (Blue Diamond Highway)
") State Route 160 (Blue Diamond Highway) ~ Multi-Year Expansion Program ~ Highway Improvement Projects in Clark and Nye Counties EXHIBIT G Treasures Document consists of 16 slides. Entire exhibit provided.
State Route 160 (Blue Diamond Highway) ~ Multi-Year Expansion Program ~ Highway Improvement Projects in Clark and Nye Counties EXHIBIT G Treasures Document consists of 16 slides. Entire exhibit provided.
Figure 1: Vicinity Map of the Study Area
 ARIZONA TEXAS NEW MEXICO OKLAHOMA May 5, 2016 Mr. Anthony Beach, P.E. BSP Engineers 4800 Lakewood Drive, Suite 4 Waco, Texas 76710 Re: Intersection and Access Analysis along Business 190 in Copperas Cove
Project Report. South Kirkwood Road Traffic Study. Meadows Place, TX October 9, 2015
 Meadows Place, TX October 9, 2015 Contents 1 Introduction... 1 2 Data Collection... 1 3 Existing Roadway Network... 2 4 Traffic Volume Development... 2 5 Warrant Analysis... 3 6 Traffic Control Alternative
Lincoln Avenue Road Diet Trial
 Lincoln Avenue Road Diet Trial Data Collection Report June 1, 2015 Department of Transportation Table of Contents I. Introduction...... 3 II. Data Collection Methodology & Results...... 5 A. Traffic Volume
Safety Implications of Managed Lane Cross Sectional Elements (Buffer Width vs. Shoulder Width vs. Lane Width)
") Safety Implications of Managed Lane Cross Sectional Elements (Buffer Width vs. Shoulder Width vs. Lane Width) 2016 Traffic Safety Conference June 7, 2016 Raul Avelar, Ph.D., P.E. Kay Fitzpatrick, Ph.D.,
Safety Implications of Managed Lane Cross Sectional Elements (Buffer Width vs. Shoulder Width vs. Lane Width) 2016 Traffic Safety Conference June 7, 2016 Raul Avelar, Ph.D., P.E. Kay Fitzpatrick, Ph.D.,
Traffic Signal Redesign 50% Design Report
 Traffic Signal Redesign 50% Design Report Joseph Davis, Jace Elkins, Jordan Weyrauch and Zach Crimmins CENE 486 Capstone J3Z Engineering March 10 th, 2016 Table of Contents 1.0 Project Description...1
Subject: Solberg Avenue / I-229 Grade Separation: Traffic Analysis
 MEMORANDUM Transportation Bill Troe, AICP Jason Carbee, AICP 12120 Shamrock Plaza Suite 300 Omaha, NE 68154 (402) 334-8181 (402) 334-1984 (Fax) To: Project File Date: Subject: Solberg Avenue / I-229 Grade
Appendix B: Forecasting and Traffic Operations Analysis Framework Document
 Existing Conditions Report - Appendix Appendix B: Forecasting and Traffic Operations Analysis Framework Document This document defines the methodology and assumptions that will be used in the traffic forecasting
Reference: Laguna Canyon Road Traffic Conditions Data Collection Summary
 Stantec Consulting Services Inc. 38 Technology Drive Suite 100, Irvine CA 92618-5312 September 8, 2017 File: 2073014320 Attention: Mark Trestik, Assistant City Engineer City of Beach Department of Public
PRELIMINARY DRAFT FIRST AMENDMENT TO VISION 2050: A REGIONAL LAND USE AND TRANSPORTATION PLAN FOR SOUTHEASTERN WISCONSIN
 PRELIMINARY DRAFT FIRST AMENDMENT TO VISION 2050: A REGIONAL LAND USE AND TRANSPORTATION PLAN FOR SOUTHEASTERN WISCONSIN ESTABLISHING TARGETS FOR FEDERAL PERFORMANCE MEASURES: HIGHWAY SAFETY SOUTHEASTERN
Roundabouts in Small-Medium Sized Communities: Why Consider Them?
 Roundabouts in Small-Medium Sized Communities: Why Consider Them? PRESENTORS: Dave Kliewer, PE J-U-B Engineers, Spokane Manager Spencer Montgomery J-U-B Engineers, Transportation Planner Roger Krieger
Road Conversion Study Plumas Street
 Plumas Street Phase I Submitted to The Regional Transportation Commission of Washoe County Submitted by Zong Tian, Ph.D., P.E. Saeedeh Farivar Haiyuan Li, Ph.D. Center for Advanced Transportation Education
Congestion Reducing Activities. Toby Carr GDOT Director of Planning April 10, 2014
 Congestion Reducing Activities Toby Carr GDOT Director of Planning April 10, 2014 GDOT Performance Dashboard Congestion Congestion Relief Strategies 511 HEROS RTOP Highway Emergency Response Operators
Let s Make I-40 Better Action Team. Friday, March 29, 2019 Hosted by RTP Foundation
 Let s Make I-40 Better Action Team Friday, March 29, 2019 Hosted by RTP Foundation RTA Welcome Geoff Lang, MetLife, RTA Chair Jim Beley, The Umstead Hotel & Spa, RTA regional travel experience chair NCDOT
6TH AVE N/BENCH BLGS Phase II
 6TH AVE N/BENCH BLGS Phase II Study Objectives Evaluate existing and future traffic conditions on Main Street between Airport Road and 1 st Avenue Determine what, if any design improvements should be considered
Mobility and Congestion
 Technical Memorandum Mobility and Congestion Prepared for: Prepared by: September 25, 2013 1 Table of Contents 1. Introduction... 1 2. Congestion Forecasting Process... 1 2.1 Mobility and Congestion Terms...
Washington DC Section of ITE Project Briefing
 Washington DC Section of ITE Project Briefing November 5, 2015 Renée Hamilton, VDOT, Deputy District Administrator I-66 Outside the Beltway Improvement Area Project Location Virginia 2 Purpose and Need
FAIRFIELD INN & SUITES HOTEL 135 THAD JOHNSON PRIVATE OTTAWA TRANSPORTATION BRIEF. Prepared for:
 FAIRFIELD INN & SUITES HOTEL 135 THAD JOHNSON PRIVATE OTTAWA TRANSPORTATION BRIEF Prepared for: Bona Building & Management Co. Ltd. Place Vanier, 333 North River Road Vanier, Ontario K1L 8B9 August 12,
Nevada s Transportation Infrastructure and Future Transportation Needs
 Nevada s Transportation Infrastructure and Future Transportation Needs Susan Martinovich, P.E. Director Interim Legislative Committee on Transportation Nov. 13, 2007 State Transportation Board of Directors
Performance Measure Summary - San Jose CA. Performance Measures and Definition of Terms
 Performance Measure Summary - San Jose CA There are several inventory and performance measures listed in the pages of this Urban Area Report for the years from 1982 to 2014. There is no single performance
Performance Measure Summary - Chicago IL-IN. Performance Measures and Definition of Terms
 Performance Measure Summary - Chicago IL-IN There are several inventory and performance measures listed in the pages of this Urban Area Report for the years from 1982 to 2014. There is no single performance
I-264 CORRIDOR EVALUATION STUDY. September 7, 2016 Eric Stringfield VDOT Planning Director Chris Lawrence AECOM Senior Transportation Engineer
 I-264 CORRIDOR EVALUATION STUDY September 7, 2016 Eric Stringfield VDOT Planning Director Chris Lawrence AECOM Senior Transportation Engineer Study Overview Interchange Locations Study Context Follow-up
Performance Measure Summary - Denver-Aurora CO. Performance Measures and Definition of Terms
 Performance Measure Summary - Denver-Aurora CO There are several inventory and performance measures listed in the pages of this Urban Area Report for the years from 1982 to 2014. There is no single performance
4 Level of Service Results: HOV and Express Lanes
 4 Level of Service Results: HOV and Express Lanes Considering the importance of managed lanes (such as HOV and express lanes) in improving the overall performance of a corridor, Alameda CTC started monitoring
# Southeastern Wisconsin Regional Freeway System Reconstruction Study and Preliminary Recommended Plan
 #70421 Southeastern Wisconsin Regional Freeway System Reconstruction Study and Preliminary Recommended Plan Public Information Meetings and Hearings May June 2002 1 Reason for Freeway System Study 270-mile
Arterial Transitway Corridors Study. Ave
 Arterial Transitway Corridors Study Ave January 2012 Arterial Transitway Corridors Study Overview Corridor Features and Demographics 11 study corridors, 95 route miles 86,000 daily rides and half of existing
Waterford Lakes Small Area Study
 Waterford Lakes Small Area Study Existing Traffic Conditions PREPARED FOR: ORANGE COUNTY PUBLIC WORKS DEPARTMENT TRAFFIC ENGINEERING DIVISION ORLANDO, FLORIDA PREPARED WITH: INWOOD CONSULTING ENGINEERS
Roundabout Feasibility Memorandum
 Roundabout Feasibility Memorandum To From Gwen Pipkin Bill Howell Date June 18, 2013 Subject Roundabout Feasibility Study SR 29 PD&E Study From Oil Well Road to SR 82 Collier County, FL FPID 417540-1-22-01
CITY OF OAKLAND. 27th Street Bikeway Feasibility and Design. Final Report (v3) March 23, Kimley-Horn and Associates, Inc.
 March 23, Kimley-Horn and Associates, Inc.") CITY OF OAKLAND 27th Street Bikeway Feasibility and Design Final Report (v3) March 23, 2007 PREPARED BY: Kimley-Horn and Associates, Inc. Table of Contents 1. Introduction 3 2. 27 th Street/Bay Place Corridor
CITY OF OAKLAND 27th Street Bikeway Feasibility and Design Final Report (v3) March 23, 2007 PREPARED BY: Kimley-Horn and Associates, Inc. Table of Contents 1. Introduction 3 2. 27 th Street/Bay Place Corridor
TABLE TRAFFIC ANALYSIS SCENARIOS
 4.11 TRANSPORTATION The potential traffic impacts of the proposed project are evaluated in the Buena Park Beach/Orangethorpe Mixed Use Project Traffic Analysis (Traffic Analysis) by Austin-Foust Associates
Regional Transportation Needs Within Southeastern Wisconsin
 Regional Transportation Needs Within Southeastern Wisconsin #118274 May 24, 2006 1 Introduction The Southeastern Wisconsin Regional Planning Commission (SEWRPC) is the official areawide planning agency
DULLES AREA TRANSPORTATION ASSOCIATION (DATA) February 18, Susan Shaw, P.E., VDOT, Megaprojects Director
 February 18, Susan Shaw, P.E., VDOT, Megaprojects Director") DULLES AREA TRANSPORTATION ASSOCIATION (DATA) February 18, 2015 Susan Shaw, P.E., VDOT, Megaprojects Director I-66 Corridor Conditions Steady population growth Employment growth in activity centers Congestion
DULLES AREA TRANSPORTATION ASSOCIATION (DATA) February 18, 2015 Susan Shaw, P.E., VDOT, Megaprojects Director I-66 Corridor Conditions Steady population growth Employment growth in activity centers Congestion
Reference number /VP. Lafayette Downtown Congestion Study - Additional Traffic Analysis
 To James Hinkamp and Tony Coe, City of Lafayette Date January 19, 2017 Copies Reference number 243381/VP From Michael Iswalt and Vanessa Peers File reference 4-05 Subject Lafayette Downtown Congestion
95 Express Annual Operations Report: Fiscal Year
 95 Express Annual Operations Report: Fiscal Year 2014-2015 General The 95 Express Program completed its sixth full Fiscal Year of operations in June 2015. For the FDOT, its Fiscal Year (FY) is from July
CONGESTION REPORT 4 th Quarter 2017
 CONGESTION REPORT 4 th Quarter 2017 A quarterly update of the National Capital Region s traffic congestion, travel time reliability, top-10 bottlenecks and featured spotlight May 7, 2018 ABOUT TPB Transportation
Detailed Description of Work
 Trail Items I-580 Eastbound Shoulder Running Lane and Bi-Directional Bike Lane Project Bay Area Toll Authority Task Order Contract with HNTB Corporation Effective May 12, 2014 Description of Work: Implement
Donahue Drive Corridor Traffic Operational Evaluation
 Donahue Drive Corridor Traffic Operational Evaluation PREPARED FOR: THE CITY OF AUBURN PREPARED BY: JANUARY 2007 Donahue Drive Corridor Study--Auburn, Alabama TABLE OF CONTENTS Introduction... 1 Background
91 Express Lanes Model Update 2006 State Route 91 Implementation Plan. Gerald V. Nielsten May 18, 2007
 91 Express Lanes Model Update 2006 State Route 91 Implementation Plan Gerald V. Nielsten May 18, 2007 1 Vollmer Associates LLP is now Stantec Inc. Stantec Inc. completed the acquisition of Vollmer Associates
Core of Rosslyn Transportation Study Existing Conditions Report - Appendix. Appendix E: VISSIM Model Calibration Summary
 Core of Rosslyn Transportation Study Existing Conditions Report - Appendix Appendix E: Model Calibration Summary Core of Rosslyn Transportation Study Model Calibration Summary 5.9.218 Model Calibration
CITY OF WEST LAKE HILLS. Forest View Neighborhood Traffic Calming Study
 CITY OF WEST LAKE HILLS 901 South Mopac Expressway Building V, Suite 220 Austin, Texas 78746 Texas P.E. Firm Registration No. F-929 Klotz Associates Final Report Submittal: March 20, 2015 Revised Final
Northwest Corridor Project Interchange Modification, Interchange Justification and System Analysis Report Reassessment (Phase I)
") Northwest Corridor Project Interchange Modification, Interchange Justification and System Analysis Report Reassessment (Phase I) Introduction The Georgia Department of Transportation (GDOT) prepared a
Northwest Corridor Project Interchange Modification, Interchange Justification and System Analysis Report Reassessment (Phase I) Introduction The Georgia Department of Transportation (GDOT) prepared a
Amendment to the Summary of Regional Strategic Investments included in the Regional Transportation Plan
 Attachment A Amendment to the Summary of Regional Strategic Investments included in the Regional Transportation Plan Street and Highway improvements Project costs include all funded phases including planning,
M-58 HIGHWAY ACCESS MANAGEMENT STUDY Mullen Road to Bel-Ray Boulevard. Prepared for CITY OF BELTON. May 2016
 M-58 HIGHWAY ACCESS MANAGEMENT STUDY Prepared for CITY OF BELTON By May 2016 Introduction Missouri State Highway 58 (M-58 Highway) is a major commercial corridor in the City of Belton. As development has
Proposed Action, Purpose and Need Technical Memorandum
 Proposed Action, Purpose and Need Technical Memorandum MoPac (State Loop 1) Intersections, Austin District From North of Slaughter Lane to South of La Crosse Avenue CSJ: 3136-01-015 Travis County, Texas
I-105 Corridor Sustainability Study (CSS)
") I-105 Corridor Sustainability Study (CSS) Metro Streets and Freeways Subcommittee March 21, 2019 Gary Hamrick Cambridge Systematics, Inc. I-105 CSS Project History & Background Funded by Caltrans Sustainable
I-105 Corridor Sustainability Study (CSS) Metro Streets and Freeways Subcommittee March 21, 2019 Gary Hamrick Cambridge Systematics, Inc. I-105 CSS Project History & Background Funded by Caltrans Sustainable
EUCLID AVENUE PARKING STUDY CITY OF SYRACUSE, ONONDAGA COUNTY, NEW YORK
 EUCLID AVENUE PARKING STUDY CITY OF SYRACUSE, ONONDAGA COUNTY, NEW YORK CITY OF SYRACUSE DEPARTMENT OF PUBLIC WORKS 1200 CANAL STREET EXTENSION SYRACUSE, NEW YORK 13210 DRAFT REPORT DATE: November 13,
Complete Street Analysis of a Road Diet: Orange Grove Boulevard, Pasadena, CA
 Complete Street Analysis of a Road Diet: Orange Grove Boulevard, Pasadena, CA Aaron Elias, Bill Cisco Abstract As part of evaluating the feasibility of a road diet on Orange Grove Boulevard in Pasadena,
Welcome. 53 Avenue Overpass over Whitemud Drive Rehabilitation. Public Information Session. Wednesday, March 9, :30-8:00 p.m.
 BRIDGE REHABILITATION Welcome 53 Avenue Overpass over Whitemud Drive Rehabilitation Public Information Session Wednesday, March 9, 2016 4:30-8:00 p.m. Tonight you can: Learn about the 53 Avenue Overpass
TRANSPORTATION ANALYSIS REPORT US Route 6 Huron, Erie County, Ohio
 TRANSPORTATION ANALYSIS REPORT US Route 6 Huron, Erie County, Ohio December 12, 2012 Prepared for: The City of Huron 417 Main Huron, OH 44839 Providing Practical Experience Technical Excellence and Client
Des Moines Area MPO Safety Performance Targets and Methodology
 Des Moines Area MPO Safety Performance Targets and Methodology February 2019 2 P a g e CONTENTS BACKGROUND... 3 Safety Goals in Mobilizing Tomorrow... 3 STATEWIDE TARGETS... 4 DES MOINES AREA MPO SAFETY
CITY OF SPOKANE VALLEY Request for Council Action
 CITY OF SPOKANE VALLEY Request for Council Action Meeting Date: December 16, 2014 Department Director Approval: Check all that apply: consent old business new business public hearing information admin.
LOOP 360 IMPROVEMENT STUDY
 LOOP 360 IMPROVEMENT STUDY Overview and Preliminary Analysis August 2015 1 STUDY PROCESS 2 Study Background Loop 360 serves a wide range of users, including residents, businesses, bicyclists, and commuters
VPP Suite User Group. January 20, Dial & enter # at the prompt
 VPP Suite User Group Dial 1-719-867-1571 & enter 725437# at the prompt Housekeeping Items Please call Emily at 917-974-4810 for difficulties with the web or audio application This is a virtual meeting
Wide-area area, User Friendly Performance Monitoring. Michael L. Pack, University of Maryland CATT Laboratory 1
 Visualizing Performance Wide-area area, User Friendly Performance Monitoring Michael L. Pack, University of Maryland CATT Laboratory 1 2 Lots of Data. Now what? Transportation agency emphasis on data collection,
Statewide Access Management Coordination GoToWebinar
 Statewide Access Management Coordination GoToWebinar Promoting innovative, efficient, and exceptional work since 1988 April 26, 2017 ( 2:30 EST, 1:30 CST) Answers to Common Questions Yes we will provide
A: PLANNED P ROJECTS PROJECTS
 Appendix A: PLANNED PROJECTS Programming Study Sound Barrier along south side of for approx. 2100 feet. Construction Complete $850,000 5 8613.00 Y Y Y Sound Barrier along south side of for 500' west of