Daftar Perusahaan Otomotif yang Terdatar di Bursa Efek Indonesia(Periode )
|
|
|
- Cleopatra Jocelin Carter
- 5 years ago
- Views:
Transcription
1 114 Lampiran 1: Populasi Penelitian Daftar Perusahaan Otomotif yang Terdatar di Bursa Efek Indonesia(Periode ) 89 1 PT. Astra Internasional Tbk. ASII 2 PT. Astra Otoparts Tbk. AUTO 3 PT. Indo Kordsa Tbk. BRAM 4 PT. Goodyear Indonesia Tbk. GDYR 5 PT. Gajah Tunggal Tbk. GJTL 6 PT. Indomobil Sukses Internasional Tbk. IMAS 7 PT. Indospring Tbk. INDS 8 PT. Multi Prima Sejahtera Tbk. LPIN 9 PT. Multistrada Arah Sarana Tbk. MASA 10 PT. Nipress Tbk. NIPS 11 PT. Prima Alloy Steel Universal Tbk. PRAS 12 PT. Selamat Sempurna Tbk. SMSM
2 115 Lampiran 2: Daftar Sampel Terpilih Daftar Sampel Terpilih Memenuhi Kriteria Sampel Terpilih PT. Astra Internasional Tbk. S1 2 PT. Astra Otoparts Tbk. S2 3 PT. Indo Kordsa Tbk. S3 4 PT. Goodyear Indonesia Tbk. S4 5 PT. Gajah Tunggal Tbk. S5 6 PT. Indomobil Sukses Internasional Tbk. S6 7 PT. Indospring Tbk. S7 8 PT. Multi Prima Sejahtera Tbk. S8 9 PT. Multistrada Arah Sarana Tbk. S9 10 PT. Nipress Tbk. S10 11 PT. Prima Alloy Steel Universal Tbk. S11 12 PT. Selamat Sempurna Tbk. S12
3 116 Lampiran 3: Data Penelitian PT. Astra Internasional Tbk. (ASII) 1 DER 1,4078 1,1688 1,2142 1,0029 1,0986 1,0244 1, lnsls 17, , , , , , , lnast 17, , , , , , , ROA 0,1014 0,1742 0,1903 0,1845 0,1864 0,1679 0, MTBR 2,8406 4,0991 1,2912 3,5213 4,4786 3,9503 0, ASTG -0,0530 0,0966 0,2712 0,1016 0,2690 0,3604 0, SGR -0,0976 0,2599 0,3831 0,0151 0,3194 0,2506 0, PER 17,120 16,950 4,650 13,990 15,370 14,030 13,700 9 FAR 0,2250 0,2225 0,0076 0,2467 0,2159 0,1864 0, FAR+ 0,2940 0,2946 0,1150 0,3286 0,3120 0,2645 0, CRR 0,7839 1,3195 1,3217 1,3731 1,2618 1,3640 1, QCR 0,5845 1,1048 0,9994 1,1009 0,9698 1,1162 1, KSI 0,5011 0,5011 0,5011 0,5011 0,5011 0,5011 0, DOL 2,9159 3,4014 1,0158 4,4901 0,8838 0,8997 0,5262 PT. Astra Otoparts Tbk. (AUTO) 1 DER 0,5723 0,4841 0,4489 0,3934 0,3841 0,4746 0, lnsls 15, , , , , , , lnast 14, , , , , , , ROA 0,1278 0,1672 0,1939 0,2039 0,2497 0,1803 0, MTBR 1,2102 1,1342 1,0177 1,3823 2,7871 2,7758 2, ASTG -0,0002 0,1408 0,1526 0,1667 0,2026 0,2468 0, SGR -0,1249 0,2472 0,2693-0,0135 0,1879 0,1773 0, PER 8,000 5,640 4,770 5,770 9,430 11,860 13,250 9 FAR 0,2375 0,1938 0,1764 0,1500 0,1764 0,2223 0, FAR+ 0,3729 0,3376 0,3447 0,2608 0,3032 0,3595 0, CRR 1,7476 2,1966 2,1334 2,1739 1,7574 1,3549 1, QCR 1,1917 1,5416 1,3661 1,6490 1,1915 0,8502 0, KSI 0,8472 0,8672 0,9391 0,9565 0,9565 0,9565 0, DOL 0,7856 1,9913 1, ,8453 2,5139-0,5633 0,0532
4 117 Lampiran 3 (Lanjutan) : Data Penelitian PT. Indo Kordsa Tbk. (BRAM) 1 DER 0,6085 0,5172 0,4812 0,2290 0,2647 0,3815 0, lnsls 14, , , , , , , lnast 14, , , , , , , ROA 0,0260 0,0430 0,0962 0,0993 0,1433 0,0741 0, MTBR 1,0257 0,9564 0,8117 0,6645 1,0070 0,8051 0, ASTG -0,1056 0,0170 0,0759-0,1932 0,1061 0,1122 0, SGR -0,1442 0,0242 0,0587-0,0838 0,2031 0,0526-0, PER 46,690 21,840 8,550 9,050 8,050 17,600 5,690 9 FAR 0,4500 0,4117 0,3869 0,4783 0,4855 0,4293 0, FAR+ 0,6780 0,6033 0,6278 0,6540 0,6807 0,6406 0, CRR 3,9344 4,9761 2,1929 3,4374 4,0176 2,7889 2, QCR 2,2973 3,3502 1,2896 2,1952 2,4055 1,6316 1, KSI 0,5690 0,6582 0,6582 0,6582 0,6582 0,6582 0, DOL 5, , ,0145 1,9978 2,9400-8,0878-4,5870 PT. Goodyear Indonesia Tbk. (GDYR) 1 DER 0,6174 0,9353 2,4454 1,7149 1,7624 1,7727 1, lnsls 13, , , , , , , lnast 13, , , , , , , ROA 0,0806 0,1056 0,0065 0,1502 0,0676 0,0240 0, MTBR 0,9622 1,7795 0,6909 0,9477 1,2350 0,9153 0, ASTG -0,0085 0,2744 0,7637 0,1031 0,0167 0,0347 0, SGR 0,1228 0,1084 0,1430 0,0389 0,3429 0,0829 0, PER 10,650 12, ,450 3,250 7,700 10,520 7,810 9 FAR 0,2533 0,3824 0,5364 0,6170 0,5108 0,4719 0, FAR+ 0,4763 0,5954 0,6840 0,7770 0,6959 0,6677 0, CRR 2,1519 1,3524 1,4880 0,9048 0,8642 0,8535 0, QCR 1,4471 0,8446 0,9839 0,4955 0,5133 0,5195 0, KSI 0,8500 0,8500 0,8500 0,9392 0,9416 0,9416 0, DOL -50,7641 6,1764-6, ,1561-1,5835-7, ,4679
5 118 Lampiran 3 (Lanjutan) : Data Penelitian PT. Gajah Tunggal Tbk. (GJTL) 1 DER 2,4076 2,5438 4,2828 2,3240 1,9410 1,6077 1, lnsls 15, , , , , , , lnast 15, , , , , , , ROA 0,0321 0,0166-0,0889 0,1435 0,1081 0,0741 0, MTBR 0,8606 0,6507 0,4226 0,5546 2,2728 2,3595 1, ASTG -0,0272 0,1620 0,0307 0,0188 0,1684 0,1141 0, SGR 0,1318 0,2174 0,1958-0,0034 0,2417 0,2017 0, PER 15,520 17,090-1,120 1,640 9,650 11,050 7,140 9 FAR 0,4378 0,3868 0,4153 0,4066 0,3930 0,3972 0, FAR+ 0,5835 0,4975 0,5759 0,5037 0,4980 0,5409 0, CRR 1,9430 2,1535 1,4760 2,5318 1,7609 1,7493 1, QCR 1,0934 1,5533 0,8004 1,8851 1,3337 1,1768 1, KSI 0,6157 0,6500 0,5787 0,5637 0,5981 0,5981 0, DOL 1,5451-1, , ,9638-0,4978-1,1716 1,9708 PT. Indomobil Sukses Internasional Tbk. (IMAS) 1 DER 20, , , ,1578 4,9926 1,5401 2, lnsls 14, , , , , , , lnast 15, , , , , , , ROA -0,0237 0,0063 0,0302 0,0454 0,0809 0,0921 0, MTBR 3,6272 6,9965 3,1618 1,9596 5,9292 3,4810 2, ASTG -0,0408 0,1107 0,1368-0,0871 0,5678 0,6173 0, SGR -0,3578 0,7477 0,6124-0,1535 0,5758 0,4428 0, PER 558, ,640 39,350 7,290 16,880 16,600 16,560 9 FAR 0,1310 0,1198 0,1220 0,1175 0,0934 0,1454 0, FAR+ 0,2184 0,2058 0,2473 0,2679 0,2866 0,3334 0, CRR 0,9540 0,8363 0,9094 0,9340 1,0694 1,3678 1, QCR 0,7964 0,7048 0,7053 0,6839 0,7036 0,9194 0, KSI 0,9461 0,9461 0,9310 0,9310 0,7040 0,7040 0, DOL 7,1406-1,7283 7,3690-2,4200 3,1199 1,8971-1,0728
6 119 Lampiran 3 (Lanjutan) : Data Penelitian PT. Indospring Tbk. (INDS) 1 DER 6,1256 6,6110 7,4482 2,7509 2,3898 0,8027 0, lnsls 12, , , , , , , lnast 13, , , , , , , ROA 0,0089 0,0354 0,0514 0,1287 0,1363 0,1410 0, MTBR 0,2615 0,6908 0,4141 0,2832 1,7323 1,2456 1, ASTG 0,0673 0,2216 0,5323-0,3236 0,2407 0,4790 0, SGR -0,0956 0,4437 0,7065-0,2523 0,4262 0,2024 0, PER 8,290 5,500 1,410 0,800 5,540 6,540 2,450 9 FAR 0,4413 0,3606 0,2265 0,2955 0,2398 0,2992 0, FAR+ 0,7587 0,7470 0,7437 0,7010 0,6524 0,6744 0, CRR 0,9843 1,0706 1,0750 1,2722 1,2867 2,4041 2, QCR 0,3407 0,3742 0,3276 0,4967 0,5156 1,1093 0, KSI 0,8746 0,8746 0,8746 0,8746 0,8811 0,8811 0, DOL 15,9145 8,7130 1,7351-2,7529 0,7371 2,6195-0,6779 PT. Multi Prima Sejahtera Tbk. (LPIN) 1 DER 0,7698 0,7890 1,2141 0,4859 0,4115 0,3308 0, lnsls 10, , , , , , , lnast 11, , , , , , , ROA -0,0036 0,1515 0,0436 0,0957 0,1228 0,1012 0, MTBR 0,2075 0,4368 0,2444 0,2519 0,6210 0,3954 1, ASTG -0,0711 0,2806 0,3138-0,2462 0,0945 0,0427 0, SGR -0,3253 0,6814 0,2054-0,0196 0,0247 0,0578 0, PER -13,580 1,890 4,240 2,290 4,700 4,130 9,790 9 FAR 0,0166 0,0143 0,0076 0,0052 0,0111 0,0152 0, FAR+ 0,1811 0,1811 0,4024 0,1831 0,1930 0,1736 0, CRR 0,7969 1,7011 1,3013 2,2701 2,5167 2,9357 2, QCR 0,4007 1,3069 0,5594 1,6838 1,8338 2,2159 2, KSI 0,2971 0,2971 0,2971 0,2971 0,8637 0,8637 0, DOL 2, ,4791-3, , ,4230-2,4319 0,3504
7 120 Lampiran 3 (Lanjutan) : Data Penelitian PT. Multistrada Arah Sarana Tbk.(MASA) 1 DER 0,9868 0,3970 0,8517 0,7375 0,8651 1,6805 0, lnsls 13, , , , , , , lnast 14, , , , , , , ROA 0,0113 0,0243 0,0028 0,0908 0,0748 0,0398 0, MTBR 0,9922 1,0215 0,6668 0,8594 1,2395 1,7315 1, ASTG 0,3235 0,2550 0,3223 0,0661 0,1981 0,5589 0, SGR 1,3829 0,5815 0,4846 0,2684 0,1865 0,4261 0, PER 4,540 35, ,090 7,170 11,470 21, ,120 9 FAR 0,8194 0,6802 0,6819 0,6675 0,7025 0,6840 0, FAR+ 0,8961 0,8091 0,8317 0,8384 0,8320 0,8500 0, CRR 0,5612 1,3211 0,8938 0,8593 0,6704 0,4818 1, QCR 0,2123 0,4569 0,3762 0,3527 0,2740 0,1816 0, KSI 0,7574 0,5992 0,6310 0,4990 0,4780 0,4780 0, DOL -1,1815 2,9388-1, ,3824-0,0699-0, ,5055 PT. Nipress Tbk. (NIPS) 1 DER 1,4364 2,1791 1,6356 1,4762 1,2786 1,6910 1, lnsls 12, , , , , , , lnast 12, , , , , , , ROA 0,0566 0,0255 0,0129 0,0225 0,0522 0,0555 0, MTBR 0,2976 0,4053 0,2417 0,2284 0,5366 0,4820 0, ASTG 0,1578 0,3085 0,1280-0,0324 0,0736 0,3232 0, SGR 0,1889 0,5597 0,1842-0,4174 0,4322 0,4449 0, PER 3,380 7,280 19,210 7,870 6,280 4,490 3,800 9 FAR 0,5359 0,3889 0,4301 0,4522 0,4608 0,3928 0, FAR+ 0,6575 0,5309 0,5810 0,6883 0,6207 0,6653 0, CRR 1,0799 1,0518 1,0351 0,9926 1,0172 1,0836 1, QCR 0,7912 0,8044 0,7545 0,5557 0,7095 0,5884 0, KSI 0,3711 0,3711 0,3711 0,3711 0,3711 0,3711 0, DOL 8,5227-0,7339-2,3412-1,6633 3,4501 0,9130-0,5953
8 121 Lampiran 3 (Lanjutan) : Data Penelitian PT. Prima Alloy Steel Universal Tbk. (PRAS) 1 DER 3,6782 3,1906 3,8393 4,3569 2,3253 2,4473 1, lnsls 13, , , , , , , lnast 13, , , , , , , ROA -0,0065 0,0076-0,0369-0,1119 0,0025 0,0134 0, MTBR 0,4174 0,6036 0,6149 0,8910 0,4001 0,5553 0, ASTG 0,0572-0,0847 0,0228-0,2424 0,0806 0,0601 0, SGR 0,1098-0,1388-0,3760-0,6075-0,5350 3,4075-0, PER -19,160 28,200-4,760-1, ,540 17,130 3,620 9 FAR 0,2040 0,2441 0,2986 0,3652 0,4861 0,4617 0, FAR+ 0,3353 0,4496 0,4912 0,5991 0,6992 0,6872 0, CRR 1,0807 1,0503 1,0088 2,0348 1,3525 1,1379 1, QCR 0,8884 0,7405 0,7188 1,2047 0,7327 0,6365 0, KSI 0,8743 0,8743 0,8113 0,4576 0,4524 0,4524 0, DOL -14, , ,9654-2,1425 1,9145 1,3778-1,4855 PT. Selamat Sempurna Tbk. (SMSM) 1 DER 0,5313 0,6565 0,6266 0,8000 0,9616 0,6953 0, lnsls 13, , , , , , , lnast 13, , , , , , , ROA 0,1470 0,1574 0,1545 0,1974 0,1919 0,2460 0, MTBR 1, ,3544 1,7132 2,1690 2,9660 2,9197 4, ASTG 0,0808 0,1582 0,1202 0,0128 0,1333 0,0654 0, SGR 0,0228 0,2077 0,2722 0,0156 0,1362 0,1576 0, PER 7,610 7,710 10,230 8,130 10,240 8,930 13,540 9 FAR 0,3615 0,3840 0,3856 0,3626 0,3532 0,3499 0, FAR+ 0,6212 0,6792 0,6936 0,6333 0,6409 0,6353 0, CRR 1,9887 1,7093 1,8180 1,5870 2,1742 2,7158 1, QCR 1,0920 0,8271 0,8803 0,8833 1,1653 1,4900 1, KSI 0,6136 0,6994 0,5813 0,5813 0,5813 0,5813 0, DOL 1,4085 1,1560 0, ,8960 0,7472 2,3193-3,8915
9 KMO and Bartlett's Test Kaiser-Meyer-Olkin Measure of Sampling,457 Adequacy. Approx. Chi-Square 973,843 Bartlett's Test of df 78 Sphericity Sig.,000 Anti-image Correlation Anti-image Covariance Anti-image Matrices ROA MTBR ASTG FAR FAR+ CRR QCR KSI DOL SGR PER lnast lnsls ROA,569 -,172 -,069,003,010 -,019,011 -,119 -,160 -,034,202,005 -,006 MTBR -,172,741 -,046 -,015,019 -,014,016 -,060,044 -,028 -,220,006 -,006 ASTG -,069 -,046,785 -,001 -,004 -,008,012 -,045,056 -,227 -,057,004 -,004 FAR,003 -,015 -,001,085 -,060,032 -,030,021 -,011,002 -,053 -,002,002 FAR+,010,019 -,004 -,060,049 -,030,029 -,008 -,015 -,011,042,001,000 CRR -,019 -,014 -,008,032 -,030,029 -,028,003,030,017 -,015,000,000 QCR,011,016,012 -,030,029 -,028,027,000 -,028 -,013,015,000,000 KSI -,119 -,060 -,045,021 -,008,003,000,855 -,061,071 -,115,001,000 DOL -,160,044,056 -,011 -,015,030 -,028 -,061,852,064 -,007 -,002,002 SGR -,034 -,028 -,227,002 -,011,017 -,013,071,064,849 -,001,003 -,003 PER,202 -,220 -,057 -,053,042 -,015,015 -,115 -,007 -,001,729 -,007,007 lnast,005,006,004 -,002,001,000,000,001 -,002,003 -,007,003 -,003 lnsls -,006 -,006 -,004,002,000,000,000,000,002 -,003,007 -,003,003 ROA,694 a -,265 -,103,014,057 -,147,087 -,170 -,230 -,049,314,108 -,129 MTBR -,265,604 a -,060 -,061,098 -,093,113 -,076,055 -,035 -,300,120 -,124 ASTG -,103 -,060,715 a -,004 -,022 -,053,084 -,054,069 -,278 -,076,071 -,080 FAR,014 -,061 -,004,409 a -,927,634 -,639,079 -,041,009 -,215 -,111,097 FAR+,057,098 -,022 -,927,384 a -,788,800 -,037 -,072 -,055,222,042 -,026 CRR -,147 -,093 -,053,634 -,788,345 a -,982,020,188,110 -,106 -,045,048 QCR,087,113,084 -,639,800 -,982,375 a -,002 -,182 -,086,109,037 -,038 KSI -,170 -,076 -,054,079 -,037,020 -,002,653 a -,072,084 -,145,017,002 DOL -,230,055,069 -,041 -,072,188 -,182 -,072,383 a,075 -,009 -,031,036 SGR -,049 -,035 -,278,009 -,055,110 -,086,084,075,641 a -,001,062 -,057 PER,314 -,300 -,076 -,215,222 -,106,109 -,145 -,009 -,001,355 a -,133,137 lnast,108,120,071 -,111,042 -,045,037,017 -,031,062 -,133,567 a -,997 lnsls -,129 -,124 -,080,097 -,026,048 -,038,002,036 -,057,137 -,997,572 a a. Measures of Sampling Adequacy(MSA)
10 123 Lampiran 4 (Lanjutan) : Output SPSS Uji Faktor Hasil Akhir Uji Faktor KMO and Bartlett's Test Kaiser-Meyer-Olkin Measure of Sampling,548 Adequacy. Approx. Chi-Square 51,000 Bartlett's Test of df 15 Sphericity Sig.,000 Anti-image Covariance Anti-image Correlation Anti-image Matrices ROA MTBR FAR QCR KSI lnsls ROA,720 -,169,082 -,225 -,128 -,231 MTBR -,169,862,096,124 -,109 -,092 FAR,082,096,820,198,103,159 QCR -,225,124,198,839,087,102 KSI -,128 -,109,103,087,887,237 lnsls -,231 -,092,159,102,237,772 ROA,592 a -,215,107 -,289 -,160 -,309 MTBR -,215,623 a,115,146 -,125 -,112 FAR,107,115,662 a,239,121,199 QCR -,289,146,239,453 a,100,127 KSI -,160 -,125,121,100,356 a,286 lnsls -,309 -,112,199,127,286,511 a a. Measures of Sampling Adequacy(MSA) Communalities Initial Extraction ROA 1,000,606 MTBR 1,000,667 FAR 1,000,508 QCR 1,000,810 KSI 1,000,826 lnsls 1,000,750 Extraction Method: Principal Component Analysis.
11 Reproduced Correlation Residual b Reproduced Correlations ROA MTBR FAR QCR KSI lnsls ROA,606 a,397 -,538,361,135,422 MTBR,397,667 a -,258 -,236,317,366 FAR -,538 -,258,508 a -,450 -,141 -,294 QCR,361 -,236 -,450,810 a -,016,012 KSI,135,317 -,141 -,016,826 a -,396 TRVSL,422,366 -,294,012 -,396,750 a ROA -,115,241 -,075 -,019 -,080 MTBR -,115,068,185 -,172 -,165 FAR,241,068,186,043,044 QCR -,075,185,186 -,017,012 KSI -,019 -,172,043 -,017,204 lnsls -,080 -,165,044,012,204 Extraction Method: Principal Component Analysis. a. Reproduced communalities b. Residuals are computed between observed and reproduced correlations. There are 10 (66,0%) nonredundant residuals with absolute values greater than 0.05.
12 125 Lampiran 5: Output SPSS Statistik Deskriptif Output SPSS Hasil Uji Statistik Deskriptif Descriptive Statistics N Range Minimum Maximum Mean Std. Deviation DER 84 26,8104, , ,0394 4, lnsls 84 8, , , ,0522 1, ROA 84,3616 -,1119,2497,2497, MTBR 84 13,1469, , ,3544 1, FAR 84,8142,0052,8194,8194, QCR 84 3,1686,1816 3,3502 3,3502, Valid N (listwise) 84
13 One-Sample Kolmogorov-Smirnov Test DER N 84 rmal Parameters a,b Std. 4, Mean 2, Deviation 4 Absolute,318 Most Extreme Positive,318 Differences Negative -,305 Kolmogorov-Smirnov Z 2,912 Asymp. Sig. (2-tailed),000 a. Test distribution is rmal. b. Calculated from data.

14 One-Sample Kolmogorov-Smirnov Test DER N 84 rmal Parameters a,b Std.,42115 Mean,9879 Deviation Absolute,071 Most Extreme Positive,071 Differences Negative -,046 Kolmogorov-Smirnov Z,649 Asymp. Sig. (2-tailed),793 a. Test distribution is rmal. b. Calculated from data.
15
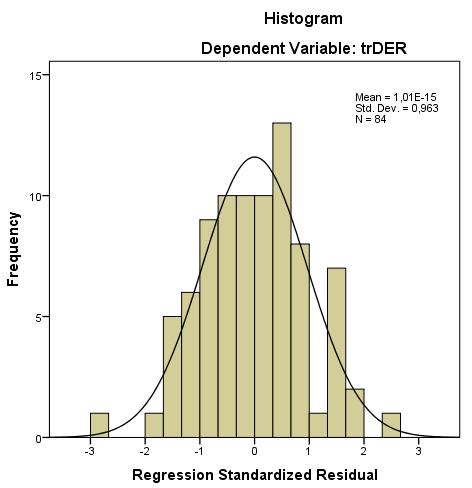
16 129 Lampiran 8(Lanjutan) : Output SPSS Ujirmalitas Uji rmalitas 3 One-Sample Kolmogorov-Smirnov Test RES_1 N 84 rmal Parameters a,b Std., Mean, Deviation 9 Absolute,057 Most Extreme Positive,057 Differences Negative -,044 Kolmogorov-Smirnov Z,526 Asymp. Sig. (2-tailed),945 a. Test distribution is rmal. b. Calculated from data.
17
18 131 Lampiran 9(Lanjutan) : Output SPSS UjiHeteroskedastisitas Uji Heteroskedastisitas 2 Correlations lnsls ROA MTBR FAR QCR KSI ABS Correlation 1,000,367 **,677 ** -,129,186,259 * -,080 lnsls Coefficient Sig. (2-tailed).,001,000,241,090,017,469 N Correlation,367 ** 1,000,430 ** -,336 **,432 **,117,004 ROA Coefficient Sig. (2-tailed),001.,000,002,000,289,969 N Correlation,677 **,430 ** 1,000 -,215 *,132,320 ** -,095 MTBR Coefficient Sig. (2-tailed),000,000.,050,233,003,390 N Correlation -,129 -,336 ** -,215 * 1,000 -,302 ** -,151,114 Spearman's Coefficient FAR rho Sig. (2-tailed),241,002,050.,005,171,302 N Correlation,186,432 **,132 -,302 ** 1,000 -,017,112 QCR Coefficient Sig. (2-tailed),090,000,233,005.,878,309 N Correlation,259 *,117,320 ** -,151 -,017 1,000,116 KSI Coefficient Sig. (2-tailed),017,289,003,171,878.,292 N Correlation -,080,004 -,095,114,112,116 1,000 ABS Coefficient Sig. (2-tailed),469,969,390,302,309,292. N **. Correlation is significant at the 0.01 level (2-tailed). *. Correlation is significant at the 0.05 level (2-tailed).
19 132 Lampiran 10: Output SPSS UjiMultikolinearitas Uji Multikolinearitas 1 Model 1 Collinearity Statistics Tolerance VIF (Constant) lnsls,750 1,333 ROA,722 1,385 MTBR,788 1,269 FAR,845 1,183 QCR,852 1,174 KSI,950 1,052 Uji Multikolinearitas 2 Coefficient Correlations a Model KSI QCR MTBR FAR lnsls ROA KSI 1,000,062 -,052,079 -,127 -,035 QCR,062 1,000,143,215,037 -,263 Correlations MTBR -,052,143 1,000,164 -,312 -,144 FAR,079,215,164 1,000 -,099,202 lnsls -,127,037 -,312 -,099 1,000 -,305 1 ROA -,035 -,263 -,144,202 -,305 1,000 KSI,023,001,000,002,000 -,003 QCR,001,003,000,002,000 -,008 Covariances MTBR,000,000,000,001,000 -,001 FAR,002,002,001,031,000,017 lnsls,000,000,000,000,000 -,003 ROA -,003 -,008 -,001,017 -,003,244 a. Dependent Variable: trder
20 133 Lampiran 11 : Output SPSS UjiAutokorelasi Uji Autokorelasi Model Summary b Model Durbin-Watson 1 1,542 a. Predictors: (Constant), KSI, QCR, MTBR, FAR, lnsls, ROA b. Dependent Variable: trder
21 134 Lampiran 12: Output SPSS UjiHipotesis Variables Entered/Removed a Model Variables Entered Variables Removed Method KSI, QCR, MTBR,. Enter 1 FAR, lnsls, ROA b a. Dependent Variable: trder b. All requested variables entered. Model Summary b Model R R Square Adjusted R Square Std. Error of the Estimate 1,771 a,594,563, a. Predictors: (Constant), KSI, QCR, MTBR, FAR, lnsls, ROA b. Dependent Variable: trder ANOVA a Model Sum of Squares df Mean Square F Sig. Regression 8, ,459 18,814,000 b 1 Residual 5,970 77,078 Total 14, a. Dependent Variable: trder b. Predictors: (Constant), KSI, QCR, MTBR, FAR, lnsls, ROA
22 135 Lampiran 12 (Lanjutan) : Output SPSS UjiHipotesis Coefficients a Model Unstandardized Coefficients Standardized Coefficients t Sig. B Std. Error Beta (Constant) 1,203,273 4,414,000 lnsls -,067,019 -,303-3,619,001 ROA 3,242,494,561 6,563,000 1 MTBR -,006,018 -,028 -,344,731 FAR,615,175,277 3,504,001 QCR,358,059,480 6,100,000 KSI -,107,152 -,053 -,705,483 a. Dependent Variable: trder Residuals Statistics a Minimum Maximum Mean Std. Deviation Predicted Value, ,784675,987866, Std. Predicted Value -2,034 2,454,000 1, Standard Error of,039,221,076, Predicted Value Adjusted Predicted Value, ,909712,986643, Residual -, , , , Std. Residual -2,904 2,559,000, Stud. Residual -3,008 2,632,002 1, Deleted Residual -, , , , Stud. Deleted Residual -3,181 2,741,002 1, Mahal. Distance,600 51,361 5,929 6, Cook's Distance,000,141,014, Centered Leverage Value,007,619,071, a. Dependent Variable: trder N
Lampiran 1. Daftar Perusahaan. Hasil dari pemilihan sampel dengan kriteria tertentu adalah sebagai berikut:
 Lampiran 1. Daftar Perusahaan Hasil dari pemilihan sampel dengan kriteria tertentu adalah sebagai berikut: NO KODE NAMA PERUSAHAAN 1. AISA Tiga Pilar Sejahtera Food 2. ALMI Alumindo Light Metal Industry
APPENDIX 1 DAFTAR POPULASI DAN SAMPEL TAHUN
 APPENDIX 1 DAFTAR POPULASI DAN SAMPEL TAHUN 2011-2013 No Nama Perusahaan Kode Kriteria Kriteria Kriteri Kriteria Sampel 1 2 a 3 4 1. Agung Podomoro Land APLN 2. Alam Sutera Reality ASRI 3. Bekasi Asri
Lampiran 1. Surat Uji Coba Penelitian dari Fakultas. Lampiran 2. Expert Judgement
 57 Lampiran 1. Surat Uji Coba Penelitian dari Fakultas Lampiran 2. Expert Judgement 58 59 Lanjutan Lampiran 2. 60 Lanjutan Lampiran 2. 61 Lanjutan lampiran 2. 62 Lanjutan lampiran 2. 63 Lanjutan lampiran
LAMPIRAN A UJI VALIDITAS DAN RELIABILITAS
 LAMPIRAN A UJI VALIDITAS DAN RELIABILITAS Validitas Komitmen Karyawan Scale Mean if Item Deleted Scale Variance if Item Deleted Corrected Item- Total Correlation Cronbach's Alpha if Item Deleted Item01
LAMPIRAN. Lampiran 1 Data Sampel Penelitian
 LAMPIRAN Lampiran 1 Data Sampel Penelitian Variabel Audit Tenure pada Perusahaan Sampel NO KODE 2011 2012 2013 1 APLN (BING HARIANTO,SE) 1 (ALVIN ISMARTO) 1 (ALVIN ISMARTO) 2 2 ASRI (HIDAJAT RAHARDJO )1
Case Processing Summary. Cases Valid Missing Total N Percent N Percent N Percent % 0 0.0% % % 0 0.0%
 GET FILE='C:\Users\acantrell\Desktop\demo5.sav'. DATASET NAME DataSet1 WINDOW=FRONT. EXAMINE VARIABLES=PASSYDSPG RUSHYDSPG /PLOT BOXPLOT HISTOGRAM /COMPARE GROUPS /STATISTICS DESCRIPTIVES /CINTERVAL 95
Universitas Sumatera Utara
 Crosstabs Kelompok Usia (thn) * Hiperplasia Crosstabulation Hiperplasia Simpleks Kompleks Total Kelompok Usia (thn) 40 Count 12 17 29 54,5% 77,3% 65,9% Total Count
DISMAS Evaluation: Dr. Elizabeth C. McMullan. Grambling State University
 DISMAS Evaluation 1 Running head: Project Dismas Evaluation DISMAS Evaluation: 2007 2008 Dr. Elizabeth C. McMullan Grambling State University DISMAS Evaluation 2 Abstract An offender notification project
One-factor ANOVA by example
 ANOVA One-factor ANOVA by example 2 One-factor ANOVA by visual inspection 3 4 One-factor ANOVA H 0 H 0 : µ 1 = µ 2 = µ 3 = H A : not all means are equal 5 One-factor ANOVA but why not t-tests t-tests?
Regression Analysis of Travel Indicators and Public Transport Usage in Urban Areas
 Regression Analysis of Travel Indicators and Public Transport Usage in Urban Areas M. Moeinaddini, Z. Asadi-Shekari, M. Zaly Shah, A. Hamzah Abstract Currently, planners try to have more green travel options
Principal component factor analysis-based NBA player comprehensive ability evaluation research
 Available online www.jocpr.com Journal of Chemical and Pharmaceutical Research, 014, 6(6):400-405 Research Article ISSN : 0975-7384 CODEN(USA) : JCPRC5 Principal component factor analysis-based NBA player
Stats 2002: Probabilities for Wins and Losses of Online Gambling
 Abstract: Jennifer Mateja Andrea Scisinger Lindsay Lacher Stats 2002: Probabilities for Wins and Losses of Online Gambling The objective of this experiment is to determine whether online gambling is a
Driv e accu racy. Green s in regul ation
 LEARNING ACTIVITIES FOR PART II COMPILED Statistical and Measurement Concepts We are providing a database from selected characteristics of golfers on the PGA Tour. Data are for 3 of the players, based
Navigate to the golf data folder and make it your working directory. Load the data by typing
 Golf Analysis 1.1 Introduction In a round, golfers have a number of choices to make. For a particular shot, is it better to use the longest club available to try to reach the green, or would it be better
Lecture 22: Multiple Regression (Ordinary Least Squares -- OLS)
") Statistics 22_multiple_regression.pdf Michael Hallstone, Ph.D. hallston@hawaii.edu Lecture 22: Multiple Regression (Ordinary Least Squares -- OLS) Some Common Sense Assumptions for Multiple Regression
Statistics 22_multiple_regression.pdf Michael Hallstone, Ph.D. hallston@hawaii.edu Lecture 22: Multiple Regression (Ordinary Least Squares -- OLS) Some Common Sense Assumptions for Multiple Regression
Journal of Human Sport and Exercise E-ISSN: Universidad de Alicante España
 Journal of Human Sport and Exercise E-ISSN: 1988-5202 jhse@ua.es Universidad de Alicante España SOÓS, ISTVÁN; FLORES MARTÍNEZ, JOSÉ CARLOS; SZABO, ATTILA Before the Rio Games: A retrospective evaluation
Statistical Analysis of PGA Tour Skill Rankings USGA Research and Test Center June 1, 2007
 Statistical Analysis of PGA Tour Skill Rankings 198-26 USGA Research and Test Center June 1, 27 1. Introduction The PGA Tour has recorded and published Tour Player performance statistics since 198. All
Announcements. % College graduate vs. % Hispanic in LA. % College educated vs. % Hispanic in LA. Problem Set 10 Due Wednesday.
 Announcements Announcements UNIT 7: MULTIPLE LINEAR REGRESSION LECTURE 1: INTRODUCTION TO MLR STATISTICS 101 Problem Set 10 Due Wednesday Nicole Dalzell June 15, 2015 Statistics 101 (Nicole Dalzell) U7
Keywords: multiple linear regression; pedestrian crossing delay; right-turn car flow; the number of pedestrians;
 Available online at www.sciencedirect.com ScienceDirect Procedia - Social and Behavioral Scien ce s 96 ( 2013 ) 1997 2003 13th COTA International Conference of Transportation Professionals (CICTP 2013)
INFLUENCE OF ENVIRONMENTAL PARAMETERS ON FISHERY
 Chapter 5 INFLUENCE OF ENVIRONMENTAL PARAMETERS ON FISHERY 5. Introduction Environmental factors contribute to the population dynamics and abundance of marine fishery. The relationships between weather,
Table 4.1: Descriptive Statistics for FAAM 26-Item ADL Subscale
 Table 4.1: Descriptive Statistics for FAAM 26-Item ADL Subscale Item Content Number missing Mean Median SD Skewness (Std. Error) Kurtosis (Std. Error) 1) Standing 52(5.3%) 2.74 3 1.09-0.55(.078) -0.41(.16)
Cross-Cultural adaptation and assessment of the reliability and validity of the Thai Hill-Bone Compliance to High Blood Pressure Therapy Scale
 Cross-Cultural adaptation and assessment of the reliability and validity of the Thai Hill-Bone Compliance to High Blood Pressure Therapy Scale Sakuntala Anuruang RN, BNS, MNS, PhD Candidate UTS:HEALTH
Journal of Chemical and Pharmaceutical Research, 2014, 6(6): Research Article
: Research Article") Available online www.jocpr.com Journal of Chemical and Pharmaceutical Research, 2014, 6(6):2751-2755 Research Article ISSN : 0975-7384 CODEN(USA) : JCPRC5 An Empirical Study on Influencing Factors of Cheerleading
Available online www.jocpr.com Journal of Chemical and Pharmaceutical Research, 2014, 6(6):2751-2755 Research Article ISSN : 0975-7384 CODEN(USA) : JCPRC5 An Empirical Study on Influencing Factors of Cheerleading
Section I: Multiple Choice Select the best answer for each problem.
 Inference for Linear Regression Review Section I: Multiple Choice Select the best answer for each problem. 1. Which of the following is NOT one of the conditions that must be satisfied in order to perform
Chapter 12 Practice Test
 Chapter 12 Practice Test 1. Which of the following is not one of the conditions that must be satisfied in order to perform inference about the slope of a least-squares regression line? (a) For each value
y ) s x x )(y i (x i r = 1 n 1 s y Statistics Lecture 7 Exploring Data , y 2 ,y n (x 1 ),,(x n ),(x 2 ,y 1 How two variables vary together
 s x x )(y i (x i r = 1 n 1 s y Statistics Lecture 7 Exploring Data , y 2 ,y n (x 1 ),,(x n ),(x 2 ,y 1 How two variables vary together") Statistics 111 - Lecture 7 Exploring Data Numerical Summaries for Relationships between Variables Administrative Notes Homework 1 due in recitation: Friday, Feb. 5 Homework 2 now posted on course website:
Statistics 111 - Lecture 7 Exploring Data Numerical Summaries for Relationships between Variables Administrative Notes Homework 1 due in recitation: Friday, Feb. 5 Homework 2 now posted on course website:
Preliminary statistical analysis of. the international eventing. results 2013
 Lausanne 28/1/14 Preliminary statistical analysis of the international eventing results 2013 Overview of the talk Statistical analysis The data The statistical technique Analysis of the falls data (related
Lab 11: Introduction to Linear Regression
 Lab 11: Introduction to Linear Regression Batter up The movie Moneyball focuses on the quest for the secret of success in baseball. It follows a low-budget team, the Oakland Athletics, who believed that
Announcements. Lecture 19: Inference for SLR & Transformations. Online quiz 7 - commonly missed questions
 Announcements Announcements Lecture 19: Inference for SLR & Statistics 101 Mine Çetinkaya-Rundel April 3, 2012 HW 7 due Thursday. Correlation guessing game - ends on April 12 at noon. Winner will be announced
Introduction to Analysis of Variance (ANOVA) The Structural Model, The Summary Table, and the One- Way ANOVA
 The Structural Model, The Summary Table, and the One- Way ANOVA") Introduction to Analysis of Variance (ANOVA) The Structural Model, The Summary Table, and the One- Way ANOVA Limitations of the t-test Although the t-test is commonly used, it has limitations Can only
Introduction to Analysis of Variance (ANOVA) The Structural Model, The Summary Table, and the One- Way ANOVA Limitations of the t-test Although the t-test is commonly used, it has limitations Can only
ISDS 4141 Sample Data Mining Work. Tool Used: SAS Enterprise Guide
 ISDS 4141 Sample Data Mining Work Taylor C. Veillon Tool Used: SAS Enterprise Guide You may have seen the movie, Moneyball, about the Oakland A s baseball team and general manager, Billy Beane, who focused
Midterm Exam 1, section 2. Thursday, September hour, 15 minutes
 San Francisco State University Michael Bar ECON 312 Fall 2018 Midterm Exam 1, section 2 Thursday, September 27 1 hour, 15 minutes Name: Instructions 1. This is closed book, closed notes exam. 2. You can
Legendre et al Appendices and Supplements, p. 1
 Legendre et al. 2010 Appendices and Supplements, p. 1 Appendices and Supplement to: Legendre, P., M. De Cáceres, and D. Borcard. 2010. Community surveys through space and time: testing the space-time interaction
Distancei = BrandAi + 2 BrandBi + 3 BrandCi + i
 . Suppose that the United States Golf Associate (USGA) wants to compare the mean distances traveled by four brands of golf balls when struck by a driver. A completely randomized design is employed with
Rice Yield And Dangue Haemorrhagic Fever(DHF) Condition depend upon Climate Data
 Condition depend upon Climate Data") Rice Yield And Dangue Haemorrhagic Fever(DHF) Condition depend upon Climate Data Dr Lai Lai Aung, Assistant Director( Met Service) Dr Khaing Khaing Soe Assistant Director(Public Health) Dr Thin Nwe htwe
Rice Yield And Dangue Haemorrhagic Fever(DHF) Condition depend upon Climate Data Dr Lai Lai Aung, Assistant Director( Met Service) Dr Khaing Khaing Soe Assistant Director(Public Health) Dr Thin Nwe htwe
Analysis of Variance. Copyright 2014 Pearson Education, Inc.
 Analysis of Variance 12-1 Learning Outcomes Outcome 1. Understand the basic logic of analysis of variance. Outcome 2. Perform a hypothesis test for a single-factor design using analysis of variance manually
Dutch Disease, Deindustrialization and Employment in South America Roberto Frenkel
 Dutch Disease, Deindustrialization and Employment in South America Roberto Frenkel Principal Research Associate at CEDES and Honorary Professor, University of Buenos Aires 300 Real bilateral exchange rates
Running head: DATA ANALYSIS AND INTERPRETATION 1
 Running head: DATA ANALYSIS AND INTERPRETATION 1 Data Analysis and Interpretation Final Project Vernon Tilly Jr. University of Central Oklahoma DATA ANALYSIS AND INTERPRETATION 2 Owners of the various
Transportation Research Forum
 Transportation Research Forum Modeling through Traffic Speed at Roundabouts along Urban and Suburban Street Arterials Author(s): Bashar H. Al-Omari, Khalid A. Ghuzlan, and Lina B. Al-Helo Source: Journal
ANALYSIS OF THE DOMINATING POWER OF SERVICE RECEPTION IN VOLLEYBALL IN DIFFERENT LEVELS OF COMPETITIONS
 ANALYSIS OF THE DOMINATING POWER OF SERVICE RECEPTION IN VOLLEYBALL IN DIFFERENT LEVELS OF COMPETITIONS 1 SANJIB GHOSH 2 DR. MAHESH SWETA 1 Research scholar, department of Physical Education, Visva-Bharati,
D1.2 REPORT ON MOTORCYCLISTS IMPACTS WITH ROAD INFRASTRUCTURE BASED OF AN INDEPTH INVESTIGATION OF MOTORCYCLE ACCIDENTS
 WP 1 D1.2 REPORT ON MOTORCYCLISTS IMPACTS WITH ROAD INFRASTRUCTURE BASED OF AN INDEPTH INVESTIGATION OF MOTORCYCLE ACCIDENTS Project Acronym: Smart RRS Project Full Title: Innovative Concepts for smart
ASTERISK OR EXCLAMATION POINT?: Power Hitting in Major League Baseball from 1950 Through the Steroid Era. Gary Evans Stat 201B Winter, 2010
 ASTERISK OR EXCLAMATION POINT?: Power Hitting in Major League Baseball from 1950 Through the Steroid Era by Gary Evans Stat 201B Winter, 2010 Introduction: After a playerʼs strike in 1994 which resulted
Biostatistics & SAS programming
 Biostatistics & SAS programming Kevin Zhang March 6, 2017 ANOVA 1 Two groups only Independent groups T test Comparison One subject belongs to only one groups and observed only once Thus the observations
27Quantify Predictability U10L9. April 13, 2015
 1 QUANTIFYING PREDICTABILITY Exercise #1: Make sure that your calculator has its r value on. 2 Exercise #2: In the following exercises four data sets with equal x values are given to illustrate different
A study evaluating if targeted training for startle effect can improve pilot reactions in handling unexpected situations. DR. MICHAEL GILLEN, PH.D.
 A study evaluating if targeted training for startle effect can improve pilot reactions in handling unexpected situations. DR. MICHAEL GILLEN, PH.D. Disclaimer I would like to thank the FSF, United Airlines,
Tourism impacts from major sports events Visiting previous host destinations or future events
 Tourism impacts from major sports events Visiting previous host destinations or future events Harry Arne Solberg and Arne M. Ulvnes Trondheim Business School Do major sports events create tourism impacts?
A Quantitative Impact Analysis of Attitudes towards Safety and Traffic on High School Students Walking to School
 Journal of Geotechnical and Transportation Engineering Volume 3 Issue 1 A Quantitative Impact Analysis of Attitudes towards Firouzi and Mamdoohi Received 10/3/2016 Accepted 5/11/2017 Published 6/27/2017
Sports Predictive Analytics: NFL Prediction Model
 Sports Predictive Analytics: NFL Prediction Model By Dr. Ash Pahwa IEEE Computer Society San Diego Chapter January 17, 2017 Copyright 2017 Dr. Ash Pahwa 1 Outline Case Studies of Sports Analytics Sports
The probability of winning a high school football game.
 Columbus State University CSU epress Faculty Bibliography 2008 The probability of winning a high school football game. Jennifer Brown Follow this and additional works at: http://csuepress.columbusstate.edu/bibliography_faculty
Predictors for Winning in Men s Professional Tennis
 Predictors for Winning in Men s Professional Tennis Abstract In this project, we use logistic regression, combined with AIC and BIC criteria, to find an optimal model in R for predicting the outcome of
How to Win in the NBA Playoffs: A Statistical Analysis
 How to Win in the NBA Playoffs: A Statistical Analysis Michael R. Summers Pepperdine University Professional sports teams are big business. A team s competitive success is just one part of the franchise
Unit 4: Inference for numerical variables Lecture 3: ANOVA
 Unit 4: Inference for numerical variables Lecture 3: ANOVA Statistics 101 Thomas Leininger June 10, 2013 Announcements Announcements Proposals due tomorrow. Will be returned to you by Wednesday. You MUST
Predicting the use of the Sacrifice Bunt in Major League Baseball. Charlie Gallagher Brian Gilbert Neelay Mehta Chao Rao
 Predicting the use of the Sacrifice Bunt in Major League Baseball Charlie Gallagher Brian Gilbert Neelay Mehta Chao Rao Understanding the Data Data from the St. Louis Cardinals Sig Mejdal, Senior Quantitative
DEVELOPMENT OF TRAFFIC ACCIDENT PREDICTION MODELS BY TRAFFIC AND ROAD CHARACTERISTICS IN URBAN AREAS
 DEVELOPMENT OF TRAFFIC ACCIDENT PREDICTION MODELS BY TRAFFIC AND ROAD CHARACTERISTICS IN URBAN AREAS Dahee Hong Master Course Dept. of Transportation Engineering University of Seoul 90 Jeonnong-dong, Dongdaemun-gu,
Journal of Chemical and Pharmaceutical Research, 2014, 6(3): Research Article
: Research Article") Available online www.jocpr.com Journal of Chemical and Pharmaceutical Research 2014 6(3):304-309 Research Article ISSN : 0975-7384 CODEN(USA) : JCPRC5 World men sprint event development status research
Available online www.jocpr.com Journal of Chemical and Pharmaceutical Research 2014 6(3):304-309 Research Article ISSN : 0975-7384 CODEN(USA) : JCPRC5 World men sprint event development status research
Copy of my report. Why am I giving this talk. Overview. State highway network
 Road Surface characteristics and traffic accident rates on New Zealand s state highway network Robert Davies Statistics Research Associates http://www.statsresearch.co.nz Copy of my report There is a copy
CS 7641 A (Machine Learning) Sethuraman K, Parameswaran Raman, Vijay Ramakrishnan
 Sethuraman K, Parameswaran Raman, Vijay Ramakrishnan") CS 7641 A (Machine Learning) Sethuraman K, Parameswaran Raman, Vijay Ramakrishnan Scenario 1: Team 1 scored 200 runs from their 50 overs, and then Team 2 reaches 146 for the loss of two wickets from their
CS 7641 A (Machine Learning) Sethuraman K, Parameswaran Raman, Vijay Ramakrishnan Scenario 1: Team 1 scored 200 runs from their 50 overs, and then Team 2 reaches 146 for the loss of two wickets from their
Pearson Edexcel Level 3 GCE Psychology Advanced Subsidiary Paper 2: Biological Psychology and Learning Theories
 Write your name here Surname Other names Centre Number Candidate Number Pearson Edexcel Level 3 GCE Psychology Advanced Subsidiary Paper 2: Biological Psychology and Learning Theories Monday 23 May 2016
Accident data analysis using Statistical methods A case study of Indian Highway
 Accident data analysis using Statistical methods A case study of Indian Highway Rahul Badgujar 1, Priyam Mishra 2, Mayank Chandra 3, Sayali Sandbhor 4, Humera Khanum 5 1,2,3 Undergraduate scholars, Department
The Reliability of Intrinsic Batted Ball Statistics Appendix
 The Reliability of ntrinsic Batted Ball Statistics Appendix Glenn Healey, EECS Department University of California, rvine, CA 92617 Given information about batted balls for a set of players, we review
Building an NFL performance metric
 Building an NFL performance metric Seonghyun Paik (spaik1@stanford.edu) December 16, 2016 I. Introduction In current pro sports, many statistical methods are applied to evaluate player s performance and
Guide to Computing Minitab commands used in labs (mtbcode.out)
") Guide to Computing Minitab commands used in labs (mtbcode.out) A full listing of Minitab commands can be found by invoking the HELP command while running Minitab. A reference card, with listing of available
Guide to Computing Minitab commands used in labs (mtbcode.out) A full listing of Minitab commands can be found by invoking the HELP command while running Minitab. A reference card, with listing of available
Modification of Webster s delay formula under non-lane based heterogeneous road traffic condition
 Journal of Civil Engineering (IEB), 35 () (007) 81-9 Modification of Webster s delay formula under non-lane based heterogeneous road traffic condition Md. Shamsul Hoque and Md. Asif Imran 1 Department
Designing a Bicycle and Pedestrian Count Program in Blacksburg, VA
 Designing a Bicycle and Pedestrian Count Program in Blacksburg, VA Steve Hankey (Virginia Tech) Andrew Mondschein (U or Virginia) Ralph Buehler (Virginia Tech) Issue/objective Issue No systematic traffic
HSIS. Association of Selected Intersection Factors With Red-Light-Running Crashes. State Databases Used SUMMARY REPORT
 HSIS HIGHWAY SAFETY INFORMATION SYSTEM The Highway Safety Information Systems (HSIS) is a multi-state safety data base that contains accident, roadway inventory, and traffic volume data for a select group
Multilevel Models for Other Non-Normal Outcomes in Mplus v. 7.11
 Multilevel Models for Other Non-Normal Outcomes in Mplus v. 7.11 Study Overview: These data come from a daily diary study that followed 41 male and female college students over a six-week period to examine
Prokopios Chatzakis, National and Kapodistrian University of Athens, Faculty of Physical Education and Sport Science 1
 Differences between geographic areas (continents) in the distribution of medals at the Beijing Olympic Games 2008 and at the London Olympic Games. Prokopios Chatzakis, National and Kapodistrian University
Session 2: Introduction to Multilevel Modeling Using SPSS
 Session 2: Introduction to Multilevel Modeling Using SPSS Exercise 1 Description of Data: exerc1 This is a dataset from Kasia Kordas s research. It is data collected on 457 children clustered in schools.
NAME: Math 403 Final Exam 12/10/08 15 questions, 150 points. You may use calculators and tables of z, t values on this exam.
 NAME: Math 403 Final Exam 12/10/08 15 questions, 150 points. You may use calculators and tables of z, t values on this exam. (10 pts) 1. Barry Bonds' home run totals for each year of his career ('86-'07):
Novel empirical correlations for estimation of bubble point pressure, saturated viscosity and gas solubility of crude oils
 86 Pet.Sci.(29)6:86-9 DOI 1.17/s12182-9-16-x Novel empirical correlations for estimation of bubble point pressure, saturated viscosity and gas solubility of crude oils Ehsan Khamehchi 1, Fariborz Rashidi
Title: Modeling Crossing Behavior of Drivers and Pedestrians at Uncontrolled Intersections and Mid-block Crossings
 Title: Modeling Crossing Behavior of Drivers and Pedestrians at Uncontrolled Intersections and Mid-block Crossings Objectives The goal of this study is to advance the state of the art in understanding
Is lung capacity affected by smoking, sport, height or gender. Table of contents
 Sample project This Maths Studies project has been graded by a moderator. As you read through it, you will see comments from the moderator in boxes like this: At the end of the sample project is a summary
Math SL Internal Assessment What is the relationship between free throw shooting percentage and 3 point shooting percentages?
 Math SL Internal Assessment What is the relationship between free throw shooting percentage and 3 point shooting percentages? fts6 Introduction : Basketball is a sport where the players have to be adept
This file is part of the following reference:
 This file is part of the following reference: Hancock, Timothy Peter (2006) Multivariate consensus trees: tree-based clustering and profiling for mixed data types. PhD thesis, James Cook University. Access
Data Set 7: Bioerosion by Parrotfish Background volume of bites The question:
 Data Set 7: Bioerosion by Parrotfish Background Bioerosion of coral reefs results from animals taking bites out of the calcium-carbonate skeleton of the reef. Parrotfishes are major bioerosion agents,
DEVELOPMENT OF A SET OF TRIP GENERATION MODELS FOR TRAVEL DEMAND ESTIMATION IN THE COLOMBO METROPOLITAN REGION
 DEVELOPMENT OF A SET OF TRIP GENERATION MODELS FOR TRAVEL DEMAND ESTIMATION IN THE COLOMBO METROPOLITAN REGION Ravindra Wijesundera and Amal S. Kumarage Dept. of Civil Engineering, University of Moratuwa
Consumer behaviour and the welfare eects of gambling in
 Consumer behaviour and the welfare eects of gambling in Finland Preliminary results University of Turku September 16, 2016 1 Introduction Gambling as utility creating activity Problem gambling Gambling
PREDICTIVE CONTRIBUTION OF MORPHOLOGICAL CHARACTERISTICS AND MOTOR ABILITIES ON THE RESULT OF RUNNING THE 60m HURDLES IN BOYS AGED YEARS 1
 International Journal of Science Culture and Sport June 2014; 2(2) ISSN : 2148-1148 Doi : 10.14486/IJSCS84 PREDICTIVE CONTRIBUTION OF MORPHOLOGICAL CHARACTERISTICS AND MOTOR ABILITIES ON THE RESULT OF
Depth Conversion with ISMap
 Depth Conversion with ISMap Brian Russell July 5, 2012 Introduction This article will compare two different approaches to depth conversion between measured well depths and a map of seismic two-way travel-time
PREDICTING OUTCOMES OF NBA BASKETBALL GAMES
 PREDICTING OUTCOMES OF NBA BASKETBALL GAMES A Thesis Submitted to the Graduate Faculty of the North Dakota State University of Agriculture and Applied Science By Eric Scot Jones In Partial Fulfillment
Setting up group models Part 1 NITP, 2011
 Setting up group models Part 1 NITP, 2011 What is coming up Crash course in setting up models 1-sample and 2-sample t-tests Paired t-tests ANOVA! Mean centering covariates Identifying rank deficient matrices
This page intentionally left blank
 PART III BASKETBALL This page intentionally left blank 28 BASKETBALL STATISTICS 101 The Four- Factor Model For each player and team NBA box scores track the following information: two- point field goals
Example 1: One Way ANOVA in MINITAB
 Example : One Way ANOVA in MINITAB A consumer group wants to compare a new brand of wax (Brand-X) to two leading brands (Sureglow and Microsheen) in terms of Effectiveness of wax. Following data is collected
Strategy of Infra-Structure Development on. Junction Road Network in Karanglo for Handling. Congestion of Lawang-Malang-East Java
 Contemporary Engineering Sciences, Vol. 10, 2017, no. 7, 335-343 HIKARI Ltd, www.m-hikari.com https://doi.org/10.12988/ces.2017.713 Strategy of Infra-Structure Development on Junction Road Network in Karanglo
Statistical Analysis on Relationship between Muhammadiyah Growths in and its Heritage
 International Journal of Applied Business and Information Systems ISSN: 2597-8993 Vol 1, No 2, September 2017, pp. 26-33 26 Statistical Analysis on Relationship between Growths in 1912 1964 and its Heritage
IMPROVING MOBILITY PERFORMANCE IN WHEELCHAIR BASKETBALL
 IMPROVING MOBILITY PERFORMANCE IN WHEELCHAIR BASKETBALL MARCO HOOZEMANS THOM VEEGER MONIQUE BERGER RIENK VAN DER SLIKKE DIRKJAN VEEGER ANNEMARIE DE WITTE INTRODUCTION Mobility performance in wheelchair
GENETICS OF RACING PERFORMANCE IN THE AMERICAN QUARTER HORSE: II. ADJUSTMENT FACTORS AND CONTEMPORARY GROUPS 1'2
 GENETICS OF RACING PERFORMANCE IN THE AMERICAN QUARTER HORSE: II. ADJUSTMENT FACTORS AND CONTEMPORARY GROUPS 1'2 S. T. Buttram 3, R. L. Willham 4 and D. E. Wilson 4 Iowa State University, Ames 50011 ABSTRACT
The latent structure of standard game efficiency indicators in basketball.
 The latent structure of standard game efficiency indicators in basketball. Goran Sporiš 1, Jurica Šango 2, Vlatko Vučetić 1 and Tonči Mašina 2 1 Faculty of Kinesiology, Zagreb University, Croatia 2 Basketball
Regression Analysis of Success in Major League Baseball
 University of South Carolina Scholar Commons Senior Theses Honors College Spring 5-5-2016 Regression Analysis of Success in Major League Baseball Johnathon Tyler Clark University of South Carolina - Columbia
a) List and define all assumptions for multiple OLS regression. These are all listed in section 6.5
 List and define all assumptions for multiple OLS regression. These are all listed in section 6.5") Prof. C. M. Dalton ECN 209A Spring 2015 Practice Problems (After HW1, HW2, before HW3) CORRECTED VERSION Question 1. Draw and describe a relationship with heteroskedastic errors. Support your claim with
Prof. C. M. Dalton ECN 209A Spring 2015 Practice Problems (After HW1, HW2, before HW3) CORRECTED VERSION Question 1. Draw and describe a relationship with heteroskedastic errors. Support your claim with
BODY FORM INFLUENCES ON THE DRAG EXPERIENCED BY JUNIOR SWIMMERS. Australia, Perth, Australia
 1 BODY FORM INFLUENCES ON THE DRAG EXPERIENCED BY JUNIOR SWIMMERS Andrew Lyttle 1, Nat Benjanuvatra 2, Brian A Blanksby 2, Bruce C Elliott 2 1 Western Australian Institute of Sport, Perth, Australia 2
Lesson 14: Modeling Relationships with a Line
 Exploratory Activity: Line of Best Fit Revisited 1. Use the link http://illuminations.nctm.org/activity.aspx?id=4186 to explore how the line of best fit changes depending on your data set. A. Enter any
Computationally Efficient Determination of Long Term Extreme Out-of-Plane Loads for Offshore Turbines
 Computationally Efficient Determination of Long Term Extreme Out-of-Plane Loads for Offshore Turbines Anand Natarajan Senior Scientist Wind Energy Department, Risø DTU Denmark Introduction IEC 61400-1
Evaluation of n-situ easurement ethods for ir ermeability of indows
 Evaluation of n-situ easurement ethods for ir ermeability of indows Christoph Geyer, Andreas Müller, Barbara Wehle, Martin Greiner, Pascal Urech Research and Development; Architecture, Wood and Civil Engineering
OBSERVED VARIABILITY IN OIL SARDINE AND MACKEREL FISHERY OF SOUTHWEST COAST OF INDIA STATISTICAL APPROACH
 Observed Variability in Oil Sardine and Mackerel Fishery of Southwest Coast of India Statistical Approach Chapter 4 OBSERVED VARIABILITY IN OIL SARDINE AND MACKEREL FISHERY OF SOUTHWEST COAST OF INDIA
AN EXPLORATION OF SELF-EFFICACY AS A MOTIVATION FOR ROCK CLIMBING AND ITS IMPACT ON FREQUENCY OF CLIMBS
 AN EXPLORATION OF SELF-EFFICACY AS A MOTIVATION FOR ROCK CLIMBING AND ITS IMPACT ON FREQUENCY OF CLIMBS Edwin Gómez, Ph.D. Associate Professor 111 Spong Hall ESPER Department, Recreation & Tourism Studies
Pengujian Total Fenol
 LAMPIRAN Lampiran 1. Dokumentasi Penelitian a. Preparasi sampel Persiapan alat dan bahan Pemotongan bahan b. Analisis proksimat Penimbangan sampel Analisis kadar lemak Analisis kadar protein Analisis abu
CHAPTER ANALYSIS AND INTERPRETATION Average total number of collisions for a try to be scored
 CHAPTER 8 8.1 ANALYSIS AND INTERPRETATION As mentioned in the previous chapter, four key components have been identified as indicators of the level of significance of dominant collisions when evaluating
EXST7015: Salaries of all American league baseball players (1994) Salaries in thousands of dollars RAW DATA LISTING
 Salaries in thousands of dollars RAW DATA LISTING") ANOVA & Design Randomized Block Design Page 1 1 **EXAMPLE 1******************************************************; 2 *** The 1994 salaries of all American league baseball players ***; 3 *** as reported
ANOVA & Design Randomized Block Design Page 1 1 **EXAMPLE 1******************************************************; 2 *** The 1994 salaries of all American league baseball players ***; 3 *** as reported
Chapter 2: ANOVA and regression. Caroline Verhoeven
 Chapter 2: ANOVA and regression Caroline Verhoeven Table of contents 1 ANOVA One-way ANOVA Repeated measures ANOVA Two-way ANOVA 2 Regression Simple linear regression Multiple regression 3 Conclusion Caroline