Lampiran 1. Daftar Perusahaan. Hasil dari pemilihan sampel dengan kriteria tertentu adalah sebagai berikut:
|
|
|
- Clara Burns
- 5 years ago
- Views:
Transcription
1 Lampiran 1. Daftar Perusahaan Hasil dari pemilihan sampel dengan kriteria tertentu adalah sebagai berikut: NO KODE NAMA PERUSAHAAN 1. AISA Tiga Pilar Sejahtera Food 2. ALMI Alumindo Light Metal Industry 3. AMFG Asahimas Flat Glass 4. ARNA Arwana Citramulia 5. ASII Astra International 6. AUTO Astra Otoparts 7. CPIN Charoen Pokphand Indonesia 8. DLTA Delta Djakarta 9. DVLA Darya-Varia Laboratoria 10. EKAD Ekadharma International 11. GDYR Goodyear Indonesia 12. GGRM Gudang Garam 13. GJTL Gajah Tunggal 14. HMSP HM Sampoerna 15. ICBP Indofood CBP Sukses Makmur 16. IGAR Champion Pacific Indonesia 17. IKBI Sumi Indo Kabel 18. IMAS Indomobil Sukses Internasional 19. INDF Indofood Sukses Makmur 20. INDS Indospring 21. INTP Indocement Tunggal Prakarsa 22. IPOL Indopoly Swakarsa Industry 23. JPFA JAPFA Comfeed Indonesia 24. KAEF Kimia Farma (Persero)
2 NO KODE NAMA PERUSAHAAN 25. KBLM Kabelindo Murni 26. KLBF Kalbe Farma 27. LION Lion Metal Works 28. LMSH Lionmesh Prima 29. MAIN Malindo Feedmill 30. MASA Multistrada Arah Sarana 31. MERK Merck 32. MLBI Multi Bintang Indonesia 33. MYOR Mayora Indah 34. PBRX Pan Brothers 35. ROTI Nippon Indosari Corpindo 36. SCCO Supreme Cable Manufacturing Corporation 37. SKLT Sekar Laut 38. SMCB Holcim Indonesia 39. SMGR Semen Gresik (Persero) 40. SMSM Selamat Sempurna 41. SQBB Taisho Pharmaceutical Indonesia 42. TCID Mandom Indonesia 43. TKIM Pabrik Kertas Tjiwi Kimia 44. TOTO Surya Toto Indonesia 45. TRST Trias Sentosa 46 TSPC Tempo Scan Pacific 47. UNIC Unggul Indah Cahaya 48. UNVR Unilever Indonesia
3 Lampiran 2. Data TAG (Keputusan Investasi), DER (Keputusan Pendanaan), DPR (Kebijakan Dividen), dan PBV (Nilai Perusahaan). Nama TAG DER DPR Perusahaan AISA 0,8536 0,0772 0,2982 0,9600 0,9000 1,1300 0,0856 0,2217 0,0754 ALMI 0,1911 0,0503 0,4627 2,4700 2,2000 3,1900 0,2811 0,4416 0,2358 AMFG 0,1311 0,1579 0,1361 0,2500 0,2700 0,2800 0,1030 0,1002 0,1026 ARNA -0,0477 0,1273 0,2111 0,7200 0,5500 0,4800 0,3846 0,4692 0,4995 ASII 0,3603 0,1873 0,1740 1,0200 1,0300 1,0200 0,4507 0,4503 0,4504 AUTO 0,2468 0,2753 0,4206 0,4700 0,6200 0,3200 0,4023 0,3295 0,4752 CPIN 0,3574 0,3956 0,2732 0,4300 0,5100 0,5800 0,2924 0,2810 0,2980 DLTA -0,0175 0,0706 0,1633 0,2084 0,2500 0,2856 1,2141 0,8629 0,7266 DVLA 0,0869 0,1577 0,1073 0,2800 0,2800 0,3000 0,2917 0,3949 0,3080 EKAD 0,1620 0,1528-0,5817 0,6100 0,4300 0,4500 0,1842 0,1544 0,1619 GDYR 0,0347 0,0102-0,1038 1,7700 1,3500 0,9800 0,5556 0,1747 0,2051 GGRM 0,2715 0,0619 0,2231 0,5900 0,5600 0,7300 0,3931 0,3835 0,3556 GJTL 0,1140 0,1139 0,1928 1,6100 1,3500 1,7000 0,0510 0,0831 0,2857 HMSP -0,0560 0,3546 0,0441 0,8762 0,9723 0,9360 0,9511 0,5729 0,9846
4 Nama TAG DER DPR Perusahaan ICBP 0,1393 0,1662 0,1979 0,4200 0,4800 0,6000 0,4989 0,4976 0,4979 IGAR 0,0233-0,1216 0,0077 0,2200 0,2900 0,3900 2,6652 1,4155 0,4931 IKBI 0,0190 0,2750 0,1715 0,2200 0,3400 0,2300 0,6667 0,5336 0,2934 IMAS 0,6173 0,3611 0,2695 1,5400 2,0800 2,3510 0,3430 7,8000 0,1338 INDF 0,1335 0,1071 0,3164 0,7000 0,7400 1,0400 0,4993 0,4981 0,4980 INDS 0,4790 0,4607 0,3194 0,8000 0,4600 0,2530 0,2899 1,1160 0,8143 INTP 0,1828 0,2536 0,1693 0,1500 0,1700 0,1600 0,2999 0,3480 0,6613 IPOL 0,1804 0,0440-0,0188 1,2800 1,0100 0,8300 0,1010 0,1010 0,0586 JPFA 0,1843 0,3260 0,3610 1,1800 1,3000 2,0000 1,2500 0,0386 0,1390 KAEF 0,0826 0,1596 0,1881 0,4300 0,4500 0,5200 0,2001 0,1529 0,2500 KBLM 0,5947 0,1244-0,0950 1,6300 1,7300 1,4260 0,3529 0,1410 0,4286 KLBF 0,1766 0,1382 0,2014 0,2700 0,2800 0,3300 0,6509 0,6677 0,4497 LION 0,2037 0,1850 0,1501 0,2100 0,1700 0,2000 0,2970 0,2437 0,3213 LMSH 0,2534 0,3115 0,1023 0,7100 0,3200 0,2800 0,0881 0,0349 0,1335 MAIN 0,3741 0,3555 0,2303 2,1500 1,6400 1,5700 0,2064 0,2015 0,1405 MASA 0,5588 0,2750 0,0007 1,6800 0,6800 0,6800 0,0975 6,8729 0,2051 MERK 0,3441-0,0256 0,2239 0,1800 0,3700 0,3600 0,8014 0,7418 0,7980
5 Nama TAG DER DPR Perusahaan MLBI 0,0736-0,0563 0,2112 2,4900 1,3200 0,8000 1,0000 0,3236 1,6962 MYOR 0,5002 0,2580 0,1696 1,7200 1,7100 1,4900 0,2467 0,2368 0,2206 PBRX 0,7075 0,3231 0,4324 1,2100 1,4300 1,3600 0,0417 0,0430 0,0238 ROTI 0,3359 0,5873 0,5127 0,3900 0,8100 1,3200 1,2500 0,2500 0,9990 SCCO 0,2574 0,0215 0,1850 1,8000 1,2700 1,5006 0,3189 0,3028 0,2947 SKLT 0,0745 0,1657 0,2389 0,7400 0,9300 1,1630 0,2222 0,2602 0,2353 SMCB 0,0492 0,1112 0,2241 0,4500 0,4500 0,7000 0,6187 0,4540 0,7243 SMGR 0,2634 0,3518 0,1585 0,3500 0,4600 0,4100 0,5000 0,4500 0,4500 SMSM 0,0654 0,2677 0,0932 0,7000 0,7100 0,6900 1,0204 0,4289 0,6542 SQBB 0,1304 0,0978 0,0605 0,2000 0,2200 0,2100 0,8491 0,9301 0,9445 TCID 0,0799 0,1156 0,1620 0,1100 0,1500 0,2392 0,5316 0,4947 0,4648 TKIM 0,1137 0,1134 0,0120 2,4600 2,4600 2,2629 0,0486 0,0992 0,3160 TOTO 0,2272 0,1367 0,1468 0,7600 0,7000 0,6900 0,2273 0,4199 0,4188 TRST 0,0507 0,0261 0,4903 0,6100 0,6200 0,9070 0,2885 0,9091 0,8333 TSPC 0,1841 0,0900 0,1673 0,4000 0,3817 0,4000 0,5952 0,5313 0,5319 UNIC 0,1177-0,0566 0,3762 0,9600 0,7800 0,8500 0,4545 0,9290 0,3790 UNVR 0,2047 0,1434-0,3754 1,8500 2,0200 2,1400 1,0006 0,9996 0,9993
6 Nama PBV Perusahaan AISA 0,7900 1,5500 1,8500 ALMI 0,5400 0,3400 0,2500 AMFG 1,3300 1,4700 1,1400 ARNA 1,3900 4,9800 8,4600 ASII 3,9500 3,4300 2,7900 AUTO 2,7800 2,6000 1,9400 CPIN 5,7000 7,3200 5,7500 DLTA 3,1200 6, ,0400 DVLA 1,7700 2,2500 2,7400 EKAD 1,4900 1,5700 1,4400 GDYR 0,9200 0,9900 1,2000 GGRM 4,8600 4,0700 2,8500 GJTL 2,3600 1,4200 1,0200 HMSP 16, , ,8500 ICBP 2,8300 3,7900 4,6200 IGAR 1,7200 1,6300 1,3000 IKBI 0,4600 0,8000 0,4000 IMAS 3,4800 2,5700 2,1600 INDF 1,2800 1,5000 1,5000 INDS 1,2500 1,1600 0,8700 INTP 3,9900 4,2600 3,4100 IPOL 0,7500 0,5000 0,4000 JPFA 2,0900 2,7500 2,4000
7 KAEF 1,5100 2,8600 2,1400 KBLM 0,5200 0,5700 0,6500 KLBF 5,3000 7,3000 7,4000 Nama PBV Perusahaan LION 0,9000 1,4500 1,6000 LMSH 0,8400 1,0300 0,7300 MAIN 3,9400 5,9000 6,2300 MASA 1,7300 1,1500 0,8200 MERK 6,0100 8,1700 8,6100 MLBI 14, , ,4400 MYOR 4,5100 5,0000 6,3500 PBRX 1,9700 1,7500 1,1500 ROTI 6, ,4800 7,1700 SCCO 1,2400 1,2700 1,2900 SKLT 0,7900 0,9600 0,9000 SMCB 2,2100 2,6400 2,0700 SMGR 4,6500 5,1800 4,2400 SMSM 2,9200 4,4300 4,9500 SQBB 0,3600 0,3200 0,3300 TCID 1,5200 2,0200 2,0200 TKIM 0,4200 0,3500 0,2600 TOTO 3,2600 3,6700 3,6300 TRST 0,8300 0,7200 0,4300 TSPC 3,7700 5,0000 3,8400 UNIC 0,5900 0,5700 0,4300 UNVR 38, , ,0000
8 Lampiran 3. Hasil Uji Data Regression Descriptive Statistics Mean Std. Deviation N PBV TAG DER DPR Correlations PBV TAG DER DPR Pearson Correlatio n PBV TAG DER DPR Sig. (1-tailed) PBV TAG DER DPR
9 N PBV TAG DER DPR Variables Entered/Removed b Model Variables Entered Variables Removed Method 1 DPR, TAG, DER a. Enter a. All requested variables entered. b. Dependent Variable: PBV
10 Model Summary b Model R R Square Adjusted R Square Std. Error of the Estimate Durbin-Watson a a. Predictors: (Constant), DPR, TAG, DER b. Dependent Variable: PBV ANOVA b Model Sum of Squares df Mean Square F Sig. 1 Regression a Residual Total
11 ANOVA b Model Sum of Squares df Mean Square F Sig. 1 Regression a Residual Total a. Predictors: (Constant), DPR, TAG, DER
12 b. Dependent Variable: PBV Coefficients a Model Unstandardized Coefficients Standardized Coefficients B Std. Error Beta t Sig. Zeroorder Correlations Collinearity Statistics Partial Part Tolerance VIF 1(Constant) TAG DER DPR a. Dependent Variable: PBV

13 Charts
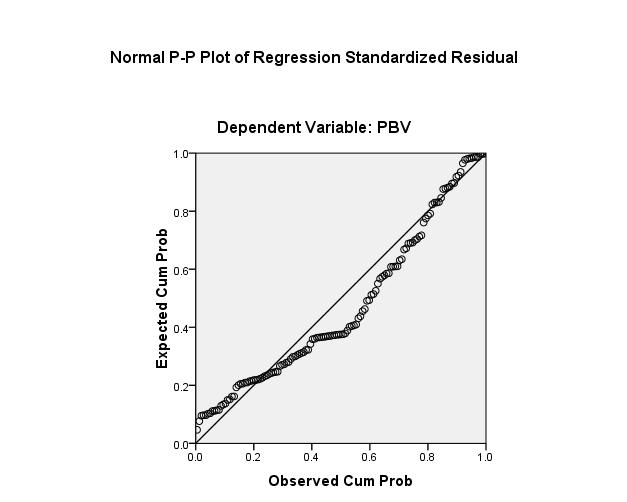
14
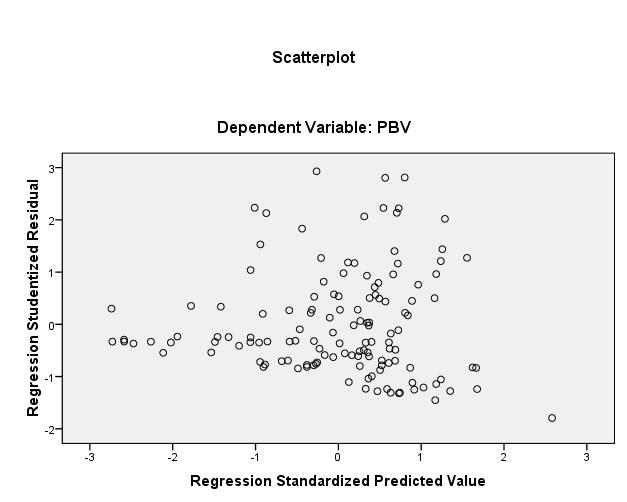
15
16 NPar Tests One-Sample Kolmogorov-Smirnov Test Unstandardized Residual N 133 Normal Parameters a Mean Std. Deviation Most Extreme Differences Absolute.104 Positive.104 Negative Kolmogorov-Smirnov Z Asymp. Sig. (2-tailed).114 a. Test distribution is Normal.
17 Nonparametric Correlations Correlations TAG DER DPR Unstandardized Residual Spearman's rho TAG Correlation Coefficient ** Sig. (2-tailed) N DER Correlation Coefficient.230 ** **.090 Sig. (2-tailed) N DPR Correlation Coefficient ** Sig. (2-tailed) N
18 Unsta Correlation ndardi Coefficient zed Sig. (2-tailed) Residu N al **. Correlation is significant at the 0.01 level (2-tailed).
Daftar Perusahaan Otomotif yang Terdatar di Bursa Efek Indonesia(Periode )
") 114 Lampiran 1: Populasi Penelitian Daftar Perusahaan Otomotif yang Terdatar di Bursa Efek Indonesia(Periode 2006 2012) 89 1 PT. Astra Internasional Tbk. ASII 2 PT. Astra Otoparts Tbk. AUTO 3 PT. Indo
114 Lampiran 1: Populasi Penelitian Daftar Perusahaan Otomotif yang Terdatar di Bursa Efek Indonesia(Periode 2006 2012) 89 1 PT. Astra Internasional Tbk. ASII 2 PT. Astra Otoparts Tbk. AUTO 3 PT. Indo
APPENDIX 1 DAFTAR POPULASI DAN SAMPEL TAHUN
 APPENDIX 1 DAFTAR POPULASI DAN SAMPEL TAHUN 2011-2013 No Nama Perusahaan Kode Kriteria Kriteria Kriteri Kriteria Sampel 1 2 a 3 4 1. Agung Podomoro Land APLN 2. Alam Sutera Reality ASRI 3. Bekasi Asri
Lampiran 1. Surat Uji Coba Penelitian dari Fakultas. Lampiran 2. Expert Judgement
 57 Lampiran 1. Surat Uji Coba Penelitian dari Fakultas Lampiran 2. Expert Judgement 58 59 Lanjutan Lampiran 2. 60 Lanjutan Lampiran 2. 61 Lanjutan lampiran 2. 62 Lanjutan lampiran 2. 63 Lanjutan lampiran
LAMPIRAN A UJI VALIDITAS DAN RELIABILITAS
 LAMPIRAN A UJI VALIDITAS DAN RELIABILITAS Validitas Komitmen Karyawan Scale Mean if Item Deleted Scale Variance if Item Deleted Corrected Item- Total Correlation Cronbach's Alpha if Item Deleted Item01
Case Processing Summary. Cases Valid Missing Total N Percent N Percent N Percent % 0 0.0% % % 0 0.0%
 GET FILE='C:\Users\acantrell\Desktop\demo5.sav'. DATASET NAME DataSet1 WINDOW=FRONT. EXAMINE VARIABLES=PASSYDSPG RUSHYDSPG /PLOT BOXPLOT HISTOGRAM /COMPARE GROUPS /STATISTICS DESCRIPTIVES /CINTERVAL 95
DISMAS Evaluation: Dr. Elizabeth C. McMullan. Grambling State University
 DISMAS Evaluation 1 Running head: Project Dismas Evaluation DISMAS Evaluation: 2007 2008 Dr. Elizabeth C. McMullan Grambling State University DISMAS Evaluation 2 Abstract An offender notification project
Universitas Sumatera Utara
 Crosstabs Kelompok Usia (thn) * Hiperplasia Crosstabulation Hiperplasia Simpleks Kompleks Total Kelompok Usia (thn) 40 Count 12 17 29 54,5% 77,3% 65,9% Total Count
LAMPIRAN. Lampiran 1 Data Sampel Penelitian
 LAMPIRAN Lampiran 1 Data Sampel Penelitian Variabel Audit Tenure pada Perusahaan Sampel NO KODE 2011 2012 2013 1 APLN (BING HARIANTO,SE) 1 (ALVIN ISMARTO) 1 (ALVIN ISMARTO) 2 2 ASRI (HIDAJAT RAHARDJO )1
Regression Analysis of Travel Indicators and Public Transport Usage in Urban Areas
 Regression Analysis of Travel Indicators and Public Transport Usage in Urban Areas M. Moeinaddini, Z. Asadi-Shekari, M. Zaly Shah, A. Hamzah Abstract Currently, planners try to have more green travel options
Journal of Human Sport and Exercise E-ISSN: Universidad de Alicante España
 Journal of Human Sport and Exercise E-ISSN: 1988-5202 jhse@ua.es Universidad de Alicante España SOÓS, ISTVÁN; FLORES MARTÍNEZ, JOSÉ CARLOS; SZABO, ATTILA Before the Rio Games: A retrospective evaluation
Stats 2002: Probabilities for Wins and Losses of Online Gambling
 Abstract: Jennifer Mateja Andrea Scisinger Lindsay Lacher Stats 2002: Probabilities for Wins and Losses of Online Gambling The objective of this experiment is to determine whether online gambling is a
Driv e accu racy. Green s in regul ation
 LEARNING ACTIVITIES FOR PART II COMPILED Statistical and Measurement Concepts We are providing a database from selected characteristics of golfers on the PGA Tour. Data are for 3 of the players, based
Statistical Analysis of PGA Tour Skill Rankings USGA Research and Test Center June 1, 2007
 Statistical Analysis of PGA Tour Skill Rankings 198-26 USGA Research and Test Center June 1, 27 1. Introduction The PGA Tour has recorded and published Tour Player performance statistics since 198. All
Keywords: multiple linear regression; pedestrian crossing delay; right-turn car flow; the number of pedestrians;
 Available online at www.sciencedirect.com ScienceDirect Procedia - Social and Behavioral Scien ce s 96 ( 2013 ) 1997 2003 13th COTA International Conference of Transportation Professionals (CICTP 2013)
Introduction to Analysis of Variance (ANOVA) The Structural Model, The Summary Table, and the One- Way ANOVA
 The Structural Model, The Summary Table, and the One- Way ANOVA") Introduction to Analysis of Variance (ANOVA) The Structural Model, The Summary Table, and the One- Way ANOVA Limitations of the t-test Although the t-test is commonly used, it has limitations Can only
Introduction to Analysis of Variance (ANOVA) The Structural Model, The Summary Table, and the One- Way ANOVA Limitations of the t-test Although the t-test is commonly used, it has limitations Can only
Navigate to the golf data folder and make it your working directory. Load the data by typing
 Golf Analysis 1.1 Introduction In a round, golfers have a number of choices to make. For a particular shot, is it better to use the longest club available to try to reach the green, or would it be better
INFLUENCE OF ENVIRONMENTAL PARAMETERS ON FISHERY
 Chapter 5 INFLUENCE OF ENVIRONMENTAL PARAMETERS ON FISHERY 5. Introduction Environmental factors contribute to the population dynamics and abundance of marine fishery. The relationships between weather,
Table 4.1: Descriptive Statistics for FAAM 26-Item ADL Subscale
 Table 4.1: Descriptive Statistics for FAAM 26-Item ADL Subscale Item Content Number missing Mean Median SD Skewness (Std. Error) Kurtosis (Std. Error) 1) Standing 52(5.3%) 2.74 3 1.09-0.55(.078) -0.41(.16)
Announcements. % College graduate vs. % Hispanic in LA. % College educated vs. % Hispanic in LA. Problem Set 10 Due Wednesday.
 Announcements Announcements UNIT 7: MULTIPLE LINEAR REGRESSION LECTURE 1: INTRODUCTION TO MLR STATISTICS 101 Problem Set 10 Due Wednesday Nicole Dalzell June 15, 2015 Statistics 101 (Nicole Dalzell) U7
Pengujian Total Fenol
 LAMPIRAN Lampiran 1. Dokumentasi Penelitian a. Preparasi sampel Persiapan alat dan bahan Pemotongan bahan b. Analisis proksimat Penimbangan sampel Analisis kadar lemak Analisis kadar protein Analisis abu
The probability of winning a high school football game.
 Columbus State University CSU epress Faculty Bibliography 2008 The probability of winning a high school football game. Jennifer Brown Follow this and additional works at: http://csuepress.columbusstate.edu/bibliography_faculty
Lecture 22: Multiple Regression (Ordinary Least Squares -- OLS)
") Statistics 22_multiple_regression.pdf Michael Hallstone, Ph.D. hallston@hawaii.edu Lecture 22: Multiple Regression (Ordinary Least Squares -- OLS) Some Common Sense Assumptions for Multiple Regression
Statistics 22_multiple_regression.pdf Michael Hallstone, Ph.D. hallston@hawaii.edu Lecture 22: Multiple Regression (Ordinary Least Squares -- OLS) Some Common Sense Assumptions for Multiple Regression
Pearson Edexcel Level 3 GCE Psychology Advanced Subsidiary Paper 2: Biological Psychology and Learning Theories
 Write your name here Surname Other names Centre Number Candidate Number Pearson Edexcel Level 3 GCE Psychology Advanced Subsidiary Paper 2: Biological Psychology and Learning Theories Monday 23 May 2016
One-factor ANOVA by example
 ANOVA One-factor ANOVA by example 2 One-factor ANOVA by visual inspection 3 4 One-factor ANOVA H 0 H 0 : µ 1 = µ 2 = µ 3 = H A : not all means are equal 5 One-factor ANOVA but why not t-tests t-tests?
Tourism impacts from major sports events Visiting previous host destinations or future events
 Tourism impacts from major sports events Visiting previous host destinations or future events Harry Arne Solberg and Arne M. Ulvnes Trondheim Business School Do major sports events create tourism impacts?
Announcements. Lecture 19: Inference for SLR & Transformations. Online quiz 7 - commonly missed questions
 Announcements Announcements Lecture 19: Inference for SLR & Statistics 101 Mine Çetinkaya-Rundel April 3, 2012 HW 7 due Thursday. Correlation guessing game - ends on April 12 at noon. Winner will be announced
Rice Yield And Dangue Haemorrhagic Fever(DHF) Condition depend upon Climate Data
 Condition depend upon Climate Data") Rice Yield And Dangue Haemorrhagic Fever(DHF) Condition depend upon Climate Data Dr Lai Lai Aung, Assistant Director( Met Service) Dr Khaing Khaing Soe Assistant Director(Public Health) Dr Thin Nwe htwe
Rice Yield And Dangue Haemorrhagic Fever(DHF) Condition depend upon Climate Data Dr Lai Lai Aung, Assistant Director( Met Service) Dr Khaing Khaing Soe Assistant Director(Public Health) Dr Thin Nwe htwe
Transportation Research Forum
 Transportation Research Forum Modeling through Traffic Speed at Roundabouts along Urban and Suburban Street Arterials Author(s): Bashar H. Al-Omari, Khalid A. Ghuzlan, and Lina B. Al-Helo Source: Journal
Midterm Exam 1, section 2. Thursday, September hour, 15 minutes
 San Francisco State University Michael Bar ECON 312 Fall 2018 Midterm Exam 1, section 2 Thursday, September 27 1 hour, 15 minutes Name: Instructions 1. This is closed book, closed notes exam. 2. You can
A study evaluating if targeted training for startle effect can improve pilot reactions in handling unexpected situations. DR. MICHAEL GILLEN, PH.D.
 A study evaluating if targeted training for startle effect can improve pilot reactions in handling unexpected situations. DR. MICHAEL GILLEN, PH.D. Disclaimer I would like to thank the FSF, United Airlines,
Biostatistics & SAS programming
 Biostatistics & SAS programming Kevin Zhang March 6, 2017 ANOVA 1 Two groups only Independent groups T test Comparison One subject belongs to only one groups and observed only once Thus the observations
ASTERISK OR EXCLAMATION POINT?: Power Hitting in Major League Baseball from 1950 Through the Steroid Era. Gary Evans Stat 201B Winter, 2010
 ASTERISK OR EXCLAMATION POINT?: Power Hitting in Major League Baseball from 1950 Through the Steroid Era by Gary Evans Stat 201B Winter, 2010 Introduction: After a playerʼs strike in 1994 which resulted
y ) s x x )(y i (x i r = 1 n 1 s y Statistics Lecture 7 Exploring Data , y 2 ,y n (x 1 ),,(x n ),(x 2 ,y 1 How two variables vary together
 s x x )(y i (x i r = 1 n 1 s y Statistics Lecture 7 Exploring Data , y 2 ,y n (x 1 ),,(x n ),(x 2 ,y 1 How two variables vary together") Statistics 111 - Lecture 7 Exploring Data Numerical Summaries for Relationships between Variables Administrative Notes Homework 1 due in recitation: Friday, Feb. 5 Homework 2 now posted on course website:
Statistics 111 - Lecture 7 Exploring Data Numerical Summaries for Relationships between Variables Administrative Notes Homework 1 due in recitation: Friday, Feb. 5 Homework 2 now posted on course website:
Running head: DATA ANALYSIS AND INTERPRETATION 1
 Running head: DATA ANALYSIS AND INTERPRETATION 1 Data Analysis and Interpretation Final Project Vernon Tilly Jr. University of Central Oklahoma DATA ANALYSIS AND INTERPRETATION 2 Owners of the various
Preliminary statistical analysis of. the international eventing. results 2013
 Lausanne 28/1/14 Preliminary statistical analysis of the international eventing results 2013 Overview of the talk Statistical analysis The data The statistical technique Analysis of the falls data (related
Lab 11: Introduction to Linear Regression
 Lab 11: Introduction to Linear Regression Batter up The movie Moneyball focuses on the quest for the secret of success in baseball. It follows a low-budget team, the Oakland Athletics, who believed that
Predicting the use of the Sacrifice Bunt in Major League Baseball. Charlie Gallagher Brian Gilbert Neelay Mehta Chao Rao
 Predicting the use of the Sacrifice Bunt in Major League Baseball Charlie Gallagher Brian Gilbert Neelay Mehta Chao Rao Understanding the Data Data from the St. Louis Cardinals Sig Mejdal, Senior Quantitative
save percentages? (Name) (University)
 (University)") 1 IB Maths Essay: What is the correlation between the height of football players and their save percentages? (Name) (University) Table of Contents Raw Data for Analysis...3 Table 1: Raw Data...3 Rationale
1 IB Maths Essay: What is the correlation between the height of football players and their save percentages? (Name) (University) Table of Contents Raw Data for Analysis...3 Table 1: Raw Data...3 Rationale
Psychology Advanced Subsidiary Paper 2: Biological Psychology and Learning Theories
 Write your name here Surname Other names Pearson Edexcel Level 3 GCE Centre Number Candidate Number Psychology Advanced Subsidiary Paper 2: Biological Psychology and Learning Theories Monday 22 May 2017
Distancei = BrandAi + 2 BrandBi + 3 BrandCi + i
 . Suppose that the United States Golf Associate (USGA) wants to compare the mean distances traveled by four brands of golf balls when struck by a driver. A completely randomized design is employed with
ANALYSIS OF THE DOMINATING POWER OF SERVICE RECEPTION IN VOLLEYBALL IN DIFFERENT LEVELS OF COMPETITIONS
 ANALYSIS OF THE DOMINATING POWER OF SERVICE RECEPTION IN VOLLEYBALL IN DIFFERENT LEVELS OF COMPETITIONS 1 SANJIB GHOSH 2 DR. MAHESH SWETA 1 Research scholar, department of Physical Education, Visva-Bharati,
THE STATISTICAL AND GEOGRAPHICAL ANALYSIS ON THE IMPACTS OF SOCIOECONOMIC CHARACTERISTICS ON BUS-STOP DAILY BOARDING IN RICHMOND CITY
 Virginia Commonwealth University VCU Scholars Compass Theses and Dissertations Graduate School 2015 THE STATISTICAL AND GEOGRAPHICAL ANALYSIS ON THE IMPACTS OF SOCIOECONOMIC CHARACTERISTICS ON BUS-STOP
Youngs Creek Hydroelectric Project (FERC No. P 10359)
") Youngs Creek Hydroelectric Project (FERC No. P 10359) Resident Trout Monitoring Plan Annual Report 2010 Survey and Results of Pre Project Monitoring Prepared by: September 2010 Overview The Public Utility
Youngs Creek Hydroelectric Project (FERC No. P 10359) Resident Trout Monitoring Plan Annual Report 2010 Survey and Results of Pre Project Monitoring Prepared by: September 2010 Overview The Public Utility
Empirical Example II of Chapter 7
 Empirical Example II of Chapter 7 1. We use NBA data. The description of variables is --- --- --- storage display value variable name type format label variable label marr byte %9.2f =1 if married wage
Dutch Disease, Deindustrialization and Employment in South America Roberto Frenkel
 Dutch Disease, Deindustrialization and Employment in South America Roberto Frenkel Principal Research Associate at CEDES and Honorary Professor, University of Buenos Aires 300 Real bilateral exchange rates
Designing a Bicycle and Pedestrian Count Program in Blacksburg, VA
 Designing a Bicycle and Pedestrian Count Program in Blacksburg, VA Steve Hankey (Virginia Tech) Andrew Mondschein (U or Virginia) Ralph Buehler (Virginia Tech) Issue/objective Issue No systematic traffic
Data Set 7: Bioerosion by Parrotfish Background volume of bites The question:
 Data Set 7: Bioerosion by Parrotfish Background Bioerosion of coral reefs results from animals taking bites out of the calcium-carbonate skeleton of the reef. Parrotfishes are major bioerosion agents,
Pitching Performance and Age
 Pitching Performance and Age Jaime Craig, Avery Heilbron, Kasey Kirschner, Luke Rector and Will Kunin Introduction April 13, 2016 Many of the oldest and most long- term players of the game are pitchers.
Applications of a Magnetic Sector Process Mass Spectrometer to the Analysis of Variable Vacuum Samples
 Applications of a Magnetic Sector Process Mass Spectrometer to the Analysis of Variable Vacuum Samples Outline of Presentation Introduction Process Gas Analysis Magnetic Sector Mass Spectrometer Standard
NAME: Math 403 Final Exam 12/10/08 15 questions, 150 points. You may use calculators and tables of z, t values on this exam.
 NAME: Math 403 Final Exam 12/10/08 15 questions, 150 points. You may use calculators and tables of z, t values on this exam. (10 pts) 1. Barry Bonds' home run totals for each year of his career ('86-'07):
Unit 4: Inference for numerical variables Lecture 3: ANOVA
 Unit 4: Inference for numerical variables Lecture 3: ANOVA Statistics 101 Thomas Leininger June 10, 2013 Announcements Announcements Proposals due tomorrow. Will be returned to you by Wednesday. You MUST
Prokopios Chatzakis, National and Kapodistrian University of Athens, Faculty of Physical Education and Sport Science 1
 Differences between geographic areas (continents) in the distribution of medals at the Beijing Olympic Games 2008 and at the London Olympic Games. Prokopios Chatzakis, National and Kapodistrian University
Pitching Performance and Age
 Pitching Performance and Age By: Jaime Craig, Avery Heilbron, Kasey Kirschner, Luke Rector, Will Kunin Introduction April 13, 2016 Many of the oldest players and players with the most longevity of the
Section I: Multiple Choice Select the best answer for each problem.
 Inference for Linear Regression Review Section I: Multiple Choice Select the best answer for each problem. 1. Which of the following is NOT one of the conditions that must be satisfied in order to perform
HSIS. Association of Selected Intersection Factors With Red-Light-Running Crashes. State Databases Used SUMMARY REPORT
 HSIS HIGHWAY SAFETY INFORMATION SYSTEM The Highway Safety Information Systems (HSIS) is a multi-state safety data base that contains accident, roadway inventory, and traffic volume data for a select group
Legendre et al Appendices and Supplements, p. 1
 Legendre et al. 2010 Appendices and Supplements, p. 1 Appendices and Supplement to: Legendre, P., M. De Cáceres, and D. Borcard. 2010. Community surveys through space and time: testing the space-time interaction
M. Hussain, J. Gu, R. Engel, and D. Shortt *General Motors Corporation, GMPT Headquarters, Pontiac, Michigan USA
 Proceedings of the 2015 International Conference on Industrial Engineering and Operations Management Dubai, United Arab Emirates (UAE), March 3 5, 2015 Designed experiment to find the optimal combination
DEVELOPMENT OF TRAFFIC ACCIDENT PREDICTION MODELS BY TRAFFIC AND ROAD CHARACTERISTICS IN URBAN AREAS
 DEVELOPMENT OF TRAFFIC ACCIDENT PREDICTION MODELS BY TRAFFIC AND ROAD CHARACTERISTICS IN URBAN AREAS Dahee Hong Master Course Dept. of Transportation Engineering University of Seoul 90 Jeonnong-dong, Dongdaemun-gu,
CHAPTER ANALYSIS AND INTERPRETATION Average total number of collisions for a try to be scored
 CHAPTER 8 8.1 ANALYSIS AND INTERPRETATION As mentioned in the previous chapter, four key components have been identified as indicators of the level of significance of dominant collisions when evaluating
STANDARD SCORES AND THE NORMAL DISTRIBUTION
 STANDARD SCORES AND THE NORMAL DISTRIBUTION REVIEW 1.MEASURES OF CENTRAL TENDENCY A.MEAN B.MEDIAN C.MODE 2.MEASURES OF DISPERSIONS OR VARIABILITY A.RANGE B.DEVIATION FROM THE MEAN C.VARIANCE D.STANDARD
D1.2 REPORT ON MOTORCYCLISTS IMPACTS WITH ROAD INFRASTRUCTURE BASED OF AN INDEPTH INVESTIGATION OF MOTORCYCLE ACCIDENTS
 WP 1 D1.2 REPORT ON MOTORCYCLISTS IMPACTS WITH ROAD INFRASTRUCTURE BASED OF AN INDEPTH INVESTIGATION OF MOTORCYCLE ACCIDENTS Project Acronym: Smart RRS Project Full Title: Innovative Concepts for smart
Chapter 12 Practice Test
 Chapter 12 Practice Test 1. Which of the following is not one of the conditions that must be satisfied in order to perform inference about the slope of a least-squares regression line? (a) For each value
IMPROVING MOBILITY PERFORMANCE IN WHEELCHAIR BASKETBALL
 IMPROVING MOBILITY PERFORMANCE IN WHEELCHAIR BASKETBALL MARCO HOOZEMANS THOM VEEGER MONIQUE BERGER RIENK VAN DER SLIKKE DIRKJAN VEEGER ANNEMARIE DE WITTE INTRODUCTION Mobility performance in wheelchair
Evaluation of n-situ easurement ethods for ir ermeability of indows
 Evaluation of n-situ easurement ethods for ir ermeability of indows Christoph Geyer, Andreas Müller, Barbara Wehle, Martin Greiner, Pascal Urech Research and Development; Architecture, Wood and Civil Engineering
Lower Body Kinetics During the Delivery Phase of the Rotational Shot Put Technique
 Brigham Young University BYU ScholarsArchive All Theses and Dissertations 2012-03-07 Lower Body Kinetics During the Delivery Phase of the Rotational Shot Put Technique Jillian Mary Williams Brigham Young
ANALYSIS AND MODELING OF GAP ACCEPTANCE AT UNPROTECTED MID- BLOCK CROSSWALKS A CASE STUDY OF CHANDIGARH CITY
 TRANSPORTATION INFRASTRUCTURE PROJECTS : CONCEPTION TO EXECUTION 2019 (Theme : DESIGN SAFETY ISSUES) ANALYSIS AND MODELING OF GAP ACCEPTANCE AT UNPROTECTED MID- BLOCK CROSSWALKS A CASE STUDY OF CHANDIGARH
Math SL Internal Assessment What is the relationship between free throw shooting percentage and 3 point shooting percentages?
 Math SL Internal Assessment What is the relationship between free throw shooting percentage and 3 point shooting percentages? fts6 Introduction : Basketball is a sport where the players have to be adept
The Reliability of Intrinsic Batted Ball Statistics Appendix
 The Reliability of ntrinsic Batted Ball Statistics Appendix Glenn Healey, EECS Department University of California, rvine, CA 92617 Given information about batted balls for a set of players, we review
How to Win in the NBA Playoffs: A Statistical Analysis
 How to Win in the NBA Playoffs: A Statistical Analysis Michael R. Summers Pepperdine University Professional sports teams are big business. A team s competitive success is just one part of the franchise
Youngs Creek Hydroelectric Project
 Youngs Creek Hydroelectric Project (FERC No. 10359) Resident Trout Monitoring Plan Annual Report 2014 Survey Prepared by: Everett, WA November 2014 Final This document has been prepared for the District.
Analysis of Variance. Copyright 2014 Pearson Education, Inc.
 Analysis of Variance 12-1 Learning Outcomes Outcome 1. Understand the basic logic of analysis of variance. Outcome 2. Perform a hypothesis test for a single-factor design using analysis of variance manually
Estimating the Probability of Winning an NFL Game Using Random Forests
 Estimating the Probability of Winning an NFL Game Using Random Forests Dale Zimmerman February 17, 2017 2 Brian Burke s NFL win probability metric May be found at www.advancednflstats.com, but the site
Best Practices in Mathematics Education STATISTICS MODULES
 Best Practices in Mathematics Education STATISTICS MODULES APEC Technical Assistance & Training Facility (APEC TATF) APEC Project HRD 01/2009A - 21 st Century Mathematics Education for All in the APEC
Multilevel Models for Other Non-Normal Outcomes in Mplus v. 7.11
 Multilevel Models for Other Non-Normal Outcomes in Mplus v. 7.11 Study Overview: These data come from a daily diary study that followed 41 male and female college students over a six-week period to examine
Pressured Applied by the Emergency/Israeli Bandage
 Pressured Applied by the Emergency/Israeli Bandage By Charles S. Lessard, Ph.D. Nolan Shipman, M.D. Amanda Bickham Jasper Butler 9 December 2007 1 Introduction At the request of Performance Systems, this
This page intentionally left blank
 PART III BASKETBALL This page intentionally left blank 28 BASKETBALL STATISTICS 101 The Four- Factor Model For each player and team NBA box scores track the following information: two- point field goals
BODY FORM INFLUENCES ON THE DRAG EXPERIENCED BY JUNIOR SWIMMERS. Australia, Perth, Australia
 1 BODY FORM INFLUENCES ON THE DRAG EXPERIENCED BY JUNIOR SWIMMERS Andrew Lyttle 1, Nat Benjanuvatra 2, Brian A Blanksby 2, Bruce C Elliott 2 1 Western Australian Institute of Sport, Perth, Australia 2
Correlation analysis between UK onshore and offshore wind speeds
 Loughborough University Institutional Repository Correlation analysis between UK onshore and offshore wind speeds This item was submitted to Loughborough University's Institutional Repository by the/an
Sports Predictive Analytics: NFL Prediction Model
 Sports Predictive Analytics: NFL Prediction Model By Dr. Ash Pahwa IEEE Computer Society San Diego Chapter January 17, 2017 Copyright 2017 Dr. Ash Pahwa 1 Outline Case Studies of Sports Analytics Sports
PREDICTING OUTCOMES OF NBA BASKETBALL GAMES
 PREDICTING OUTCOMES OF NBA BASKETBALL GAMES A Thesis Submitted to the Graduate Faculty of the North Dakota State University of Agriculture and Applied Science By Eric Scot Jones In Partial Fulfillment
Journal of Chemical and Pharmaceutical Research, 2014, 6(3): Research Article
: Research Article") Available online www.jocpr.com Journal of Chemical and Pharmaceutical Research 2014 6(3):304-309 Research Article ISSN : 0975-7384 CODEN(USA) : JCPRC5 World men sprint event development status research
Available online www.jocpr.com Journal of Chemical and Pharmaceutical Research 2014 6(3):304-309 Research Article ISSN : 0975-7384 CODEN(USA) : JCPRC5 World men sprint event development status research
Competition Jumping Horses: Effects of Age, Sex and Breed on the Fei/Wbfsh World Ranking
 Competition Jumping Horses: Effects of Age, Sex and Breed on the Fei/Wbfsh World Ranking Anca ROMAN-POPOVICI *, Dan SUMOVSCHI, Ioan GÎLCĂ Faculty of Animal Science, University of Agricultural Science and
Modification of Webster s delay formula under non-lane based heterogeneous road traffic condition
 Journal of Civil Engineering (IEB), 35 () (007) 81-9 Modification of Webster s delay formula under non-lane based heterogeneous road traffic condition Md. Shamsul Hoque and Md. Asif Imran 1 Department
OBSERVED VARIABILITY IN OIL SARDINE AND MACKEREL FISHERY OF SOUTHWEST COAST OF INDIA STATISTICAL APPROACH
 Observed Variability in Oil Sardine and Mackerel Fishery of Southwest Coast of India Statistical Approach Chapter 4 OBSERVED VARIABILITY IN OIL SARDINE AND MACKEREL FISHERY OF SOUTHWEST COAST OF INDIA
Chapter 13. Factorial ANOVA. Patrick Mair 2015 Psych Factorial ANOVA 0 / 19
 Chapter 13 Factorial ANOVA Patrick Mair 2015 Psych 1950 13 Factorial ANOVA 0 / 19 Today s Menu Now we extend our one-way ANOVA approach to two (or more) factors. Factorial ANOVA: two-way ANOVA, SS decomposition,
Gulf of Mexico Oil Spill
 Bulletin 1204 May 2013 Estimation of the Baseline for Assessment of Economic Impacts of the Gulf of Mexico Oil Spill on Mississippi s Commercial Fishing Sector Discrimination based upon race, color, religion,
a) List and define all assumptions for multiple OLS regression. These are all listed in section 6.5
 List and define all assumptions for multiple OLS regression. These are all listed in section 6.5") Prof. C. M. Dalton ECN 209A Spring 2015 Practice Problems (After HW1, HW2, before HW3) CORRECTED VERSION Question 1. Draw and describe a relationship with heteroskedastic errors. Support your claim with
Prof. C. M. Dalton ECN 209A Spring 2015 Practice Problems (After HW1, HW2, before HW3) CORRECTED VERSION Question 1. Draw and describe a relationship with heteroskedastic errors. Support your claim with
Navel orangeworm biology, monitoring, and management
 Navel orangeworm biology, monitoring, and management Chuck Burks 1, Elizabeth Fichtner 2, and Brad Higbee 3 1 USDA-ARS, Parlier, CA 2 UCCE, Tulare, CA 3 Paramount Farming, Bakersfield, CA Topics, NOW Monitoring
Factorial Analysis of Variance
 Factorial Analysis of Variance Overview of the Factorial ANOVA Factorial ANOVA (Two-Way) In the context of ANOVA, an independent variable (or a quasiindependent variable) is called a factor, and research
Appendix: Tables. Table XI. Table I. Table II. Table XII. Table III. Table IV
 Table I Table II Table III Table IV Table V Table VI Random Numbers Binomial Probabilities Poisson Probabilities Normal Curve Areas Exponentials Critical Values of t Table XI Table XII Percentage Points
Quantitative Methods for Economics Tutorial 6. Katherine Eyal
 Quantitative Methods for Economics Tutorial 6 Katherine Eyal TUTORIAL 6 13 September 2010 ECO3021S Part A: Problems 1. (a) In 1857, the German statistician Ernst Engel formulated his famous law: Households
The Effect of the Arm Swing on the Heart Rate of Non-Athletes
 The Effect of the Arm Swing on the Heart Rate of Non-Athletes Seekaow Churproong MD*, Buratin Khampirat PhD*, Paraj Ratanajaipan MEng**, Poollarp Tattathongkom BS** * Suranaree University of Technology,
The Simple Linear Regression Model ECONOMETRICS (ECON 360) BEN VAN KAMMEN, PHD
 BEN VAN KAMMEN, PHD") The Simple Linear Regression Model ECONOMETRICS (ECON 360) BEN VAN KAMMEN, PHD Outline Definition. Deriving the Estimates. Properties of the Estimates. Units of Measurement and Functional Form. Expected
The Simple Linear Regression Model ECONOMETRICS (ECON 360) BEN VAN KAMMEN, PHD Outline Definition. Deriving the Estimates. Properties of the Estimates. Units of Measurement and Functional Form. Expected
Sandra Nutter, MPH James Sallis, PhD Gregory J Norman, PhD Sherry Ryan, PhD Kevin Patrick, MD, MS
 Objectively Measured Environmental Correlates of Adolescent Physical Activity Sandra Nutter, MPH James Sallis, PhD Gregory J Norman, PhD Sherry Ryan, PhD Kevin Patrick, MD, MS San Diego State University
Recent Progress in Analyses of Catch Data from Fishery Observers and in Logbooks
 Recent Progress in Analyses of Catch Data from Fishery Observers and in Logbooks William A. Walsh University of Hawaii Joint Institute for Marine and Atmospheric Research Pelagic Fisheries Research Program
Chapter 7. Comparing Two Population Means. Comparing two population means. T-tests: Independent samples and paired variables.
 Chapter 7 Comparing Two Population Means Comparing two population means T-tests: Independent samples and paired variables. Usually subjects are assigned to treatment or control groups and one or more variables
TABLE OF CONTENTS CHAPTER TITLE PAGE LIST OF TABLES LIST OF FIGURES LIST OF ABBREVIATIONS LIST OF SYMBOLS LIST OF APPENDICES
 vii TABLE OF CONTENTS CHAPTER TITLE PAGE AUTHOR S DECLARATION DEDICATION ACKNOWLEDGEMENTS ABSTRACT ABSTRAK TABLE OF CONTENTS LIST OF TABLES LIST OF FIGURES LIST OF ABBREVIATIONS LIST OF SYMBOLS LIST OF
Statistical Analysis on Relationship between Muhammadiyah Growths in and its Heritage
 International Journal of Applied Business and Information Systems ISSN: 2597-8993 Vol 1, No 2, September 2017, pp. 26-33 26 Statistical Analysis on Relationship between Growths in 1912 1964 and its Heritage
In addition to reading this assignment, also read Appendices A and B.
 1 Kinematics I Introduction In addition to reading this assignment, also read Appendices A and B. We will be using a motion detector to track the positions of objects with time in several lab exercises
PREDICTIVE CONTRIBUTION OF MORPHOLOGICAL CHARACTERISTICS AND MOTOR ABILITIES ON THE RESULT OF RUNNING THE 60m HURDLES IN BOYS AGED YEARS 1
 International Journal of Science Culture and Sport June 2014; 2(2) ISSN : 2148-1148 Doi : 10.14486/IJSCS84 PREDICTIVE CONTRIBUTION OF MORPHOLOGICAL CHARACTERISTICS AND MOTOR ABILITIES ON THE RESULT OF