Economic Impact Analysis on Olympic Host- Cities
|
|
|
- Caroline Chapman
- 5 years ago
- Views:
Transcription

1 Grand Valley State University Honors Projects Undergraduate Research and Creative Practice Economic Impact Analysis on Olympic Host- Cities Michael P. Overmyer Grand Valley State University Follow this and additional works at: Part of the Business Commons Recommended Citation Overmyer, Michael P., "Economic Impact Analysis on Olympic Host-Cities" (2017). Honors Projects This Open Access is brought to you for free and open access by the Undergraduate Research and Creative Practice at It has been accepted for inclusion in Honors Projects by an authorized administrator of For more information, please contact
2 2017 Economic Impact Analysis on Olympic Host-Cities SENIOR HONORS PROJECT STUDENT MICHAEL P. OVERMYER & PROFESSOR GREGG DIMKOFF GRAND VALLEY STATE UNIVERSITY
3 Table of Contents Abstract...2 Introduction...2 Methodology...4 Background...5 Economic Benefits of Hosting...5 Intangible Benefits of Hosting...6 Costs of Hosting Atlanta Olympics...8 Economic Benefits...8 Economic Costs...10 Analysis and Inference Sydney Olympics...12 Economic Benefits...12 Economic Costs...13 Analysis and Inference Athens Olympics...15 Economic Benefits...15 Economic Costs...17 Analysis and Inference Beijing Olympics...20 Economic Benefits...20 Economic Costs...22 Analysis and Inference London Olympics...25 Economic Benefits...25 Economic Costs...28 Analysis and Inference...29 Numbers Analysis...30 Overall Analysis and Inference...32 Recommendations...34 Limitations varying info from sources...35 Appendix
4 2 ABSTRACT When a city decides to undertake an Olympic Games, they do so with the notion that hosting the Olympics will provide many direct financial benefits to the city in addition to countless other indirect benefits. Like many activities, the Summer-Olympic Games tend to be more popular when it is warm, and this paper will focus on only the previous five Summer Olympic Games. As host cities look to cash in on the Olympic Games popularity, the number of Olympic infrastructure projects has skyrocketed, leaving many cities with facilities that cost hundreds of millions of dollars to build and nothing to use them for post-olympics. However, every few years' cities continue to compete vehemently to the win the bid for the host city of the next Olympic Games. This paper seeks to examine whether the benefits of hosting the Summer Olympics are valid and if they are substantially inflated, or non-existent. In part, it will focus on the broad economic benefits, the costs associated with it, legacy benefits,' other intangible benefits, and the overall net effect of these benefits and costs. This general purpose of this paper will be to analyze the previous five Summer Olympic Games and discern whether hosting the Summer Olympic Games is a profitable endeavor. INTRODUCTION It is a common belief among the general populace that taking on the challenge of being a host city for a Summer Olympics Games is an economically smart move. Hosting the Olympics is associated with the belief that the buzz of the Olympics will draw in sizeable crowds with a considerable number of tourists who will spend money in that city. In addition to this, other
5 3 direct economic benefits that are often linked to being a host city are the broadcasting revenue the city receives, licensing, increased employment, ticket sales to Olympic events, sponsorships, increased tax revenues, and greater investment in the host city and country. Furthermore, cities experience multiplier effects in which induced spending from tourists, employment increases, and overall economic stimulus supplement the direct economic impacts. An overall economic indicator of success and growth that will be measured is the Olympics effect on Gross Domestic Product (GDP), which is the total value of an economy s output of goods and services. Another perceived benefit is an increase in local pride from being a host city which can also translate into putting the city on the map.' Hosting the Olympics can put a city on the map by increasing visibility of the city and its attractiveness, which in turn, leads to more investments in the city and country and finally may result in increases in trade. However, these benefits are often perceived as greater than they truly are, in addition to a lack of or a complete misunderstanding of the costs associated with these benefits. The primary costs associated with host cities are the costs of planning, submitting a bid to the IFC, building infrastructure, operational costs, implicit costs, opportunity cost, and in some cases a decrease in other forms of tourism (Ricketts, 2012). Organizers often overlook these costs, assume unreasonable expectations for these expenses, and become so obsessed with the perceived benefits that they believe the benefits will always exceed the costs and fail to see the real costs of being a host city for the Olympic Games. While each Olympics Games share some of the same benefits and costs, due to the unique nature of the Olympics Games, each Games differs slightly in their benefits and costs, and thus, each must be examined independently.
6 4 Methodology: Measuring the economic impacts with exact precision is tough as it is challenging to gather data on every single dollar of economic benefit received by the host city. Additionally, due to the ambiguity of "economic benefits" and "economic costs," many sources cite significantly different numbers. Furthermore, intangible benefits such as being put on the map can lead to more outside investment (attracting businesses) and an increase in trade (Ricketts, 2012). The methodology will be conducted through primary-source research whereby a particular set of criteria will be evaluated for each city. Each city will be analyzed individually looking at the main benefits and costs the city endured, and whether the decision to host the Olympic Games can be considered an economic success. Additionally, the induced spending and benefits to the city provided will be incorporated into the overall analysis of the success of the host city. Recent Olympic Games in various cities have run up enormous bills and cost host cities millions of dollars that will never be recouped. In turn, this has prompted the question as to whether it is an economically smart, or even feasible decision, to host the Summer Olympic Games. This paper will focus on the last five Summer Olympic Games, as follows: 1996 Atlanta Olympic Games, 2000 Sydney Olympic Games, 2004 Athens Olympic Games, 2008 Beijing Olympic Games, and 2012 London Olympic Games. Furthermore, this paper will analyze only the Summer Olympic Games for purposes of comparability as the Winter Games, and Summer Games do not share the same type of attraction. The Summer Games are typically a larger magnet resulting in considerably different benefits and costs. Moreover, it is beneficial to analyze the five most recent Summer Olympic Games due to the extensive amount of data available, the fact that the modern Olympic Games are a larger spectacle than in the past, and the
7 5 ability to compare dollar amounts is easier as inflation plays a smaller role. While a great deal of research has been conducted on specific Olympic Games and specific benefits and costs of the Olympic Games, none attempt to examine the entirety of the most significant benefits and costs over a 20-year period across multiple host cities. This paper will seek to accurately perform a cost/benefit analysis on the direct and induced economic benefits of hosting the Summer Olympic Games, revealing the actual benefits and costs associated with hosting the Olympic Games. The organizing committees of potential host cities fail to recognize the true financial strain that hosting the Olympic Games can have. If organizing committees, public officials and city residents could understand the real burden of hosting the Olympic Games, and the economic strain it can cause, it is likely that fewer cities would be submitting bids to be Olympic Games host cities. This is not to say that economic benefits are the only factor is deciding to be a host city. Some cities may decide that even if the economic (tangible) costs exceed the economic (tangible) benefits, that the legacy benefits (intangible) make it worthwhile to be a host city. BACKGROUND Economic Benefits of Hosting Hosting the Summer Olympic Games can have several economic benefits associated with the city such as ticket sales, licensing, increased employment, broadcast revenue, sponsorships, and increased tourism. The largest sources of revenue for host cities is typically derived via broadcasting revenue or through sponsorships, with ticketing and licensing bringing in
8 6 considerably less (Baade & Matheson, 2016). The impact of tourism is particularly difficult to accurately quantify, given that it is impossible to collect information on how every single tourist spent their money. Also, some of the increased tourism cash flow merely represents substitute spending or a crowding out effect that would have otherwise occurred in a different segment of the tourism industry (Owen, 2005). The economic benefits will be significantly impacted by the size of the investment into the Olympics, as the hypothetical best case scenario involves a massive influx of tourism, active promotion of the city and country, and a sizeable injection of direct revenues and taxes into the city and country. Intangible Benefits of Hosting Intangible benefits, also known as legacy benefits, are simply subjective benefits that are unable to be measured in monetary terms. The different types of legacy benefits that come from hosting the Summer Olympics are things such as the long-lasting infrastructure that has potential to be used for many years into the future. In addition, hosting the Olympic Games sends a signal to the world that raises the stature of both the host city and the nation on a global stage (Ricketts, 2012). This intangible benefit comes in the form of increased media presence which in turn can lead to a long-term increase in tourism and in attracting new businesses. The Federal Reserve Bank of San Francisco suggests that hosting the Olympic Games sends a signal of trade liberalization to the world and ultimately results in greater trade activity in the long term. It is also suggested that this signal to the world also leads to long-term benefits in tourism, human capital, urban regeneration, and reputation. Furthermore, it is impossible to quantify benefits such as an increased sense of civic pride within the host city and nation, but these are certain benefits that are considered when deciding whether to submit a bid to host.
9 7 Costs of Hosting The costs associated with hosting the Olympic Games begins far before actual preparation for the games and starts with the bidding process which takes place seven years before the Olympic Games. Cities that interested in hosting the Olympic Games must create a National Organizing Committee (NOC) and submit a reasonable bid to the International Olympic Committee (IOC). The first-round applications fee alone per city was $100,000 in which eight cities applied for; four teams were then chosen to advance to the second round, in which they were required to pay an additional $500,000 fee. New York City officials estimated that their bidding process would amount to $13 million (Burton, 2003). Per the Federal Reserve Bank of St. Louis, "Interested cities spend up to $100 million to "woo" the delegates of the International Olympic Committee (IOC) to vote for their city." Once a city has been chosen by the IOC, the host city must begin spending capital to construct the massive amount of infrastructure required for new venues and to the Olympic Village (Ricketts, 2012). Additional infrastructure costs may arise from needing to make improvements to existing infrastructure in the host city such as roads, bridges, sewer systems, cleanup, etc. resulting in hundreds of millions and upwards of billions of dollars being spent to host the Olympic Games. The final cost of infrastructure is impacted significantly by the host cities current infrastructure, the willingness of private investors to invest money into Olympic facilities, and the government's inclination towards investing in Olympic projects. This represents an investment by the government in the hope that the revenues brought in by the Olympic Games can exceed the cost to host them. This investment, however, is funded by either increasing taxes or cutting spending on other government programs, resulting in lost opportunity costs as that money could have been spent on things such as healthcare, education, and charity.
10 8 Another opportunity cost many cities fail to realize is that construction for Olympic venues crowds out other construction projects in the local economy. Additionally, cities often create organizing committees for the Games which are tasked staging the games, but not necessarily large infrastructure projects. These committees still are responsible for most of the direct revenue brought in as well as the direct costs. Furthermore, maintenance of Olympic facilitates and the lost benefits of not utilizing them in the post-games period is costly (PWC Report, The economic impact of the Olympic Games, 2004). All of this, in turn, leads to many host cities experiencing cost overrun, which is the increase in total cost due to unexpected costs incurred more than budgeted amounts due to underestimation when preparing the budget. Furthermore, additional costs that must be considered are operational costs, ceremony costs, medical service costs, food costs, transportation costs, security cost, promotion, administration, among many other costs (Kang, 2008) Atlanta Olympics Economic Benefits Preceding the 1996 Summer Olympic Games the official report of the Games mentions Atlanta as showing higher interest in social sustainability with equality and equitable being two of the driving factors. The Olympics were viewed as the key revitalizing the city with excess money being put into fixing up the city and jump-starting the economy (Minnaert, 2012). Total direct revenue per the Atlanta Committee for the Olympic Games (ACOG) was $1.72 billion, however, this was a likely understatement of their true expenditures which likely reached nearly $2.6 billion, with the top contributors being: broadcasting rights of $568 million, joint ventures of
11 9 $426 million, ticket sales of $425 million, merchandising revenues of $31 million, and sponsorship revenue of $81 million. Atlanta is an exception in that their Olympic Games were not highly unprofitable for the city, resulting in an estimated economic impact to the Atlanta area of $5.14 billion (Newman, 2004). This $5.1 billion is generated through $2.6 billion of ACOG s expenditures and another $2.5 billion from spending by out of state visitors (Humphreys & Plummer, 1995). Regarding direct earnings, the Atlanta Olympic Games produced $1.91 billion total which correlated with an employment increase of 77,026 jobs. Of the $1.91 billion in direct spending, over half was earned by households, business services, lodging & amusement, retail trade, and eating and drinking. The 77,206 jobs added to the economy consisted primarily of lodging and amusements, eating and drinking. These numbers simply reflected estimates and best guesses at the time, and while current studies show that the actual number of jobs was roughly half of the estimate, and only leading to 2,472 permanent full or part-time jobs added, the temporary employment increase was a significant factor in the 1996 Olympic Games Success (Baade & Matheson, 2002). Private investment was stimulated in the Atlanta area with 7,500 hotel rooms being built to accommodate the influx of tourists. Additionally, the $1.7 billion privately-funded investment in Centennial Park and other areas of downtown Atlanta brought increased attention to the area and more investments in surrounding housing, hotels, restaurants, etc. (Glanton, 2009). Concerning tourism, it seems that the Olympic Games created a short-term spike in tourism that benefited from the Olympic legacy. Many restaurants, bars, hotels, and other businesses in Atlanta benefited greatly from the games to the tune of $14.7 billion tourist dollars spent in Georgia in Foreign direct investment into the city increased mildly following the Olympics, increasing from a growth rate of 7.7% in 1993, rising to 12.5% in 1994, before falling to 10.6% during the Games year and 7.9% the following year (Kang, 2008).
12 10 Regarding overall GDP, hosting the games did not have a significant impact on Atlanta other than a modest increase in the years before and after. While many industries experience significant growth before the Olympics, their aggregate is still insignificant when comparing to the total GDP of a city or country (PWC Report, The economic impact of the Olympic Games, 2004) However, while the Olympics did put Atlanta on the international map, it was short lived as it did not solve many of the underlying issues Atlanta, most notably their convention centers were too small to accompany big business. Other problems that plagued the city were a lack of entertainment and a variety of urban issues that caused Atlanta to be viewed as a boring city, unable to attract tourists and businesses (Engle, 1999). Economic Costs The total expenses for staging the games incurred per Atlanta Committee of Olympic Games (ACOG) were $1.72 billion, with the top five values being: construction, technology, host broadcasting, Olympic Village, and transportation (ACOG, 1996). A 2001 report from the United States General Accounting Office corroborates with earlier ACOG cost estimates and postulates that ACOG staging costs were $2.4 billion, with the cost being slightly higher than planners anticipated. This $2.4 billion in staging costs was funded mainly with $2 billion in ACOG revenues, another $234 million from the local government, and the final $193 million coming from the Federal Government (GAO, 2001). These expenses include all those incurred by ACOG, further direct capital costs would mount much higher to $4.1 billion and a total cost overrun of 151% per the Oxford Olympics Study 2016 (Flyvbjerg, Stewart, & Budzier, 2016). The post-staging game costs were financed almost entirely by private funds with nearly 85% of the funding coming from Coca-Cola alone (Zhao, 2010). A smart move by Atlanta was to house the athletes in student halls rather than build entire Olympic villages from the ground up.
13 11 Additional factors in keeping costs down for the 1996 Olympic Games was the massive commercialization of the games (Applebome, 1996). Supplementary capital was required for the Atlanta Olympic Legacy initiative, coming from the government in the form of a $500 million bond funded by the taxpayers that would cover security, improvements to local housing projects, improvements to infrastructure, construction of local pieces of art, and improvements to public transportation (Glanton, 2009). Analysis and Inference Overall, hosting the 1996 Summer Olympics seems to have been a modest economic success. ACOG generated a significant amount of direct revenue, and, regarding additional positive economic benefits, Atlanta prospered by most measures of economic success. Atlanta produced an impressive amount of direct spending into the city and state and created many jobs in addition to this. One of the most prominent lasting successes of the 1996 Olympics, Centennial Olympic Park, is one of Atlanta s most popular parks and is teeming with activity. Beyond Centennial Olympic Park, the $500 million bond allowed for infrastructure upgrades, a long-needed airport expansion, improvements in public transportation, and improvements in public housing projects. The results of the activity generated from this bond are Atlanta landmarks such as Turner Field, the Georgia State University Olympic Village Housing Complex, the Georgia Tech Swimming and Diving Center, among countless other beneficial projects. The area around the park is flush with recent developments with major hotels, condo s, and offices that continue to keep the area alive with economic activity (Bazemore, 2011). While the city did experience cost overrun, the net total economic benefit to Atlanta and the surrounding region is undoubtedly positive.
14 Sydney Olympics Economic Benefits Like the hope Atlanta had to revitalize their city, Sydney was hoping that the magnitude of the Olympics would be enough that it would have a positive economic impact on Sydney, and Australia. Studies done by professional services firms such as KPMG significantly overestimated the economic benefits to the city, especially in the expected future earnings coming from new infrastructure. The Sydney Organizing Committee for the Olympic Games (SOCOG) reported direct revenues of A$2.83 billion which was comprised mainly of broadcasting rights, ticket sales, sponsorship, and government funding. Another organizing committee, the Olympic Co- Ordination Authority (OCA) reports similar revenues to SOCOG with total operating revenue of A$2.86 billion. These revenues are primarily made up from broadcasting rights of A$1.32 billion, A$730 million from sponsorships, A$356 million in ticket sales, and A$174 million in the form of merchandise sales (Giesecke & Madden, 2011). The overall economic impact has been estimated between A$6.0-A$6.5 billion (PWC Drexel Study). The most likely scenario for real foreign direct investment induced by the Olympics is a 1.351% increase in New South Wales (NSW) and a 0.51% increase in real investment in all of Australia in the pre-games phase with diminishing returns during the Game year and post-games years. Sydney expected both an increase in foreign investments made resulting from their increased world presence and an increase in domestic investment related to the Olympics in expectation of residual returns (NSW Office of Financial Management, Research and Information Paper, 1997). Foreign investment rose from 2.6% in 1995 to 14.1% in 1998 in preparation for the games before falling to 1.3% during the Games year and falling temporarily -1.3% in 2001 before again rising to 15.3% in
15 (Kang, 2008). While foreign investment did not increase significantly following the 2000 Olympic Games, this is most likely due to the economic downturn Australia went through in the early 2000s, and the Olympics likely played a small role in this (Kang, 2008). Concerning other economic indicators, employment grew in the years leading up to the Olympics and swelled to a 15,600 increase in jobs at the peak and an increase in 5,300 jobs from the period (Arthur Andersen, 1999). Most of these were low skill jobs in construction, transportation, personal services, and hospitality. In the year 2000 Sydney reported nearly 8.7 million tourists, an increase of 8.7% from 1999 in which Sydney had 8 million visitors. Additionally, in the postgames years, Sydney reported 8.66 million and 8.6 million tourists in 2001 and 2002 representing only a 0.5% decrease from the games year (Kang, 2008). Australia saw an increase of Olympic visitors of two million in the pre-olympics phase and a stark increase of 14.9 million Olympic visitors in Concerning GDP, New South Wales experienced a 0.437%, 1.156%, and 0.152% increase in the years preceding, the year of, and the years after hosting the Olympic games (Madden & Crowe, 2005) Economic Costs In 2000, the Auditor-General of New South Wales concluded that the Sydney Games a total of A$6.0-A$6.5 billion, with the total cost to the public coming in somewhere between A$1.7 and A$2.4 billion. The net impact on the budget of NSW Government was a cost of A$1.326 billion, calculated via total Olympic costs of A$6,484 funded via A$4,447 from SOCOG, the Sydney Paralympic Organizing Committee (SPOC), the Commonwealth government, and the private sector. Additional tax revenue generated from the Olympics in addition to foreign exchange gains added another A$711 million to the funding of Olympic costs to the NSW government budget {[(6,484) + 4, ] = 1,326}. SOCOG total expenses of A$2.90 billion exceeded
16 14 their revenues of A$2.84 billion by A$59.8 million, and this was covered through government funding (Auditor-General s Report AUS, 2002). SOCOG costs were comprised chiefly from operating expenses of A$746 million, technology costs of A$407 million, administration and marketing costs of A$291 million, Games services costs of A$261 million, and communication costs of A$250 million. Total costs of venues and facilities reached A$3.03 billion, A$3.46 billion was spent on event-related expenses, another A$102 million for transportation and security, as well as all future maintenance costs associated with venues. Due to these high maintenance costs, many of the venues constructed in Sydney Olympic Park failed in the years following the Olympics as the venues failed to meet expected bookings and target revenues (Auditor-General s Report AUS, 2002). The investment into infrastructure was a massive expense for Sydney as the government invested A$350 million into upgrading the Sydney airport, another A$500 million on highway renovations and Olympic Village (among other projects) helping stimulate further economic development (Zhao, 2010). Total operating and event-related expenses incurred by SOCOG, SPOC, and other support services totaled A$3.46 billion. The Oxford Olympics study done in 2016 estimates that Sydney experienced cost overrun of 90% costing the city $5 billion in 2015 US dollars. In addition, to free up capital in the years preceding the Olympic Games, the government shifted money from healthcare and education to prepare for the games (Berlin, 2003). Analysis and Inference For the most part, it appears hosting the Olympics had a modest positive net impact estimated around A$6 billion for Sydney and Australia. Estimates from the Auditor-General of New South Wales reports that the direct (negative) economic impact on the budget of NSW for hosting the Olympics was A$1.326 billion and that economic growth was not stimulated to the extent that
17 15 pre-games economic impact studies showed. However, the games brought in a sizeable amount of direct revenue into the city in addition to an increase in temporary employment and tourism, in tune to nearly A$6.5 billion in total economic impact. However, with a minimum of $5 billion in total costs to stage the games and operate the games, the years of maintenance required on the newly constructed venues, the Sydney Olympics were certainly costly. Also, while some of the Olympic venues have been restructured for continuing use, many of the extremely expensive venues such as equestrian centers, softball compounds, and human-made rapids have not been used as much as expected, and these losses were unable to be recouped in many cases. Furthermore, had Sydney not invested so much into the Olympics they could have used that money for other expenses such as building/repairing infrastructure, money for health care, money for education, etc Athens Games Economic Benefits In preparation for hosting the games the Greeks spared no expense as the Olympics were returning to Athens for the first time since 1896, and Athens opportunity at reinventing its image. Clearly, the history involved played a large role in the Greeks decision to create an Olympics that signified the importance of the values of the Olympic Movement. Support for hosting the Olympics was widespread as 90% of the population supported hosting the Games; however, the public was not well educated on the true expenses of hosting the Olympic Games. Laying the groundwork for the Olympics included 62 work sites, which included 22 directly related to the Olympics and 40 works related to non-competition venues which were built to improve traffic
18 16 flow, reduce environmental problems, improve city infrastructure in a bad city districts, and increase the quality of life for all inhabitants and offer new opportunities for citizens after the games have passed. There was a general feeling that the hosting the Olympics presented an opportunity to improve the state of the country seriously. Per the Official Report of the XXVII Olympiad the ATHOC produced total direct revenues of billion which consisted mostly from broadcasting revenues of 579 million, sponsorships of 537 million, ticket sales of 194 million, financial revenues of 226 million, licensing revenues of 120 million, as well as Greek State Participation contributing another 283 million. ATHOC concluded its operations as a company in 2005 with a surplus of million, of which million wet to the Greek State to cover other related expenses, resulting in a net profit of ATHOC of 7 million. The total economic impact of the games between 2005 and 2016 is estimated to be 6.5 billion, with most of this benefit coming during the preparation of the Games. Foreign investment into Athens and Greece rose from 9.7% in 2002 to 14.7% in 2003 as the Games approached, and dropped to 7.7% during the Games-year and 2.4% in 2005 (Kang, 2008). The additional capital provided by the incremental increase in tax revenue amounted to billions from the increase in economic activity around the greater Athens area. These additional tax revenues were used to fund programs of the Greek State. Furthermore, with the large investment in infrastructure, this created a significant temporary increase in the labor sector with several jobs being created mainly in the construction industry and the hospitability and tourism industry, with many other induced jobs being created. The Olympic Committee of the Olympic Games officially employed 14,056 individuals during the entire pre-to-post Olympic Games period, with most of these being low paying service jobs. Another increase in labor sector came in the journalism industry as many media companies temporarily increased staff for the games to handle the vast increase in Olympic Games coverage
19 17 desired, with many of these jobs requiring formal educations. Statistics show that hosting the Games temporarily reduced the Greek unemployment rate from 11.2% to 9.7% from in preparation for the games, however in 2004 unemployment rose again back to 10.5% (Panagiotopoulou, 2014). More explicitly, the greater Athens area which had an unemployment rate of 12% from experienced even superior employment gains than Greece as Athens unemployment rate dropped from 12% to 8.54% in 2003, before increasing again in 2004 to 9.3%. Another meek achievement the Greeks achieved was an increase in the number of tourist arrivals in the period from 3,034,913 million to 3,872,156 million, before beginning to decline again 2008 due to the Greek economic crisis and several other factors (Panagiotopoulou, 2014). Greece was only able to entice 1 billion in foreign investments, almost completely through the security industry. In addition to this, the GDP growth rate of Athens fell rose 9.1% during the pre-games phase before leveling off to 7.7% growth during the Games and post-games (Kang, 2008). The final benefit that the city of Athens and the country of Greece received was a re-emergence of recognition of Athens as a world class city. This increase in perception of Greece was short lived however as the impending economic crisis would leave a colossal stain on the world's picture of Greece. Economic Costs The final costs for the 2004 Athens Olympic Games are often disputed and are vastly different depending on the source you are using. Most studies and sources agree that the final cost of the games cost ranged from a likely billion to 13.1 billion, far exceeding the original budget of a minimum of billion by 25% (Panagiotopoulou, 2014). This billion is validated by a November 2004 report from the Ministry of Finance detailing the Olympic
20 18 funding sources as 6.2 billion from the Public Investment Programme, 0.6 was the cost of the state budget between , and another 1.8 was given to ATHOC, totaling 8.6 billion. The Games were funded mostly via the Greek State Budget (Public Investment Program & Ordinary Budget) and ATHOC revenues, with a smaller amount coming from the Worker s Housing Organization and the private sector (Karatassou, 2015). The total expenditure by the Greek State range from 6 billion to 7.2 billion spent on Olympic works, sporting facilities, and security. Furthermore, the Ministry of Finance disbursed another 1.6 billion for construction costs related to Olympic venues. In preparation for the 2004 Games Athens, among other Greek cities, underwent significant infrastructure upgrades. Many investments by the Greek State had to be increased as the cost estimation in early years was drastically underestimated, and new investments had to be made to finish construction of projects. Massive state of the art athletic facilities, new roads, Olympic Village, and public transportation upgrades. ATHOC as a company reported total overall expenditures of billion, with most of the difference going to the Greek State. Furthermore, the costs of the Games were substantially inflated due to the Greece 2004 initiative set forward by the Greek government and was included in the Olympics projects category. Many of these projects included renovation and reconstruction of facilities that were not directly related to the Olympic Games but would benefit the citizens of Greece. Of the nearly 8.5 billion in costs roughly 6 billion was covered through Greek State expenditures (Karatassou, 2015). This 6 billion is comprised primarily of infrastructure, security costs, and the Greece 2004 Program. The other 2.5 was contributed via billion from ATHOC and $380 million from private investments. The major costs ATHOC bore were technology, operational and support costs, administration services, logistics, marketing, and expenditures for the Paralympic Games. It is also important to consider the opportunity costs such as investment
21 19 into healthcare, education, and private investment associated with the Games. It is estimated that hosting the Olympics created an opportunity cost of 0.2% of GDP. Had Greece forgone hosting the Olympics and instead invested money elsewhere, the funds could have potentially yielded much more economic benefit for the Greek economy (Karatassou, 2015). Another opportunity cost Athens faced was the loss of valuable city real estate. Many of the facilities and venues used for the Athens Games now lay dormant and unused, a landmark to the economic mismanagement of the 2004 Olympic Games. Some studies have concluded that cost overrun of 49% and associated debt of the Olympic Games played a role in exacerbating the Greek economic crisis that began in 2007 (Flyvbjerg, Stewart, & Budzier, 2016). Analysis and Inference Hosting the Olympic Games was a rash decision undertaken by the city of Athens and the Greek economy. While the Games did bring a surge of revenue into the city and country, it was not even close to enough to offset the massive infrastructure costs as the cost overrun ran at 49%, which while not horrible, is extremely significant when talking about billions of dollars. The games were important regarding promoting the city of Athens and the country of Greece, signaling to the world that they are a first-class country capable of handling mega-events such as the Olympics. However, the capability to host mega events is not necessarily correlated with significant economic benefits. Athens and the Greek State spent a colossal amount of money on improving the cities infrastructure for both Olympic and non-olympic projects such as Greece 2004, much of which cost more than initial estimates as planners and engineers were rushed into finishing the facilities. While this may be feasible in countries with larger economies of scale, access to more tax revenue, and the infrastructure already in place, it is not a sensible
22 20 decision for smaller economies such as Greece. Nonetheless, there were positive economic benefits, including the 2.9 billion the Greek State received in the form of tax revenues and social security contributions because of increased commercial activity and employment. ATHOC also had a positive operating income of 131 million, of which all but 7 million went back to the Greek State. Certainly, hosting the games was beneficial in the actual years of the games as it raised GDP in those years, lowered the unemployment rate, and brought an influx of revenue into the city and government. Conversely, because Athens was not able to find a way to utilize their lavish Olympic facilities after the Games this lead to a net decrease in GDP of 0.2% in the years following the Olympics and leading into the Greek recession Beijing Games Economic Benefits After winning the bid to host the Olympics, China began a massive undertaking of revitalizing Beijing s infrastructure that would last seven years and was an opportunity for Beijing to present themselves as a major world player. Like other Asian countries such as Japan and South Korea, China hoped the Olympics would help establish the perception of them as world power economically, socially, and politically (Sands, 2008). The Beijing Olympic Games Organizing Committee (BOCOG) was tasked with staging the games, including the building of massive infrastructure projects. BOCOG shows direct revenues of $1.625 billion comprised of broadcasting rights of $709 million, licensing/sponsorships of $330 million, ticket sales of $140 million, government subsidies of $100 million, and another $100 million coming from national and municipal governments (Brunet & Xinwen, 2008). The GDP growth rate of China grew to
23 % in 2007 due to the increase in investment, construction projects, and other Olympic projects, which was the country s highest GDP in a decade. Additionally, the China Daily reports that the increase in GDP contributable to the Olympics is negligible, and is likely only adding one percent of growth (Trofimovskaya, 2012). The annual growth of GDP in Beijing has been over 10% for many years, and the one percent increase brought by the Olympic activity is not significant to overall GDP. Per BOCOG, the investments related to the Beijing Games totaled $ billion dollars with most of the investments going towards environmental protection (60.5%), transportation (25.8%), and Olympic sports facilities (10%) with 85% coming from public investment and the other 15% being financed privately (Brunet & Xinwen, 2008). However, later studies indicate that the final investments may have been as high as $38billion (Khan, 2010). Nevertheless, these investments have produced positive returns such as Beijing's new wastewater treatment plants, solid waste processing facilities, reduced reliance on coal, oil, and other resources, enormous investments in renewable energy, and other green initiatives will benefit Beijing and China for years to come. The investment seems to have had a positive impact on net economic growth due to the substantial investment in information technology, banking, and the services sector. Furthermore, the Beijing Games have fast-tracked their increase in foreign investment, investment in Chinese realty, foreign ideas, and globalization (Sands, 2008). Investment into Beijing increased from 3.3% in 2001 to 5.2% in 2003, before falling to 3.9% in the games year and 2.3% the following year (Trofimovskaya, 2008). In preparation for the Games, Massive investment is meant to stimulate the economy, and the citizens are supposed to benefit from this in the form of increased employment and better government services. Jobs in Beijing and China steadily grew in the pre-games years leading to an increase of 2,788 permanent full or part-time jobs. Total employed persons within relevant industries rose
24 22 significantly leading up to the Olympics. This was stimulated by a five year period of employment growth in the construction, high-tech, modern manufacturing, social services, and agricultural industries. Overall, the Olympics injected a significant amount of direct revenue into Beijing and raised the profile of the city leading to an increase in foreign investment. Economic Costs Little information exists on the true costs of the Beijing Olympics and final costs range anywhere from $6.8 billion to $44 billion, making it, by far, the costliest Olympic Games ever. The Oxford Olympics Study estimates that Beijing cost $6.8 billion and caused cost overrun of 2%. The official BOCOG report shows virtually no figures or totals in their finance chapter of their Olympic Charter, however, likely estimates of ~$20-$44 billion in total expenditures, with most of this going towards Olympic sports facility projects, operational costs, ceremony expenses, and administration expenses is realistic (Hashmi, Fida, & Alhaky, 2008). A 2009 report from the Chinese National Audit Office states that BOCOG expenditures total $2.74 billion (CN billion) with broadcasting, accommodation, medical and transport services being the largest BOCOG expenditures. The most substantial costs were in the form of government investment, with the little help from corporate underwriters, into massive infrastructure projects like the $500 million Bird s Nest or a $3 billion terminal with many of these facilities left unused following the Olympics (Fowler, 2008). An additional $1.1 billion was needed for transportation and infrastructure improvements, $200 million for urban renewal, and $3.6 billion for technology. Corporate sponsorship and investment proved to be $2.1 billion Indirect investment by the Chinese government into environmental protection and transportation cost $ billion and direct investment from the Chinese government into things like Olympic facilities as well as
25 23 basic construction added another $ billion. While this may seem extremely expensive, it was somewhat offset by the fact that China had a GDP of $4.52 trillion in 2008, meaning that even if the highest estimates are correct at the cost of $44 billion, it still is only less than 1% of the country s GDP. This still raises the issue of opportunity costs, however, as this money could have been put towards education, healthcare, human s rights programs, or social-welfare programs as China is notoriously lagging in those areas. Furthermore, in anticipation of 4.5 million tourists spending $4.5 billion in 2008, with 550,000 of those visitors coming to the Games, Beijing experienced a boom in hotels built with an increase of four and five-star hotels, adding 9,739 rooms. However, a strict Chinese policy on foreigners with Visas as led to an ensuing decrease in tourists. The growth in visitor numbers had been rising around 6% steadily up until March 2008, but by April the number of visitor numbers was 2% lower than the previous year, and it continued to fall until the number of visitors was 5% less than last years which correlated to 6 and 14 million fewer tourists. Beijing fared worse than China and had 30% fewer visitors in July 2008 as for July 2007 and an overall drop of 18% fewer tourists in 2008 than in 2007 (Beijing Olympic Update, European Tour Operators Association, 2009). However, it is important to consider the fact that other Asian countries experienced similar declines in tourism during this time and this was in the early years of the Great Recession in the United States. Another significant cost the city of Beijing faced was the issue of forced evictions, while although they have occurred in China for many years, was notably worse preceding the 2008 Beijing Games. In preparation for the games many densely populated neighborhoods were cleared away and comprehensively torn down in order free up urban space for new infrastructure projects and housing developments for higher income earners. The Center on Housing Rights and Evictions estimated that 1.5 million Chinese citizens were forced out their homes in Beijing,
26 24 many times with zero or at best inadequate compensation, while the Chinese government continues to claim only 6,000 families were relocated and every family received adequate compensation (Blanchard, 2008). Analysis and Inference Reaching a conclusion on the relative success of the Olympics is tough for Beijing, and for China. With an approximate price tag of $44 billion, it is likely the most expensive summer Olympics Games ever held in addition to social, political, and opportunity costs. While this is somewhat offset by the massive economic output of China, it is still billions of dollars that could have been better spent. However, the Beijing Games received an unprecedented amount of media coverage and sponsor presence than any other Olympics before, putting them "on the map." In addition to this, the massive amount of money invested by the Chinese government helped in cleaning up the environment in and around Beijing, created a more modern city, and led to vast improvements in transportation. BOCOG reported a net income of $19 million, but this is widely disputed by other sources, meaning they likely lost money. Some economic growth can be attributed to the Beijing Games as almost 3,000 new permanent full or part-time jobs were created, foreign investment increased, and the city was modernized. The Beijing Games can also be credited with creating new jobs, injecting revenue into the city. Additionally, the games seem to have had an adverse impact on tourism in Beijing and China as the number of visitors to those areas decreased significantly in 2008 from This reduction in tourists can be partly attributed to a strict visa policy, and a crowding out effect in which many people believed the Olympics would create such a crowd that they did not travel at all. Though the Beijing Games
27 25 did bring several economic benefits, it is difficult to argue that the massive amount of money spent and the human s right violations that occurred were offset by the benefits the city received London Games Economic Benefits In 2003, the mayor of London at the time, Ken Livingstone, promised that London s hosting of the 2012 Olympics would bring the single biggest transformation to the city since the Victorian Age (Monks Kieron, 2016). The Olympics were seen by London as a chance to revitalize East London, which was notorious for being the most neglected, and poverty-stricken area of London. Because the London Olympic Games took place so recently in 2012, there is a sharp contrast to the lack of available economic data surrounding the event. London, like other Olympic host cities, has claimed that their investment into the Olympics paid off. The British Government produced a substantial five-year, 1000-page report prepared by a team of respected consultants. The report claims that Britain had earned at least $16 billion from the Games, with the future forecasts indicating that Britain would receive tens of billions of dollars from hosting the 2012 Olympic Games in London. A government-sponsored report was prepared by the professional services firm Grant Thornton that brings into the question of the validity of the report, in addition to the constant reassurances from Business Secretary Vince Cable (Shapiro, 2014). London enjoyed moderate success in attracting Olympic tourists, with more than 3 million overseas visitors coming to Britain in August The 590,000 Olympic specific visitors spent an average of 1,290 while visiting, compared to 650 for the average visitor (Telegraph Staff, 2012). This success, however, was still a five percent decrease in total visitors in London from
28 26 the prior year. Per a report from the Economic and Social Research Council, the London Organizing Committee of the Olympic Games had total direct revenues of billion pounds consisting mainly from 971 million from sponsorships, 673 million from ticket sales and hospitality income, 378 million was contributed by the IOC, 111 million from a Paralympic subsidy, 84 million from licensing, and the rest coming from various other sources. A progress report from the UK Trade & Investment indicates that the 2012 London Games generated a total of 9.9 billion in economic benefit from Olympic-related activities (UK Trade & Investment, 2013). Another Oxford Economics study estimates that the Games will have generated a total of 16.5 billion pounds in economic benefit to the UK, stemming from pre-games construction activity and all economic activity during the games (Olympic.org, 2013). The UK Trade & Investment Report goes so far as to claim that UK companies are winning millions of pounds in construction contracts for other Olympic games and 1.5 billion from Olympic-related highvalue opportunities. The report additionally goes on to say that the Olympics helped increase foreign inward direct investment, to the tune of 31,000 jobs added to the UK. Between 2005 and 2014 employment grew at a rate of +0.47% per year on average, while London s employment rate grew at a rate of +2.25% during the same period. As London was already one of the leading first world cities, the effects on employment proved to be more modest in overall employment and temporary employment specifically for the Olympics. It is likely that the Olympics did reduce the rate of decline in manufacturing due to the number of infrastructure projects, with the construction industry falling 2.3% in the UK in 2012 and rising 1.5% in London. While it is likely that the hosting of the Games was beneficial for employment in London, it should be noted that London had a much higher growth in population during this time-period, in addition to most of the jobs added being in the financial services industry. During the games, a total of
29 27 46,000 people were employed in constructing Olympic Park and Olympic Village, according to Olympic.org. In addition to this, the report suggests that the 2012 Games are expected to create nearly 18,000 additional jobs per year between This is in direct contrast to a report published by the Economic & Social Research Council, in addition to this, it is unlikely that London "bucked the trend" of a single short-term employment boost from the Olympics, followed by a small gain in permanent employment. This brings into question the bias of not only the International Olympic Committee but virtually every other pre-games impact study that has been conducted, going back to the notion that pre-games economic impact assessments are almost always overstated. This report from Olympic.org also claims that a significant boost in tourism helped lift the British economy, again, in direct contrast from the ESRC report. Considerable growth in the construction industry can be attributed to the largescale infrastructure projects London had to undertake in preparation for Games, and the growth largely ceased after the Olympics ended. Foreign direct investment into the United Kingdom increased significantly before and following the London Olympic Games from a low of billion in 2003 to high of billion in 2005 and stabilizing again at billion following the Olympics in However, due to the timing of the London Games, it is likely that these large fluctuations were due to the global economic recession in 2008, while the UK Trade & Industry reports that Games brought in an additional 2.5 billion inward foreign direct investment into the UK (ESRC, Olympic Games Impact Study London 2012, 2015). The UK Trade & Industry report also accounts that the 2012 Olympics brought an additional 5.9 billion in sales and promotions related to the Olympics, as well as another 1.5 billion in high-value overseas contracts. While no studies have determined the overall effect of the Olympic Games on the GDP of London, the pure numbers can provide some clarity. During the quarter in which the Olympics took place in
30 28 London, economists predicted GDP growth at 0.4% and it ended up being 0.6%, a net positive increase of +0.2% in GDP. The UK's service industry which makes up 75% of the GDP, grew at a rate of 1.3% during the same quarter. However, these gains were short lived and did not represent a sustainable solution for Britain s financial problems. The rise in GDP was one-off boost per former British Prime Minister David Cameron. The economic benefits of the Olympics to London consist of brief benefits in the form of short-term employment increases, modest short term increases in GDP, a small increase in foreign direct investment, and Olympic boom to the city. Economic Costs To operate a successful 2012 Olympics, London needed new sports facilities and improved city services and infrastructure, which proved to be extremely costly. Pre-games total costs of hosting were estimated at 3 billion but quickly increased to 9 billion, before falling slightly to 8.5 billion in July 2012 (The Olympics and Economics 2012, Goldman Sachs). Final budget estimates of August 2012 before put the total cost at billion. The Oxford Olympics Study done in 2016 estimates that the total expenses of the London Games were 9.3 billion with a cost overrun of 76%, making it the costliest Summer Games in history as the final cost of the Beijing Games is still highly disputed. LOCOG staging expenditures totaled 2.61 billion which was comprised of mainly venues expenditures, technology costs, security costs, and marketing. The ODA (Olympic Development Authority), which was charged with the task of delivering the venues, infrastructure, and legacy of the 2012 Olympic London Games, reported total costs of billion. More specifically, 709 million was spent on Athletes Village, 1.09 billion on
31 29 Olympic Park, billion on infrastructure, 290 million on improving community sports, 475 million on policing and security, and the remaining amount went to public works (ESRC, 2015). The 9.3 billion price tag was mostly funded by the Central Government of Britain who provided 6.25 billion in funding, another 2.18 billion coming from the national lottery, the Greater London Area (GLA) Olympic Precept (tax specifically for Olympic funding) afforded another 625 million, and the remaining 250 million was supplied the London Development Authority(LDA), a functional body of the GLA. Furthermore, it is likely London experienced a displacement effect on their tourism industry during the months surrounding the Games. Several tourist attractions that regularly attract travelers saw a reduction in their visitor numbers, such as the Adelphi Theatre in London's West End, which received 137,000 fewer visitors in August 2012 than they did in August 2011 (Appelbaum, 2014). Another belief is that London also experienced a crowding out effect as the perception among populace was that London would be overcrowded with Olympic tourists, and thus, not worth visiting during that time. Analysis and Inference It is too early to develop a reasonable conclusion on the economic effects of hosting the 2012 Olympics for the city of London. London experienced an immediate positive economic impact from hosting through increases in consumer spending, economic output, and UK residents incomes. Additionally, London anticipates long-term economic benefits including an increase in jobs, growth of GDP, increase in economic output, and increases in total economic stimulus. The substantial effort put into revitalizing East London has led to an increase in the number of homes being developed through the redevelopment of Olympic Park, the construction for a new commercial district has begun, the unemployment rate has fallen, and infrastructure has
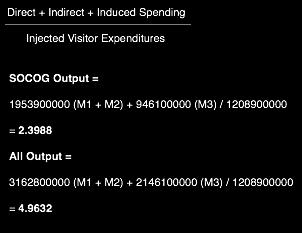
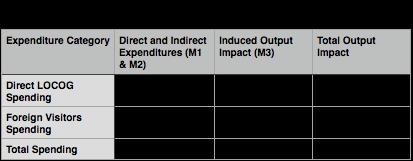
32 30 improved. Despite these successes, the final cost for the city and the UK was extremely high. The money used for the Olympics may have been better utilized through direct government intervention such as refining social programs, improving general infrastructure, or in decreasing the number of homeless in London. The housing developments stemming from Olympic Park have drifted from their original purpose of low-cost housing, and low-income individuals are being priced out. Olympic stadium was sold for next to nothing to Premier League soccer club West Ham United for just 15 million, a massive markdown from the initial cost of 700 million, one of many venues either under-utilized or completely wasted after the conclusion of the 2012 Olympics. It is too early to make any final judgment concerning the economic success of these Games. Only time will tell how much of increase in employment, GDP, and total economic output occurs vs. what is estimated. Furthermore, ongoing projects and proposals related to the use of Olympic venues could lead to long-term benefits for the Greater London area. Numbers Analysis When calculating the overall economic impact to a city, it is necessary to consider the potential multiplier coefficients i.e. money being spent and re-spent in an area by foreign visitors, known as induced spending. More specifically, a multiplier coefficient represents a factor of proportionality that measures how much an endogenous variable change in response to a change in some exogenous variable. For example, suppose the Olympic games add X number of dollars to a bar owner Y s profit margin, prompting the owner to hire an additional M workers. While money spent by Olympic Committees and the economic impact from local residents is still an added benefit unique to being an Olympic host, the multiplier coefficients should not be applied
33 31 to these sources as the money is only being recycled over and over with no real economic growth. This means that multiplier coefficients should only be used on those visitors whose sole reason for visiting was the Olympic Games. The new money supply introduced to a community is dispersed and represented through multiple M levels. The formula for calculating multiplier coefficients in place of multipliers is completed as shown: Direct + Indirect + Induced Effects Injected Visitor Expenditures Direct effects (M1) are the direct spending through Olympic committees, tourist spending, new employee salaries, etc. Indirect benefits are the second round of spending (M2) from local businesses and government entities that occur due to the first of direct spending. Beyond this are the ripple effects of the third wave of spending (M3), produced by the direct and indirect effects of these organizations employees spending some of their salaries and wages on different business in the city. This process of the third wave of spending known as induced spending is welldepicted in Appendix C Multiplier Effect of Visitor Spending at Sports Event. These multipliers represent the amount of additional induced spending that occurs because of the direct and indirect expenditures. For example, (see Appendix), Atlanta experienced foreign visitor spending of $1,145,994,657 while ACOG expenditures totaled $2.6 billion meaning that the multiplier coefficient experienced because of Olympic expenditures is E.g. the direct and indirect expenditures induced a multiplier of in spending and overall economic benefit. Looking at each Olympics individually a pattern appears suggesting a multiplier coefficient between four and five for Atlanta, Sydney, and Athens all moderately sized cities that draw usual tourist crowds. The multiplier analysis showed Beijing had a multiplier of suggesting that because Beijing was a less-visited tourist destination than the three cities mentioned above they
34 32 experienced a tourist boom that enhanced their induced spending effects. Conversely, London is a world-class city and one of the most visited cities in the world and experienced a multiplier coefficient of , indicating that London experienced much less of an induced spending effect due to their already top-tier status. Overall Analysis and Inference Looking at the past five Summer Olympic Games in aggregate, the benefits associated with hosting the Olympic Games often outweigh their enormous costs to national and municipal governments and the opportunity costs associated with this government spending. The numerous challenges of hosting the Olympics create enormous expenditures that governments often fund, at the expense of using that money for alternatives. Determining the total economic impact from hosting the Olympics proves tremendously challenging due to the amount of conflicting data and reliability of economic impact models approximating cumulative impacts. Additionally, it is common for central governments to expend massive amounts of capital in preparation for the games, urban renewal, transportation improvements, etc. that are beneficial to the community and surrounding areas, and as such, should be treated as a benefit to the city. However, in place of spending of healthcare, education, social welfare programs, etc. an opportunity cost is always present when determining the economic impacts of specific actions (the use of government funds for Olympic-related projects vs. the use of public funds for other programs). Of the five cities analyzed, only Beijing could not achieve a positive net economic benefit to the city and surrounding areas. While the General Auditor of NSW Australia reported a negative economic impact to the budget of A$ billion, and the government report provided by Greek State estimates that the Olympics cost the city of Athens and surrounding areas 0.2% of GDP, or $-
35 33 479,495,240, these government losses are offset by the induced economic benefits provided from hosting the Olympics. It is likely that Beijing was the costliest Olympics in history. However, the lack of proper reporting cannot corroborate this. Moreover, much of the massive Chinese government expenditures went towards programs and initiatives to improve environmental conditions, improve transportation, and create a more modern Beijing. Furthermore, while the economic effects to London may still be occurring, it is probable that the city will receive a positive net economic impact from hosting the Olympic Games. Many of the benefits these cities receive from hosting the Olympics, such as public works improvement, community development, induced spending of tourists, world recognition, among many others, are difficult to measure and assess their economic impact. Public works improvement and community development often improve areas to the point that these regions attract more businesses, apartment complex developers, and more investment. The tourism spending total is hard to establish as determining how every tourist dollar was spent is impossible. Additionally, the dollars brought in by tourists, increases in foreign direct investment, government spending, etc. all have multiplier effects that are difficult to estimate. Furthermore, the signaling from the global recognition as an Olympic city improves city and country citizen pride and can lead to long-term increases in tourism and foreign direct investment. However, while some benefits are difficult to measure, so are the opportunity costs associated with the immense government spending. Government spending can be spent on improving education, healthcare, social programs, and a myriad of other better issues.' Though it is meaningless to attempt to speculate whether the government would have provided a better return on investment had it gone to better issues.' Cities are often subject to manipulation through organizing committees with conflicting interests at mind. Additionally, many economic
36 34 impact studies are exaggerated nearly every time as those receiving the benefits fund the studies. Most benefits experienced by hosting the Olympics go to parties who experience microscopic to nothing in costs. The parties who fund Olympic impact studies are often crafty and deceitful businessmen and politicians: these parties will misjudge the true cost to taxpayers while overestimating the benefits received by the taxpayers. General economic impact analysis (see Appendix A) was conducted by projecting the total estimated positive economic impacts to the region and deducting the negative economic impacts to the city and surrounding area. Positive impacts were constituted by economic effects that positively affected the city/region such as direct Olympic Organizing Committee for Olympic Games spending, and the induced economic impacts such as tourism spending, increased tax revenues, increased foreign direct investments, and direct revenues in various forms. Negative effects typically only included local/central government Olympic-related spending as the opportunity cost generated is practically impossible to determine with accuracy. Analysis showed that every city except Beijing could muster a positive economic impact to the city, and even Beijing may have received enough in benefits to offset their massive spending. While cities often spend vast amounts of capital on infrastructure, transportation improvements, urban renewal, etc. and do not make a profit from these initiatives, the added benefits to the city are a direct result of that city hosting the Olympics and the government investments. Recommendations There are limited potential solutions for the economic issues plaguing the current Olympic Games hosts, however, with specific actions undertaken, Olympics hosts can receive positive economic impacts. One such recommendation is to revisit previous Olympic Games hosts to
37 35 acquire economies of scale. By using the same venues, athlete villages, among other reusable Olympic resources, cities can achieve economies of scale required to gain a return on these significant investments into infrastructure, transportation, and community development. Furthermore, the one-time benefits of increased tourism, induced spending, temporary employment boosts, temporary boosts to GDP, among others received would be experienced far more often with select Olympic cities increasing their positive impact. The 1996 Atlanta games proved to be reasonably profitable and provided a sizeable positive economic impact to Atlanta and the surrounding area. Furthermore, much of Atlanta s success can be attributed to their massive use of corporate sponsorship and use of existing infrastructure, two more recommendations for future Olympic hosts. The use of standing infrastructure for athlete housing and either (a) using existing athletic venues or (b) utilizing athletic venues for residual revenue post-olympic Games and corporate sponsorship can provide enormous sums of capital and financing. Additionally, those governments imposing taxes to specifically financing Olympic costs, creating special lotteries to raise capital, and create investment funds with the sole purpose of generating returns to be used on Olympic costs will fare far better than those that do not. Selecting one to two cities per continent would allow for these cities to achieve economies of scale, receive economic benefits of hosting the Olympics more often, and allow for normal community development. Furthermore, achieving economies of scale will allow the return on investment on Olympic venues to be much higher, reducing the opportunity costs. Additionally, select Olympic cities would eliminate the need for any new cities to spend massive amounts of money on hosting the Olympics, abolishing the opportunity costs experienced by the entirety of the country with hosting the Olympics. Limitations to Research
38 36 The limitations of this research included wavering information from sources, lack of official government data/biased studies, inability to apply official multipliers to input-output model in determining economic success of hosting, and difficulty in the judgment of what constituted a success in hosting the Olympics. While conducting research, it was common to discover sources with far different numbers representing the economic impacts and costs of hosting the Olympics. Additionally, many sources had wavering claims about other Olympic benefits such as tourism, employment, intangible benefits, and costs of hosting. The lack of post-olympics official government reports and impact studies severely lacked in comparison to the number of pre- Olympic government reports and studies. Due to the bias of those parties who receive the preponderance of the benefits of hosting (while also receiving the least in costs), creates a situation in which there are mountains of research on the benefits of hosting pre-olympics and a nearly complete lack of post-olympic research conducted by these parties. Furthermore, in conducting research, other Olympic economic impact studies often referenced the Regional Input-Output Modeling System (RIMS II) among other models in determining the financial success of a host city after hosting the Olympics. The RIMS II model uses multipliers to attempt to estimate how much a one-time or sustained increase in economic activity in a particular region will be supplied by industries located in the region, the model is particularly useful for State and Local governments to estimate regional economic impacts from events or to assess the impacts of tourism. The final limitation of this research was the tremendous difficulty of determining what composed a successful Olympic Games host. Determining success included not only the positive economic benefits received, the costs associated with those benefits, the opportunity costs, in addition to considering the intangible benefits of hosting. For example, while China likely spent tens of billions of dollars on the Beijing Olympics, and incurred
39 37 massive opportunity costs, they could achieve recognition as a global city and complete immense upgrades to environmental programs, infrastructure, technology development, among other numerous non-economic benefits.
40 38 Appendices: Estimated Economic Output Impact of 2012 Olympic Games Appendix (es) A: Multiplier Analysis

41 39

42 40
43 41
44 42
45 Appendix B: General Economic Impact Indicators 43

46 Appendix C: The Multiplier Effect of Visitor Spending at a Sports Event. 44
IOC SOCIOECONOMIC IMPACT OF OLYMPICS PAGE 1. IOC International Olympic Committee Socioeconomic Impact of Hosting the Olympic Games
 IOC SOCIOECONOMIC IMPACT OF OLYMPICS PAGE 1 BACKGROUND PAPER: IOC International Olympic Committee Socioeconomic Impact of Hosting the Olympic Games INTRODUCTION: Brazil has been and will be under the spotlight
Learning from experience: How hosting the Olympics can leave a positive legacy
 F E B R U A R Y 2 0 17 Learning from experience: How hosting the Olympics can leave a positive legacy Bill Hanway Careful planning and an eye on the future can help the cities that host them. Deciding
We Finally Won Something! How Special Events and the 1996 Olympics Contributed to Georgia s Economic Growth
 Georgia Economic History SOCIETAL & TECHNOLOGICAL GROWTH IN MODERN GEORGIA We Finally Won Something! How Special Events and the 1996 Olympics Contributed to Georgia s Economic Growth Enduring Understanding
What did the World Student Games do for Sheffield? The 1991 Games as the catalyst for the regeneration of Sheffield
 What did the World Student Games do for Sheffield? The 1991 Games as the catalyst for the regeneration of Sheffield Peter Taylor Emeritus Professor Sheffield Hallam University England Why host a major
Fiscal Impact of SunTrust Park and The Battery Atlanta on Cobb County Executive Summary Sept. 18, 2018
 Fiscal Impact of SunTrust Park and The Battery Atlanta on Cobb County Executive Summary Sept. 18, 2018 Overview Historically, professional sports stadiums were privately owned by the sports teams that
R. M. Nureev, E. V. Markin OLYMPIC GAMES ECONOMICS
 R. M. Nureev, E. V. Markin OLYMPIC GAMES ECONOMICS Moscow, 2015 1 Public Business SUMMARY The role of sports mega events for economic and political life of the nations are strongly increased. It presents
Major sports events Are they worth the money?
 Major sports events Are they worth the money? Harry Arne Solberg Trondheim Business School Sør-Trøndelag University College Outline The stakeholders involved in major sports events The cost side The revenues
Dr. Greg Hallman Director, Real Estate Finance and Investment Center (REFIC) McCombs School of Business University of Texas at Austin
 McCombs School of Business University of Texas at Austin") Dr. Greg Hallman Director, Real Estate Finance and Investment Center (REFIC) McCombs School of Business University of Texas at Austin POWERPOINT PARTNER The US Economy today, with a close look at jobs
Dr. Greg Hallman Director, Real Estate Finance and Investment Center (REFIC) McCombs School of Business University of Texas at Austin POWERPOINT PARTNER The US Economy today, with a close look at jobs
Zhang Shuguang. The Development of Community Sports Facilities in China: Effects of the Olympic Games
 Zhang Shuguang The Development of Community Sports Facilities in China: Effects of the Olympic Games Zhang Shuguang China Sport Information Center, Beijing, P.R. China With the influences of the 2008 Beijing
THE PERRYMAN GROUP. The Economic Benefits of the Precision Dance Industry Inspired by the Kilgore College Rangerettes
 The Economic Benefits of the Precision Dance Industry Inspired by the Kilgore College Rangerettes THE PERRYMAN GROUP 510 N. Valley Mills Dr. Suite 300 Waco, TX 76710 ph. 254.751.9595 fax 254.751.7855 info@perrymangroup.com
ECONOMIC DEVELOPMENT ELEMENT
 ECONOMIC DEVELOPMENT ELEMENT Background The Economic Development Element considers labor force and labor force characteristics, employment by place of work and residence, and analysis of the community
Economic Transformation and Recovery in Hong Kong and Singapore
 School of Economics and Finance, The University of Hong Kong Presentation given at the followings : - Zonta Club 1999 Accountancy Conference, Vocational Training Council on October 8, 1999 The Society
By making use of SAFRIM (South African Inter-Industry Macro-Economic Model) By Jeaunes Viljoen, Conningarth Economists, 1
 By Jeaunes Viljoen, Conningarth Economists, 1") By making use of SAFRIM (South African Inter-Industry Macro-Economic Model) By Jeaunes Viljoen, Conningarth Economists, South Africa 10/13/2011 1 1960: The economy experienced high growth rates mining
By making use of SAFRIM (South African Inter-Industry Macro-Economic Model) By Jeaunes Viljoen, Conningarth Economists, South Africa 10/13/2011 1 1960: The economy experienced high growth rates mining
THE ECONOMIC CONTRIBUTION FROM HORSES
 THE ECONOMIC CONTRIBUTION FROM HORSES ECONOMIC CONTRIBUTION FROM HORSES HIGHLIGHTS The horse industry contributes more than $19 billion annually to the Canadian economy On-farm activities with horses generate
Hunter and Angler Expenditures, Characteristics, and Economic Effects, North Dakota,
 Agribusiness and Applied Economics Report No. 507-S January 2003 Hunter and Angler Expenditures, Characteristics, and Economic Effects, North Dakota, 2001-2002 Dean A. Bangsund and F. Larry Leistritz*
The End of Hyper growth: Political and Economic Responses to a Slowing China
 The End of Hyper growth: Political and Economic Responses to a Slowing China Barry Naughton IR/PS, UC San Diego 5 th Annual G2 at GW Conference October 12, 2012 Conclusions (Seriously) Forces that are
Euro 2012 economic impact on host cities in Poland
 MPRA Munich Personal RePEc Archive Euro 2012 economic impact on host cities in Poland Krystian Zawadzki Gdańsk University of Technology December 2013 Online at http://mpra.ub.uni-muenchen.de/64522/ MPRA
The University of Georgia
 The University of Georgia Center for Agribusiness and Economic Development College of Agricultural and Environmental Sciences Economic Impacts of Alabama Quail Hunting Prepared by: Archie Flanders and
Lesson 2: Challenges associated with the organization of major events
 The United Nations Convention Against Corruption Safeguarding against Corruption in Major Public Events Lesson 2: Challenges associated with the organization of major events WHAT IS IT ABOUT MAJOR EVENTS
A comment on recent events, and...
 A comment on recent events, and... where we are in the current economic cycle November 15, 2016 Mark Schniepp Director Likely Trump Policies $4 to $5 Trillion in tax cuts over 10 years to corporations,
The World and U.S. Economy and San Pedro Bay Container Trade Outlook Forecast Review
 The World and U.S. Economy and San Pedro Bay Container Trade Outlook Forecast Review Michael Keenan Harbor Planning and Economic Analyst Port of Los Angeles October 5, 2009 Review of 2007 Container Trade
The Economic Benefits of Hunting and Fishing Activities in Alberta in 2008
 The Economic Benefits of Hunting and Fishing Activities in Alberta in 2008 Submitted to Hunting For Tomorrow Foundation Submitted by May, 2009 Introduction Hunting and Fishing related expenditures by Alberta
PART 1: INFRASTRUCTURE OPPORTUNITIES
 PART 1: INFRASTRUCTURE OPPORTUNITIES AUTHORS This article was authored by David Nancarrow (Partner, Perth), Alyson Eather (Senior Associate, Perth) and Celeste Koravos (Associate, Melbourne and Tokyo).
Independent Economic Analysis Board. Review of the Estimated Economic Impacts of Salmon Fishing in Idaho. Task Number 99
 IEAB Independent Economic Analysis Board Roger Mann, Chair Noelwah R. Netusil, Vice-Chair Kenneth L. Casavant Daniel D. Huppert Joel R. Hamilton Lon L. Peters Susan S. Hanna Hans Radtke Review of the Estimated
Lawrence J. Lau 刘遵义. CSIS Forum Washington, D.C., 22nd May 2013
 U.S.-China Economic Relations in the Next Ten Years: Towards Deeper Engagement and Mutual Benefit Lawrence J. Lau 刘遵义 Ralph and Claire Landau Professor of Economics, The Chinese Univ. of Hong Kong and
The Economic Impact of Colonial Downs in Virginia
 The Economic Impact of Colonial Downs in Virginia Prepared for Revolutionary Racing January 31, 2018 1309 E Cary Street, Richmond, VA 23219 1025 Huron Road East, Cleveland, OH 44115 chmuraecon.com Table
U.S. Overview. Gathering Steam? Tuesday, October 1, 2013
 U.S. Overview Gathering Steam? Tuesday, October 1, 2013 Uneven global economic recovery Annual real GDP growth projections (%) Projections 2013 2014 World 3.1 3.1 3.8 United States 2.2 1.7 2.7 Euro Area
The Rise of China and Breaking out the Middle- Income Trap in Latin America and the Caribbean countries: A New Structural Economics Approach
 The Rise of China and Breaking out the Middle- Income Trap in Latin America and the Caribbean countries: A New Structural Economics Approach Justin Yifu Lin Senior Vice President and Chief Economist The
2016 NATIONAL SPORTS LAW NEGOTIATION COMPETITION ROUND TWO. Bump, Set, Spike GENERAL FACTS FOR BOTH TEAMS
 2016 NATIONAL SPORTS LAW NEGOTIATION COMPETITION ROUND TWO Bump, Set, Spike GENERAL FACTS FOR BOTH TEAMS The 2017 ANOC World Beach Games ( World Beach Games or Games ) will be a sporting event that will
Rochester Area Bike Sharing Program Study
 roc bike share Rochester Area Bike Sharing Program Study Executive Summary ~ January 2015 JANUARY 2015 8484 Georgia Avenue, Suite 800 Silver Spring, MD 20910 3495 Winton Pl., Bldg E, Suite 110 Rochester,
CITY OF VANCOUVER ADMINISTRATIVE REPORT
 CITY OF VANCOUVER A14 ADMINISTRATIVE REPORT Report Date: March 17, 2009 Contact: Dave Rudberg Contact No.: 604.296.2860 RTS No.: 07659 VanRIMS No.: 01-1000-00 Meeting Date: March 24, 2009 TO: FROM: SUBJECT:
Avoiding the Blind Alley China s Economic Overhaul and its Global Implications
 Avoiding the Blind Alley China s Economic Overhaul and its Global Implications Daniel Rosen Partner dhrosen@rhg.com NYU Stern China Research Luncheon New York December 1, 2014 10 East 40 th Street, Suite
The 2010 Economic Contribution of Tourism to the Meadowlands Liberty Region
 The 2010 Economic Contribution of Tourism to the Meadowlands Liberty Region Key Metrics & Evaluation 93 MAIN STREET :: ANNAPOLIS, MD 21401 WWW.VANTAGESTRATEGY.COM :: 202-449- 9708 1 Vantage Strategy ::.
The Economic Outlook. Economic Policy Division
 The Economic Outlook Economic Policy Division Glass Half Full Six plus years of moderate growth Real GDP Outlook Percent Change, Annual Rate 10 5 0-5 -10 1980 1985 1990 1995 2000 2005 2010 2015 Glass Half
The Effects Hosting an Olympic Games has on the Host Nation's Economy
 Georgia Southern University Digital Commons@Georgia Southern University Honors Program Theses 2015 The Effects Hosting an Olympic Games has on the Host Nation's Economy William B. Kite Follow this and
Unbacked Fiscal Expansion: 1933 America & Contemporary Japan
 Unbacked Fiscal Expansion: 1933 America & Contemporary Japan Eric M. Leeper Indiana University February 2017 What I ll Do Illustrate Roosevelt s 1933 recovery efforts differentiate between unbacked and
Big Changes, Unknown Impacts
 Big Changes, Unknown Impacts Boulder Economic Forecast Place cover image here Richard Wobbekind Senior Economist and Associate Dean for Business and Government Relations January 17, 2018 Real GDP Growth
The Economic Impact of Golf In South Carolina
 The Economic Impact of Golf In South Carolina By Dudley Jackson Research Director South Carolina Department of Parks, Recreation and Tourism For South Carolina Golf Course Owners Association April 2016
The Economic Outlook. Economic Policy Division
 The Economic Outlook Economic Policy Division Glass Half Full Six years of steady growth Real GDP Outlook Percent Change, Annual Rate 10 5 0-5 -10 1980 1985 1990 1995 2000 2005 2010 2015 Glass Half Full
City as a Cultural Economy
 City as a Cultural Economy Mega Events: The Olympic Games By Maria Jørgensen Economic Geography Dr. Gordon Winder Outline The Olympic Games historic overview Why bid for the Olympics The stages of the
COOPERATIVE EXTENSION Bringing the University to You
 COOPERATIVE EXTENSION Bringing the University to You Special Publication - 06-16 ECONOMIC IMPACT OF TOURISM ON COLORADO RIVER COMMUNITIES INCLUDING: LAUGHLIN BULLHEAD CITY FORT MOHAVE MOHAVE VALLEY GOLDEN
EMBARGOED UNTIL 00:01 THURSDAY 9 AUGUST 2007 RESEARCH NOTE 17 HIDDEN COSTS OF 2012: CONSTRUCTION INFLATION TO COST 4 BILLION
 EMBARGOED UNTIL 00:01 THURSDAY 9 AUGUST 2007 www.taxpayersalliance.com/2012 RESEARCH NOTE 17 HIDDEN COSTS OF 2012: CONSTRUCTION INFLATION TO COST 4 BILLION This research note shows how the 2012 Olympics
Tax Fairness for the Golf Industry
 Tax Fairness for the Golf Industry Our Request for Tax Fairness Canada s golf industry generates more than $14 billion in Gross Domestic Product each year and employs over 300,000 Canadians throughout
Federal Reserve Bank of Dallas, FIRM (Financial Institution Relationship Management)
") The Economic Roller Coaster: Where Have We Been? And Where Are We Going? Thomas F. Siems, Ph.D. Senior Economist and Director of Economic Outreach Federal Reserve Bank of Dallas Economic Summit Dallas
The Economic Roller Coaster: Where Have We Been? And Where Are We Going? Thomas F. Siems, Ph.D. Senior Economist and Director of Economic Outreach Federal Reserve Bank of Dallas Economic Summit Dallas
15, 2015 EXECUTIVE SUMMARY
 Economic Contribution, Impacts, and Economic Benefits of Deer, Waterfowl and Upland Game Bird Hunting in North and South Dakota: Relationship to CRP Lands Dr. John Loomis and Dr. Michelle Haefele in cooperation
Issues in the Long-Term Economic Outlook for Canada
 Policy and Economic Analysis Program Rotman School of Management University of Toronto Issues in the Long-Term Economic Outlook for Canada Office of the Chief Actuary Canada Pension Plan Seminar September
Economic Analysis What s happening with U.S. potential GDP growth?
 Economic Analysis What s happening with U.S. potential GDP growth? Kan Chen Capital stock, labor, and productivity do not show a significant increase following the recent fiscal stimulus According to our
Big Blue Adventure Event Analysis UTC Tourism Center October 2016
 A report summarizing Big Blue Adventure events economic impact on the Lake Tahoe region as well as participants assessments of their event experience Big Blue Adventure Event Analysis UTC Tourism Center
Regional Profile Ebbw Vale & Blaenau Gwent
 Regional Profile Ebbw Vale & Blaenau Gwent Content Overview of Ebbw Vale Economy of Ebbw Vale & Blaenau Gwent Workforce Skills Addressing Youth Unemployment Summary Ebbw Vale & Blaenau Gwent Overview of
National Report Iceland. RINORD June 2018 Tryggvi Jónsson, Chairman of FRV
 National Report Iceland RINORD June 2018 Tryggvi Jónsson, Chairman of FRV FRV s activities and priorities 2017-2018 Annual strategy meeting set out the following priorities: Good procurement practices
2017 PNG Economic Survey. Rohan Fox (ANU), Stephen Howes (ANU), Nelson Atip Nema (UPNG), Marcel Schröder (UPNG and ANU)
, Stephen Howes (ANU), Nelson Atip Nema (UPNG), Marcel Schröder (UPNG and ANU)") 2017 PNG Economic Survey Rohan Fox (ANU), Stephen Howes (ANU), Nelson Atip Nema (UPNG), Marcel Schröder (UPNG and ANU) Introduction New government, new plan Short-term challenges: recession, falling government
2017 PNG Economic Survey Rohan Fox (ANU), Stephen Howes (ANU), Nelson Atip Nema (UPNG), Marcel Schröder (UPNG and ANU) Introduction New government, new plan Short-term challenges: recession, falling government
the Olympics. Beijing 2008 Cultural Festivals: Bigger, but not always better i. Beatriz Garcia
 C Culture @ the Olympics O issues, trends and perspectives Beijing 2008 Cultural Festivals: Bigger, but not always better i Beatriz Garcia www.culturalolympics.org.uk The gigantism of the Beijing 2008
Indian Economy in Graphs. Arvind Panagariya Columbia University
 Indian Economy in Graphs Growth in GDP and Per-capita GDP 9 8.3 8 7 6.7 6 5.8 5 4 3 2 4.1 2.2 3.2 4.6 2.2 3.7 1 0.8 0 Phase I (1951-64) Phase II (1965-81) Phase III (1981-88) Phase IV (1988-03) Phase V
From Recession to Recovery
 From Recession to Recovery Monday, April 26, 2010 8:00 AM - 9:15 AM Moderator Michael Klowden, President and CEO, Milken Institute Speakers Mohamed El-Erian, CEO and Co-Chief Investment Officer, Pacific
Quantifying the Lasting Harm to the U.S. Economy from the Financial Crisis
 Quantifying the Lasting Harm to the U.S. Economy from the Financial Crisis Robert E. Hall Hoover Institution and Department of Economics Stanford University Lessons from the Financial Crisis and the Great
Chapter 4: Changing Economic Structures of the Asian Economies
 FINALLY REVISED August, 2008 Chapter 4: Changing Economic Structures of the Asian Economies Chapter 4: Changing Economic Structures of the Asian Economies 4.1 Selected Structural Parameters of the Asian
Economic Impacts of Olympic Games
 Economic Impacts of Olympic Games July 2009 For Discussion 2 Kings Hill Avenue Kings Hill West Malling Kent ME19 4AQ www.locateinkent.com T: 01732 520 700 F: 01732 520 701 Economic Impacts of Olympic Games
Government finances A long term assessment. Presented by Edwina Matos Pereira
 Government finances A long term assessment Presented by Edwina Matos Pereira Walter Mosher June 22, 2010 Structure 1. Aruba s current fiscal landscape 2. Long term outlook & scenarios 3. Aruba s GDP volatility
London 2012 Olympic and Paralympic Games : Legacy
 London 2012 Olympic and Paralympic Games : Legacy Sir Jonathan Stephens KCB Former Permanent Secretary, Department for Culture, Media and Sport (DCMS) Day Month Year Name job title Olympic and Paralympic
OHRIA Ontario Horse Racing Industry Association
 OHRIA Ontario Horse Racing Industry Association P.O. Box 456, Stn. B, Toronto, ON M9W 5L4 Tel: 416-679-0741 Fax: 416-679-9114 Email: ohria@ohria.com Submission to the Standing Committee of Finance and
Capital Beltway HOT Lanes - Frequently Asked Questions
 Capital Beltway HOT Lanes - Frequently Asked Questions December 20, 2007 1. What is the cost of the project? The fixed-price design-build cost is approximately $1.4 billion. 2. Why have the project costs
Economic Outlook March Economic Policy Division
 Economic Outlook March 212 Economic Policy Division Real GDP Outlook Percent Change, Annual Rate 2 1 1 - -1 197 197 198 198 199 199 2 2 21 U.S. GDP Actual and Potential Quarterly, Q1 197 to Q4 211 Real
Progress with the Road Investment Strategy
 Report by the Comptroller and Auditor General Department for Transport and Highways England Progress with the Road Investment Strategy HC 1056 SESSION 2016-17 22 MARCH 2017 4 Key facts Progress with the
ANALYZING THE SHIP DISPOSAL OPTIONS
 Chapter Six ANALYZING THE SHIP DISPOSAL OPTIONS Chapters Two through Five examined the option of long-term storage and the three ship-disposal options: domestic recycling, overseas recycling, and reefing.
U.S. Infrastructure Market: Will It Jump-Start the Economy? Scott Hazelton Director, Construction Advisory Services May 21, 2009
 U.S. Infrastructure Market: Will It Jump-Start the Economy? Scott Hazelton Director, Construction Advisory Services May 21, 2009 Infrastructure Spending: Where Does it Go? Other Power, 6.9% 2008 Shares
STATE OF NEW JERSEY. ASSEMBLY, No ASSEMBLY BUDGET COMMITTEE STATEMENT TO. with committee amendments DATED: DECEMBER 15, 2014
 ASSEMBLY BUDGET COMMITTEE STATEMENT TO ASSEMBLY, No. 3969 with committee amendments STATE OF NEW JERSEY DATED: DECEMBER 15, 2014 The Assembly Budget Committee reports favorably Assembly Bill No. 3969,
The U. S. Economic Outlook: Robert J. Gordon
 The U. S. Economic Outlook: Upside and Risks Robert J. Gordon Ottawa a Economics Association Ottawa, a, September 14, 2017 Immigration Medical Care My Policy Package: Be Like Canada d University Tuition
Future Global Trade Trends - Risks & Opportunities. Pulse of the Ports: Peak Season Forecast March 21, 2013
 1 Future Global Trade Trends - Risks & Opportunities Pulse of the Ports: Peak Season Forecast March 21, 2013 June 2012 Dr. Walter Kemmsies Chief Economist Summary Higher economic growth in 2013, possible
Global economy maintaining solid growth momentum. Canada leading the pack
 Global economy maintaining solid growth momentum Canada leading the pack Dawn Desjardins (Deputy Chief Economist) (416) 974-6919 dawn.desjardins@rbc.com September 2017 Brighter global outlook gains traction
Some questions about evaluating the urban legacy of Olympic Games
 Some questions about evaluating the urban legacy of Olympic Games Prof Andy Thornley LSE. May 15 th 2012 Explore three hypotheses based on experience of past games Some comments on London 1 Hypothesis
RBC Economics Financial Update Dawn Desjardins
 RBC Economics Financial Update Dawn Desjardins CICA/RBC Q4 2011 Business Monitor Economic Results Overview Business and Economic Optimism Begin to Stablize 100 % 80 % 60 % 40 % 20 % 0 % National Optimism
Economic Update and Prospects for 2019 Professor Robert M. McNab Dragas Center for Economic Analysis and Policy Strome College of Business
 Economic Update and Prospects for 2019 Professor Robert M. McNab Dragas Center for Economic Analysis and Policy Strome College of Business January 3, 2019 The forecasts and commentary do not constitute
Canadian Teleconference: Can the Canadian Economy Survive the Turmoil in the United States?
 Canadian Teleconference: Can the Canadian Economy Survive the Turmoil in the United States? Nigel Gault Chief U.S. Economist Dale Orr Canadian Macroeconomic Services Copyright 2008 Global Insight, Inc.
The Economy: A View from the (Atlanta) Fed (Staff)
 Fed (Staff)") The Economy: A View from the (Atlanta) Fed (Staff) 2018 Alabama Economic Outlook Montgomery, AL January 11, 2018 2 The new supply-side economics? In their discussion of monetary policy, participants saw
The Economy: A View from the (Atlanta) Fed (Staff) 2018 Alabama Economic Outlook Montgomery, AL January 11, 2018 2 The new supply-side economics? In their discussion of monetary policy, participants saw
PROVINCE OF SASKATCHEWAN INVESTOR PRESENTATION
 PROVINCE OF SASKATCHEWAN INVESTOR PRESENTATION May 2018 THE SASKATCHEWAN DIFFERENCE Economic Stability Diversified economy balances cyclicality of resources Growing population Majority government with
Texas Housing Markets: Metropolitan vs. Border Communities. September 22, 2014
 Texas Housing Markets: Metropolitan vs. Border Communities Luis Bernardo Torres Ruiz, Ph.D. Research Economist El Paso Branch Dallas Federal Rio Grande Economic Association September 22, 2014 Contents
Deficit Reduction and Economic Growth: Are They Mutually Exclusive Goals? Tuesday, May 1, 2012; 2:30 PM - 3:45 PM
 Deficit Reduction and Economic Growth: Are They Mutually Exclusive Goals? Tuesday, May 1, 2012; 2:30 PM - 3:45 PM Moderator: Gillian Tett, U.S. Managing Editor, Financial Times Speakers: Jared Bernstein,
Social and Cultural Impact of the London 2012 Olympic Games: a lecturers and students perspective
 Social and Cultural Impact of the London 2012 Olympic Games: a lecturers and students perspective Dr. Maria Konstantaki School of Sport, Leisure & Travel Introduction Olympic Games (OG) World s most prestigious
Bob Costello Chief Economist & Vice President American Trucking Associations. Economic & Motor Carrier Industry Trends. September 10, 2013
 Bob Costello Chief Economist & Vice President American Trucking Associations Economic & Motor Carrier Industry Trends September 10, 2013 The Freight Economy Washington continues to be a headwind on economic
Trade Growth - Fundamental Driver of Port Operations and Development Strategies
 Trade Growth - Fundamental Driver of Port Operations and Development Strategies Marine Terminal Management Training Program October 15, 2007 Long Beach, CA Paul Bingham Global Insight, Inc. 1 Agenda Economic
COUNTDOWN TO RIO 2016: TWO WEEKS LEFT TO GO
 COUNTDOWN TO RIO 2016: TWO WEEKS LEFT TO GO Brazil accounts for more than 50% of South America s wealth derived from high net worth individuals, worth nearly $4 trillion in 2016 according to Capgemini.
Key words: Economic multiplier, community tourism, walking street, Chiang Mai
 1 Paper submission for the 5 th International Student Forum at Oita University, Japan Topic: An Analysis of Economic Multipliers of Community Tourism in Chiang Mai: Case Study of Wualai Walking Street
North American Forging Shipment Forecast (Using FIA bookings information through December 2013)
") North American Forging Shipment Forecast 2014-2018 (Using FIA bookings information through December 2013) Percent Change Year Ago Best leading indicator combination for impression die bookings used to
North American Forging Shipment Forecast 2014-2018 (Using FIA bookings information through December 2013) Percent Change Year Ago Best leading indicator combination for impression die bookings used to
Nevada County Population Projections 2015 to 2034
 Nevada County Population Projections 2015 to 2034 Prepared By: Jeff Hardcastle, AICP Nevada State Demographer Nevada Department of Taxation Reno Office: 4600 Kietzke Lane, Building L Suite 235 Reno, NV
De-Globalization: Does That Word Mean What You Think it Means?
 De-Globalization: Does That Word Mean What You Think it Means? Presentation to 35 Annual Monetary & Trade Conference Mykyta Vesselovsky, Ph.D. Office of the Chief Economist Global Affairs Canada April
Bob Costello Chief Economist & Vice President American Trucking Associations. Economic & Motor Carrier Industry Update.
 Bob Costello Chief Economist & Vice President American Trucking Associations Economic & Motor Carrier Industry Update February 26, 2013 The Worst Recession Since the Great Depression 0% Loss from Peak
China at a glance 2011
 China at a glance 2011 GDP PPP Growth rate Per capita Value US$11.29 trillion 9.2% US$8,400 Ranking 3 7 119 Labor force Imports Exports Value 816.2 million US$1.74 trillion US$1.90 trillion Ranking 1 3
Russian Outbound Ski Tourism in 2018: An Overview
 Russia s leading travel and tourism exhibition 12 14 March 2019 Russian Outbound Ski Tourism in 2018: An Overview A look at the Russian outbound ski market in 2018 covering: The ski tourism landscape in
Improving Mobility Without Building More Lanes
 Improving Mobility Without Building More Lanes By Mike Salisbury and Will Toor July 2017 Copyright 2017 by Southwest Energy Efficiency Project. All rights reserved. Photo: Courtesy of the Denver Post Anyone
Webinar: The Association Between Light Rail Transit, Streetcars and Bus Rapid Transit on Jobs, People and Rents
 Portland State University PDXScholar TREC Webinar Series Transportation Research and Education Center (TREC) 11-15-2016 Webinar: The Association Between Light Rail Transit, Streetcars and Bus Rapid Transit
Sustainable renewal in the Olympics. A question of legacy.
 Sustainable renewal in the Olympics. A question of legacy. Kate Hughes PhD centenary scholar Leeds Metropolitan University Overview of the presentation Why does the Olympics need sustainable renewal? How
The Revived Bretton Woods System: Does It Explain Developments in Non-China Developing Asia?
 The Revived Bretton Woods System: Does It Explain Developments in Non-China Developing Asia? Presentation for conference on The Revived Bretton Woods System: A New Paradigm for Asian Development? Federal
The 2001 Economic Benefits of Hunting, Fishing and Wildlife Watching in MISSOURI. Prepared by:
 The 2001 Economic Benefits of Hunting, Fishing and Wildlife Watching in MISSOURI Prepared by: Southwick Associates, Inc. PO Box 6435 Fernandina Beach, FL 32035 Ph (904) 277-9765 Fax (904) 261-1145 Email:
Major Issues and Trends Facing the Port and Marine Transportation Industry
 Major Issues and Trends Facing the Port and Marine Transportation Industry Presented to: AAPA Marine Terminal Management Training Program April 24, 2006 Charleston Riverview Hotel Charleston, SC - USA
TOUR DE FRANCE GRAND DÉPART YORKSHIRE
 TOUR DE FRANCE GRAND DÉPART YORKSHIRE Economic Impact Assessment Report for Calderdale Metropolitan Borough Council New Economy www.neweconomymanchester.com 28 September 2012 New Economy 1 1 Introduction
The American Youth Soccer Organization Selects Palm Beach County as Site for 2016 AYSO National Games
 The American Youth Soccer Organization Selects Palm Beach County as Site for 2016 AYSO National Games Thousands of soccer players from across the nation will transform Palm Beach County into the epicenter
Highlights of the Study
 1 Highlights of the Study The 2018 Light City attracted an estimated 442,500 guests to Inner Harbor/downtown Baltimore over the 8-day festival, April 14-21. Light City opening night broke attendance records,
Purpose and Need. Chapter Introduction. 2.2 Project Purpose and Need Project Purpose Project Need
 Chapter 2 Purpose and Need 2.1 Introduction The El Camino Real Bus Rapid Transit (BRT) Project (Project) would make transit and other transportation improvements along a 17.6-mile segment of the El Camino
An American Profile: The United States and Its People
 An American Profile: The United States and Its People 1 153641_EM_AmPro.indd 1 12/16/8 11:1:32 PM An American Profile: The United States and Its People 3 Table 1 Population, Percentage Change, and Racial
OR DUNGENESS CRAB FISHERY:
 E 55 OR DUNGENESS CRAB FISHERY: an economic analysis of productivity and profitability David S. Liao Joe B. Stevens OREGON STATE UNIVERSITY SEA GRANT COLLEGE PROGRAM Publication no. ORESU-T-75-005 AGRICULTURAL