Policy Choices for a Genuine Vermont Economy
|
|
|
- Marvin Owens
- 5 years ago
- Views:
Transcription

1 Policy Choices for a Genuine Vermont Economy Jon D. Erickson, Zach Zimmerman, Eric Zencey Gund Institute for Ecological Economics University of Vermont
2 Vermont Act 113 An act relating to the genuine progress indicator (a) Purpose. The purpose of the genuine progress indicator ( GPI ) is to measure the state of Vermont s economic, environmental, and societal well-being as a supplement to the measurement derived from the gross state product and other existing statistical measurements. (b) Definition. The GPI is an estimate of the net contributions of economic activity to the well-being and long-term prosperity of our state s citizens, calculated through adjustments to gross state product that account for positive and negative economic, environmental, and social attributes of economic development. (c) Intent. It is the intent of the general assembly that once established and tested, the GPI will assist state government in decision-making by providing an additional basis for budgetary decisions, including outcomes-based budgeting; by measuring progress in the application of policy and programs; and by serving as a tool to identify public policy priorities, including other measures such as human rights.

3 MISSION Improve the economic well-being and quality of life of Vermonters while maintaining our natural resources and community values. OVERARCHING GOAL not only grow jobs and wages and increase our Gross Domestic Product, but also to improve the Genuine Progress Indicator a measure that takes into account economic, social and natural assets and impacts by 5% over baseline over the next five years.
4 Genuine Progress Indicator = A monetized indicator of sustainable economic welfare. Attribute Meaning Limitations Monetized Indicator Sustainable Economic welfare Benefits and costs that can be expressed in monetary terms An indication of how we re performing Non-declining for generations to come Limited to our consumption of goods and services Benefits and costs that cannot be expressed in monetary terms Not a comprehensive measure But with a great degree of uncertainty Not happiness or well being in any other domain Source: John Talbreth, Center for Sustainable Economy
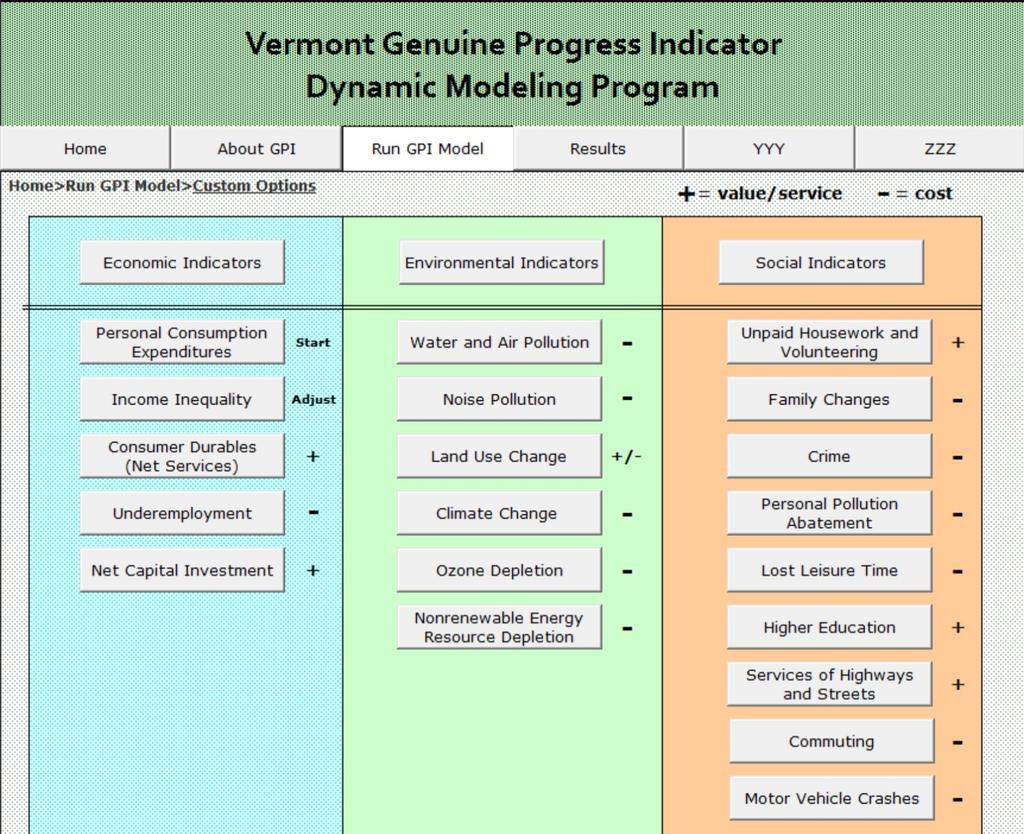
5 GPI = Economic + Environmental + Social Personal Consumption Income Inequality Adj. Personal Consumption Services of Consumer Durables Cost of Consumer Durables Cost of Underemployment Net Capital Investment Cost of Water Pollution Cost of Air Pollution Cost of Noise Pollution Cost of Net Wetland Change Cost of Net Farmland Change Cost of Net Forest Cover Change Cost of Long-term Environmental Damage Cost of Ozone Depletion Cost of Non-Renewable Energy Resource Depletion Value of Household Work Cost of Family Changes Cost of Crime Cost of Personal Pollution Abatement Value of Volunteer Work Cost of Lost Leisure Time Value of Higher Education Services of Highways and Streets Cost of Commuting Cost of Motor Vehicle Crashes
6 A genuine economy A. Is focused on short term gains, with the goal of using up resources as fast as possible. B. Is focused on long term value, with the goal of sustaining economies and livelihoods.
7 Per Capita, 2000$ Vermont GSP v. GPI per capita Mean annual GSP change = 2.2% % Mean annual GPI change = 0.6%
8 Billions 2013$ Total GSP vs. GPI (Billion 2013$) GSP GPI
9 2013 Vermont Estimate Progress Recession Continues GPI peaked in 2007 and in 2013 was at 11-year low However, GSP peaked in 2006, declined for 3 years during Great Recession, but has since more than recovered (7.7% above 2006 high) While GSP grew by 2.3% from 2012 to 2013, the GPI declined by 4.34%. Since 2000, the gap between GSP and GPI was at it s lowest in percentage terms in 2005 (41.8%), about the same as 2007 before the recession. The gap between GSP and GPI was at 52.9% in 2013, the highest gap since 1960 (beginning of estimate) 9
10 2013$ GSP vs. GPI per capita (2013$) GSP GPI
11 2013 Vermont Estimate In per capita terms, GPI per capita peaked in , and has declined 5 of 6 years since In 2013, GPI per capita at 86.7% of 2005 peak However, GSP per capita peaked in 2006, and fully recovered by 2010; in 2013, 7% above prerecession high 11
12 A genuine economy A. Creates more costs than benefits over the long run. B. Creates more benefits than costs over the long run.
13 Per Capita, 2000$ Vermont GPI Components GPI - Economic GPI - Total GPI - Social GPI - Environmental
14 2013 VT GPI Update Highlights Economic Income Inequality Deduction (17.5% of GSP and ing) Underemployment Deduction (1.9% of GSP and ing) Social Commuting Deduction (9.8% of GSP and ing) Volunteering Addition (1.3% of GSP and ing) Education Addition (10.8% of GSP and ing) Environmental Nonrenewable Energy Deduction (11.6% of GSP & ing) Carbon Pollution Deduction (3.3% of GSP and ing) Forest Land Change Deduction (1.0% of GSP and ing) 14
15 A genuine economy A. Occurs through depleting non-renewable resources and externalizing costs on distant people in distant lands and distant futures. B. Occurs through substituting renewable for non-renewable resources and internalizing the full cost of economic activity.
16 Total Energy Consumed per Capita, 2012 (million Btu) WY AK LA ND IA TX NE SD KY IN OK AL MT KS WV MS AR MN SC NM ID TN OH WI MO IL DE WA VA ME PA GA CO UT MI NJ NC OR MD NV NH AZ FL MA VT CT HI CA NY RI Total Energy Consumed Per Capita, 2012 (million Btu) Source: U.S. Energy Information Agency, 16
 So")

17 CO2 Emissions Per Capita, 2011 (millions of metric tons) Source: U.S. Environmental Protection Agency, 17
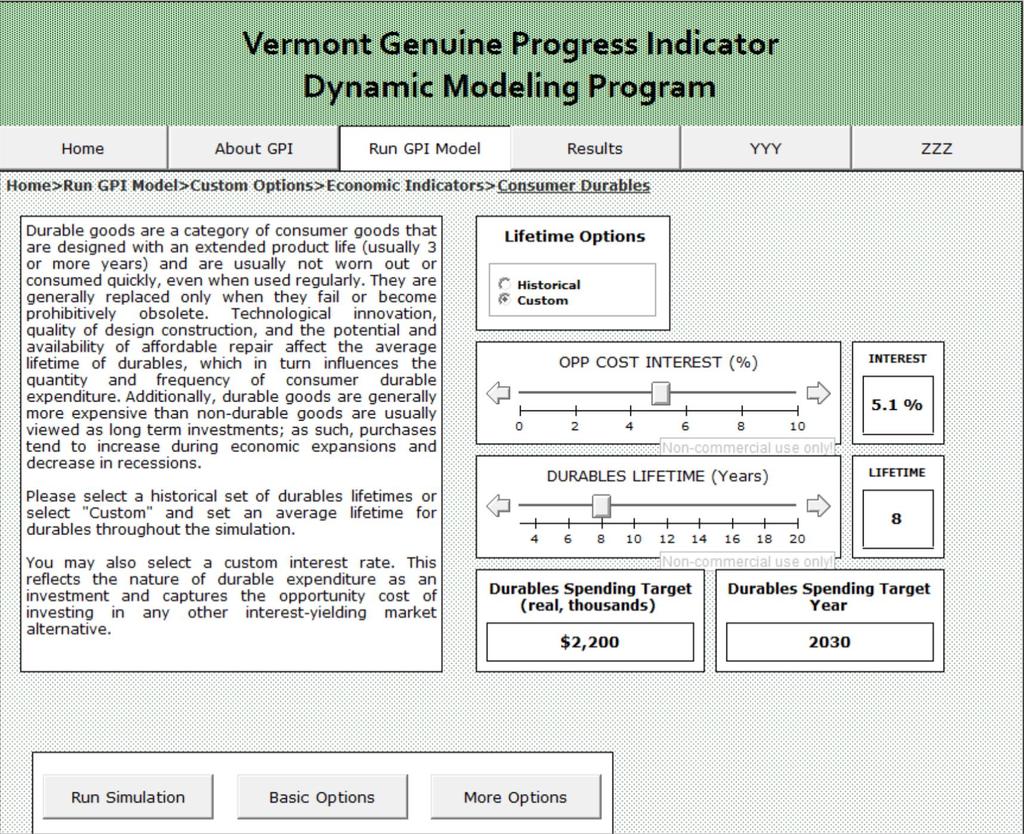
18 A genuine economy A. Relies on making products that are unreliable, fall apart, and need to be replaced as fast as they are made. B. Relies on making products that are reliable, durable, and sustain value over the long run.
19
20 A genuine economy A. Depends on squeezing every last waking hour out of our workforce, and works people until they are tired, sick, demoralized and need to be replaced often. B. Depends on a healthy balance between work, family, community, and leisure and is committed to the mental and physical health of our workforce and their families.
21 2013 VT GPI Update Highlights Economic Income Inequality (17.5% of GSP & ing) Largest deduction in estimating VT GPI, and growing From 1990 to 2010, real VT median household income grew by 1.5% while real GDP grew by 56% From 2006 to 2013, only Montana had greater growth in income inequality (relative to itself) VT was 5 th most income equitable nation in 2006; down to 14 th in of 6 New England states in the top 10 of growing inequity Worse in income inequality in nation = New York, Connecticut, Mississippi, Louisiana, Florida 21
22 2013 VT GPI Update Highlights Economic Underemployment (1.9% of GSP and ing) BLS U6 Rate = total unemployed + all marginally attached workers + total employed part time for economic reason (as a percent of the civilian labor force) + all marginally attached workers. From 2003 to 2013, BLS U6 rate for VT: Lowest in 2006 at 6.4% Peaked in 2010 at 12.5% Down in 2013 to 9.3% Current estimate = 8.4% 9 th lowest in nation; improved from 20 th lowest in nation in
23 Policy choices for a genuine economy will A. Rapidly deplete natural resources; accumulate pollution in our land, water, and air; maximize consumption of any and all things; and erode family, community, and personal health. B. Transition to renewable resources; accommodate pollution within biophysical limits; create widely-shared and broadly defined well-being; and invest in strong families, communities, and healthy people.

24 Gross Production vs. Genuine Progress for the US, 1950 to 2002 (source: Redefining Progress -

25 GPI per capita, 2000$ 35,000 US vs. Selected State GPI per Capita, 2000$ 30,000 MD 25,000 MA USA 20,000 VT 15,000 10,000 5,
26 WY MS AR LA AL WV KY OK SC ND TX IN TN NM NC GA IA MO OH KS MI ID WI AZ NE FL MT UT PA VT IL ME CO DE VA OR CA SD MN NV AK RI NJ MD NY WA HI NH CT MA DC Per Capita GPI by State, 2011, $/person 50,000 40,000 30,000 20,000 10, ,000-20,000-30,000 SOC ENV ECON -40,000
27
28
29
30 Current Trend: Income inequality worsens, Gini coefficient increases linearly based on trend out to.536 in Equality Trend: Income income inequality improves, Gini coefficient drops from.452 in 2014 to.400 in 2030.
31 Policy Choices for a Genuine Vermont Economy Jon D. Erickson, Zach Zimmerman, Eric Zencey Gund Institute for Ecological Economics University of Vermont
32
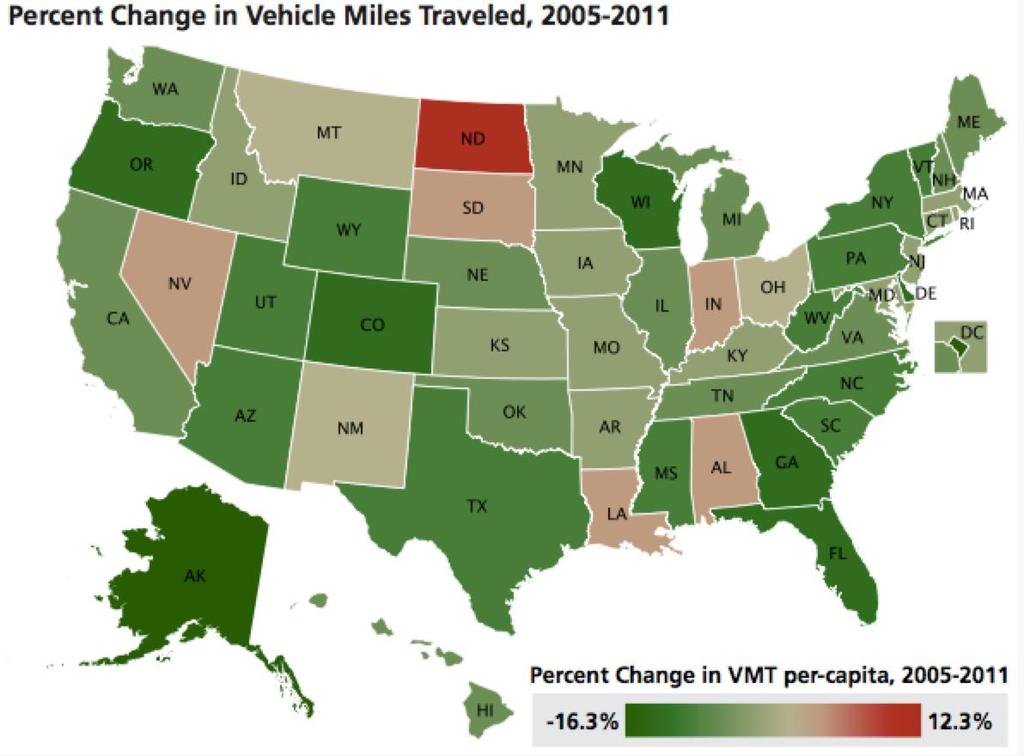
33 2013 VT GPI Update Highlights Social Commuting Costs (9.8% of GSP, ) After six decades of unrelenting growth, the U.S. experienced its eighth straight year of decline in miles driven in Vermont peaked at 13,423 miles driven per capita in 2003 Down 15% to 11,399 miles driven per capita in 2011 (10 th highest in nation) Commuting times relatively flat over last 13 years: Mean driving time to work = 21.6 minutes in 2000, up to 22.5 minutes in However, # of drivers up, # of carpoolers down. 33
34 34
35 35
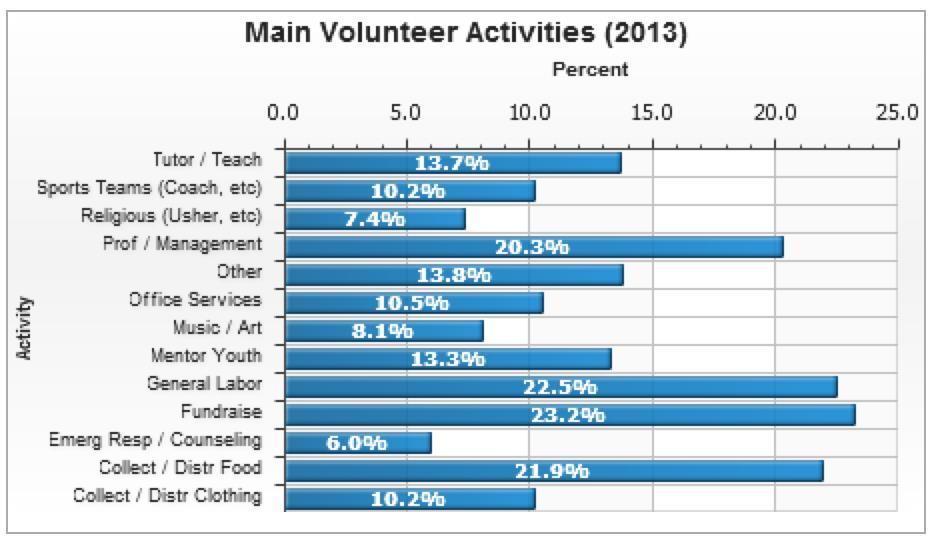
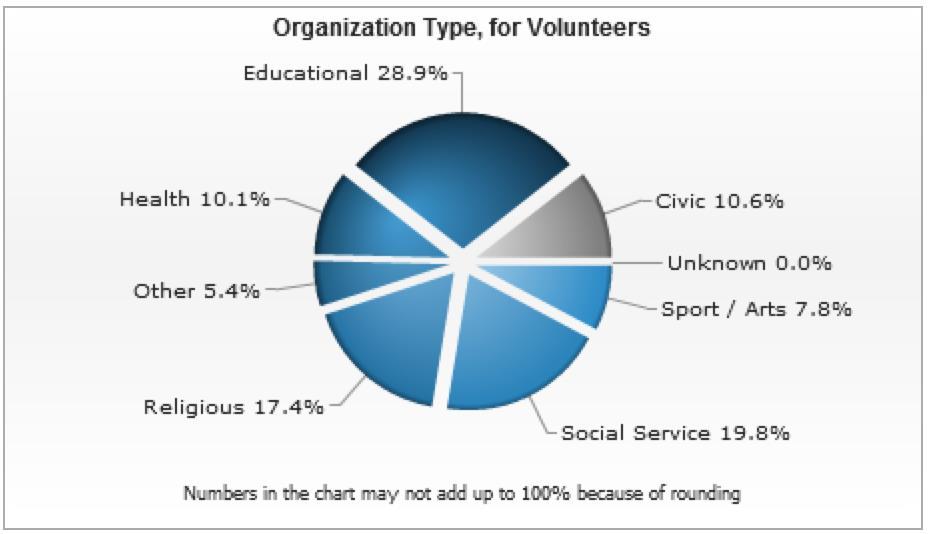
36 2013 VT GPI Update Highlights Social Volunteering (1.3% of GSP, ) Volunteer rate dropping in VT, from 36.2% in 2010 (6 th in nation) to 33.7% in 2013 (12 th in nation) 19.2 million hours of service in volunteer hours per capita 68.4% of residents engage in "informal volunteering" (for example, doing favors for neighbors) 44.1% frequently talk with neighbors 36
37 37
38 2013 VT GPI Update Highlights Environmental Nonrenewable Energy Deduction (11.6% of GSP ) Carbon Pollution Deduction (3.3% of GSP, ) Forest Land Change Deduction (1.0% of GSP, ) 38
39 Land Use Change: Forest Cover in New England Foster et al., Wildlands and Woodlands: A Vision for the New England Landscape,

40 Land Use Change: Forest Cover in New England Foster et al., Wildlands and Woodlands: A Vision for the New England Landscape,
41 Hallmarks of the Prevailing Economic Model Hallmarks of the New Economy GDP Privatization Specialization Globalization Consumerism Centralization Fiscal austerity Urbanization Technology for nature Market supremacy Competition Throughput Planned obsolescence Financial wealth Depleting capital Public commons Diversification Local self reliance Frugality Subsidiarity Fiscal responsibility Rural revitalization Nature for technology Informal sector Cooperation Resource efficiency Durability Well being Building capital GPI? Source: John Talbreth, Center for Sustainable Economy

42 GDP = C + I + G + NX Crime Pollution Depletion Work Week Inequality
43 the welfare of a nation [can] scarcely be inferred from a measure of national income. ~ Simon Kuznets, National Income, Report to 73rd US Congress, 1934 Distinctions must be kept in mind between quantity and quality of growth, between costs and returns, and between the short and long run. Goals for more growth should specify more growth of what and for what. ~ Simon Kuznets, 1962
44 Our Gross National Product counts air pollution and cigarette advertising, and ambulances to clear our highways of carnage. It counts special locks for our doors and the jails for the people who break them. It counts the destruction of the redwood and the loss of our natural wonder in chaotic sprawl. It counts napalm and counts nuclear warheads and armored cars for the police to fight the riots in our cities. It counts Whitman's rifle and Speck's knife, and the television programs which glorify violence in order to sell toys to our children. Yet the gross national product does not allow for the health of our children, the quality of their education or the joy of their play. It does not include the beauty of our poetry or the strength of our marriages, the intelligence of our public debate or the integrity of our public officials. It measures neither our wit nor our courage, neither our wisdom nor our learning, neither our compassion nor our devotion to our country, it measures everything in short, except that which makes life worthwhile. ~ Robert F. Kennedy, 1968
Understanding the Regional Divergence in Adult Mortality in the United States
 Understanding the Regional Divergence in Adult Mortality in the United States Andrew Fenelon, PhD University of Maryland, College Park American Life Expectancy 77 76 75 Life Expectancy in Years 74 73 72
More of the Same; Or now for Something Completely Different?
 More of the Same; Or now for Something Completely Different? C2ER Place cover image here Richard Wobbekind Chief Economist and Associate Dean for Business and Government Relations June 14, 2017 Real GDP
Zions Bank Economic Overview
 Zions Bank Economic Overview Kenworth National Dealers Conference November 8, 2018 1 National Economic Conditions 2 Volatility Returns to the Stock Market 27,000 Dow Jones Industrial Average October 10,
SEASON FINAL REGISTRATION REPORTS
 Materials Included: 2015-2016 SEASON FINAL REGISTRATION REPORTS 2014-15 & 2015-16 Comparison by Group 2 2015-16 USA Hockey Member Counts 3 2015-16 8 and Under Report 4 2015-16 Players & Girls/Women by
Zions Bank Economic Overview
 Zions Bank Economic Overview Intermountain Credit Education League May 10, 2018 Dow Tops 26,000 Up 48% Since 2016 Election Jan 26, 2018 26,616 Oct 30, 2016 17,888 Source: Wall Street Journal Dow Around
Zions Bank Economic Overview
 Zions Bank Economic Overview WIB Education Summit September 19, 2017 National Economic Conditions Dow Breaks 22,000 The Trump Bump Dow Reaches New Heights Following U.S. Presidential Election Source: Federal
Zions Bank Economic Overview
 Zions Bank Economic Overview Veteran Owned Business Conference May 11, 2018 Dow Tops 26,000 Up 48% Since 2016 Election Jan 26, 2018 26,616 Oct 30, 2016 17,888 Source: Wall Street Journal Dow Around Correction
SUMMARY MEMBERSHIP ANALYSIS FOR THE STATE OF. Trends of first-time 4 to 8 year-old male ice hockey players to
 SUMMARY MEMBERSHIP ANALYSIS FOR THE STATE OF New York Trends of first-time 4 to 8 year-old male ice hockey players 1997-98 to 27-8 p.2 -Background and Methodology p.3 -National Acquisition and Retention
SUMMARY MEMBERSHIP ANALYSIS FOR THE STATE OF. Trends of first-time 4 to 8 year-old male ice hockey players to
 SUMMARY MEMBERSHIP ANALYSIS FOR THE STATE OF Rhode Island Trends of first-time 4 to 8 year-old male ice hockey players 1997-98 to 27-8 p.2 -Background and Methodology p.3 -National Acquisition and Retention
SUMMARY MEMBERSHIP ANALYSIS FOR THE STATE OF. Trends of first-time 4 to 8 year-old male ice hockey players to
 SUMMARY MEMBERSHIP ANALYSIS FOR THE STATE OF New Mexico Trends of first-time 4 to 8 year-old male ice hockey players 1997-98 to 27-8 p.2 -Background and Methodology p.3 -National Acquisition and Retention
Measuring Genuine Progress. Chris Stiffler Economist
 Measuring Genuine Progress Chris Stiffler Economist Stiffler@Coloradofiscal.org What factors do you consider when choosing housing? Measuring Economic Progress Why do we do it all? How is it measured now?
SUMMARY MEMBERSHIP ANALYSIS FOR THE STATE OF. New Hampshire. Trends of first-time 4 to 8 year-old male ice hockey players to
 SUMMARY MEMBERSHIP ANALYSIS FOR THE STATE OF New Hampshire Trends of first-time 4 to 8 year-old male ice hockey players 1997-98 to 27-8 p.2 -Background and Methodology p.3 -National Acquisition and Retention
Overview of the Regional Economy
 Overview of the Regional Economy Jason Bram, Research Officer Presentation to the Community Depository Institutions Advisory Council (CDIAC) October 13, 2017 The views expressed here are those of the presenter
2009 National Pharmacist Workforce Study. Visual Data
 2009 National Pharmacist Workforce Study Visual Data Figure 1.1: National Aggregate g Demand Index Values http://www.pharmacymanpower.com/ 5 4 3 4.28 4.07 Shortage Surplus 4.19 4.07 4.02 3.97 3.92 4.21
Colorado Counties Treasurers Association
 Colorado Counties Treasurers Association Place cover image here Richard Wobbekind Executive Director, Business Research Division June 21, 2016 Real GDP Growth Quarterly and Annualized Real GDP 1990-2016
Zions Bank Economic Overview
 Zions Bank Economic Overview UAFS & NAIB Convention September 14, 2017 National Economic Conditions Dow Breaks 22,000 The Trump Bump Dow Reaches New Heights Following U.S. Presidential Election Source:
Zions Bank Economic Overview
 Zions Bank Economic Overview Utah Bankruptcy Lawyers Forum March 20, 2018 National Economic Conditions When Good News is Bad News Is Good News?? Dow Tops 26,000 Up 44% Since 2016 Election Source: Wall
Zions Bank Economic Overview Coldwell Banker Commercial Group. November 6, 2017
 Zions Bank Economic Overview Coldwell Banker Commercial Group November 6, 2017 National Economic Conditions Dow Breaks 23,000 The Trump Bump Dow Reaches New Heights Following U.S. Presidential Election
Anatomy of a Jackpot: Characteristics of Purchasers of Large Jackpot Lottery Tickets
 Anatomy of a Jackpot: Characteristics of Purchasers of Large Jackpot Lottery Tickets The 15 th International Conference on Gambling & Risk Taking May 27-31, 2013 Todd Maki & Don Feeney 1 Although not shown
Zions Bank Economic Overview Utah Bankers Association Emerging Bank Leaders Conference. November 9, 2017
 Zions Bank Economic Overview Utah Bankers Association Emerging Bank Leaders Conference November 9, 2017 National Economic Conditions Dow Breaks 23,000 The Trump Bump Dow Reaches New Heights Following U.S.
Zions Bank Economic Overview Logan Rotary Club. March 16, 2017
 Zions Bank Economic Overview Logan Rotary Club March 16, 2017 National Economic Conditions Dow 20,000 The Trump Bump Dow Reaches New Heights Following U.S. Presidential Election Source: Wall Street Journal
Cement & Construction Outlook
 Cement & Construction Outlook Minnesota Concrete Council November 17, 2011 Dave Zwicke, PCA Analytics Manager, Sr. Economist Bottom Line Economy in a slow growth period characterized by tepid job gains.
Zions Bank Economic Overview Cache Valley Home Builders Association. April 12, 2017
 Zions Bank Economic Overview Cache Valley Home Builders Association April 12, 2017 National Economic Conditions Dow 20,000 The Trump Bump Dow Reaches New Heights Following U.S. Presidential Election Source:
CREATIVE DESTRUCTION AND THE KNOWLEDGE ECONOMY
 CREATIVE DESTRUCTION AND THE KNOWLEDGE ECONOMY Where people work and how it has changed. Creative Destruction & the Process of Change The Second Industrial Revolution & Agriculture Miracle. The Third Revolution
Zions Bank Economic Overview
 Zions Bank Economic Overview Logan Rotary Club June 28, 2018 Dow Tops 26,000 Up 48% Since 2016 Election Jan 26, 2018 26,616 Oct 30, 2016 17,888 Source: Wall Street Journal Dow Around Correction Territory
Zions Bank Economic Overview West Point Economic Summit. March 30, 2017
 Zions Bank Economic Overview West Point Economic Summit March 30, 2017 National Economic Conditions Dow 20,000 The Trump Bump Dow Reaches New Heights Following U.S. Presidential Election Source: Wall Street
Zions Bank Economic Overview. March 14, 2017
 Zions Bank Economic Overview March 14, 2017 National Economic Conditions Dow 20,000 The Trump Bump Dow Reaches New Heights Following U.S. Presidential Election Source: Wall Street Journal 120.0 110.0 100.0
Zions Bank Economic Overview Utah Government Finance Officers Assoc. April 21, 2017
 Zions Bank Economic Overview Utah Government Finance Officers Assoc. April 21, 2017 National Economic Conditions Dow 20,000 The Trump Bump Dow Reaches New Heights Following U.S. Presidential Election Source:
Regional Economic Conditions
 Regional Economic Conditions Jason Bram, Research Officer Community Advisory Group Meeting June 27, 2017 The views expressed here are those of the presenter and do not necessarily represent those of the
Zions Bank Economic Overview. December 5, 2017
 Zions Bank Economic Overview December 5, 2017 National Economic Conditions Dow Breaks 24,000 The Trump Bump Dow Reaches New Heights Following U.S. Presidential Election Source: Federal Reserve Bank of
Zions Bank Municipal Conference Economic Overview August 13, 2015
 Zions Bank Municipal Conference Economic Overview August 13, 2015 Overview National Economic Conditions Utah Economic Conditions Utah is One of the Fastest Growing CA 0.9% States in the Country Percent
Zions Bank Economic Overview
 Zions Bank Economic Overview Utah Manufacturers Association & Associated General Contractors Utah Finance and Economic Summit September 26, 2017 National Economic Conditions Dow Breaks 22,000 The Trump
Zions Bank Economic Overview Meridian Chamber of Commerce. May 2, 2017
 Zions Bank Economic Overview Meridian Chamber of Commerce May 2, 2017 National Economic Conditions Dow 20,000 The Trump Bump Dow Reaches New Heights Following U.S. Presidential Election Source: Wall Street
Zions Bank Economic Overview
 Zions Bank Economic Overview National Assoc of Credit Managers Member Seminar December 12, 2017 National Economic Conditions Dow Breaks 24,000 The Trump Bump Dow Reaches New Heights Following U.S. Presidential
Economic Forecast to Professional Republican Women Association. January 5, 2017
 Economic Forecast to Professional Republican Women Association January 5, 2017 Economic Headwinds National and international uncertainty Continued low energy prices Depressed business investment Unstable
Target Shooting by Hunters and Their Use of Shooting Ranges: 1975, 1991, and 2011
 U.S. Fish & Wildlife Service Target Shooting by Hunters and Their Use of Shooting Ranges: 1975, 1991, and 2011 Addendum to the 2011 National Survey of Fishing, Hunting, and Wildlife-Associated Recreation
Federal Regulatory Update WTBA/WisDOT Contractor/Engineer Conference
 Federal Regulatory Update 2019 WTBA/WisDOT Contractor/Engineer Conference by Nick Goldstein ARTBA Vice President of Regulatory & Legal Issues January 17, 2019 How the Public Feels Regulations and Transportation
Traffic Safety Facts. State Traffic Data Data. Overview
 Traffic Safety Facts 2015 Data June 2017 DOT HS 812 412 State Traffic Data Key Findings Traffic fatalities increased by 7 percent from 2014 to 2015 (32,744 to 35,092) for the United States. The fatality
Minimum Wages By State, Municipality and County
 Compliance Alert January 21 st, 2019 Minimum Wages By State, Municipality and County AL N/A N/A AK $9.89 AZ $11.00 $12.00 - January 1, 2020 Flagstaff $12.00 $13.00 - January 1, 2020 $15.00 - January 1,
FARS Acc_Aux Analytical Users Manual
 FARS Acc_Aux Analytical Users Manual The s Included in the 'ACC_AUX' database are produced from definitions defined in the 'NCSA - Analytical Data Classification Manual' The Tables in this Manual Contain
FARS Acc_Aux Analytical Users Manual. The Tables in this Manual Contain Fatal Crash Counts
 FARS Acc_Aux Analytical Users Manual The Tables in this Manual Contain Fatal Crash Counts FARS Acc_Aux File s 2005-2014 ANCHOR Table of Contents 1 A_CRAINJ A_CT A_D15_19 A_D15_20 A_D16_19 A_D16_20 A_D16_24
Understanding the New Trump Economy Economic Overview. November 17, 2016
 Understanding the New Trump Economy Economic Overview November 17, 2016 Uncertainty at the Na@onal and Interna@onal Level Source: Bureau of Labor Statistics The Trump Bump Why? National Job Growth 500
SHOOTING IN AMERICA. An Economic Force for Conservation 2018 EDITION
 TARGET SHOOTING IN AMERICA An Economic Force for Conservation 2018 EDITION INTRODUCTION Target shooting is enjoyed by millions of Americans each year. It is so popular, in fact: More people participate
Warm Mix Asphalt in the United States: From Evolution to Revolution
 Warm Mix Asphalt in the United States: From Evolution to Revolution Matthew Corrigan, P.E. Asphalt Pavement Engineer Mobile Asphalt Testing Trailer Technical Manager U.S. DOT Federal Highway Administration
Overview of the Regional Economy
 Overview of the Regional Economy Jason Bram, Research Officer Presentation to the Community Depository Institutions Advisory Council (CDIAC) March 5, 2019 The views expressed here are those of the presenter
Habit Formation in Voting: Evidence from Rainy Elections Thomas Fujiwara, Kyle Meng, and Tom Vogl ONLINE APPENDIX
 Habit Formation in Voting: Evidence from Rainy Elections Thomas Fujiwara, Kyle Meng, and Tom Vogl ONLINE APPENDIX Figure A1: Share of Counties with Election-Day Rainfall by Year Share of counties with
Wisconsin Concrete Pavement Association. Ed Sullivan, SVP & Chief Economist
 Wisconsin Concrete Pavement Association Ed Sullivan, SVP & Chief Economist February 2018 I Pewaukee, Wisconsin Labor Markets Net Job Creation Monthly Gain 500 7.0% Unemployment Rate U3 Measurement 400
Sustainable Transportation Planning in the Portland Region
 Sustainable Transportation Planning in the Portland Region Jennifer Dill, Ph.D. Associate Professor School of Urban Studies & Planning jdill@pdx.edu http://web.pdx.edu/~jdill/ Outline Elements of a sustainable
SECTION SEVEN. Characteristics of People with IDD and Staff in Large Public Residential Facilities
 SECTION SEVEN Characteristics of People with IDD and Staff in Large Public Residential Facilities FY Section 7: Characteristics of People with IDD and Staff in Large State-Operated IDD Facilities This
States. Postal Abbreviations LEARN THE. AND. by Joy A. Miller
 1 States LEARN THE AND Postal Abbreviations by Joy A. Miller http://fivejs.com Learn the States and Postal Abbreviations Copyright 2009 Published by Joy A. Miller http://fivejs.com All rights reserved.
Gay Gilbert, Administrator Unemployment Insurance USDOL/ETA June 22, 2016
 Gay Gilbert, Administrator Unemployment Insurance USDOL/ETA June 22, 2016 Where is Our Program Today? Most Critical Challenges A Program in Transition Using our Valuable Resources What s Important for
Rotary Club of Pocatello Economic Overview. April 28, 2016
 Rotary Club of Pocatello Economic Overview April 28, 2016 Economic Headwinds National and international uncertainty Continued low energy prices Depressed business investment Unstable inflation outlook
8:00 am 5:00 pm NASRO Basic Course Music Road Resort Hotel. 8:00 am 5:00 pm NASRO Basic Course - ** Music Road Resort Hotel
 NASRO NATIONAL SCHOOL SAFETY CONFERENCE Smoky Mountains, TN June 23 28, 2019 This event has been approved for UASI reimbursement. Travel, Per Diem, Tuition reimbursement, Backfill and Overtime is at the
Zions Bank Economic Overview
 Zions Bank Economic Overview Utah Valley University Business and Economic Forum May 18, 2017 National Economic Conditions Dow 20,000 The Trump Bump Dow Reaches New Heights Following U.S. Presidential Election
Produce Safety Alliance Course and Trainer Totals through September 19, 2018
 Course and Trainer Totals through 19, 218 Totals: 216 218 Train-the-Trainer Courses Domestic 58 Total TTT Courses since Sept. 216 International 12 Total 7 2,27 Total Trainer Participants 1,716 (Domestic)
Featured Fish-Week ofjuly 16th
 Featured Fish-Week ofjuly 16th 5-6 Premium GradeKoi 25% O f,only$8.21each! 5-6 GinRinMixKoi 15% O f,only$10.41each! 6-8 StandardGradeButerflyKoi Buy1FulCount,Get1FulCount50% O f! 3-4 Yelow CometGoldfish
Potential Solutions for Mercury Control in the Cement Industry Portland Cement Association Meeting
 Potential Solutions for Mercury Control in the Cement Industry Portland Cement Association Meeting August 24, 2009 Agenda Albemarle Sorbent Technologies Quick Overview Mercury Sorbents Control Options
The Burden of HPV Related Cancers in Kentucky
 The Burden of HPV Related Cancers in Kentucky Presented on November 15, 2017 by Katie Bathje, Kentucky Cancer Consortium Many thanks to: Thomas C. Tucker, PhD, MPH Jaclyn Nee, DrPH 1 % coverage Adolescent
Bikes Belong Survey: The Size & Impact of Road Riding Events
 Bikes Belong Survey: The Size & Impact of Road Riding Events November 2009 Recreational road bicycling events are popular all across the United States. Participants are inspired by the opportunities to
17t h Ann u a l Re p o r t on th e ( ) POLICY STUDY
 POLICY STUDY") July 2008 17t h Ann u a l Re p o r t on th e Per f o r m a n c e of Stat e Hi g h w a y Sy s t e m s (1984 2006) By David T. Hartgen, Ph.D., P.E., and Ravi K. Karanam Project Director: Adrian T. Moore,
July 2008 17t h Ann u a l Re p o r t on th e Per f o r m a n c e of Stat e Hi g h w a y Sy s t e m s (1984 2006) By David T. Hartgen, Ph.D., P.E., and Ravi K. Karanam Project Director: Adrian T. Moore,
Are Highways Crumbling? State Performance Summaries,
 Policy Summary 407 February 2013 Are Highways Crumbling? State Performance Summaries, 1989 2008 by David T. Hartgen, Ph.D., P.E., M. Gregory Fields and Elizabeth San José Project Director: Adrian T. Moore,
NATIONAL UNEMPLOYMENT INSURANCE PROGRAM UPDATE GAY GILBERT, ADMINISTRATOR UNEMPLOYMENT INSURANCE USDOL/ETA JUNE 27, 2018
 NATIONAL UNEMPLOYMENT INSURANCE PROGRAM UPDATE GAY GILBERT, ADMINISTRATOR UNEMPLOYMENT INSURANCE USDOL/ETA JUNE 27, 2018 UI NATIONAL UPDATE v Program Highlights v Quick Look at the Data v Strategic Investments/Initiative
Are Highways Crumbling? State and U.S. Highway Performance Trends,
 Policy Study 407 February 2013 Are Highways Crumbling? State and U.S. Highway Performance Trends, 1989 2008 by David T. Hartgen, Ph.D., P.E., M. Gregory Fields and Elizabeth San José Project Director:
2018 KENTUCKY FACT BOOK
 2018 KENTUCKY FACT BOOK A statistical guide to the Thoroughbred industry in Kentucky Prepared by The Jockey Club Preface This report has been compiled as an industry service by The Jockey Club with the
Naples, Marco Island, Everglades Convention and Visitors Bureau May 2018 Visitor Profile
 RESEARCH DATA SERVICES, INC. 777 SOUTH HARBOUR ISLAND BOULEVARD SUITE 260 TAMPA, FLORIDA 33602 TEL (813) 254-2975 FAX (813) 223-2986 Naples, Marco Island, Everglades Convention and Visitors Bureau May
Chapter 2: Visual Description of Data
 Chapter 2: Visual Description of Data El Mechry El Koudous Fordham University January 24, 2018 Meshry (Fordham University) Chapter 2 January 24, 2018 1 / 35 Introduction In this chapter we will cover:
USA TRIATHLON MEMBERSHIP REPORT TABLE OF CONTENTS
 USA TRIATHLON MEMBERSHIP REPORT This report has been prepared by the Membership Services staff based on active memberships on December 31, 2015. Media requests can be addressed to communications@usatriathlon.org.
June 26 27, Gainesville, Florida
 June 26 27, 2018 Gainesville, Florida Welcome, Introductions + Agenda Chris Craig Introductions Name Agency/organization Number of years you ve worked in traffic safety Agenda DAY 1 DAY 2 Action Plan Group
P: F:
 Featured Fish-Week ofmay 14th 5-6 Premium GradeKoi BuyOneFulCount,GetA SecondFulCount30% OFF 10-12 Premium Select ImportedKoi $95Each Availableincountsof3/6/8 Staf@BlueRidgeKoi.com P:800-334-5257F:336-784-4306
Annual Data Report
 Annual Data Report 2014-2015 A Report of the Association of American Veterinary Medical Colleges 1101 Vermont Avenue, NW 20005 202-371-9195 http://www.aavmc.org As of March 11, 2015 Introduction The membership
Economic Growth in the Trump Economy
 Economic Growth in the Trump Economy Presented to State Data Center Conference William F. Fox, Director November 18, 2016 GDP Grows, Though Slowly 10.0 8.0 Percentage Change, Previous Qtr, SAAR 6.0 4.0
The MS Economic Outlook The Fall Forum
 The Economic Outlook The Fall Forum Darrin Webb, State Economist University Research Center Mississippi Institutions of Higher Learning dwebb@mississippi.edu (601)432 6556 September 2016 University Research
North Carolina Competitiveness
 ted@econleadership.com North Carolina Competitiveness NC 200,000 180,000 160,000 140,000 120,000 100,000 80,000 60,000 40,000 20,000 0 The Punch Job Change 1990 to 2012 182,905 The loss of about 8 of our
OIT: Lessons from the GL BIOTIC Symposium. Tim Campbell
 OIT: Lessons from the GL BIOTIC Symposium Tim Campbell What this is Broad overview of OIT pathways, issues, and current work What this isn t In-depth analysis of each pathway Go to seagrant.wisc.edu/oit
2016 River Use Statistics -by Steve Sullivan
 Grand Canyon River Office 2016 River Use Statistics -by Steve Sullivan Topics River Use Statistics Overview Commercial River Use Statistics Noncommercial River Use Statistics Noncommercial River Lottery
2018 FLORIDA FACT BOOK
 2018 FLORIDA FACT BOOK A statistical guide to the Thoroughbred industry in Florida Prepared by The Jockey Club Preface This report has been compiled as an industry service by The Jockey Club with the intent
Blue Ridge Koi's 2017 Published UPS Rates. # of Boxes In Shipment # of Boxes In Shipment 1 to 3 4 or more 1 to 3 4 or more
 Blue Ridge Koi's 2017 Published UPS Rates # of Boxes In Shipment # of Boxes In Shipment 1 to 3 4 or more 1 to 3 4 or more Price Per Box Price Per Box AL $60.00 $35.00 NC $35.00 $25.00 AR $60.00 $35.00
Kevin Thorpe Financial Economist & Principal Cassidy Turley
 Kevin Thorpe Financial Economist & Principal Cassidy Turley Economic & Commercial Real Estate Outlook Kevin Thorpe, Chief Economist 2012 Another Year Of Modest Improvement 2006Q1 2006Q3 2007Q1 2007Q3 2008Q1
The Gold Standard in Calibration Mixtures
 The Gold Standard in Calibration Mixtures Calibration standards are used in a wide variety of industries. The need for accurate and precise standards has become increasingly important because of the consequences
FANNIE MAE CONVENTIONAL PRODUCTS
 30-Year Fixed Rate 20-Year Fixed Rate 15-Year Fixed Rate CONFORMING 30 YEAR FIXED CONFORMING 20 YEAR FIXED CONFORMING 15 YEAR FIXED 4.000 100.299 100.257 100.207 100.168 3.750 99.960 99.909 99.842 99.787
FANNIE MAE CONVENTIONAL PRODUCTS
 30-Year Fixed Rate 20-Year Fixed Rate 15-Year Fixed Rate CONFORMING 30 YEAR FIXED CONFORMING 20 YEAR FIXED CONFORMING 15 YEAR FIXED 4.000 97.328 97.284 97.240 97.193 3.750 97.322 97.263 97.206 97.159 3.125
2018 ILLINOIS FACT BOOK
 2018 ILLINOIS FACT BOOK A statistical guide to the Thoroughbred industry in Illinois Prepared by The Jockey Club Preface This report has been compiled as an industry service by The Jockey Club with the
FANNIE MAE CONVENTIONAL PRODUCTS
 30-Year Fixed Rate 20-Year Fixed Rate 15-Year Fixed Rate CONFORMING 30 YEAR FIXED CONFORMING 20 YEAR FIXED CONFORMING 15 YEAR FIXED 4.000 97.840 97.786 97.740 97.696 3.750 97.479 97.424 97.366 97.308 3.125
FANNIE MAE CONVENTIONAL PRODUCTS
 30-Year Fixed Rate 20-Year Fixed Rate 15-Year Fixed Rate CONFORMING 30 YEAR FIXED CONFORMING 20 YEAR FIXED CONFORMING 15 YEAR FIXED 4.000 97.843 97.796 97.752 97.706 3.750 97.845 97.787 97.729 97.677 3.125
FANNIE MAE CONVENTIONAL PRODUCTS
 30-Year Fixed Rate 20-Year Fixed Rate 15-Year Fixed Rate CONFORMING 30 YEAR FIXED CONFORMING 20 YEAR FIXED CONFORMING 15 YEAR FIXED 4.000 98.104 98.054 98.010 97.965 3.750 98.074 98.018 97.959 97.905 3.125
FANNIE MAE CONVENTIONAL PRODUCTS
 FANNIE MAE CONVENTIONAL PRODUCTS 30-Year Fixed Rate 20-Year Fixed Rate 15-Year Fixed Rate CONFORMING 30 YEAR FIXED CONFORMING 20 YEAR FIXED CONFORMING 15 YEAR FIXED 4.000 99.433 99.376 99.317 99.260 3.750
2017 and 2018 Updates to crane regulations and industry standards
 2017 and 2018 Updates to crane regulations and industry standards Rules / Regulations OSHA State Industry Standards OSHA Crane Rule (29 CFR Part 1926, subpart CC) Released 11/10/2010 1926.1400 Scope 1926.1401
2012 Payne County Economic Outlook
 2012 Payne County Economic Outlook by Dan Rickman Regents Professor of Economics and Oklahoma Gas and Electric Services Chair in Regional Economic Analysis http://economy.okstate.edu/ 20,000 U.S. Real
2018 OKLAHOMA FACT BOOK
 2018 OKLAHOMA FACT BOOK A statistical guide to the Thoroughbred industry in Oklahoma Prepared by The Jockey Club Preface This report has been compiled as an industry service by The Jockey Club with the
2017 OKLAHOMA FACT BOOK
 2017 OKLAHOMA FACT BOOK A statistical guide to the Thoroughbred industry in Oklahoma Prepared by The Jockey Club Preface This report has been compiled as an industry service by The Jockey Club with the
2018 LOUISIANA FACT BOOK
 2018 LOUISIANA FACT BOOK A statistical guide to the Thoroughbred industry in Louisiana Prepared by The Jockey Club Preface This report has been compiled as an industry service by The Jockey Club with the
Congestion Evaluation Best Practices
 Congestion Evaluation Best Practices Todd Litman Victoria Transport Policy Institute Presented International Transportation and Economic Development Conference 10 April 2014 Congestion Indicators Indicator
2018 TEXAS FACT BOOK. A statistical guide to the Thoroughbred industry in Texas. Prepared by The Jockey Club
 2018 TEXAS FACT BOOK A statistical guide to the Thoroughbred industry in Texas Prepared by The Jockey Club Preface This report has been compiled as an industry service by The Jockey Club with the intent
2015 IOWA FACT BOOK. A statistical guide to the Thoroughbred industry in Iowa. Prepared by The Jockey Club
 2015 IOWA FACT BOOK A statistical guide to the Thoroughbred industry in Iowa Prepared by The Jockey Club Preface This report has been compiled as an industry service by The Jockey Club with the intent
Conduent EDI Solutions, Inc. Eligibility Gateway 270/271 Payer Guide Medicaid
 Conduent EDI Solutions, Inc. Eligibility Gateway 270/271 Payer Guide Medicaid Version 4010 Technical Support: egateway@conduent.com May 10, 2017 2017 Conduent Business Services, LLC. All rights reserved.
Population of Puerto Rico (Millions of people)
") Dr. Mario Marazzi-Santiago Instituto de Estadísticas Executive Director August 15, 2015 Population of Puerto Rico (Millions of people) 4.5 4 3.5 3 2.5 2 1.5 1 0.5 1950 1955 1960 1965 1970 1975 1980 1985
Dr. Mario Marazzi-Santiago Instituto de Estadísticas Executive Director August 15, 2015 Population of Puerto Rico (Millions of people) 4.5 4 3.5 3 2.5 2 1.5 1 0.5 1950 1955 1960 1965 1970 1975 1980 1985
Wenlin Liu, Senior Economist. Stateof Wyoming. Economic Analysis Division State of Wyoming 1
 WYOMING DEMOGRAPHIC AND ECONOMIC TREND LCCC LIFE Program April 7, 2012 Cheyenne, Wyoming Wenlin Liu, Senior Economist Economic Analysis Division Stateof Wyoming Economic Analysis Division State of Wyoming
Total Frequency Percent CAPS Graduate Graduate Intensive English
 Total Enrollment Fall, Fall I 2006: 8150 All Students by School All Students By Status CAPS & Traditional UG 4722 57.9 Continuing 5926 72.7 Graduate 3406 41.8 First-time Freshman 911 11.2 Intensive English
2018 MINNESOTA FACT BOOK
 2018 MINNESOTA FACT BOOK A statistical guide to the Thoroughbred industry in Minnesota Prepared by The Jockey Club Preface This report has been compiled as an industry service by The Jockey Club with the
Blueback Herring. American Shad (Indicator Species) Hickory Shad. American Eel. Alewife
 Hickory Shad. American Eel. Alewife") Presentation Outline The Case for Fish Passage Traditional Modifications The Case for Public Safety Cutting Edge Modifications The Case for Improving Fish Passage American Shad (Indicator Species) Blueback
Presentation Outline The Case for Fish Passage Traditional Modifications The Case for Public Safety Cutting Edge Modifications The Case for Improving Fish Passage American Shad (Indicator Species) Blueback