Circulation in the Mediterranean Sea
|
|
|
- Jemimah Barker
- 5 years ago
- Views:
Transcription


1 Circulation in the Mediterranean Sea Claude Millot, Isabelle Taupier-Letage To cite this version: Claude Millot, Isabelle Taupier-Letage. Circulation in the Mediterranean Sea: Updated description and schemas of the circulation of the water masses in the whole Mediterranean Sea.. A. Saliot. The Mediterranean Sea, The Mediterranean Sea (5-K), Springer, pp.29-66, 2005, Handbook of Environmental Chemistry, < /b107143>. < <hal > HAL Id: hal Submitted on 7 Sep 2015 HAL is a multi-disciplinary open access archive for the deposit and dissemination of scientific research documents, whether they are published or not. The documents may come from teaching and research institutions in France or abroad, or from public or private research centers. L archive ouverte pluridisciplinaire HAL, est destinée au dépôt et à la diffusion de documents scientifiques de niveau recherche, publiés ou non, émanant des établissements d enseignement et de recherche français ou étrangers, des laboratoires publics ou privés.
2 CIRCULATION IN THE MEDITERRANEAN SEA CLAUDE MILLOT AND ISABELLE TAUPIER LETAGE Antenne du Laboratoire d Océanographie et de Biogéochimie Université de la Méditerranée et Centre National de la Recherche Scientifique (UMR 6535) BP 330, F La Seyne/mer isabelle.taupier letage@univ amu.fr Hdb Env Chem Vol. 5, Part K (2005): DOI /b Contents 1. Introduction 1.1. The overall functioning 1.2. The problems about the circulation 2. The data sets 2.1. The remotely sensed data sets 2.2. The in situ data sets 3. The circulation of the surface water 3.1. AW in the western basin 3.2. AW in the eastern basin 4. The circulation of the intermediate and deep waters 4.1. LIW 4.2. AeDW, AdDW, TDW and WMDW 5. Discussion 5.1. The dynamical phenomena 5.2. Some implications for environmental chemistry 6. Conclusion Abstract The overall functioning of the Mediterranean Sea, which transforms Atlantic Water (AW) into Mediterranean Waters (MWs), has been comprehended for a while, and the process of dense water formation, which leads AW to sink offshore in specific northern zones of the western and the eastern basins, has been studied in the world ocean. However, the circulation of the various waters from/to the basins openings to/from the zones of sinking is still debated in the western basin, while a similar debate is only being initiated in the eastern one. The differences between the circulation schemas published up to now can be large and they have already been commented in papers recently published. To provide a coherent introductory chapter, only the authors' analysis is presented hereafter. Overall, and due to the Coriolis effect, all waters (AW and MWs) that circulate at basin scale tend to follow, in the counterclockwise sense, the isobaths at their own level. Hence they tend to describe, in both the western and the eastern basins, quasi 1
3 C. Millot I. Taupier Letage permanent gyres a few 10s km thick and a few 1000s km long along the continental slope. This simple schema is complicated by the fact that the southern parts of both gyres described by AW are markedly unstable, the AW inflow being hence identified with the so called Algerian Current and Libyo Egyptian Current and generating specific systems over the whole depth. Indeed, these currents ( m deep) meander and generate, a few times per year, anticyclonic eddies that can reach diameters of km (and even more), propagate downstream (i.e. eastward) at speeds up to a few km/day, and sometimes extend down to the bottom ( m). Hence, these eddies follow the deeper isobaths, separate from their parent current where these isobaths diverge from the upper continental slope, and drift for years (up to 3 at least) in the central part of the basins, possibly coming back shoreward where they interact with their parent current, sometimes in a dramatic way. These eddies entrain AW and MWs from the peripheral part of the basins towards their central part, together with eddies induced by the wind in the eastern basin only and having similar characteristics. In both basins, the northern parts of the gyres display specific features linking them to the zones of AW sinking, hence being identified (more easily in the western basin than in the eastern one due to the topography) with the so called Northern Currents. In addition to these circulation features, and because the various openings are only a few 100s m deep, the deeper MWs must be uplifted before outflowing. This is achieved permanently and more or less everywhere through continuous mixing with less dense waters and uplifting by newly formed denser waters. This is also achieved when and where intense mixing with other waters (cascading from sills or sinking) and sucking upward straits occur. Keywords: Mediterranean Sea, western and eastern basins, water masses, general circulation, mesoscale Abbreviations ADCP: Acoustic Doppler Current Profiler AW: Atlantic Water AdDW: Adriatic Deep Water AeDW: Aegean Deep Water AVHRR: Advanced Very High Resolution Radiometer CTD: Conductivity (to compute Salinity) Temperature Depth (actually Pressure) probe LIW: Levantine Intermediate Water MWs: Mediterranean Waters NOAA: National Oceanic and Atmospheric Administration POEM: Physical Oceanography of the Eastern Mediterranean SST: Sea Surface Temperature TDW: Tyrrhenian Dense water WMDW: Western Mediterranean Deep Water XBT: EXpendable BathyThermograph probe XCTD: EXpendable Conductivity Temperature Depth probe 2
4 Circulation in the Mediterranean 1. Introduction 1.1. The overall functioning The semi enclosed Mediterranean Sea is characterised by evaporation exceeding precipitation and river runoff (the specific case of the Black Sea will be addressed later). [1], supported by [2], considered that this was a characteristic not only of both the western and the eastern basins 1, but also of the Japan Sea, and proposed a preliminary analysis of the differences and generally not agreed yet similarities between these three «medi terranean» seas. Hence, any reference to rotation specified hereafter is for the northern hemisphere. Would the Strait of Gibraltar be closed, the level of the sea would decrease by m.year 1. The tendency for a difference in level between the sea and the Atlantic Ocean leads the Atlantic Water (AW, WaterMassAcronyms.pdf ) encountered at the surface right west of Gibraltar to flow into the sea at a rate of ~1 Sverdrup (1 Sv = 10 6 m 3 s 1 ). With respect to the geoïd, that is the surface of a theoretical fluid at rest modified only by gravity, the level of the easternmost part of the sea is few metres below that of the ocean. For the time being, inaccuracies in quantifying the various parameters and natural variability do not allow a more precise estimation of these quantities. Typical values for AW at Gibraltar are T ~15 16 C, S ~36 37 and ~26 27 (densities of ). While progressing within the sea, the incoming AW is continuously modified, firstly due to interactions with the atmosphere, but also due to mixing with older AW remained at the surface and with the waters underneath. All along its course, AW is seasonally warmed (up to C in the mixed layer) or cooled (down to ~13 C, or locally less) but, overall, its salt content increases (up to 38 39) and it is thus made denser (up to 28 29). In fall, in the northern parts of both basins, AW is markedly modified but it remains at the surface. In winter, cold and dry air masses entrained by relatively brief episodes of strong northerly winds induce marked evaporation (increase of salinity and loss of latent heat) and direct cooling (loss of sensible heat) of AW, resulting in a dramatic increase of its density (above 29) that 1 The term "basin" is assigned exclusively to the two major parts of the Mediterranean Sea 3
5 C. Millot I. Taupier Letage makes it sink. Sinking occurs in a series of specific zones, generally located in the northern parts of the basins, according to two different processes. A secondary process occurs on the shelves. It results from the fact that waters there are markedly cooled because the reduced depth does not represent a large reservoir of heat, i.e. of buoyancy, i.e. the shallower the depth the cooler the temperature can become and the higher the density can become too. However, shelf waters are relatively fresh in general (due to river runoff) so that they cannot get a density allowing them to sink down to more than ~1000 m. Although such waters are identified wherever adequate conditions are encountered, they represent relatively low amounts and, generally, they are rapidly lost due to mixing induced by the relatively intense circulation alongslope. Hence, we consider that their circulation is not markedly different from that of AW. The major process (regarding the volumes involved) occurs offshore in some subbasins 2. Fundamentally, densified AW sinks and mixes with the denser waters underneath, so that the mixture continuing to be densified will reach relatively high densities. Details about this process that forms the largest amounts of dense waters are given hereafter, especially in section 5. Now, depending on the subbasin, the mixture will have specific characteristics, leading to a set of more or less dense Mediterranean Waters (MWs) that will be thus qualified either as intermediate or deep. The Levantine Intermediate Water (LIW, see section 4.1) is the warmest and saltiest intermediate water, and the MW produced with the largest volume. Because of its characteristics and amount, LIW is recognised more or less everywhere in the sea. Due to its relatively low density, it is found just below AW and hence it mixes with AW as soon as AW starts sinking. If the mixture of AW and LIW, evaporated and cooled more and more, reaches densities larger than ~29, it can sink down to the bottom and form the deep waters (see section 4.2). The overall formation rate of intermediate and deep MWs is estimated to be ~90% of the AW inflow at Gibraltar (10% being evaporated), among which ~3/4 2 We assign the term "subbasin" to all parts of the western and eastern basins of the Mediterranean Sea that are usually referred to as seas, basins or passages. For instance, the parts of the eastern basin commonly named Ionian Sea, Cretan Passage or Levantine Basin, being not basically different, will all be qualified as "subbasins". We omit the term subbasin when self explanatory. 4
6 Circulation in the Mediterranean (resp. ~1/4) are formed in the eastern (resp. western) basin. These values lead to an average residence time of years The problems about the circulation These intermediate and deep MWs then circulate and can still be identified more or less far from their zone of origin. They continuously mix and, finally, outflow at Gibraltar as a rather homogeneous water ("the" Mediterranean Water), which is colder ( C), saltier ( ) and denser ( ) than AW there. Therefore, the Mediterranean Sea is a machine that transforms AW present at the surface right west of the Strait of Gibraltar into denser water that is recognised at m in most of the northern Atlantic Ocean. Apart from this well agreed overall functioning, the circulation of the various waters from/to Gibraltar to/from the zones of sinking is still debated nowadays. There are several reasons for that. First, oversimplified schemas, and even surface current maps (i.e. schemas with wind effects and/or seasonal variability quantified, although based on data sets markedly insufficient), have been published relatively early and trusted. Second, different forcings can induce roughly similar circulation patterns, hence making difficult any discrimination and the understanding of the actual processes. In a semienclosed basin for instance, winds blowing seawards, evaporation and dense water formation all induce a counterclockwise circulation of the surface water. Third, although a large amount of satellite information is available in the visible and infrared bands since about three decades, it has generally been regarded as unreliable and representative of the very superficial layer only; hence, it has not been widely used. Fourth, the oceanic/marine domain is effectively much more variable (at mesoscale, some 10s to a few 100s km) than initially expected, it is hostile for human activity (surface agitation, lack of visibility, pressure, corrosion, etc.) and in situ work is relatively expensive. Last but not least, although field oceanographers need modellers to solve equations and check the hypotheses they put forward from the analysis of their data sets, most of the 3 As previously said and for the time being, inaccuracies in quantifying the various parameters and natural variability do not allow a more precise estimation of these quantities. 5
7 C. Millot I. Taupier Letage modellers rely more on their simulations (encompassing up to several annual/decadal cycles!) than on the analysis of such a low amount of in situ data! However, the debate about the major features of the circulation in the western basin might about to become a debate of the past while, for the eastern basin, it is just being initiated. Indeed, intensive experiments involving numerous and sophisticated instrumentation, as well as theoretical and numerical studies, have been conducted in the western basin since several decades because major labs were from the (northern) riparian countries: overall features there were thus better described and known. Moreover, some of the key hypotheses that had remained controversial for about two decades have recently been fully validated by dedicated in situ measurements [3]. In the eastern basin, intensive operations have only been initiated less than two decades ago, mainly in the northern and central parts of the basin. In addition, most of these operations were parts of the POEM programme, whose leaders have proposed a circulation schema (e.g. [4, 5]) that ignores the previous ones (especially [6]) and completely obliterates the southern part of the basin. Indeed, [6] argues for an alongslope counterclockwise circulation due to the Coriolis effect around the whole basin, while the POEM schema claims for major currents meandering across most of its central part. Recently, both our data analysis [7] and numerical works done by other teams (e.g. [8]) converged to support the analysis we made about 10 years ago [1, 2]. Our analysis is consistent with the one by [6], mainly adding information about the mesoscale features, and is thus dramatically different from if not opposed to the POEM one! It is therefore impossible to present a view of the circulation synthesised from all the published papers, would it have been the aim of such a handbook volume and introductory chapter. Furthermore such a review has been recently done for both the western basin [9] and the eastern one [7]. To provide the reader with a coherent analysis (even though there is no consensus yet), the presentation hereafter is thus restricted to the authors' analysis. Only the most recent or major references are indicated, the reader being asked to refer to [9, easily accessible via Internet] and [7, accessible via for a more detailed and documented presentation of the phenomena. The remotely sensed and in situ data sets used for this 6
8 Circulation in the Mediterranean analysis are described in section 2. The circulation of AW is presented in section 3 and that of MWs in section 4. Specific aspects of the circulation and consequences for chemistry (and biology as well) are envisaged in a discussion section (5) and a conclusion is drawn in section The data sets Although the most recent numerical simulations now support the schematic circulation schemas that are proposed hereafter, these schemas are mainly based on the analysis of all the available data sets that, therefore, need to be briefly discussed first The remotely sensed data sets Several physical parameters can be measured from space. The first one (in terms of precedence, space and time intervals adequacy, availability and processing easiness, usefulness) is the sea surface temperature (SST), since any body emits in the thermal infrared, mainly at a specific wavelength that is related to the temperature of that body. Images are also provided in the visible during daytime, the back scattered signal (colour) being integrated over a layer up to a few 10s m thick in a way that depends on the water transparency. The sea surface height is measured along the satellite track with a nadir directed radar. The sea surface salinity starts being estimated (although too roughly for circulation purposes yet) from the emission at a specific frequency. As done worldwide (although not by all teams working on the Mediterranean Sea!), our team has made an extensive use of satellite measurements in the thermal infrared for several reasons. The major reason is that, from a dynamical point of view, geophysical fluids are mainly characterised by their density, which depends on temperature, salinity and pressure (the latter having a negligible effect at the surface). In addition, although temperature and salinity ranges vary separately in both time and space, their spatial variations have to be related, at least on average. More specifically, temperature and 7
9 C. Millot I. Taupier Letage salinity fronts (and gradients that are perpendicular to them) have to be parallel 4, at least locally and on average, not considering any spurious effect (see below). Parallel temperature and salinity gradients can either have the same sense (temperature and salinity thus compete and the density gradient can not be defined a priori) or be opposed (thus clearly defining the sense of the density gradient). The incoming AW is always fresher that the resident AW, but it is warmer (by a few C) in winter and cooler (by up to C) in summer. Therefore, SST gradients are particularly informative about density gradients in winter. In spring and fall, the SST can be locally and temporally homogeneous, hence uninformative. In summer, the temperature of the very surface layer might not be representative of that of the mixed layer (see below), which requires some know how for its analysis. Whatever, dealing with dynamical features does not require considering absolute SST values as long as salinity values (hence density ones) remain unknown. We personally pay attention to even weak SST gradients that are significant (see below), and we infer circulation features just focusing visually on the spatial SST distribution 5 at a given time (plus from time to time, obviously). The second reason that makes infrared data valuable is their space and time sampling interval, as collected for instance from the NOAA / AVHRR radiometers. Images are collected by a scanner (pixel of about 1 km x 1 km), on both sides of the track (swath of ~3000 km), a few times per day at mid latitudes, and in several frequency bands (allowing computation of SST values with an accuracy of ~0.1 C). A third reason is that, being easily processed (since about three decades), products are now made easily available by some receiving centres (e.g. 4 Indeed, one can hardly imagine a temperature front (representative of a water changing in one direction mainly) permanently crossing a salinity front (representative of the same water changing in another direction). Such crossing fronts, each schematised as an interface between two different waters at the surface for instance, would lead, on a temperature salinity schema, to four points defining a rectangle, thus having different densities while all being at the surface (not considering what would occur at the intersection)! 5 We thus usually represent SST data with a grey or colour table that is suitable (visually) to evidence the phenomena of interest; colour tables are thus advantageously different in winter and summer and, in fact, specific to each image. 8
10 Circulation in the Mediterranean Problems due to warm spots, which develop during calm and sunny days at the very near surface, are definitely avoided by considering nighttime images only. However, as in the case of haze or dust clouds that can decrease the measured SST, these spurious effects are generally detected easily because they have non oceanographic patterns. In addition, patterns due to warm spots, haze and dust are rapidly changing from one image to the other. The fact that the infrared signal is emitted by the very near surface is generally not a problem, due to the frequent occurrence of waves that form the mixed layer and its associated thermocline. Moreover, this signal often represents much more than the temperature of the mixed layer since it is now demonstrated that, for instance, an eddy km in diameter, seen from space for years, can extend down to the bottom over several 1000s m. The only unavoidable problem is the occurrence of clouds that completely mask the sea surface. Building composite (daily, weekly, monthly) images reduces this problem and appears to be efficient for studying circulation features since they vary markedly in space but slowly in time. Inferring circulation from the visual analysis of infrared images (i.e. from indications about the density gradients) obviously relies on theoretical bases. According to what is known as geostrophy (most of the current is proportional to the horizontal pressure gradient and perpendicular to it), this consists practically in assuming that (most of the) surface currents are roughly parallel to those isotherms that do not change too much in time. When isotherms are rapidly evolving, i.e. in some specific places such as at the nose of a propagating jet, the current has a significant component perpendicular to the isotherms. In any case, and as will be shown later, the visual analysis is very intuitive and efficient, since it allows the preliminary analysis of phenomena from the lab, more or less everywhere and all year long, thus helping in the definition of efficient in situ sampling strategies The in situ data sets Most of the available physical oceanography data sets are vertical profiles of temperature and salinity now collected with ship handled CTDs, as well as XBTs and XCTDs to a lesser extent. Although they are generally of the utmost quality (CTD sensors can be calibrated easily), they are often made with a sampling interval too large (a few 9
11 C. Millot I. Taupier Letage 10s km) according to pre defined regular grids. This has led to misleading interpolations, so that we personally position our CTD stations with a ~5 km spacing based on SST data received onboard in near real time ( Another problem is that these data sets, generally available easily from all data centres, have been pooled to compute average values, which can be totally misleading about actual processes. For instance in the Algerian subbasin, LIW flows along the continental slope (especially northward along that of Sardinia) while pieces of it are occasionally pulled away and transported toward the central part of the subbasin by mesoscale features passing by. Averaging all values available in the central subbasin leads to smooth the large spatial and temporal variability of the temperature and salinity fields, hence figuring spurious gradients that suggest a permanent seaward (i.e. westward) flow of this water [3]. Autonomous CTDs that can be set on moorings allow collecting time series of the hydrological parameters, possibly on the long term to derive trends ( Another large data set is provided by moored (eulerian) currentmeters that are the only mean to get locally accurate statistics about the circulation. The largest experiments now involve a few tens of currentmeters set on up to ~10 moorings for periods up to 1 2 years. Only few instruments are maintained in some specific places on isolated moorings over years up to decades. Whatever, deploying open sea moorings requires some experience as well as a relatively large amount of equipment and fittings. In addition, moorings cannot be deployed for a long time on continental shelves due to fishing activity, and setting them on the continental slope to get measurements up to the near surface in these zones that are critical for the circulation is not easy. This is why only ~200 point x year time series are available in the western basin, with 1/2 1/3 coming from our group. Time series available in the eastern basin are ~ 10 times less, nearly all having been collected in the northern part. Therefore, one must consider that in situ direct measurements about the circulation are relatively few, especially in some critical zones. Another way to collect measurements about the circulation is to use free drifting (lagrangian) currentmeters that are now localised worldwide with the ARGOS system (embarked on the NOAA satellites). To measure surface currents, these currentmeters 10
12 Circulation in the Mediterranean are floating buoys that are positioned several times per day and are equipped with a drogue, to prevent them from slipping with respect to the water due to the wind drag. To measure currents at intermediate depths, these currentmeters are floats, generally ballasted to remain on some iso density surface or equipped with active devices, which are positioned with respect to moored acoustic sources. To measure currents at greater depths, ballasted floats are programmed to periodically (about once every week) surface, remain there a few hours for being ARGOS positioned, and then sink again to their specific depth (the distance between 2 positions being considered as the drifting distance at depth). The advantage of these lagrangian currentmeters is that they generally require reduced logistics and that they provide a very descriptive image of the circulation. However, they are not adequate to provide significant statistics about the currents in a given area. Finally, ships of opportunity crossing the Mediterranean Sea can be, as the research ships, equipped with profiling currentmeters (such as ADCPs) and/or a set of autonomous sensors (mainly for temperature and salinity, hence forming an instrument called thermosalinometer); they can also be used to launch expendable probes (such as XBTs). Practically, they are used only from time to time during specific operations to launch XBTs, none is equipped with an ADCP yet and, hopefully, one in the western basin will be equipped this year with a thermosalinometer. To conclude, the limited use that has been made of the remotely sensed data sets and the difficulty to collect in situ ones have prevented, up to now, from getting a consensus on the major features of the circulation. The analysis hereafter although not fully shared yet aims at providing a consistent analysis of the available data sets, all being considered as correct (i.e. only the interpretation of a data set can be questioned, not the data set itself), and thus at getting a correct understanding of the circulation. 11
 from")
13 C. Millot I. Taupier Letage Fig. 1. SST composite image for January 1998 (the Black Sea has its own colour scale) from the DLR. See text for comments and abbreviations. 12

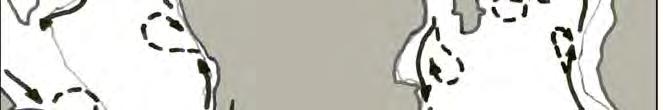


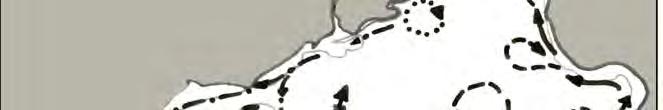


14 Circulation in the Mediterranean Fig. 2. Circulation of AW, inferred from [9] for the western basin and from [7] for the eastern one, and of fresh waters in the Black Sea. The thin line represents the 200 m isobath. See text for the definition of A E, L W and L E. 13
15 C. Millot I. Taupier Letage 3. The circulation of the surface water The monthly composite image of January 1998 (Fig. 1) gives an overview of the SST in the Mediterranean Sea with the same colour table and without any cloud, which allows describing the general circulation of AW in the whole sea. This image is representative of the winter months for what concerns the SST values that range from ~18 C (red, eastern basin) to C (orange yellow near Gibraltar) to ~13 C (light blue, dense water formation zones of the Provençal (Pro) and Ligurian (Lig) subbasins) to ~10 C or less (dark blue, the rivers outflows (green arrows) in the Adriatic (Adr), and the Black Sea that has its own colour scale). It is also representative of all months and years for what concerns most of the general circulation features of AW ( m) that do not vary seasonally in a significant way. Although this image provides indications about mesoscale features that have a large vertical extent (see below), it gives a blurred vision of those that are fast moving. Figure 2 schematises the AW circulation features, that is surface currents, described in subsections 3.1 and 3.2. When possible, more precise terms will be used and defined in due time. For instance, the AW circulation at basin scale describes alongslope counterclockwise gyres that can bifurcate into veins or form branches. In the south of each basin, parts of these gyres are markedly unstable and are identified as the Algerian Current and as the Libyo Egyptian Current, respectively. These currents generate mesoscale anticyclonic eddies (we clearly differentiate the terms gyres and eddies by their generation processes and dynamical features) that sometimes follow specific circuits and/or form specific systems. Note that current is also used for the vector that represents the speed and direction of a water particle at a given time and place. 3.1 AW in the western basin It is first clear that AW west of the Strait of Gibraltar is warmer than in the Alboran (Alb), due to intense mixing within the strait. The inflow of AW, first directed northeastwards due to the orientation of the strait, then generally describes a clockwise gyre 6 (clearly seen on Fig. 1) in the west of the Alboran between Spain and Morocco. The 6 Gyres are circulation features induced by wind and/or thermohaline forcing and/or topographic features (such as straits) that are clearly constrained by the bathymetry (at basin and subbasin scales). They are characterised as clockwise in the Alboran (mainly due to the orientation of the Strait of Gibraltar) and everywhere else as counterclockwise (due to the Coriolis effect). Parts of the gyres can be unstable. 14
16 Circulation in the Mediterranean inflow usually describes a second clockwise gyre in the east of the Alboran, between Spain and Algeria, but it can also proceed more or less directly toward Algeria, or describe a third more or less organised gyre. Out of the Alboran, the AW flow restructures itself along the Algerian coast (generally near 0 ), mainly due to the Coriolis effect. There, the western basin gyre starts to be clearly identified and it displays features that have justified the identification of an Algerian Current and of a specific associated system [10]. When the current appears as relatively stable, it is a few 10s km wide and m thick, and it has maximum speeds of several 10s cm/s. However, the current is often unstable. Most of the time, it remains alongslope and generates relatively small (up to few 10s km in diameter, a few 100s m in depth) short lived (a few weeks/months) eddies 7 8. A few times per year, however, it generates a meander growing up to km in both amplitude and wavelength, hence embedding an anticyclonic eddy km in diameter (of AW only). [3] have definitively demonstrated that these surface features induce an anticyclonic eddy km in diameter in the whole deeper layer of MW (i.e. down to ~3000 m); since currents in this layer (several cm/s) can be similar over the whole depth, they might be forced by a pressure effect. The whole feature named "event" generally propagates downstream (eastwards) at a few km/day 9 (it can also remain stationary for weeks/months). One can note in Fig. 1 how large are the two eddies (that are in fact events) present at that time and how efficient they are in spreading AW seawards, in this case mainly towards the Balearic Islands (Bal); after the westernmost eddy will have propagated more to the east, the Balearic Islands will no longer be concerned by recent AW. Because events are too large and deep, the spreading of the Tunisian and Sardinian shelves prevents them from continuing through the Channel 10 (south) of Sardinia (Sar), so that they drift seawards, guided by the topography. They separate from their parent current, become "open sea eddies" and 7 Eddies are phenomena generated either by processes that destabilise alongslope currents (such as the Algerian Current) or by the wind stress curl locally induced by orographic effects (as described later on). They are characterised as cyclonic / anticyclonic, not constrained by the bathymetry and can move. 8 Eddies are mesoscale (some 10s to a few 100s km) features that will be characterised as small (up to ~50 km), medium ( km) or large ( km). 9 Although km/day is a unit roughly equivalent to cm/s, it provides a more realistic quantification of propagation phenomena. 10 We consider that, among the major passages, only Gibraltar is sufficiently narrow to be considered as a strait, all the others being thus considered as channels (except minor narrow passages as e.g. Bonifacio and Messina). 15
17 C. Millot I. Taupier Letage remain trapped in the Algerian. Most of these open sea eddies, which can have lifetimes up to ~3 years [11], follow a counterclockwise circuit along the deeper isobaths in the eastern Algerian [12]. By analogy with the notations proposed by [7] (see section 3.2), this zone where eddies tend to be trapped and markedly interact can be named A E (accumulation area of eddies in the eastern Algerian). Some eddies can propagate more or less directly in the western Algerian [11, 13]. Others can reach diameters larger than ~250 km so that only 2 of them fill the Algerian, leading the whole Algerian Current to spread seawards upstream for months [14]. Hence, mesoscale features induced by the Algerian Current form an actual "system" and are often complex. To easily deal with these features, the largest ones (events and open sea eddies) are called Algerian Eddies (AEs) and numbered according to the year and order of apparition (the AEs seen in Fig.1, i.e. in January 98, are 96 1 and 97 1). The markedly unstable character of the flow of AW along most of the southern coasts, and the trapping of the induced mesoscale features by the deep topography is a characteristic of all the medi terranean seas [1, see section 3.2]. AW dispersed and amassed in the Algerian in such ways will spread towards the Provençal and the Catalan, forming the North Balearic front in between. In summer, the Catalan is relatively protected from the northwesterlies: it comes to be the warmest subbasin of the western basin while a small anticyclonic eddy is often induced in its northern part by the Pyrenees. Yearlong, AW is flowing along the western coast of Corsica (Cor), hence forming the west Corsica vein 11 of AW (that is relatively unstable too [15]). Part of the AW flow that has progressed through the Channel of Sardinia in its southern part (the north Tunisia vein) continues alongslope, i.e. through the Channel of Sicily into the eastern basin, hence feeding the eastern basin gyre. Another part (the Tyrrhenian vein) continues flowing counterclockwise around the Tyrrhenian (Tyr) along Sicily and the Italian peninsula before entering the Channel of Corsica. Then, it joins the west Corsica vein so that the flow of AW reorganises itself again as the western basin gyre. This gyre continues alongslope in the Ligurian, the Provençal and the 11 The term "vein" is used to figure a bifurcation of the gyre that follows then a specific route and/or encounters a specific process, and can eventually join other veins downstream. 16
18 Circulation in the Mediterranean Catalan, up to the Algerian and the entrance of the Alboran where it closes. Several aspects of this gyre deserve to be commented: Although the wintertime dense water formation process drives the functioning of the sea, the basin wide gyre of AW that is subsequently created does not display a marked (i.e. easily evidenced) seasonality everywhere. The fact that no marked seasonality of the Algerian Current system has been evidenced yet might be due to the distance from the zones of dense water formation, which could attenuate the signal, and/or to the narrowness of the Strait of Gibraltar, which could limit the inflow and reduce seasonal variations there. Numerical models (e.g. [16]) consider that the bifurcation of the AW flow at the entrance of the Channel of Sicily is driven by the channel topography. However, one can also consider that surface waters in the north of the western basin are denser leading to a sea level lower than in the south. Hence, AW in the south can tend to flow northwards, obviously alongslope due to the Coriolis effect, hence forming the Tyrrhenian vein whatever the topography of the Channel of Sicily. In the Ligurian, the Provençal and the Catalan, AW flows north of the zones where it will finally mix with LIW (see below) and sink (to form the Western Mediterranean Deep Water, WMDW), so that these zones are away from the coast (a better description of the links between the various processes is provided in section 5.1.3). This is a characteristic of all medi terranean seas so that the generic name of Northern Current was proposed [1], with the secondary aim to show that what were called Ligurian Current, Liguro Provençal Current and Catalan Current, were only parts of a unique entity and, more generally, of the western gyre. In addition, fig.1 clearly shows that what is called the Northern Current can in fact be identified continuously from the southern Tyrrhenian up to the Alboran. In the Ligurian and the Provençal, the Northern Current is characterised by maximum speeds of several 10 cm/s in its core, a width of a few 10s km and a thickness of a few 100s m. Since AW is denser there than in the south, the Northern Current is narrower and deeper than the Algerian Current [15]. However, it displays 17
19 C. Millot I. Taupier Letage a marked seasonal variability (due to the links with the dense water formation process above mentioned), being more intense, narrower and deeper in winter [17]. The Northern Current does not develop marked instabilities in either the Tyrrhenian or the Catalan while small eddies have been described west of Corsica [12, 15]. In the Ligurian and the Provençal, it only develops, in winter mainly, meanders that have never been observed to evolve into structured eddies [15, see section 3.2]. Episodically, it can generate, at the border between the Ligurian and the Provençal, a branch 12 first evidenced by [18]. The zone where dense water forms is characterised by mesoscale currents that are relatively weak in summer and intense (a few 10s cm/s over the whole depth) in winter [19]. Dense water sinks within small scale (a few km in diameter) plumes can be of ~10 cm/s (so that less dense waters are uplifted), but the overall sinking speed is ~1 mm/s only [20]. Sinking water reaching the bottom can lead there (~2000 m) to horizontal currents as large as several 10s cm/s [21]. The Gulf of Lions itself is in fact a semi circular continental shelf so that most of the Northern Current flows as a major vein along the upper part of the continental slope, i.e. along its diameter [22]. When the Mistral (Mi) does not prevent its upper part from following the coast and partly penetrating over the shelf, this part tends to flow as a minor vein around the whole gulf (both veins join at the exit of the gulf). In such a situation, the Northern Current combines with the natural tendency (again due to the Coriolis effect) of any river outflow to be deflected on the right, so that waters from the Rhône are entrained around the whole gulf. When the Mistral and the Tramontane (Tr) blow, they mix and spread seawards the Rhône waters (similar effects occur with westerly winds on the Ebro waters, as opposed to the Bora/Pô interactions, see below). In the northern and northwestern parts of the gulf, these winds induce 6 upwelling cells during stratified conditions [23] and, in winter, shelf dense water formation (maybe occurring with a similarly discontinuity). It must be emphasised that the canyons that cut the continental slope do not attract dense water formed in the coastal zone: they only operate as 12 The term "branch" is used to figure a flow spreading seawards, ramifying as a tree branch, and finally vanishing in the central part of a subbasin (contrary to a vein that follows the topography). 18
20 Circulation in the Mediterranean sediment traps, allowing dense water entrained over the shelf whatever its direction to be trapped and set in position to reach greater depths. Where AW closes its western gyre, i.e. along the Spanish coast near the border between the Alboran and the Algerian, the (old) water that has skirted the whole basin (and is thus markedly modified) encounters the water that has just flowed in. Hence, large horizontal gradients occur there. When incoming AW forms a second clockwise gyre in the eastern Alboran, it entrains older AW, roughly from Almeria, Spain, to Oran, Algeria. Since the incoming flow is more intense, it forms the Almeria Oran jet that is well delimited on its left hand side by the Almeria Oran front. The various islands and their associated shelves have significant effects. The Algerian eddies blocked by the Sardinian and Tunisian converging shelves often entrain AW southwards off western Sardinia (together with other anticyclonic eddies [12] and with the northwesterlies induced drift), while AW released by the eddies' decaying in the north is constrained to flow northwards off western Corsica. The marked orography of both Sardinia and Corsica also protects most (the remainder) of the Tyrrhenian, and reduces there the mixing and cooling by the westerlies. In winter, the Balearic Islands first protect from the northwesterlies AW entrained by the AEs, so that AW can progress northwards quite easily up to the islands which somehow fix the position of the North Balearic front in the west [24]; they also lead part of the Northern Current to form a vein flowing north of them in the Catalan. In addition, the marked orography of both Sardinia and Corsica creates a funnelling effect for the westward winds that are the continuation of both the Mistral and the Tramontane. In the western Tyrrhenian, just east of the Strait of Bonifacio (between Sardinia and Corsica), such a specific wind field induces (due to the Coriolis effect) a mesoscale dipole with an anticyclone in the south and a cyclone in the north that have very different structures. The anticyclone (not clear in Fig. 1) is composed of (warm) AW converging (depression of the interface between AW and MW) and rotating as an isolated eddy. The cyclone (relatively large in Fig. 1) results from AW diverging (uplifting of the interface) and forming in fact a ring that surrounds a cool zone (of MW), which is the main feature seen in Fig. 1 and which 19
21 C. Millot I. Taupier Letage has recently been hypothesised to be an occasional zone of dense water formation [25]. These differences between the anticyclone and the cyclone induced east of Bonifacio by the westerly winds are in fact representative of most of the differences between the previous understanding(s) of the circulation in the eastern basin and our own understanding (see section 5). 3.2 AW in the eastern basin In the Channel of Sicily the circulation of AW is complex, due to the necessary bifurcation between the western and the eastern basins, to the complexity of the topography with numerous islands and banks, and to the large width of the channel. It cannot be easily studied with SST images (Fig. 1 is not very explicit), due to the intense mixing by the topography and the northwesterlies, to the upwelling these winds induce off Sicily, and to the southward heading of the flow that rapidly warms. In addition, it cannot be easily studied with in situ data because of the intense fishing activity and the existence of half channel national economic waters. Therefore, AW within the channel has been said to flow mainly either in the eastern side (as a Sicilian vein, e.g. [27]) or in the western side (as a Tunisian vein, e.g. [28]). At the exit of the channel, SST images suggest (although not clear on Fig. 1) that three kinds of processes occur or have occurred, so that the eastern gyre at its beginning is split into several components. One is a northeastward spreading branch that we associate with interannual variability (it disappeared in early 1998), while it has been qualified as a permanent meandering stream by e.g. [5]. The second is the generation of mesoscale eddies that tend to drift in the central part of the Ionian. The third is a more regular flow (the south Tunisia vein) that, for most of it, follows the edge of the Tunisian shelf and, for a minor (and upper) part of it, follows the Tunisian coast (as in the Gulf of Lions); both parts of this vein join off Libya, the Tunisian vein hence becoming a Libyan vein. The term of vein(s) is justified by the fact that AW spread in the central part of the Ionian (as a branch and/or eddies) will join it downstream to form the eastern gyre stricto sensu. Note that the famous tourists places that are the Kerkennah and Djerba Islands are among the coldest spots in winter, due to the very shallow shelf there 20
22 Circulation in the Mediterranean (somewhere a few metres only). As first hypothesised by E. Salusti (pers. com.), these shelf waters most probably tend to sink, as indicated for the Gulf of Lions and as it will be shown for the northern parts of both the Aegean and the Adriatic. From ~15 E, the Libyan vein continues alongslope eastwards and appears unstable, generating mesoscale eddies that are smaller and less well organised than the Algerian ones and that rapidly detach from the coast, due to the topography (isobaths spreading seawards). These eddies, together with those created just at the channel exit that drift in the central Ionian, form a complex eddy field in the whole southern Ionian. The Libyan vein continues alongslope in the Gulf of Syrta (GoS) without developing large mesoscale instabilities there (maybe due to a flow too reduced and/or to a topography too shallow). Since most of the eddies are trapped within the southern Ionian while only few of them drift into the Cretan (Cre), it might be that they decay in the southern Ionian before joining the Libyan vein, together wit the water spread in the interannual branch and then released. The eastern gyre hence restructures itself along the northern Cirenaïca (Cir), in the same way as the western gyre near 0 (the parallel with Alboran and western Algeria, and more generally between the western and eastern basins, is detailed in subsection 5.1). From northern Cirenaïca to the western part of the Nile delta, what can be named the "Libyo Egyptian Current" (the counterpart of the Algerian Current) generates well structured and energetic eddies that appear very similar to the Algerian ones. These anticyclonic eddies can be large ( km), and they propagate downstream not faster than ~3 km/day, i.e. generally slower than the Algerian eddies. As already shown off Algeria, it is expected that the Libyo Egyptian eddies sometimes extend down to the bottom and can be guided, at least for the largest and most energetic ones, by the deep isobaths (~3000 m) associated with the Herodotus trough southeast of Crete (see Fig. 4). There, they can interact with Ierapetra, the anticyclonic eddy generated by the Meltem 13 (Me) southeast of Crete together with Pelops generated southwest of the Peloponnese (Pel). Both eddies are clearly recognised in Fig. 1, Ierapetra having drifted 13 The Meltem is a northerly wind blowing almost continuously in summer, hence also named "the Etesians". 21
23 C. Millot I. Taupier Letage south from where it was created ~6 months earlier. We have shown that Ierapetra is actually created every summer by the Meltem close to the southeastern tip of Crete. It can then remain stationary for one year (being thus reinforced the year after), drift southwards as far as the Libyo Egyptian continental slope (hence interacting with the Libyo Egyptian Current), or drift westwards as far as the western tip of Crete. Hence, Ierapetra can survive for years, successive Ierapetra s can coexist, possibly merge, and often interact with the Libyo Egyptian eddies. As evidenced from SST images, the shadowing effect of Crete (high relief) on the Meltem is sensed as far as Africa. Hence, the surface waters entrained southwards on both sides of Crete by this northerly wind tend to flow backward in between and feed Ierapetra. The alongslope circulation of AW can also feed Ierapetra from the south through the Libyo Egyptian eddies via a paddlewheel effect (and from the northeast as well, see below). We mainly hypothesise that the spreading seaward of the deep isobaths in the western Levantine leads the (deep) Libyo Egyptian eddies to separate from their (shallow) parent current that remains alongslope, and that the Herodotus trough traps them. Such a trapping can also apply to Ierapetra. To emphasise the fact that the zone corresponding to the Herodotus trough is characterised by the accumulation and interaction, frequently resulting into merging, of eddies originated from outside the zone, and not by some permanent gyre or eddy created there (previously named Mersa Matruh), we name it L W (accumulation in the western Levantine). Eddies that decay in the L W zone release AW that, at least partly, rejoins the remainder of the alongslope Libyo Egyptian Current. Up to the Nile delta, the restructured eastern basin gyre generates medium ( km) anticyclonic eddies that are similar to, although smaller than, the Libyo Egyptian ones. From the Nile delta up to the southern and central Middle East, instability processes only generate small (up to 50 km) eddies and mushroom like features that rapidly propagate downstream (up to 10 km/day). Such characteristics might be due to the shallower topography that prevents larger and better organised features to develop. In any case, these features spread AW seaward and feed what was known as the Shikmona zone that we name L E, for reasons similar to those invoked earlier for L W and E (accumulation in the eastern Levantine). When these features decay, the released AW re feeds, at least partly, the 22
24 Circulation in the Mediterranean eastern basin gyre along the northern Middle East slope. Then, along the Turkish slope up to Rhodes, the gyre (previously named Asia Minor Current there) mainly generates sharp meanders, some of which can evolve into medium ( km) anticyclonic eddies that propagate at up to ~3 km/day. Although a parallel will be made in section 5 with the Northern Current in the western basin, it has been stressed that the latter never generates such eddies. Then, the Rhodes Island divides the eastern basin gyre into a northwestern vein and a southwestern one. The northwestern vein flows along the Turkish slope most of the year, except maybe in summer when the Meltem blows against it, and penetrates into the Aegean. There, the complex topography induces a second bifurcation with a sub vein that continues into the Northern Aegean (Nor Aeg) and a sub vein that tends to skirt the whole Southern Aegean (Sou Aeg). The former sub vein joins with the Black Sea outflow and will be densified in winter, hence forming shelf water that will not reach large densities, furthermore since the northward propagation of LIW is mostly prevented by the complex topography (see below). The latter sub vein is associated with the dense water formation process that involves AW and LIW (see below) to form the Aegean Deep Water (AeDW). Although most of the AW exits the Aegean through the western Cretan Arc (i.e. west of Crete), some of it flows north of Crete, as evidenced by medium sized anticyclonic eddies propagating eastwards (i.e. downstream) before decaying. Then, AW that has skirted the Southern Aegean in such a way feeds, through the passages between the islands that constitute the eastern Cretan Arc, the southwestern vein that continuously flows along the southern slope of these islands. In winter, the southwestern vein is associated with the formation of LIW southwards of Rhodes, as is the Northern Current with WMDW. In summer, when the Meltem prevents AW from flowing markedly into the Aegean (and induces a marked upwelling zone off Turkey), the southwestern vein constitutes most of the eastern basin gyre. It can be identified as far as Crete, sometimes clearly feeding Ierapetra. But then, it is generally entrained in L W and again around the eastern Levantine. Therefore, whatever the season and the balance between the northwestern and southwestern veins, the eastern basin gyre is generally not encountered along the southern slope of Crete, so that most AW definitively exits the Levantine via the Aegean west of Crete. 23
25 C. Millot I. Taupier Letage AW then skirts the Peloponnese. In summer, part of it forms the wind induced Pelops that can later drift up to a few 100s km westwards. The remainder, and most AW during the rest of the year, continues northwards in the northeastern Ionian where it reconstitutes the eastern gyre before bifurcating into a northern and a western veins at the entrance of the Adriatic. The northern vein penetrates into the Adriatic and is partly associated with the formation of the Adriatic Deep Water (AdDW, see below) in the southern part of the subbasin (Sou Adr), while the remainder continues northwards and mixes there (Nor Adr) with the Pô and other rivers runoffs. There are similarities between the Aegean and the Adriatic, since less dense water is formed on the shelf in the north and denser water is formed offshore in the south. There are differences between the Bora effect on the Pô outflow (similar to the Meltem effect on the Nile outflow) and that of the Meltem on the Black Sea outflow (similar to the Mistral and westerlies effects on the Rhône and Ebro outflows), since the Bora pushes the Pô outflow towards the coast, so that it remains well structured along most of the Italian peninsula. AW exiting the Adriatic rejoins the westward vein that bypassed the Adriatic, both continuing along the southern tip of the Italian peninsula and Sicily, before closing there the circuit of the eastern basin gyre. The Maltese filament, formed by cold water upwelled off southwestern Sicily, then separates the incoming AW from the older one. It can be detected in the whole southern Ionian and can be considered as a tracer of the front that is the counterpart of the Almeria Oran front. 4. The circulation of the intermediate and deep waters (fig. 3, 4) To our knowledge, recent schemas of the circulation of the intermediate and deep waters have been proposed (and validated) for the western basin only [9]. Those proposed hereafter for the eastern basin must hence be considered as a first attempt to analyse the available in situ data sets with general ideas validated in the western basin only. These general ideas attribute a major role to the Coriolis effect and to mesoscale eddies, be these eddies either wind induced or generated by the instability of the alongslope AW circulation. The in situ data collected in the eastern basin (mainly in the north) were analysed up to now with concepts that are very different from ours, so that 24
26 Circulation in the Mediterranean the analysis hereafter is not consistent with the previous ones 14. Even though this analysis describes features in the south of the eastern basin that cannot be supported by data unavailable yet, so that these features are hypothetical, the present tense is used and adverbs such as "probably" are mostly omitted for convenience. In addition, we consider that the circulation of intermediate and deep waters necessarily displays a seasonal variability more or less far away from the zones of formation; however, due to the lack of data, this seasonal variability is not represented in the schemas. Several places and processes of formation have been hypothesised for LIW, including the interior of mesoscale anticyclonic eddies all year long in the southern Levantine. However, it is formed mainly south southeast of Rhodes in the northern Levantine, according to the offshore wintertime processes described in section 1 (see also section 5). As already said, LIW is the MW produced with the largest volume. Since it is the warmest and saltiest water formed in the whole sea, it can easily be tracked up to Gibraltar just below AW. Other intermediate waters formed together with denser waters, as e.g. in the Aegean (named Cretan Intermediate Water) or in the Liguro Provençal (named Winter Intermediate Water), cannot be differentiated so easily from waters above or below and they represent much lower amounts. We thus only discuss hereafter (section 4.1) the circulation of LIW, i.e. the intermediate water produced in the northern Levantine (Fig. 3). Some deep waters might be occasionally produced in specific places. This was said [29] for a water that reached ~2000 m in the northern Levantine where most of LIW forms. This was also said [25] for water denser than TDW (see section 4.2) that could be formed east of Bonifacio (cool zone in fig. 1) and could fill the deep Tyrrhenian (down to ~3500 m). However, we do not have enough data about these deep waters so that we restrict ourselves to the discussion (section 4.2) of AeDW, AdDW, TDW and WMDW (Fig. 4). 14 In any case, there are a lot of discrepancies between these previous analyses too! 25
27 C. Millot I. Taupier Letage 4.1. LIW LIW formed in the northern part of the Levantine flows, due to the Coriolis effect, along the southern continental slope of the Cretan Arc islands, from Rhodes to Crete and to the Peloponnese. Because the sills between these islands reach depths larger than the m LIW level, some LIW penetrates into the Southern Aegean where it mixes with AW in winter to form AeDW (it hardly penetrates into the Northern Aegean, due to the complex topography). However, the section of the openings does not allow the whole volume of LIW to go through so that most LIW flows alongslope south of Crete. Ierapetra and Pelops wind induced eddies entrain LIW where they form (i.e. close to the coast and just above the continental slope where LIW flows) and then transport it seawards, potentially over 100s km, releasing it away from the slope, in a process similar to the one mentioned in section 2.2 for the entrainment of LIW from the slope of Sardinia by the Algerian eddies passing by. The occurrence of LIW within such eddies when in the southern Levantine might have been misinterpreted as a formation of LIW within offshore eddies. Note that the Libyo Egyptians eddies (counterparts of the Algerian eddies) are in a position too far south to allow them to entrain newly formed LIW. Part of the LIW that continues circulating along the northeastern slope in the Ionian penetrates into the Southern Adriatic where it mixes with AW in winter to form AdDW. The remainder bypasses the Southern Adriatic and continues alongslope as far as the Channel of Sicily, where most of it (sill at ~400 m) outflows into the western basin. However, any part of LIW that has bypassed the entrance of the channel and is still associated with an alongslope pressure gradient will continue alongslope around most of the eastern basin. In other words, waters are generally not attracted by the openings and they do not feel them; they circulate alongslope, as long as they are forced to do so by an alongslope pressure gradient, and hence they can miss the openings. Within the Channel of Sicily, LIW flows along the Sicilian slope and then skirts Sicily. This path, initially suggested by [30], is now generally agreed and supported by theoretical analyses 26

28 Circulation in the Mediterranean Fig. 3. Circulation of LIW extrapolated from [9] for the western basin. The thin line represents the 500 m isobath. 27
29 C. Millot I. Taupier Letage (e.g. [31]). Then, LIW mainly circulates around the Tyrrhenian, roughly at m. A vein flows out through the Channel of Corsica (sill at ~400 m) while the remainder continues and flows out through the Channel of Sardinia. When this vein enters the Algerian, part of it can be entrained seawards by Algerian eddies passing by and then be released in the central subbasin. The remainder of the vein continues alongslope along western Sardinia and Corsica, joins with the vein issued from the Channel of Corsica, and then participates with AW in the wintertime formation of WMDW in the Ligurian and the Provençal. The still recognisable LIW continues along the Spanish slope and most of it outflows through the Strait of Gibraltar (sill at ~300 m), where it can still be recognised along the Spanish slope, while the remainder that bypassed the opening then progresses alongslope off Africa (as discussed for the entrance of the Channel of Sicily). Therefore, LIW appears to play a major role in the functioning of the Mediterranean Sea. First, because it is the warmest and saltiest MW formed with the largest amount. Second, because it mainly flows along the northern continental slopes of both basins just below AW, thus being involved there in the offshore formation of all deep MWs (AeDW, AdDW, WMDW). Because the immersion of LIW allows it to flow rather easily through the major openings, its path is almost one way, from the northern Levantine to the Channel of Sicily and the Strait of Gibraltar. However, the parts of LIW that have bypassed either the Channel of Sicily or the Strait of Gibraltar continue flowing alongslope around the basins. In addition, being involved into wintertime processes all along its path, one expects that LIW displays everywhere an increasingly complex seasonal variability (see also section 4.2) AeDW, AdDW, TDW and WMDW AW is warmer and saltier in the Aegean than in the Adriatic since northerlies are less cold (the Adriatic is surrounded by the Alps) and it just starts to be diluted (by the Black Sea mainly; it will be more and more diluted by rivers outflows). Moreover, LIW is warmer and saltier in the Aegean than in the Adriatic since it is closer to its formation zone and hence has undergone less mixing. Therefore, AeDW is saltier and warmer than AdDW. However, both waters have roughly similar densities. Up to the eighties, and nowadays as well, AdDW was denser than AeDW while, during what has been called the 28


![from [9] for](/docs-images/83/87652004/images/30-10.jpg "Western Basin.")

30 Circulation in the Mediterranean Fig. 4. Circulation of AeDW, AdDW, TDW and WMDW extrapolated from [9] for the Western Basin. The thin lines represent the 1000 m and 2750 m isobaths 29
Circulation in the Mediterranean Sea
 Hdb Env Chem Vol. 5, Part K (2005): 29 66 DOI 10.1007/b107143 Springer-Verlag Berlin Heidelberg 2005 Published online: 20 June 2005 Circulation in the Mediterranean Sea Claude Millot Isabelle Taupier-Letage
EARTH, PLANETARY, & SPACE SCIENCES 15 INTRODUCTION TO OCEANOGRAPHY. LABORATORY SESSION #6 Fall Ocean Circulation
 EARTH, PLANETARY, & SPACE SCIENCES 15 INTRODUCTION TO OCEANOGRAPHY LABORATORY SESSION #6 Fall 2017 Ocean Circulation The focus of the Lab this week is circulation of the ocean and atmosphere. Here, you
Plate 3. CZCS-derived chl Climatological Monthly Means
 Plate 3. CZCS-derived chl Climatological Monthly Means 15 16 2. Interannual variability The assessment of interannual variability in the 1998-2003 SeaWiFSderived data set was carried out by generating
Ocean Circulation. Si Hui Lee and Frances Wen. You can access ME at
 Ocean Circulation Si Hui Lee and Frances Wen You can access ME at http://tinyurl.com/oceancirculation Earth - the blue planet - 71% area covered by the oceans - 3/4 of ocean area between 3000-6000m deep
Chapter 22, Section 1 - Ocean Currents. Section Objectives
 Chapter 22, Section 1 - Ocean Currents Section Objectives Intro Surface Currents Factors Affecting Ocean Currents Global Wind Belts (you should draw and label a diagram of the global wind belts) The Coriolis
Submitted to Scientia Marina on September 29,
 1 1 1 1 1 1 1 1 0 1 0 1 0 1 Submitted to Scientia Marina on September, 0 ------- The LIW characteristics: an astounding general misunderstanding! Claude Millot Laboratoire d'océanographie Physique Biogéochimique
10% water in the world is tied up in the surface ocean currents. (above the pycnocline) Primary source is wind: Westerlies, Trades, Polar Easterlies
 Primary source is wind: Westerlies, Trades, Polar Easterlies") Oceanography Chapter 9 10% water in the world is tied up in the surface ocean currents. (above the pycnocline) Primary source is wind: Westerlies, Trades, Polar Easterlies Coriolis deflects winds (and
Oceanography Chapter 9 10% water in the world is tied up in the surface ocean currents. (above the pycnocline) Primary source is wind: Westerlies, Trades, Polar Easterlies Coriolis deflects winds (and
9/25/2014. Scales of Atmospheric Motion. Scales of Atmospheric Motion. Chapter 7: Circulation of the Atmosphere
 Chapter 7: Circulation of the Atmosphere The Atmosphere: An Introduction to Meteorology, 12 th Lutgens Tarbuck Lectures by: Heather Gallacher, Cleveland State University Scales of Atmospheric Motion Small-
CHAPTER 7 Ocean Circulation
 1 2 3 4 5 6 7 8 9 10 11 12 13 14 CHAPTER 7 Ocean Circulation Words Ocean currents Moving seawater Surface ocean currents Transfer heat from warmer to cooler areas Similar to pattern of major wind belts
ATMS 310 Tropical Dynamics
 ATMS 310 Tropical Dynamics Introduction Throughout the semester we have focused on mid-latitude dynamics. This is not to say that the dynamics of other parts of the world, such as the tropics, are any
Chapter 10 Lecture Outline. The Restless Oceans
 Chapter 10 Lecture Outline The Restless Oceans Focus Question 10.1 How does the Coriolis effect influence ocean currents? The Ocean s Surface Circulation Ocean currents Masses of water that flow from one
THE CIRCULATION IN THE NORTERN PART OF THE DENMARK STRAIT AND ITS VARIABILITY ABSTRACT
 ICES em 19991L:06 THE CIRCULATION IN THE NORTERN PART OF THE DENMARK STRAIT AND ITS VARIABILITY Steingrimur J6nsson Marine Research Institute and University of Akureyri, Glenirgata 36, 600 Akureyri, Iceland,
The Coriolis force, geostrophy, Rossby waves and the westward intensification
 Chapter 3 The Coriolis force, geostrophy, Rossby waves and the westward intensification The oceanic circulation is the result of a certain balance of forces. Geophysical Fluid Dynamics shows that a very
Introduction to Oceanography OCE 1001
 Introduction to Oceanography OCE 1001 Lecture Notes Chantale Bégin & Jessica Fry Version 2.1 10. Ocean Circulation (Trujillo, Chapter 7) Major ocean currents are stable and predictable; they have been
Ocean Layers. Based on sunlight penetration: Based on water density: Sunlight (photosynthesis is possible) Twilight Midnight
 Twilight Midnight") PART 3 Ocean Layers Based on sunlight penetration: Sunlight (photosynthesis is possible) Twilight Midnight Based on water density: Mixed layer Pycnocline (rapid change of themperature/salinity) Deep ocean
PART 3 Ocean Layers Based on sunlight penetration: Sunlight (photosynthesis is possible) Twilight Midnight Based on water density: Mixed layer Pycnocline (rapid change of themperature/salinity) Deep ocean
Variability of surface transport in the Northern Adriatic Sea from Finite-Size Lyapunov Exponents" Maristella Berta
 Variability of surface transport in the Northern Adriatic Sea from Finite-Size Lyapunov Exponents" Maristella Berta Marseille, 29 November 2011 Outline Geographical setting (winds and circulation of Adriatic
Wednesday, September 27, 2017 Test Monday, about half-way through grading. No D2L Assessment this week, watch for one next week
 Wednesday, September 27, 2017 Test Monday, about half-way through grading No D2L Assessment this week, watch for one next week Homework 3 Climate Variability (due Monday, October 9) Quick comment on Coriolis
Lecture 13 El Niño/La Niña Ocean-Atmosphere Interaction. Idealized 3-Cell Model of Wind Patterns on a Rotating Earth. Previous Lecture!
 Lecture 13 El Niño/La Niña Ocean-Atmosphere Interaction Previous Lecture! Global Winds General Circulation of winds at the surface and aloft Polar Jet Stream Subtropical Jet Stream Monsoons 1 2 Radiation
Lesson: Ocean Circulation
 Lesson: Ocean Circulation By Keith Meldahl Corresponding to Chapter 9: Ocean Circulation As this figure shows, there is a connection between the prevailing easterly and westerly winds (discussed in Chapter
ATS150: Global Climate Change. Oceans and Climate. Icebergs. Scott Denning CSU 1
 The Oceans Wind-Driven Gyre Circulations Icebergs Scott Denning CSU 1 Surface Balance of Forces friction coriolis wind stress resultant current Wind stress accelerates surface water Friction couples surface
Sea and Land Breezes METR 4433, Mesoscale Meteorology Spring 2006 (some of the material in this section came from ZMAG)
") Sea and Land Breezes METR 4433, Mesoscale Meteorology Spring 2006 (some of the material in this section came from ZMAG) 1 Definitions: The sea breeze is a local, thermally direct circulation arising from
Sea and Land Breezes METR 4433, Mesoscale Meteorology Spring 2006 (some of the material in this section came from ZMAG) 1 Definitions: The sea breeze is a local, thermally direct circulation arising from
Lecture Outlines PowerPoint. Chapter 15 Earth Science, 12e Tarbuck/Lutgens
 Lecture Outlines PowerPoint Chapter 15 Earth Science, 12e Tarbuck/Lutgens 2009 Pearson Prentice Hall This work is protected by United States copyright laws and is provided solely for the use of instructors
Winds and Ocean Circulations
 Winds and Ocean Circulations AT 351 Lab 5 February 20, 2008 Sea Surface Temperatures 1 Temperature Structure of the Ocean Ocean Currents 2 What causes ocean circulation? The direction of most ocean currents
The drift of Modified Atlantic Water from the Alboran Sea to the eastern Mediterranean*
 SCI. MAR., 62 (3): 211-216 SCIENTIA MARINA 1998 The drift of Modified Atlantic Water from the Alboran Sea to the eastern Mediterranean* J. FONT 1, C. MILLOT 2, J. SALAS 1, A. JULIÀ 1 and O. CHIC 1 1 Institut
Assessment Schedule 2016 Earth and Space Science: Demonstrate understanding of processes in the ocean system (91413)
") NCEA Level 3 Earth & Space Science (91413) 2016 page 1 of 6 Assessment Schedule 2016 Earth and Space Science: Demonstrate processes in the ocean system (91413) Evidence Statement Q Evidence with with Excellence
NCEA Level 3 Earth & Space Science (91413) 2016 page 1 of 6 Assessment Schedule 2016 Earth and Space Science: Demonstrate processes in the ocean system (91413) Evidence Statement Q Evidence with with Excellence
The ocean water is dynamic. Its physical
 CHAPTER MOVEMENTS OF OCEAN WATER The ocean water is dynamic. Its physical characteristics like temperature, salinity, density and the external forces like of the sun, moon and the winds influence the movement
Geostrophic and Tidal Currents in the South China Sea, Area III: West Philippines
 Southeast Asian Fisheries Development Center Geostrophic and Tidal Currents in the South China Sea, Area III: West Philippines Anond Snidvongs Department od Marine Science, Chulalongkorn University, Bangkok
Oceans and the Global Environment: Lec 2 taking physics and chemistry outdoors. the flowing, waving ocean
 Oceans and the Global Environment: Lec 2 taking physics and chemistry outdoors the flowing, waving ocean Peter Rhines 1 Eric Lindahl 2 Bob Koon 2, Julie Wright 3 www.ocean.washington.edu/courses/has221a-08
Sailing the Seas: Wind Driven Ocean Circulation Ocean Gyres
 Sailing the Seas: Wind Driven Ocean Circulation Ocean Gyres Ocean Currents What Happens at the Coast? Readings: Ch 9: 9.2-9.6, 9.8-9.13 Graphic: America's Cup sailboat race off Newport, Rhode Island. J.
Small- and large-scale circulation
 The Earth System - Atmosphere II Small- and large-scale circulation Atmospheric Circulation 1. Global atmospheric circulation can be thought of as a series of deep rivers that encircle the planet. 2. Imbedded
Alongshore wind stress (out of the page) Kawase/Ocean 420/Winter 2006 Upwelling 1. Coastal upwelling circulation
 Kawase/Ocean 420/Winter 2006 Upwelling 1. Coastal upwelling circulation") Kawase/Ocean 420/Winter 2006 Upwelling 1 Coastal upwelling circulation We found that in the northern hemisphere, the transport in the surface Ekman layer is to the right of the wind. At the bottom, there
Kawase/Ocean 420/Winter 2006 Upwelling 1 Coastal upwelling circulation We found that in the northern hemisphere, the transport in the surface Ekman layer is to the right of the wind. At the bottom, there
Surface Circulation in the Northeastern Mediterranean (NEMED)
") DISTRIBUTION STATEMENT A. Approved for public release; distribution is unlimited. Surface Circulation in the Northeastern Mediterranean (NEMED) Pierre-Marie Poulain Istituto Nazionale di Oceanografia e
DISTRIBUTION STATEMENT A. Approved for public release; distribution is unlimited. Surface Circulation in the Northeastern Mediterranean (NEMED) Pierre-Marie Poulain Istituto Nazionale di Oceanografia e
Section 6. The Surface Circulation of the Ocean. What Do You See? Think About It. Investigate. Learning Outcomes
 Chapter 5 Winds, Oceans, Weather, and Climate Section 6 The Surface Circulation of the Ocean What Do You See? Learning Outcomes In this section, you will Understand the general paths of surface ocean currents.
Atmospheric and Ocean Circulation Lab
 Atmospheric and Ocean Circulation Lab name Key Objectives: The main goal of this lab is to learn about atmospheric and oceanic circulation and how these two processes are strongly inter-dependent and strongly
Road transportation of dangerous goods quantitative risk assessment and route comparison
 Road transportation of dangerous goods quantitative risk assessment and route comparison Philippe Cassini, Nelson Rodrigues To cite this version: Philippe Cassini, Nelson Rodrigues. Road transportation
170 points. 38 points In your textbook, read about modern oceanography. For each item write the word that meets the description.
 Ch 15 Earth s Oceans SECTION 15.1 An Overview of Oceans 38 points In your textbook, read about modern oceanography. For each item write the word that meets the description. (5 points) 1. German research
Lornshill Academy. Geography Department Higher Revision Physical Environments - Atmosphere
 Lornshill Academy Geography Department Higher Revision Physical Environments - Atmosphere Physical Environments Atmosphere Global heat budget The earth s energy comes from solar radiation, this incoming
Ocean Motion. Ocean Currents. Before You Read. Read to Learn
 chapter 18 3 Ocean Motion section 2 Ocean Currents What You ll Learn the Coriolis effect what influences surface currents the temperature of coastal waters about density currents Before You Read Imagine
SIO 210 Introduction to Physical Oceanography Mid-term examination November 4, 2013; 50 minutes
 SIO 210 Introduction to Physical Oceanography Mid-term examination November 4, 2013; 50 minutes Closed book; one sheet of your own notes is allowed. A calculator is allowed. (100 total points.) Possibly
Directed Reading. Section: Ocean Currents. a(n). FACTORS THAT AFFECT SURFACE CURRENTS
. FACTORS THAT AFFECT SURFACE CURRENTS") Skills Worksheet Directed Reading Section: Ocean Currents 1. A horizontal movement of water in a well-defined pattern is called a(n). 2. What are two ways that oceanographers identify ocean currents? 3.
Skills Worksheet Directed Reading Section: Ocean Currents 1. A horizontal movement of water in a well-defined pattern is called a(n). 2. What are two ways that oceanographers identify ocean currents? 3.
Wind Driven Circulation Indian Ocean and Southern Ocean
 Wind Driven Circulation Indian Ocean and Southern Ocean Lecture 18 MAR 350 Spring 2017 Reading: Knauss Chapter 7 ECCO2 model animation ecco2_sst_flow (2).mp4 Mean surface height and currents DPO Fig. 11.1
OCN 201 Surface Circulation
 OCN 201 Surface Circulation Excess heat in equatorial regions requires redistribution toward the poles 1 In the Northern hemisphere, Coriolis force deflects movement to the right In the Southern hemisphere,
Introduction to Physical Oceanography STUDENT NOTES Date: 1. What do you know about solar radiation at different parts of the world?
 Introduction to Physical Oceanography STUDENT NOTES Date: 1 Warm up What do you know about solar radiation at different parts of the world? What affect does the tilt of the Earth have on the northern and
Ocean Currents that Redistribute Heat Globally
 Ocean Currents that Redistribute Heat Globally Ocean Circulation Ocean Currents Fig. CO7 OCEAN CURRENTS Surface ocean currents are similar to wind patterns: 1. Driven by Coriolis forces 2. Driven by winds
9.3. Storing Thermal Energy. Transferring Thermal Energy
 9.3 If you have been to a beach on a hot summer day, you have likely cooled off by going for a dip in the water. The water, which is cooler than you are, removes thermal energy from your body, making you
Applications of Collected Data from Argos Drifter, NOAA Satellite Tracked Buoy in the East Sea
 Applications of Collected Data from Argos Drifter, NOAA Satellite Tracked Buoy in the East Sea Young-Sang Suh (yssuh@nfrdi.re.kr) Ocean Research Team, National Fisheries Research and Development Institute,
Zonal (East-West) Currents. Wind-Driven Ocean Currents. Zonal (East-West) Currents. Meridional (N-S) Currents
 Currents. Wind-Driven Ocean Currents. Zonal (East-West) Currents. Meridional (N-S) Currents") Wind-Driven Ocean Currents Similarities between winds & surface currents Zonal (East-West) Currents Trade winds push currents westward north & south of the equator Equatorial currents. Up to 100 cm/sec.
Wind-Driven Ocean Currents Similarities between winds & surface currents Zonal (East-West) Currents Trade winds push currents westward north & south of the equator Equatorial currents. Up to 100 cm/sec.
Ocean Currents Unit (4 pts)
") Name: Section: Ocean Currents Unit (Topic 9A-1) page 1 Ocean Currents Unit (4 pts) Ocean Currents An ocean current is like a river in the ocean: water is flowing traveling from place to place. Historically,
Name: Section: Ocean Currents Unit (Topic 9A-1) page 1 Ocean Currents Unit (4 pts) Ocean Currents An ocean current is like a river in the ocean: water is flowing traveling from place to place. Historically,
The Ocean is a Geophysical Fluid Like the Atmosphere. The Physical Ocean. Yet Not Like the Atmosphere. ATS 760 Global Carbon Cycle The Physical Ocean
 The Physical Ocean The Ocean is a Geophysical Fluid Like the Atmosphere Three real forces: Gravity Pressure gradients Friction Two apparent forces: Coriolis and Centrifugal Geostrophic & Hydrostatic balances
Section 1. Global Wind Patterns and Weather. What Do You See? Think About It. Investigate. Learning Outcomes
 Chapter 5 Winds, Oceans, Weather, and Climate Section 1 Global Wind Patterns and Weather What Do You See? Learning Outcomes In this section, you will Determine the effects of Earth s rotation and the uneven
Wind is caused by differences in air pressure created by changes in temperature and water vapor content.
 Topic 8: Weather Notes, Continued Workbook Chapter 8 Wind is caused by differences in air pressure created by changes in temperature and water vapor content. Wind blows from high pressure areas to low
Currents measurements in the coast of Montevideo, Uruguay
 Currents measurements in the coast of Montevideo, Uruguay M. Fossati, D. Bellón, E. Lorenzo & I. Piedra-Cueva Fluid Mechanics and Environmental Engineering Institute (IMFIA), School of Engineering, Research
Agronomy 406 World Climates
 Agronomy 406 World Climates January 30, 2018 Monsoons. Ocean properties and circulation. Review for today: Online textbook: 1.3.1 (Sea water) Composition and properties. For Thursday: Rahmstorf, S.: The
SIO20 - Midterm Examination 2 v1 Winter Section A. Circle the letter corresponding to the best answer. (1 point each)
") NAME: Section A. Circle the letter corresponding to the best answer. (1 point each) 1. Rainbows result from: a. refraction and reflection of sunlight by water droplets b. reflection of sunlight by oceans
NAME: Section A. Circle the letter corresponding to the best answer. (1 point each) 1. Rainbows result from: a. refraction and reflection of sunlight by water droplets b. reflection of sunlight by oceans
Currents & Gyres Notes
 Currents & Gyres Notes Current A river of water flowing in the ocean. 2 Types of Currents Surface Currents wind-driven currents that occur in the top 100m or less Deep Currents density-driven currents
Chapter 7 Weather and Climate
 Chapter 7 Weather and Climate *Describe what weather is, what affects it, and where it occurs. *Explain the connection between air pressure and wind. * *Many factors affect a region s weather. * *atmosphere
Lecture 13 March 24, 2010, Wednesday. Atmospheric Pressure & Wind: Part 4
 Lecture 13 March 24, 2010, Wednesday Atmospheric Pressure & Wind: Part 4 Synoptic scale winds Mesoscale winds Microscale winds Air-sea interactions The largest synoptic scale wind. Monsoon: Arabic for
The Setting - Climatology of the Hawaiian Archipelago. Link to Video of Maui Waves
 The Setting - Climatology of the Hawaiian Archipelago Link to Video of Maui Waves What caused this week s weather? What caused this weekend s weather? Today s Objective: Provide overview and description
Midterm Exam III November 25, 2:10
 Midterm Exam III November 25, 2:10 25, 2:10 3:25 pm, HW714 Chapters 7 (7.12 7.17), 8 and 9 (through section 9.15, included) 60 multiple choice questions this exam constitutes 22% (only) of your total (overall)
Monday, October 2, Watch for new assessment (Week 4/5 review) TA s have your tests, please see key (at course website)
 TA s have your tests, please see key (at course website)") Monday, October 2, 2017 Watch for new assessment (Week 4/5 review) TA s have your tests, please see key (at course website) Homework 3 Due date Wednesday, Oct 11 (8 pm) Be ready to watch another important
Monday, October 2, 2017 Watch for new assessment (Week 4/5 review) TA s have your tests, please see key (at course website) Homework 3 Due date Wednesday, Oct 11 (8 pm) Be ready to watch another important
W3 Global Circulation Systems
 W3 Global Circulation Systems Which regions of Earth receive the most energy from the Sun? If not for global circulation systems There would only be two narrow regions that would support life What
3 The monsoon currents in an OGCM
 3 The monsoon currents in an OGCM The observations show that both Ekman drift and geostrophy contribute to the surface circulation in the north Indian Ocean. The former decays rapidly with depth, but the
Current: large mass of continuously moving ocean water
 Ocean Currents Current: large mass of continuously moving ocean water Surface Currents--Wind Circulation These waters make up about 10% of all the water in the ocean. These waters are the upper 400 meters
Atmospheric & Ocean Circulation-
 Atmospheric & Ocean Circulation- Overview: Atmosphere & Climate Atmospheric layers Heating at different latitudes Atmospheric convection cells (Hadley, Ferrel, Polar) Coriolis Force Generation of winds
Summary of Lecture 10, 04 March 2008 Introduce the Hadley circulation and examine global weather patterns. Discuss jet stream dynamics jet streams
 Summary of Lecture 10, 04 March 2008 Introduce the Hadley circulation and examine global weather patterns. Discuss jet stream dynamics jet streams arise because the Coriolis force prevents Hadley-type
Lecture 7. The Indian monsoon: is it a gigantic land-sea breeze?
 Lecture 7 The Indian monsoon: is it a gigantic land-sea breeze? In the next set of lectures I am going to discuss the different hypotheses put forth for the basic system responsible for the monsoon. I
Yellow Sea with contributions by John R. Apel
 with contributions by John R. Apel Overview The is a shallow inland sea lying between northeastern China and the Korean Peninsula, with depths in its central north-south trough in excess of 60 to 80 m
Chapter. Air Pressure and Wind
 Chapter Air Pressure and Wind 19.1 Understanding Air Pressure Air Pressure Defined Air pressure is the pressure exerted by the weight of air. 19.1 Understanding Air Pressure Air Pressure Defined Air pressure
WEATHER SYSTEMS OF MIDDLE LATITUDES
 CHAPTER 10 WEATHER SYSTEMS OF MIDDLE LATITUDES MULTIPLE CHOICE QUESTIONS 1. In equal volumes, which one of the following air masses exerts the highest surface air pressure? a. cp *b. A c. mp d. ct e. mt
Abrupt marine boundary layer changes revealed by airborne in situ and lidar measurements
 Abrupt marine boundary layer changes revealed by airborne in situ and lidar measurements David A. Rahn 1, Thomas R. Parish 2, and David Leon 2 1 Univeristy of Kansas 2 Univeristy of Wyoming Precision Atmospheric
Seasonal and interannual variation of currents in the western Japan Sea: numerical simulation in comparison with infrared satellite imagery
 Seasonal and interannual variation of currents in the western Japan Sea: numerical simulation in comparison with infrared satellite imagery Olga Trusenkova*, Aleksandr Nikitin**, Vyacheslav Lobanov*, and
Chapter. The Dynamic Ocean
 Chapter The Dynamic Ocean An ocean current is the mass of ocean water that flows from one place to another. 16.1 The Composition of Seawater Surface Circulation Surface Currents Surface currents are movements
Quiz name: Oceanography - Land and Sea Interaction - Quiz #2
 Name: Quiz name: Oceanography - Land and Sea Interaction - Quiz #2 ate: 1. What is the direction of spin for gyres in the northern hemisphere? clockwise counter clockwise northern oscillation southern
OCN201 Spring14 1. Name: Class: Date: True/False Indicate whether the statement is true or false.
 Name: Class: _ Date: _ OCN201 Spring14 1 True/False Indicate whether the statement is true or false. 1. Short residence time elements are uniformly distributed in the oceans 2. Thermohaline circulation
Atmospheric & Ocean Circulation- I
 Atmospheric & Ocean Circulation- I First: need to understand basic Earth s Energy Balance 1) Incoming radiation 2) Albedo (reflectivity) 3) Blackbody Radiation Atm/ Ocean movement ultimately derives from
Class Notes: Week 10. April 9 th,2019. Topics: Front and Mid-Latitude Wave Cyclones El Niño / La Niña Mid-term 2 review
 Class Notes: Week 10 April 9 th,2019 Topics: Front and Mid-Latitude Wave Cyclones El Niño / La Niña Mid-term 2 review Front- is a boundary between 2 different types of air masses Air masses with different
Role of the oceans in the climate system
 Role of the oceans in the climate system heat exchange and transport hydrological cycle and air-sea exchange of moisture wind, currents, and upwelling gas exchange and carbon cycle Heat transport Two Primary
2.4. Applications of Boundary Layer Meteorology
 2.4. Applications of Boundary Layer Meteorology 2.4.1. Temporal Evolution & Prediction of the PBL Earlier, we saw the following figure showing the diurnal evolution of PBL. With a typical diurnal cycle,
OCEANOGRAPHY STUDY GUIDE
 OCEANOGRAPHY STUDY GUIDE Chapter 2 Section 1 1. Most abundant salt in ocean. Sodium chloride; NaCl 2. Amount of Earth covered by Water 71% 3. Four oceans: What are they? Atlantic, Pacific, Arctic, Indian
Lecture 24. El Nino Southern Oscillation (ENSO) Part 1
 Part 1") Lecture 24 El Nino Southern Oscillation (ENSO) Part 1 The most dominant phenomenon in the interannual variation of the tropical oceanatmosphere system is the El Nino Southern Oscillation (ENSO) over the
Lecture 24 El Nino Southern Oscillation (ENSO) Part 1 The most dominant phenomenon in the interannual variation of the tropical oceanatmosphere system is the El Nino Southern Oscillation (ENSO) over the
Air Pressure and Wind
 Air Pressure and Wind 19.1 Understanding Air Pressure Air Pressure Defined Air pressure is the pressure exerted by the weight of air. Air pressure is exerted in all directions down, up, and sideways. The
Week 6-7: Wind-driven ocean circulation. Tally s book, chapter 7
 Week 6-7: Wind-driven ocean circulation Tally s book, chapter 7 Recap so far Our goal (since week 3) has been to understand large-scale ocean circulation and its underlying physics, and to learn how to
Deep Water Currents Lab
 Deep Water Currents Lab Background: Anyone visiting the seashore is struck by the constant motion of water traveling on the surface of the ocean in the form of waves. But beneath the ocean's surface, water
The Surface Currents OCEA 101
 The Surface Currents OCEA 101 Why should you care? - the surface ocean circulation controls the major ocean biomes - variations in ocean circulation control the supply of nutrients for marine organisms
MODELING INDIAN OCEAN CIRCULATION: BAY OF BENGAL FRESH PLUME AND ARABIAN SEA MINI WARM POOL
 MODELING INDIAN OCEAN CIRCULATION: BAY OF BENGAL FRESH PLUME AND ARABIAN SEA MINI WARM POOL P. N. Vinayachandran* 1 1, *2 and J. Kurian* * 1 Centre for Atmospheric and Oceanic Sciences, Indian Institute
Chapter 10: Global Wind Systems
 Chapter 10: Global Wind Systems Three-cell model of atmospheric circulation Intertropical Convergence Zone (ITCZ) Typical surface wind patterns Upper-level pressure and winds Climatological sea-level pressure
(20 points) 1. ENSO is a coupled climate phenomenon in the tropical Pacific that has both regional and global impacts.
 1. ENSO is a coupled climate phenomenon in the tropical Pacific that has both regional and global impacts.") SIO 210 Problem Set 4 Answer key December 1, 2014 Due Dec. 12, 2014 (20 points) 1. ENSO is a coupled climate phenomenon in the tropical Pacific that has both regional and global impacts. (2 points) a)
SIO 210 Problem Set 4 Answer key December 1, 2014 Due Dec. 12, 2014 (20 points) 1. ENSO is a coupled climate phenomenon in the tropical Pacific that has both regional and global impacts. (2 points) a)
Air moves towards ITCZ in tropics because of rising air - convection. Horizontal extent of Hadley cell is modified by Friction Coriolis Force
 Air moves towards ITCZ in tropics because of rising air - convection Horizontal extent of Hadley cell is modified by Friction Coriolis Force Speed from rotation Objects at rest on Earth move at very different
ESS15 Lecture 12. Review, tropical oceans & El Nino, and the thermohaline ocean circulation. Please see new reading material on website.
 ESS15 Lecture 12 Review, tropical oceans & El Nino, and the thermohaline ocean circulation. Please see new reading material on website. Review. I-clicker exercise: In this graph of Earth s energy imbalances
Lecture 22: Ageostrophic motion and Ekman layers
 Lecture 22: Ageostrophic motion and Ekman layers November 5, 2003 1 Subgeostrophic flow: the Ekman layer Before returning to our discussion of the general circulation of the atmosphere in Chapter 8, we
THE RESPONSE OF THE GULF OF MAINE COASTAL CURRENT SYSTEM TO LATE-SPRING
 THE RESPONSE OF THE GULF OF MAINE COASTAL CURRENT SYSTEM TO LATE-SPRING NORTHEASTERLY WIND FORCING Neal R Pettigrew and Huijie Xue School of Marine Sciences University of Maine, Orono ME 04469 The Gulf
The Air-Sea Interaction. Masanori Konda Kyoto University
 2 The Air-Sea Interaction Masanori Konda Kyoto University 2.1 Feedback between Ocean and Atmosphere Heat and momentum exchange between the ocean and atmosphere Atmospheric circulation Condensation heat
A CYCLONIC EDDY NORTH OF LOMBOK *)
") A CYCLONIC EDDY NORTH OF LOMBOK *) by George Cresswell ABSTRACT A satellite drifter that passed from south to north through Lombok Strait in early 1988 became trapped in a cyclonic eddy 100 km north of
A CYCLONIC EDDY NORTH OF LOMBOK *) by George Cresswell ABSTRACT A satellite drifter that passed from south to north through Lombok Strait in early 1988 became trapped in a cyclonic eddy 100 km north of
Variability in the tropical oceans - Monitoring and prediction of El Niño and La Niña -
 Variability in the tropical oceans - Monitoring and prediction of El Niño and La Niña - Jun ichi HIROSAWA Climate Prediction Division Japan Meteorological Agency SST anomaly in Nov. 1997 1 ( ) Outline
Impact of the tides, wind and shelf circulation on the Gironde river plume dynamics
 Impact of the tides, wind and shelf circulation on the Gironde river plume dynamics F. Toublanc 1, N. Ayoub 2, P. Marsaleix 3, P. De Mey 2 1 CNES/LEGOS 2 CNRS/LEGOS 3 CNRS/LA, Toulouse, France 5th GODAE
Chapter 10. Adjacent seas of the Pacific Ocean
 Chapter 10 Adjacent seas of the Pacific Ocean Although the adjacent seas of the Pacific Ocean do not impact much on the hydrography of the oceanic basins, they cover a substantial part of its area and
Chapter 7: Circulation And The Atmosphere
 Chapter 7: Circulation And The Atmosphere Highly integrated wind system Main Circulation Currents: series of deep rivers of air encircling the planet Various perturbations or vortices (hurricanes, tornados,
Chapter 8 Air Masses
 Chapter 8 Air Masses Air Masses - 1 1. An Air Mass is a large body of air usually about 1500 km across and several km thick, that has homogeneous physical properties. 2. The important physical properties
3 Global Winds and Local Winds
 CHAPTER 1 3 Global Winds and Local Winds SECTION The Atmosphere BEFORE YOU READ After you read this section, you should be able to answer these questions: What causes wind? What is the Coriolis effect?
The dryline is a mesoscale phenomena whose development and evaluation is strongly linked to the PBL.
 2.2. Development and Evolution of Drylines The dryline is a mesoscale phenomena whose development and evaluation is strongly linked to the PBL. Text books containing sections on dryline: The Dry Line.