Holden Beach. Annual Beach Monitoring Report. Prepared For: Town of Holden Beach, North Carolina. October cover.
|
|
|
- Peter Russell
- 5 years ago
- Views:
Transcription


1 Holden Beach Annual Beach Monitoring Report Prepared For: Town of Holden Beach, North Carolina October cover.cdr 10/31/18

2 2018 Annual Beach Monitoring Report Holden Beach, North Carolina October 2018 Prepared for the Town of Holden Beach
3 TABLE OF CONTENTS 1.0 INTRODUCTION RECENT AND FUTURE PROJECTS Town Upland Fill Projects Town Central Reach Project Borrow Area Monitoring Static Vegetation Line Central Reach Timing USACE and Town LWFIX Projects USACE and Town LWFIX Project USACE LWFIX Project Shallow Draft Inlet Program State and USACE Shallow Draft MOA State Shallow Draft Inlet Permitting State Dredging Fund Lockwood Folly Inlet Projects LWF Outer Shoal Dredging County LWF Outer Shoal Dredging Project Dune Enhancement Storm Activity USACE BCB Project East End Terminal Groin Project Beach Management Permits ANNUAL SURVEY RESULTS Survey Results Volume Analysis Shoreline Analysis Historical Analysis Oak Island Transects SUMMARY 4-1 APPENDIX A Station Profile Analysis APPENDIX B 2018 Survey Plan View Figures GNV/2017/081687A/11/1/18 i

4 1.0 INTRODUCTION Holden Beach is a 9-mile-long barrier island located in Brunswick County, North Carolina (see Figure 1-1), where long-term and episodic storm erosion continually threatens the coastal habitats, recreational beach, tourism, and upland developments on the island. Consequently, the Town of Holden Beach, referred to herein as the Town, has undertaken a comprehensive beach management and maintenance program to protect and enhance its beach system. All nourishment and dune enhancement activities resulting from this program have proven valuable in providing a healthy beach system as well as a storm buffer to reduce losses to homeowners and to Town, State, and Federal infrastructure. Figure 1-1. Project Location Map of Holden Beach, NC (NOAA Chart 11536) The Town has been documenting nourishment and dune project performance and environmental effects through annual field surveys, analyses, and monitoring reports according to regulatory agency permit conditions, as well as to remain eligible for Federal Emergency Management Agency (FEMA) mitigation funding related to engineered beaches. Another objective is to identify erosional areas of shoreline that warrant future nourishment consideration. This report summarizes the mid-2017 to mid-2018 beach management activities, as well as comparing the most recent survey (April 2018) with beach profile surveys collected from 2000 through Beach profile data is used to assess the status of the beach through an evaluation of volume and contour change and to establish rates of change with respect to nourishment projects and historical background erosion rates. GNV/2017/081687A/11/1/18 1-1
5 2.0 RECENT AND FUTURE PROJECTS This section provides a brief project site history, beginning with the 2001/2002 U.S. Army Corps of Engineers (USACE) Wilmington Harbor Deepening nourishment project. Prior to this event, Town and USACE beach management efforts were sporadic and on a smaller scale, with the first documented nourishment occurring in Beach scraping and dune repairs have been documented as far back as 1954, mitigating Hurricane Hazel impacts. Significant erosion and the loss of more than 30 houses on the eastern end of Holden Beach in the 1990s were major factors in establishing current beach management activities. Table 2-1 and Figure 2-1 summarize nourishment activities and locations since Table 2.1. Summary of Holden Beach Nourishment Projects since 2001 Date Completed By Beach Stations Nourished Approx. Volume of Material Placed (cubic yards) 12/8/01 2/20/02 USACE ,000 3/7/02 4/30/02 Town of Holden Beach Phase I , ,700 3/02-4/02 USACE ) 32,000 Winter Town of Holden Beach ,000 9/16/04 11/2/04 USACE ,230 12/03 4/04 Town of Holden Beach and /5/06 5/24/06 USACE ,853 Early 2006 Early /24/08 3/28/08 Town of Holden Beach Town of Holden Beach Town of Holden Beach Nourishment Material Source Wilmington Harbor Deepening Project Oyster Harbor upland site Lockwood Folly Inlet crossing of AIWW Boyd Street Disposal Area Lockwood Folly Inlet crossing of AIWW 123,000 Smith borrow site Lockwood Folly Inlet crossing of AIWW Eastern Reach 42,000 Smith borrow site Western Reach 3,200 Smith borrow site and /2009 USACE ,000 03/24/09 4/30/09 Town of Holden Beach and Spring 2010 USACE ,000 February 2011 USACE ,000 January 2012 USACE ,000 2/10/14-2/27/14 USACE ,000 2/27/14-3/15/14 9/4/15-9/15/15 1/3/17 3/17/17 Town of Holden Beach Town of Holden Beach Town of Holden Beach ,000 Nearshore ( ) 201,000 Smith borrow site Lockwood Folly Inlet crossing of AIWW 190,000 Smith borrow site 24,000 Lockwood Folly Inlet crossing of AIWW Lockwood Folly Inlet crossing of AIWW Lockwood Folly Inlet crossing of AIWW Lockwood Folly Inlet crossing of AIWW Lockwood Folly Inlet crossing of AIWW Lockwood Folly Outer Navigation Channel ,310,000 Offshore borrow area March 2017 Town / USACE ,000 Approximate Total Volume since ,402,983 Lockwood Folly Inlet crossing of AIWW GNV/2017/081687A/11/1/18 2-1
_USA")
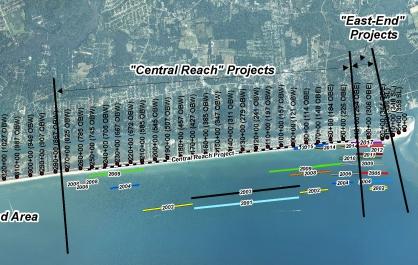
6 Legend Station_Street_Index 2001_(~48_CY_ft)_USACE 2002_(~22_CY_ft)_HB 2002_(~32_CY_ft)_USACE "East-End" Projects 2003_(~4_CY_ft)_HB 2004_(~27_CY_ft)_HB 2004_(~45_CY_ft)_USACE 2006_(~19_CY_ft)_HB 2006_(~24_CY_ft)_USACE Unmanaged Area ± Figure 2-1 Holden Beach Historic Nourishment Activity ( ) HB= Holden Beach, USACE= U.S. Army Corps of Engineers Central R ct e ac h Proje (344 OBE) (336 SL) (348 SL) 5+00 (358 SL) (306 OBE) (264 OBE) (226 OBE) (184 OBE) (148 OBE) (114 OBE) (121 OBW) (157 OBW) (197 OBW) (241 OBW) (279 OBW) (311 OBW) (347 OBW) (385 OBW) (427 OBW) (585 OBW) (672 OBW) (667 OBW) (705 OBW) (785 OBW) (825 OBW) (867 OBW) (907 OBW) (949 OBW) (987 OBW) _Central_Reach_Project_(~60_CY_ft) 2017_(~50_CY_ft)_HB_USACE (1027 OBW) 2015 Murden (~7_CY_ft)_HB (1067 OBW) (1281 OBW) (1311 OBW) (1337 OBW) (1359 OBW) 2014_(~41_CY_ft)_HB (1193 OBW) (1255 OBW) (1225 OBW) 2014_(~29_CY_ft)_USACE (1151 OBW) 2012_(~25_CY_ft)_USACE (1109 OBW) 2011_(~15_CY_ft)_USACE (745 OBW) 2010_(~40_CY_ft)_USACE (457 OBW) 2009_(~19_CY_ft)_HB (545 OBW) 2009_(~40_CY_ft)_USACE (507 OBW) "Central Reach" Projects 2008_(~34_CY_ft)_HB Miles
7 Following the spring 2002 completion of the USACE Wilmington Harbor Deepening nourishment project, the Town conducted six beach nourishment projects using upland borrow sources. The most recent upland truck haul project occurred in spring 2009 where the Town placed 190,000 cubic yards (cy) of upland fill along approximately 10,000 linear feet (LF) of shoreline. In addition to upland fill beach nourishments, the Town has also taken a more active role in working with the USACE to maximize fill placement from dredging the Lockwood Folly (LWF) Inlet Atlantic Intracoastal Waterway crossing (LWFIX). The Town placed 95,000 cy from the LWFIX along approximately 2,400 LF of shoreline in 2014 (in addition to 93,000 cy placed by the USACE) Most recently in March 2017, the Town participated in the LWFIX Project that placed ~120,000 cy of material dredged from the LWFIX and the bend widener along ~2,400 LF of shoreline. Of course the major nourishment activity of 2017 was the Town s Central Reach Project (CRP) which placed approximately 1.31 million cubic yards (MCY) along ~4.1 miles of shoreline from January to March The one-year post-project movement and spreading of the fill placements from these two nourishment projects are reflected in the 2018 survey (discussed in Section 3) and further details of these projects are provided in the subsequent sections. 2.1 TOWN UPLAND FILL PROJECTS The Town has a history of successful upland fill projects with the most recent occurring in 2009 primarily as Hurricane Hannah mitigation. Approximately 115,000 cy was placed between Stations and (21 cy/lf average) along the Eastern Reach and 75,000 cy between Stations and (16.5 cy/lf average) along the Western Reach. Figure 2-2 illustrates the placed-fill footprint and the permitted footprint. Sand was obtained from the Smith upland borrow site. Note that upland sand has been used in emergency dune rebuilding following Hurricane Irene in GNV/2017/081687A/11/1/18 2-3
 While the last upland-sourced beach nourishment occurred several years ago, the")
8 Holden Fill Western Reach Holden Fill Eastern Reach Figure Constructed Project Reaches and Permitted Sand Placement (the existing permit was modified and expanded in 2009) While the last upland-sourced beach nourishment occurred several years ago, the use of upland borrow areas remains a feasible alternative for Holden Beach. Fill projects utilizing upland borrow areas can be extremely valuable for unplanned/emergency mitigation efforts, such as the responses to Hurricanes Hanna and Irene. Additionally, truck haul projects do not involve the expensive mobilization/demobilization costs associated with offshore dredges and can occur much more quickly. Potential negative aspects of upland borrow areas include variations in sand color, practical volume limitations, and placement methods (i.e., trucking). Additionally, the NCDOT requires permitting and has the ability to shut down operations or require roadway mitigation. The Town owns the Turkey Trap Road upland borrow site while other potential borrow area sites include the Smith Borrow site (Figure 2-3) and the Tripp Site. GNV/2017/081687A/11/1/18 2-4

9 Figure 2-3. Smith Upland Borrow Area during 2009 Holden Beach Nourishment Project 2.2 TOWN CENTRAL REACH PROJECT The Town Central Reach nourishment project occurred in the winter/spring of 2017 and represents the largest beach fill project to date on the island. Project construction began on January 3, 2017 and was completed on March 17, 2017 (74 days) by Weeks Marine. The nourishment utilized an offshore borrow area and placed approximately 1.31 million cubic yards (MCY) along 4.1 miles (22,000 ft) of shoreline [Ocean Boulevard East (OBE) 240 to Ocean Boulevard West (OBW) 781]. Figure 2-4 presents the beach fill project footprint, and Figure 2-5 presents a typical fill cross-section following construction. On average, constructed berm widths were ~150 ft wide and fill placements were ~60 cy/lf (with a range typically varying between 50 and 70 cy/lf). Construction was scheduled to begin in mid-december of 2016 but winter storms caused some minor delays and the project officially began on January 3 rd, Fortunately, two hopper dredges were utilized simultaneously for the majority of the project s duration. These dredges were the R.N. Weeks and the B.E. Lindholm, photographed in Figure 2-6. The use of two hopper dredges helped move the project along very efficiently and allowed work to progress without delay as the dredges periodically would have to leave the project site and return to the maintenance yard in Wilmington for equipment changes or services. GNV/2017/081687A/11/1/18 2-5
")
10 Figure 2-4. Central Reach Beach Fill Placement Footprint (Construction from 1/3/17 to 3/17/17 from ~Station to Station ) Figure 2-5. Typical As Built Cross Section following Central Reach Project Completion GNV/2017/081687A/11/1/18 2-6
11 Weeks Marine Hopper Dredges Figure 2-6. Central Reach Construction (ATM photo taken January 2017). Throughout the project, the Weeks crew made use of continuous non-capture trawling to mitigate inadvertent turtle takes while dredging the borrow area, but unfortunately two turtle takes (one juvenile loggerhead, one juvenile green) occurred toward the end of the project. Both incidental takes happened aboard the R.N. Weeks on February 27 th within less than 8 hours of each other. Following both incidental turtle takes, the R.N. Weeks immediately stopped its dredging operations and awaited permission before returning to work in a different section of the borrow area from where the takes occurred, as is protocol. Although numerous measures were taken to avoid any detrimental impact to wildlife, incidents like these are sometimes unavoidable, especially when considering the record setting turtle nesting numbers over the last several years. Fortunately, these were the only incidental takes and the project continued without any further environmental issues. With the help of the two hopper dredges, the Weeks Marine crew worked quickly, pumping sand on the beach and progressing at an average rate of about 300 feet of shoreline per day. Despite the minor delays towards the beginning and near the end of the project, the entire nourishment took approximately 74 days and was completed on March 17. Aerial and ground photographs taken during construction can be seen in Figures 2-7 and 2-8. GNV/2017/081687A/11/1/18 2-7

12 Starter Dune Figure 2-7. Aerial Photograph during Central Reach Construction West of Pier, ~Station (Weeks Marine/Aerophoto Photo 2/22/17). GNV/2017/081687A/11/1/18 2-8
13 Weeks Marine Hopper Dredge Active Sand Pumping Figure 2-8. Central Reach Construction (ATM photo taken 1/26/17) BORROW AREA The Central Reach Project utilized an offshore borrow area approximately 5 miles southeast from the Holden Beach project shoreline. Figure 2-9 presents a figure of the post-project dredge cut depths. Hopper dredges work by making long shallow cuts (typically only 6 inches to 1 foot deep) along the borrow area and the cut depths shown are typical. Dredging was generally only 2 to 4 feet deep in most areas. The offshore borrow area for the Central Reach project was delineated based on the need for enough sand for at least 2 large nourishments. The borrow area was allocated into different zones for the dredgers to work, in order to conserve some zones for future projects. However, the dredger encountered some isolated pockets of incompatible material - generally rock or hard clay that damaged the dredge (hoppers have debris screens on board which prevent rocks from reaching the beach). Weeks coordinated closely with ATM and Town staff to ensure beach compatible material was placed while leaving some areas for future projects. GNV/2017/081687A/11/1/18 2-9

14 Dredge cuts generally 2-4 feet deep Undredged Area (white) Lightly Dredged Areas Figure 2-9. Central Reach Borrow Area Cut Depths. Dredge cuts less than 2 feet deep can likely be used for future nourishments. Following the project, it is estimated that at least 500,000 cy of material is still available for future nourishments. Recall that the 2002 USACE project placed ~525,000 cy of material, therefore while there is enough sand in the borrow area for a large project, there isn t GNV/2017/081687A/11/1/
15 enough for another Central Reach project. ATM recommends that additional offshore borrow area reconnaissance occurs. The CRP borrow area was the preferred location of several potential borrow areas initially evaluated in , however, given the interests of Oak Island to use this borrow area as well as the recent placement of artificial reef material to the east of the CRP borrow area, other locations will likely require re-evaluation. Additionally, due to the CRP borrow area location offshore (2-3 miles) and depths (~35-40 feet), it is not anticipated that any substantial amount of sand will fill in the used portions of the borrow area in the near future. Therefore the portions of the CRP borrow area that have been dredged more than 2 feet deep likely cannot be re-used in the future MONITORING Sediment monitoring of the placed sand occurred daily throughout the project and immediately following completion. The nourishment sand was found to be a good match to the existing beach with slightly coarser sand than the native sand, which is fortunate as coarser sand erodes less quickly than finer material. In addition to sand sampling, the monitoring of endangered vegetation (specifically seabeach amaranth) is currently underway and will be repeated for the next few summers to assess the condition of this species along the project shoreline. Seabeach amaranth has not been documented for years on Holden Beach however natural resource agencies believe there is potential for establishment STATIC VEGETATION LINE Due to the project s size, a Static Vegetation Line (SVL) was required by the Division of Coastal Management (DCM). The SVL is basically the seaward limit of stable dune vegetation prior to a large beach nourishment and the SVL is the baseline for CAMA setback distances. The SVL is only along the CRP shoreline (not the east end or western areas of the beach) and the SVL was delineated prior to Hurricane Matthew dune erosion. The SVL line may not be an issue for Holden Beach because of the Town s proactive and beneficial dune enhancements over the years. However if the SVL becomes an issue in the future, there are two options available to the Town to exempt itself from the SVL. The first is to develop an SVL exception document which needs to provide data for 30 years worth of future beach nourishments. This exception has to be re-visited every 5 years as well. The GNV/2017/081687A/11/1/
16 second and more recent alternative is for the Town to propose and create a Development Line. The Development Line alternative is a simpler and faster process. Town and ATM staff have already coordinated with DCM staff regarding the Development Line process and several other towns have used this process since it became effective in CENTRAL REACH TIMING The Central Reach nourishment occurred at a very beneficial time, as the beach suffered relatively large erosional losses between 2015 and 2016, and Hurricane Matthew caused significant erosion and damage to the Holden Beach shoreline in October The damage from Matthew was significant enough that the beach qualified for FEMA mitigation funding, which helped offset the costs of the Central Reach project. The Central Reach nourishment took place just months after Matthew and vastly revitalized the beach and dune system, and the newly constructed beach has and continues to provide added protection from future storms. Post-construction monitoring photos are presented in the figures on the following pages. Figure 2-10 (A) shows a photograph of the widened beach conditions immediately following construction. The Central Reach Project was very successful and in total the project cost approximately $15 million, equating to less than $12 per cubic yard. This is a very favorable rate, especially when compared to similar nearby beach nourishment projects. This project is designed to last 10 to 15 years (based on historical erosion rates) and this report and future annual monitoring surveys will track the spreading and progress of the placed sand. Recent photographs taken 1 to 1.5 years following construction are presented in Figure 2-10 (B), Figure 2-10 (C), and Figure 2-10 (D). Site observations reveal the nourishment is equilibrating and spreading. The results of the latest survey and fill volume measurements are discussed in detail in Section 3. GNV/2017/081687A/11/1/
. Central Reach One-year Post-Construction ~ Station 40+00 (ATM photo taken April 2018).")
17 Figure 2-10 (A). Central Reach Immediate Post-Construction ~ Station (ATM photo taken January 2017). Figure 2-10 (B). Central Reach One-year Post-Construction ~ Station (ATM photo taken April 2018). GNV/2017/081687A/11/1/
18 Figure 2-10 (C). Central Reach One-year Post-Construction ~ Station (ATM photo taken August 2018). Figure 2-10 (D). Central Reach Post-Construction ~ Station (ATM photo taken August 2018). Note sand fencing, starter dune, and plantings. GNV/2017/081687A/11/1/
 is")
19 2.3 USACE AND TOWN LWFIX PROJECTS The LWFIX borrow area has acted as a beneficial use of dredged material (i.e., a borrow area for beach nourishment) since the 1970s. The primary reason for the USACE LWFIX dredging project is navigation; however, the dredged material is beach compatible and Station on the east end (beginning of the beach fill placement) is less than 4,000 feet away. The USACE typically performs this project every 2 years, depending on shoaling and funding. The primary goal of this bi-annual project is navigation, while a secondary and important benefit is placement of this compatible material on the beach. Prior to the one completed in March 2017, the previous LWFIX project occurred in the spring of The LWFIX project typically includes the AIWW itself as well as a bend widener. The bend widener typically varies from 50 feet wide (Figure 2-11) to 400 feet wide (Figure 2-12). The 400-ft bend widener is the largest widener allowed by USACE permit conditions. The 400-ft bend widener is rarely dredged by the USACE due to limited federal funding however the USACE did include it for the 2010 project. The 140,000-cy project in 2010 resulted from economic stimulus funding (i.e., American Reinvestment and Recovery Act). AIWW LWFIX Dredge Location USACE Beach Fill Placement 50-ft Bend Widener Figure USACE LWFIX Dredging and Beach Placement Schematic (source USACE request for proposal). Placement typically occurs between Holden Beach Stations and GNV/2017/081687A/11/1/

20 Figure USACE and Town LWFIX 2014 Project Dredging and Beach Placement It is anticipated that future USACE LWFIX projects will include only minimal effort/cost to maintain the AIWW, despite sufficient sand volume within the bend widener dredge footprint. As a result, USACE LWFIX dredge projects can be relatively small. For example, the February 2011 and January 2012 USACE LWFIX projects provided only 32,000 cy and 25,000 cy of material placed, respectively. The Town performed an independent project that piggybacked the 2014 USACE LWFIX project and expanded the borrow area to include the 400-ft bend widener so more material could be placed on the beach. Since the 400-ft bend widener is within the authorized Federal navigation project footprint, the permitting process was simplified. The Town s piggybacking of the USACE project maximized sand placement while minimizing costs by use of the dredge already onsite for the Federal project. The Town project placed approximately 95,000 cy of beach-compatible material along approximately 2,300 ft of Holden Beach shoreline, between baseline stations and (41 cy/lf average). Figure 2-13 shows an aerial photograph taken during the 2014 LWFIX project. GNV/2017/081687A/11/1/
![Dredge Outfall Pipeline Figure 2-13. Aerial Photograph of 2014 LWFIX Nourishment [source: NC Division of Coastal Management (DCM)]. The Town s 2014 LWFIX project was very successful.](/docs-images/90/103285110/images/21-0.jpg "Approximately 95,000 cy of material was placed for about $8/cy, which is a very favorable rate.")
21 Dredge Outfall Pipeline Figure Aerial Photograph of 2014 LWFIX Nourishment [source: NC Division of Coastal Management (DCM)]. The Town s 2014 LWFIX project was very successful. Approximately 95,000 cy of material was placed for about $8/cy, which is a very favorable rate. Nourishment dredging costs are typically much higher than this (depending on the borrow area and pumping distance) and can range from $10/cy to $25/cy. The North Carolina Department of Environmental Quality (NCDEQ) paid for half the project cost (via the Water Resources Development Project Grant Program), and Brunswick County also contributed to the funding of the project. Additionally, Town resources (staff, equipment, oversight) expended for this project were significantly less than those expended for upland fill projects USACE AND TOWN LWFIX PROJECT Due to the successes of the 2010 and 2014 LWFIX projects using the 400-ft widener, the Town has been more involved in the LWFIX projects, especially since USACE funding has been so limited. Following a slightly different course of action than the 2014 LWFIX Project, the Town and ATM staff coordinated with the USACE Navigation Branch personnel in GNV/2017/081687A/11/1/

22 charge of this dredging project to include the 400-ft widener under the USACE permit authorizations (not the Town s permits). The project was completed in mid-march of 2017 and is also referred to as the Eastern Reach Project. Figure 2-14 presents a plan view schematic of the 2017 LWIFX dredging and Town nourishment project. Including the 400-ft widener resulted in a total of approximately 130,000 cy that was dredged and approximately 120,000 cy placed along the eastern reach project area (a small percentage of material is always lost during the dredging and construction process). In order to ensure maximum benefits to the central and eastern reaches of Holden Beach, the dredged material was placed immediately adjacent to the Town s Central Reach Project s eastern taper, where CRP construction began in January of Figure USACE LWFIX Dredging and Beach Placement Schematic (source USACE request for proposal). Placement of ~120,000 cy occurred in March 2017 between Holden Beach Stations and to meet in with the Central Reach Project. To avoid overlapping with the Central Reach Project, the dredged material was placed from Station to Station (~2,400 ft of shoreline). As a result, the 2017 project differed from the 2014 nourishment placement mainly in that it covered a shorter length of GNV/2017/081687A/11/1/

23 shoreline but featured a wider berm (~130 ft wide) with fill placements of about 50 cubic yards per linear foot which closely matched with the Central Reach nourishment fill volumes. The Eastern Reach Project was very successful and photographs taken during construction are presented in Figures 2-15 and The Town involvement allowed for the placement of an additional 60,000 cy at a very inexpensive rate. The cost for the project was $465,000 while the Town s portion was only ~ $76,000 (with the State providing 66.7 percent). The timing of this nourishment coincided very well with the Central Reach Project and helped fill out much of the remaining shoreline of Holden Beach east of the larger Central Reach Project. Moreover, the Town s involvement helped maximize the restoration effort needed following the recent hurricanes, and has helped mitigate more recent storm activity as well as future storm erosion as the eastern end of shoreline has historically shown the highest erosion rates on the island. Figure Holden Beach POA Photograph taken near 323 McCray Street (~Station 26+00) during 2017 Eastern Reach Project construction. GNV/2017/081687A/11/1/


24 Figure Holden Beach POA Aerial Photograph taken during 2017 Eastern Reach Project construction (pumping just west of Station 30+00). Figure 2-17 presents a one-year post-project photograph monitoring the progression of the 2017 Eastern Reach Project. In general and based on site observations, the east end is continuing to benefit from the recent nourishment however it does need nourishing every two years to avoid extreme erosional conditions that have occurred in past decades. More detail on beach survey monitoring are provided in Section 3. Figure One-Year Post Construction Photo of the 2017 Eastern Reach Project (ATM photo taken April 2018, east of Station 30+00). GNV/2017/081687A/11/1/

25 USACE LWFIX PROJECT The USACE has a LWFIX dredge and nourishment project planned for the spring of 2019 and unfortunately the USACE has chosen to place this material onto Oak Island. Figure 2-18 presents an overview of the project. The USACE is bidding the project based on 88,000 cy of material to be dredged from LWFIX with a small 25-ft bend widener. Town and ATM staff have met on several occasions over the last year with USACE and Oak Island staff regarding placement options however Holden Beach was never notified in advance that the East End would not receive any sand from the upcoming project. The USACE maintained that an easement issue from another USACE project had led them to reevaluate all easements for all Wilmington District projects. Figure Planned 2019 LWFIX placement on Oak Island. According to the USACE, Oak Island fill placement only required easements from the Town of Oak Island and Oak Island recently provided these. For the East End of Holden Beach, the USACE identified over 50 easements needed with many of these on active beach (not buildable lots, see Figure 2-19). However Holden Beach staff were not notified of this new requirement until the last shallow draft inlet meeting on August 29 th. GNV/2017/081687A/11/1/

26 Non-buildable active beach parcels where easements are required by USACE Figure USACE is requiring easements for primarily non-buildable lots that are on active beach before East End LWFIX placement can resume. 2.4 SHALLOW DRAFT INLET PROGRAM Shallow draft inlet dredging represents a small niche in the dredging community where a dredge has to be relatively small (shallow draft) yet also must be ocean-certified by the Coast Guard for potentially rough/dangerous inlet conditions. Currently no known private dredging companies in the U.S. have these types of dredges while the USACE has one side-caster and two small hopper dredges that can perform these projects. The USACE side-caster, the Merritt, was originally built in 1944 and just received major repairs (including major hull work) that required about a year of drydock time. This year Dare County and the state have come up with funding to form a public-private partnership with a Dare County contractor to build a shallow draft hopper dredge that would primarily serve Dare County (Oregon and Hatteras Inlets) (Figure 2-20). At a minimum, this dredge will ease demand for other USACE shallow draft dredging projects (i.e. Lockwood Folly Inlet). It is not known whether this new dredge will be available for future LWF Inlet work. Fifteen million dollars ($15,000,000) from the State Shallow Draft Navigation Channel Dredging and Aquatic Weed Fund were allocated to Dare County (local partner) to provide a forgivable loan to a private partner for the construction and purchase of the proposed shallow draft hopper dredge. GNV/2017/081687A/11/1/

27 Figure USACE Shallow Draft Split-Hull Hopper Dredge the Currituck Rarely Dredges the LWF Inlet The historical lack of USACE funding for North Carolina shallow draft inlet maintenance led the State, in conjunction with local county and municipal governments, to: 1. Obtain a memorandum of agreement (MOA) with the USACE to fund shallow draft inlet dredging, and 2. Obtain permits to maintain the navigability of the State s shallow draft inlets independently of the USACE, and 3. Establish the Shallow Draft Navigation Channel and Lake Dredging Fund; (which has recently been renamed the Shallow Draft Navigation Channel and Aquatic Weed Fund - effective July 1, 2016). Funds can be used for the MOA or independently of federally sponsored projects. More information on all of these initiatives is provided in the next sections STATE AND USACE SHALLOW DRAFT MOA In November 2013, North Carolina signed an MOA that allows the State and local stakeholders to contribute funds to the USACE for shallow draft inlet maintenance dredging. The North Carolina General Assembly established the Shallow Draft Navigation Channel and Aquatic Weed Fund to provide State funding, which will be endowed by both an increase in boat registration fees and an excise on motor fuel, to the North Carolina Wildlife Resources Commission s boating account. While the limit to the USACE under the MOA is GNV/2017/081687A/11/1/
28 $12 million per year, additional funding is available for shallow draft dredging projects independent of the MOA. The USACE and NCDEQ have quarterly meetings regarding the implementation of the longterm MOA. Town staff have attended these meetings previously and Town and/or ATM staff will keep abreast of these meetings on a regular basis. The USACE typically dredges the LWFIX and AIWW bi-annually (every other year) while the USACE typically sidecast dredges the outer LWF Inlet once per quarter, if adequate funding is available. Each sidecast dredge maintenance event costs between $225,000 and $250,000, including the associated pre-dredging and post-dredging surveys (USACE navigation communication, 2013). In recent years, the USACE has reduced the dredging frequency to once every 6 months or even longer. Additional effort can be required if the intervals between dredging events are longer STATE SHALLOW DRAFT INLET PERMITTING The State took the lead in the shallow draft inlet permitting following the 2013 Shallow Draft Inlet (SDI) report. This effort was predicated on two major factors: 1) there is only one sidecast dredge that remains in the federal government fleet, the refurbished Merritt, and 2) Federal funding has been limited/absent and may never return. In addition to the Merritt, the Currituck and Murden can work the LWF and Shallotte Inlets, however, they cannot safely navigate all other shallow draft inlets. In any case, there will be a significantly limited availability of USACE dredges that can maintain the SDIs even if adequate local/state funding is generated. Following the reconnaissance study, the State gathered the necessary materials (geotechnical data, biological reports, survey data, etc.) to apply for permits for locally held authorizations. These authorizations allow the Town an additional option for maintaining (at current USACE templates) the LWFIX crossing, the inlet throat, and the outer channel beyond the COLREGs line (refer to Section for more on this topic). The permits for this effort were issued in May 2016 and will expire in 2019 (with the ability to obtain extensions). The authorizations include all currently approved dredge material GNV/2017/081687A/11/1/
29 management locations, including shoreline beneficial placement, nearshore placement and/or upland confined disposal placement. Note that there are some additional monitoring requirements when compared to the USACE authorizations (which were originally developed decades ago) STATE DREDGING FUND Independent of the MOA, dredging funds can be obtained directly from the State via the Water Resources Development Grant process. The Town has used this mechanism for the 2014 LWFIX project. In 2014 the State cost-sharing was 50% while it is now 66.7% for nontier one counties. The dredging fund has expanded in scope since its inception and funding has also increased. Over 12 federally authorized inlets and associated channels are included while some non-federal channels are also included (mostly related to state ferry routes). Of course there is also a lake/freshwater component of the fund (as identified in the fund s name). The fund has shown robust growth and availability since its inception LOCKWOOD FOLLY INLET PROJECTS Lockwood Folly Inlet is a federally authorized shallow draft inlet. Due to different and separate historical USACE funding sources, two basic routine maintenance activities historically occur at LWF Inlet: 1. Outer bar sidecast dredging, and 2. LWFIX cutter-head dredging and beach fill placement Figure 2-21 provides a representation of these two regions. The LWFIX projects were described in detail in section 2.3 and this section focuses on the outer shoal, seaward of the COLREGs line. Another important future component of LWF outer ebb shoal maintenance is a proposal by Brunswick County to dredge a deeper and wider outer channel. This will be discussed further in Section GNV/2017/081687A/11/1/
 and the LWFIX (cutterhead dredged) The SDI permit authorizations allow the Town (with State, County and potentially")
30 Figure LWF Inlet USACE Dredging Projects Include the Outer Channel (sidecaster dredged) and the LWFIX (cutterhead dredged) The SDI permit authorizations allow the Town (with State, County and potentially Oak Island funding assistance) to dredge/maintain LWF Inlet both landward and seaward of the COLREGs line. The COLREGs line is the Coast Guard collision regulation demarcation that only allows ocean-certified dredges seaward of this delineation. Ocean-certified dredges are typically larger dredges that are much more expensive to mobilize/demobilize (typically between $2 to $4 million per event). The LWFIX dredge projects are predominantly awarded to smaller dredge companies with dredges that are not ocean certified (e.g., Southwinds, Cottrell) since this area is landward of the COLREGs line. 2.5 LWF OUTER SHOAL DREDGING Outer shoal dredging is typically performed by the Merritt, which is the USACE s only remaining sidecaster. Due to the Merritt s drydocking, the Murden was recently last used in September 2017 to clear the remaining portions of the outer ebb channel of LWF Inlet. The Murden was scheduled to dredge at least 6,000 cy of material in September 2018 however Hurricane Florence and other USACE priorities scuttled this event (post-florence USACE surveys actually show that LWF Inlet fared well). This material was to be placed nearshore of Oak Island, not Holden Beach. This was not due to an easement issue. Holden Beach and ATM staff were made aware of this project however did not believe it to GNV/2017/081687A/11/1/

 70+00 (148 OVBE) 0.")
31 be economical based on nearshore placement and negligible benefits. And Oak Island staff requested placement of this material. The Murden placed the 2017 dredged material in the Holden Beach nearshore in an authorized location. This disposal location was similar to the 2015 Murden project where the Town of Holden Beach performed a pilot project placing ~30,000 cy of material in the nearshore with dredged material from the LWF Inlet. Figure 2-22 presents a figure of the 2017 LWF outer bar dredging and nearshore placement in comparison to the 2015 nearshore placement (114 OVBE) (148 OVBE) (184 OVBE) * * * * * * * * * ** * * çè (226 OVBE) (264 OVBE) (306 OVBE) (336 SL) (348 SL) LWF Outer Channel Murden 2017 Dredging Focus (Black dotted line) (344 OVBE) 5+00 (358 SL) 0+00 çè çè ç è V Murden 2015 Dredge Spoil Disposal (Black Dots) Murden 2017 Dredge Spoil Disposal (Triangles) DEPTHS IN METERS Miles 8.5 Figure LWF Outer Channel USACE Dredging Projects by Merritt, then Murden in summer Due to the project s purpose (i.e., shallow draft inlet dredging and nearshore disposal), the State funded 66.7 percent of the project costs and Brunswick County contributed funding also. GNV/2017/081687A/11/1/

32 2.5.1 COUNTY LWF OUTER SHOAL DREDGING PROJECT Brunswick County has proposed this year to dredge a deeper and possibly wider outer LWF ebb channel and to place this material either on Holden Beach or Oak Island. The outer ebb channel is currently authorized to 150 feet wide and 8 feet deep. However the County is proposing to deepen the channel to 12 feet deep and possibly widen it. This project would be eligible for state dredging funds (66.7% of total project costs) and the County has estimated approximately 250,000 cy would be available for beach nourishment. The Civil War shipwrecks in LWF Inlet present an obvious complicating factor to deepening and widening the outer LWF Inlet. Figure 2-23 presents a side-scan sonar image of the Blockade Runner Bendigo. Figure Civil War Bendigo Shipwreck Sidescan (source: USACE, 2010) The Blockade Runner Elizabeth and the Blockade Runner Bendigo are owned by the State of North Carolina and listed in the National Register as part of an archeological district. The USS Iron Age is owned by the U.S. Department of the Navy and it is listed in the National Register as part of an archeological district. All of these vessels are approximately 200 ft long, and, therefore, cover a large area that poses a navigation hazard as well as limits the possible dredged channel locations. GNV/2017/081687A/11/1/
33 The NC Cape Fear Civil War Shipwreck Register states Lockwoods Folly Inlet has remained in its same general location since the Civil War, however, the inlet channel has moved back and forth across the wrecks periodically. The Register also describes the LWF Inlet vessels as follows: Iron Age: The estimated dimensions of the original vessel is 150 feet by 26 feet, while artifact dispersion is estimated to 200 feet by 50 feet. Elizabeth: Artifact dispersal is roughly estimated to lie within a 250-foot diameter area centering on the steam machinery. Bendigo: Projected vessel length of 176 feet; other measurements produced an estimated hull beam of 20 feet 2 inches, a maximum beam of 36 feet 2 inches, and a depth of hold of 10 feet. An additional relevant quote related to the Bendigo is as follows: Embedded in a shoal near the Lockwoods Folly Inlet channel and exposed at high tide, it was obvious to staff underwater archaeologists that maintenance dredging with the shifting inlet at times came very close to the wreck and appeared to be causing detrimental under-cutting of the wreck (NC Cape Fear Civil War Shipwreck Register, 1985). In addition to the Civil War shipwrecks, the deepening of the outer inlet has the potential to detrimentally affect the downdrift beach, which is the east end of Holden Beach. As such, any proposed activity by the County must be scrutinized by Holden Beach. Additionally, the east end of Holden Beach should receive priority for beach placement. While the proposed project would benefit navigation, it unfortunately has the potential to detrimentally effect the east end shoreline of Holden Beach. Additionally, the wider and deeper channel alternative simulated as a separate alternative in the 2012/2013 modeling analysis indicated an increase in water flow in and out of LWF Inlet. This resulted in significant changes to the sediment processes in the LWF Inlet estuarine system which would likely require additional study. In general, utilizing large ebb shoal borrow areas is typically discouraged because it can interrupt the natural sediment bypassing process by creating a sediment trap. Shallotte Inlet ebb shoal dredging has been cited as acting as an effective sediment trap (OCTI, GNV/2017/081687A/11/1/
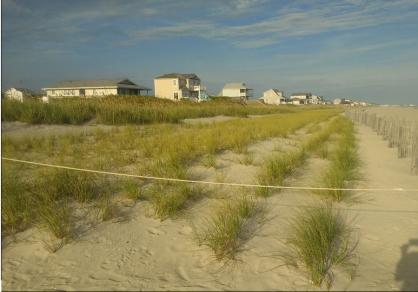
34 2008). The USACE CASCADE modeling also analyzed several ebb shoal borrow area alternatives in support of the defunct BCB 50-year project for LWF Inlet. In most cases, the use of the ebb shoal as a borrow area was not sustainable. CASCADE modeling for the LWF Inlet ebb shoal concluded that approximately 125,000 cy/yr of material is the approximate upper sustainable limit for long-term use. Therefore a 250,000 cy outer ebb shoal project may be sustainable however additional study is required. 2.6 DUNE ENHANCEMENT In addition to placement of sand, the Town has been proactively enhancing dune habitat on an annual basis. The dune-building program includes: Vegetation planting (sea oats, American beach grass, bitter panicum, etc.) Fertilization Sand fence maintenance and expansion Dune walkover maintenance The continued diligence and effort of Holden Beach has resulted in a stable and healthy dune system along a majority of the island, although Hurricane Matthew removed approximately 41 acres of dunes in Dune vegetation planting and sand fencing was a planned component of the Central Reach project and has stabilized and restored the dune system along Holden Beach damaged by Hurricane Matthew. The starter dune fill component was fenced and vegetated along the entire Central Reach shoreline (4.1 miles). Additionally, the eastern reach project also received planting and fencing (0.5 miles). Approximately 381,000 plants (primarily sea oat sprigs) were installed along the Central Reach and 22,000 plants were installed along the Eastern Reach. Approximately 4.6 miles of new sand fencing was also installed along the Central and Eastern Reaches. Figure 2-24 presents example sections of sand fencing put in place just seaward of the constructed starter dune immediately following the 2017 nourishment projects, and one-year postproject monitoring photographs of the starter dunes and plantings are shown in Figure GNV/2017/081687A/11/1/

.")
35 Starter Dune Figure 2-24 (A). Sand Fencing along the seaward edge of the Starter Dune for the Central Reach Project at Station ~ Vegetation has been planted on the starter dune since photograph date. (ATM photo, taken May 2017). Starter Dune Figure 2-24 (B). Sand Fencing along the seaward edge of the Starter Dune for the Central Reach Project at Station ~ Vegetation has been planted on the starter dune since photograph date. (ATM photo, taken May 2017). GNV/2017/081687A/11/1/

.")
36 Figure 2-25 (A). Sand Fencing along the seaward edge of the Starter Dune for the Central Reach Project at Station ~ showing planted dune vegetation. (ATM photo, taken August 2018). Figure 2-25 (B). Sand Fencing along the seaward edge of the Starter Dune for the Central Reach Project at Station ~25+00 showing planted dune vegetation. (ATM photo, taken August 2018). GNV/2017/081687A/11/1/
37 No planting occurred west of the Central Reach project, however, this area is anticipated to widen and benefit as nourishment material spreads into it. The 2018 survey reveals this spreading is occurring (Section 3). Some areas of shoreline on the west end experienced dune erosion and vegetation loss in recent years and could benefit from proactive dune enhancement efforts. A large dune system is present along the west end, so planting of more mature vegetation could help to promote growth of a thick maritime forest and increase accretion steadily over the years to come. Recent studies have shown maritime forest vegetation (wax myrtles, holly, shrubs, etc.) build up the ground, creating green barriers as formidable defense against future erosion from rising seas and storm surge. 2.7 STORM ACTIVITY Figure 2-26 presents a summary of 2017 Atlantic Hurricane tracks. The 2017 hurricane season had 17 named storms, with 6 storms reaching major hurricane status (i.e., a category 3 hurricane or greater, and noted as MH in Figure 2-26). Although the season was very active over the entire Atlantic hurricane basin, no storms made direct landfall in North Carolina. Hurricane Irma was the only hurricane to make landfall on the southeastern U.S. coastline in Although it made landfall in southwest Florida, Irma was one of the largest and strongest storms on record and its impacts were felt up to North Carolina as the storm continued tracking north following landfall. Hurricanes Gert, Jose, and Maria tracked relatively close to the southeastern United States (~300 miles offshore of Holden Beach) as category 1 and 2 storms capable of impacting NC shorelines with larger than normal waves and water levels due to storm surges. Overall, Holden Beach and other regional beaches were only mildly affected by these storms and many of the 2017 tropical storms remained well offshore. In addition to tropical storms, winter storms and nor easters have the potential to create extreme wind, wave, and surge conditions that can affect the shoreline. Winter storm Grayson which occurred this past winter in early January of 2018 was the most notable of these events. In addition to record snow fall, Grayson brought high winds to the NC coast with gusts greater than 70 mph recorded in the Outer Banks. Fortunately, Holden Beach was largely spared from these extreme winds and in general experienced a calmer winter than has been observed in previous years. GNV/2017/081687A/11/1/
38 Figure Atlantic Hurricane Summary Overview. Note that Hurricanes Florence and Michael discussions are not included in this annual report but separate memos have been developed in order to assess impacts and to facilitate FEMA mitigation. These hurricanes will be detailed in next year s annual monitoring report. 2.8 USACE BCB PROJECT The USACE Brunswick County Beaches (BCB) project has not advanced over the last few years and would likely require significant resources and time to re-start this program. The USACE has released several tomes of studies since the project s inception in approximately The project represents a USACE coastal storm damage reduction (CSDR) effort for Holden Beach, Caswell Beach and Oak Island. The project is many years behind schedule and is over budget. The USACE BCB project studies are 50/50 cost shared between the USACE and the participating communities (Holden Beach, Caswell Beach, and Oak Island). The Town has inquired this year about what level of effort would be needed to re-start this study. GNV/2017/081687A/11/1/
39 2.9 EAST END TERMINAL GROIN PROJECT The east end of Holden Beach (LWF Inlet to Station 40+00) experiences the highest erosion rates on the island. Storm damage and property loss are also correspondingly historically high on the east end. As a result, the Town and the USACE have focused significant beach nourishment resources on the east end. However, the area still remains vulnerable. While a terminal groin and nourishment program has always been a feasible option for this area from a technical standpoint, State regulations have only recently allowed the permitting and construction of terminal groins. Note that groin exceptions due to bridge protection and historic structure preservation were previously allowed (e.g., Oregon Inlet terminal groin, Hatteras Lighthouse groins). In 2011, the Town began the analysis and permitting required to construct a terminal groin and institute an associated beach nourishment program on the east end. This program will allow longer time intervals between nourishments and allow for a more stable upper beach and dune system, resulting in reduced long-term nourishment costs as well as reduced risk to coastal infrastructure. The federal EIS process was glacially slow, where USACE staff turnover, processing delays and other factors beyond the Town s and ATM s control consistently delayed the process (and the USACE cannot be held accountable for missing EIS timelines). The Final EIS was due to be released this year however the Town has decided to not continue this process under threat of appeal and additional costs. Unfortunately, the LWFIX nourishment program that has been so successful the last ~8 years for the east end is now in jeopardy as the Town of Oak Island is now interested in this sand source and are going to receive LWFIX sand in Without continued nourishment of the east end, severely erosional conditions may return to this area. Town and ATM staff are working diligently to prevent this from occurring and will closely monitor this situation BEACH MANAGEMENT PERMITS The Town currently has several projects that have required or do require permits, including: GNV/2017/081687A/11/1/
40 Central Reach Project LWFIX Projects LWF Outer Bar Project (Side-casting) Upland Borrow Area The Central Reach nourishment project has been completed although there is technically still some head-room in the volume placed and there is still some offshore borrow area volume available (as planned). DCM chose to modify the beach nourishment permit initially obtained by the Town in 2002 (permit number 14-02) for the Central Reach project. This follows modifications that included the 2008 and 2009 Town nourishments using the Smith borrow site. DCM is now requiring permit extensions every year; therefore an extension will be required this year. In contrast to DCM, the USACE typically creates new permits for each project (upland fill, LWFIX, Central Reach). The USACE permit for the upland borrow area nourishment project (SAW ) was extended in 2009 and again last year. This permit now expires on December 31, 2021 and currently allows the placement of 64,000 cy of upland borrow material. ATM recommends coordinating with DCM to extend the permit for this project to the same date. The NCDWQ permits are project specific and generally follow the lead of NCDCM. The USACE, NCDCM and NCDWQ generally coordinate to avoid any permit condition conflicts. If any future modifications are needed, it is anticipated that coordination will be needed with all of these agencies. Agencies have been amenable to permit modifications and extensions related to beach fill placement location and permitted borrow areas (Turkey Trap, Smith Site, Boyd Site, and Central Reach) in the past. On a similar note, the County s special exception permit to operate a mine in Brunswick County for the Turkey Trap Road borrow area has no expiration date. The Smith borrow site is a water feature for a residential development; therefore, a special exception permit is not needed (although this can be determined by regulatory interpretation). Upland borrow areas need to be reviewed by the Division of Land Resources, which oversees mining operations in the state. The Town renewed the mining permit this year. GNV/2017/081687A/11/1/
41 As previously discussed in Section 2.5, the Town has recently obtained permits to perform SDI projects including LWFIX dredging and beach placement as well as outer-channel sidecast dredging. The state permits (DCM 52-16) were issued in May 2016 and will expire on December 31, The corresponding USACE permit (SAW ) for this effort expires in Again, having the DCM permit expiration extended to match the USACE expiration is recommended prior to the DCM permit expiration date. GNV/2017/081687A/11/1/

42 3.0 ANNUAL SURVEY RESULTS 3.1 SURVEY RESULTS Beach surveys are performed annually as a part of the Town s Beach Management Plan and span from LWF Inlet to Shallotte Inlet. Figure 3-1 presents the stationing and transects established by the monitoring plan. Survey data were collected in April of 2018 at 48 transects along Holden Beach. This survey also included the additional seven transects on western Oak Island. The monitoring of these additional Oak Island transects began with the 2012 survey to more closely monitor inlet-related effects and establish more consistent baseline data. Similar to historical trends on the west end of Holden Beach, the west end of Oak Island is generally stable; however, inlet dynamics have the potential to affect this area. Figure 3-1. Holden Beach Annual Monitoring Transects, An additional seven monitoring transects have also been added to western Oak Island beginning with the 2012 survey. Note Z is in ft-ngvd29. Figures 3-2 and 3-3 present example transect surveys comparing 2017 and 2018 survey data. Figure 3-2 also shows a 2016 and 2017 survey comparison to illustrate typical changing sediment transport patterns since before and after the 2017 nourishment projects (discussed further in subsequent sections). As both the Central Reach Project and the Town Eastern Reach / USACE LWFIX Project were completed in the spring of 2017, the 2018 survey represents one-year post-construction conditions. Note that some differences in profiles may be related to recent wave activity and/or nourishment activities and are not necessarily indicative of long-term trends. Appendix A contains all transect data for the 2017 and 2018 surveys. GNV/2017/081687A/11/1/18 3-1


43 Figure 3-2. Station Profile Transect Comparison on the Town East Reach of Holden Beach. Upper panel shows survey comparison showing the 1-yr post-project adjustment of the 2017 LWFIX / Town Eastern Reach nourishment material. Lower panel shows comparison, displaying the immediate post project profile of the 2017 LWFIX / Town Eastern Reach nourishment. Placed project volumes typically ranged between 40 and 60 cubic yards / linear foot GNV/2017/081687A/11/1/18 3-2

44 Figure 3-3. Station Profile Transect following Town Central Reach Project. Central Reach Nourishment placed ~65 CY/ lf in this area. In general, comparison of the 2017 and 2018 surveys reveals an overall largely accretional beach along much of the island with downdrift spreading of nourishment material observed in areas west of the Central Reach project area. Eastward spreading of the Central Reach and Town / USACE LWFIX nourishments was less apparent as the east end of Holden Beach experienced more erosion, following historical trends for this reach. As anticipated one year following the 2017 Town Eastern Reach Nourishment / USACE LWFIX Project nourishment, the cross-shore changes at Station in Figure 3-2 show the movement of material from the upper beach into the nearshore approaching an equilibrium beach profile. Figure 3-3 shows a typical profile view within the Central Reach project area and displays a sediment transport pattern very similar to Station as some adjustment/equilibration of the nourishment material has taken place over the past year. Note the constructed starter dune included as part of the 2017 project template appears established and is exhibiting healthy elevations in the 2018 survey. Figure 3-3 also reveals that some material has accreted in areas farther offshore as well and relatively significant changes are observed beyond the -12 ft contour, which has historically been considered the depth-of-closure for Holden Beach, barring major hurricanes. This can likely be attributed to both the cross-shore and longshore transport of the nourishment material in combination with the milder wave conditions seen over the past year allowing GNV/2017/081687A/11/1/18 3-3
45 sand lost offshore during Hurricane Matthew in 2016 to now migrate back onshore. As documented in the 2017 Annual Report, significant erosion following Matthew was observed in the areas of west of the Central Reach Nourishment template, and similar losses likely would have been observed for the majority of the Holden Beach shoreline had the 2017 nourishments not taken place. Sections 3.2 and 3.3 provide more information on volume and shoreline analysis, respectively. 3.2 VOLUME ANALYSIS Figure 3-4 presents changes in volumes from 2017 to 2018 along the entire beach. Volumes are quantified by comparing profile volumes from successive surveys. The USACE Beach Morphology Analysis Program (BMAP) was used to compute changes in profile volumes for each profile and for all surveys during the monitoring period. Figure 3-4 shows the majority of the shoreline has been mostly stable to accretional, with some variation from station to station. This variation is due to survey precision as well as seasonal variation, and recent wave activity. Additional variation may also be attributed to undulating patterns along the shoreline, which have been documented along nearby beaches 1. The western extent of the 2017 Central Reach Nourishment ended at ~Station and the 2018 survey reveals that the anticipated downdrift spreading of the project sand to the western shorelines is taking place, as indicated by the exhibited accretion in these areas. The most significant erosion over the past year was observed along the east end. Loss of volume in this area is expected as this was the eastern extent of the 2017 Eastern Reach nourishment and the material was anticipated to naturally spread east and west. Some eastward spreading and accretion were observed specifically at Station 15+00, benefitting the easternmost shorelines of Holden Beach which are historically erosional. 1 PARK, J.-Y.; GAYES, P.T., and WELLS, J.T., Monitoring beach renourishment along the sediment-starved shoreline of Grand Strand, South Carolina. Journal of Coastal Research, 25(2), West Palm Beach (Florida), ISSN GNV/2017/081687A/11/1/18 3-4

46 Figure 3-4. Volume Change Using April 2017 and April 2018 Surveys. Positive values indicate accretion, negative values indicate erosion. Note accretion observed throughout most of Holden Beach and spreading of the two 2017 nourishment projects can be observed. The combined nourishment project templates spanned from ~station to ~station The most significant erosion is seen on the East End and in the Town East Reach. The volumes calculated in Figure 3-4 are from the dune out to about the -12 ft National Geodetic Vertical Datum (NGVD) contour, which represents a typical depth-of-closure limit. The vast majority of sand transport and profile change occurs in waters shallower than the depth-of-closure, however, the 2018 survey indicates relatively more significant changes have recently taken place in locations seaward / deeper than the -12 ft contour and therefore these changes will be monitored to assess any potential future volumetric impacts of sediment transport for Holden Beach. Comparing 2017 and 2018 changes in volume out to the depth-of-closure, survey data indicate that mild accretion has generally occurred within the middle of Holden Beach, with more significant accretion observed in the West Area and along the westernmost stations near Shallotte Inlet, likely due to the westward, downdrift spreading Central Reach project GNV/2017/081687A/11/1/18 3-5
47 and Shallotte inlet dynamics. Some mild erosion occurred within the Town West Reach, near the western extent of the 2017 Central Reach project placement, which is an expected response as the material equilibrates and spreads alongshore and this is indicated by the accretion seen in the areas east and west of this location. However, despite equilibration and the lateral movement of material outside of the project template, the shoreline reaches within the Central Reach project area still generally saw accretion. As mentioned previously, this observed accretion may likely in part be due to onshore bar movement of material that was carried offshore due to Hurricane Matthew and this onshore movement was possibly further delayed by the energetic winter (based on NDBC offshore buoy data) taking place in the months just after Matthew, and therefore not apparent in the April 2017 survey. Slight erosion had been observed near the western end of the island over the past few years (reaching as far east as Station ), and fortunately the progression of the Central Reach Project sand is helping to alleviate this. This reach also has a large and wide dune system which can buffer several years of erosion. However, as with any inlet, this area can be susceptible to episodic erosion. Additionally, Shallotte Inlet dredging activities have also been documented to have adverse impacts on Holden Beach shorelines in the past and therefore this area will be monitored for any potential borrow-area related impacts and any continuing erosional patterns. Volume calculations were also performed from the dune to the -5 ft NGVD contour, which represents the approximate typical surf-zone limit. Figure 3-5 presents the two different boundaries used for volume calculations, and illustrates accretion observed downdrift of the Central Reach Project and points out where it appears a new bar has formed and accreted into the depth-of-closure limits. Approximately equal areas of upper beach erosion and accretion occurred at Station as shown in Figure 3-5. GNV/2017/081687A/11/1/18 3-6
 from 2017 to 2018.")
48 Figure 3-5. Two Different Volume Calculation Limits Used for this Analysis: 1) Dune to -12 ft NGVD and 2) Dune to 5 ft NGVD. Table 3-1 presents volume changes estimated by the reaches identified in Figure 3-4 (i.e., east end, Town East Reach, pier, etc.) from 2017 to was observed for most of the beach with an island-wide gain of 440,000 cy. This is a large gain in a year when no nourishments occurred. In general, more erosion (or less accretion) occurred within the dry beach/surf zone area (dune to -5 ft NGVD) compared to the surf zone/depth-of-closure area (-5 ft to -12 ft region). This pattern of cross-shore sediment transport is observed along the profiles shown (Figures 3-2 through 3-5) and is expected as much of the beach is adjusting to equilibrium beach slopes (e.g., nourishment material is predominantly placed landward of MHW with the expectation that natural forces will spread it both laterally and cross-shore). The survey area is not a closed system and identifying sediment transport direction can only be inferred based on measured volume change and experience. Table 3-1. Volume Change by Shoreline Reach for 2017 and 2018 Surveys Reach Averages Stations Included Total Volume Change (CY) (Dune to -12 ft NGVD) Dry Beach/Surf Zone Volume Change (CY) (Dune to -5 ft) Surf Zone/Depth-of- Closure Volume Change (CY) (-5 ft to -12 ft NGVD)* LWF Inlet 5 to 15 15,000 36,000-21,000 USACE East 15 to 40-67,000-29,000-38,000 Town East 40 to , , ,000 Pier 150 to ,000-27,000 77,000 Town West 190 to ,000 3, ,000 West Area 290 to ,000 52,000 86,000 Shallotte Inlet 380 to ,000 73,000 50,000 TOTAL 440,000-32, ,000 Central Reach 40 to , , ,000 *Negative values indicate likely sediment movement from dry beach/surf zone area to surf zone/depth-of-closure GNV/2017/081687A/11/1/18 3-7
49 The observed accretion of material beyond the surf zone depths (-5 ft to -12 ft NGVD), which experienced some of the largest gains in sediment, is a result of both the cross-shore and longshore movement of the nourishment material in addition to accretion from natural onshore movement of sediment that was moved far offshore during Hurricane Matthew. As the net longshore transport of sediment on Holden Beach is from east to west, accretion at all depths is more prominently observed in the western reaches. The USACE East reach overall experienced erosion, however, the LWF Inlet reach is seeing some spreading benefits from the 2017 Town Eastern Reach / USACE LWFIX nourishment. Historical volume changes for the Central Reach (Stations to ) and the Total Holden Beach shoreline, calculated from the dune to the -12 ft NGVD depth-of-closure can be seen in Table 3-2. The most significant volume losses were observed between 2015 and 2016, largely due to a year of higher than normal wave activity as well as Hurricane Joaquin in October Table 3-2. Historic Volume Changes (cy) (Dune to -12 ft NGVD) by Year (where surveys occur in the spring) Reach Averages Central Reach Total Volume Change (cy) * Total Volume Change (cy) Total Volume Change (cy) Total Volume Change (cy) * Total Volume Change (cy) Total Volume Change (cy) -14,000 94,000 62, ,000 1,386, ,000 TOTAL -73, ,000-11, ,000 1,479, ,000 * and show large gains in total volume due to nourishment activities Overall the volume changes in Table 3-2 reveal that Holden Beach has experienced milder than average erosion over the last few years (with the exception of the 2015/2016 time span). Of course nourishment activities have considerably ameliorated conditions along the Holden Beach shoreline, as seen following the 2014 east end nourishment and the recent 2017 nourishments. The 2017 Central Reach Project represents the largest beach renourishment project on Holden Beach to date, and this project along with the 2017 LWFIX east end placement brought a considerable and much needed increase of sediment volume into the littoral system alleviating much of the erosion caused by Hurricane Matthew in the fall of GNV/2017/081687A/11/1/18 3-8
50 Had the Central Reach project not occurred, it is likely that the net volume change would have shown losses similar to if not worse than those observed between 2015 and 2016, given the more direct impacts of Hurricane Matthew compared with Hurricane Joaquin in As such, it can likely be inferred that much of the material lost during Hurricane Matthew may now be moving back closer on shore based on the observed accretion in the Central Reach over the past year (about +231,000 cy) that took place without any nourishment projects. The east end area (Stations 5+00 to 40+00) is historically highly erosional. In general, monitoring stations east of Station can exhibit highly variable changes based on inlet dynamics and USACE fill activities (timing, volume, placement, etc.). Sidecasting and outer inlet maintenance (or lack thereof) also have an effect. Volume change calculations show the east end area exhibited variations of erosion and accretion in the entire dune to the depth-of-closure zone. These changes in volume can be attributed to the 2017 Town/USACE LWFIX east end nourishment and LWF Inlet effects. Several past shoal attachments (documented in previous Annual Reports) have contributed to localized low-tide beach expanses on the east end. These shoal attachments have been estimated to be between 5,000 and 50,000 cubic yards and can provide a significant benefit to the sand (littoral) system. Of course, these shoals can also create erosional hotspots depending on their distance from shore, size, attachment location, etc. The County s previously discussed outer ebb shoal dredging proposal has the potential to detrimentally interrupt this natural shoal migration process. The West Area (Stations to ) is historically stable and has never been nourished but is receiving much of the Central Reach project sand as it migrates westward. The 2018 survey showed the West Area overall accreted about +138,000 cy of material in the dry beach to the depth of closure area (dune to -12 ft), with the majority of accretion (about +86,000 cy) taking place in the surf zone to depth-of-closure area ( -5 ft to 12 ft NGVD). The downdrift benefits to the upper beach areas were most notable in the areas immediately west of the Central Reach Nourishment template, as discussed in the following section. GNV/2017/081687A/11/1/18 3-9
51 Though the West Area has been historically stable and sometimes accretional in the past, the downdrift addition of material is fortunate as this shoreline reach experienced erosion of the dry beach and surf zone (about -81,000 cy) between the 2016 and 2017 surveys, likely as a result of Hurricane Matthew. Fluctuations in volumes in this region can be attributed to net westerly sand transport, shoreline undulations, inlet-related processes (including shoreline orientation/curvature and shoal formation), and extreme storm conditions. Figure 3-5 presents a typical profile of the changes observed within the West Area. Nearshore bar growth and onshore movement of material can be seen in Figure 3-5, and the downdrift/westward spreading of the Central Reach will continue to help mitigate future erosion in the West Area. 3.3 SHORELINE ANALYSIS In addition to a volumetric analysis, shoreline analyses were also performed as another useful metric in gauging beach health. Figure 3-6 was developed to view annual changes in the MHW shoreline contour along Holden Beach. Average MHW shoreline change by reach is presented in Table 3-3. Similar to the volumetric analysis, the MHW shoreline reveals a trend of erosion of the upper beach within the 2017 nourishment templates where equilibration is taking place. The spreading of material is observed in the MHW shoreline changes east and west of the project areas as shown in Figure 3-6. Within the Central Reach, the MHW shoreline eroded by ~47 ft overall which is not unexpected one year following construction and a wide, healthy beach and berm is present throughout the Central Reach (see Figure 3-7). Both Lockwood Folly Inlet and Shallotte Inlet experienced mostly MHW accretion. The MHW shorelines in the western reaches are generally stable to accretional, exhibiting upper beach growth from the movement of Central Reach nourishment material over the past year, primarily between Stations and Stations to were mostly stable and Stations to experienced erosion of the MHW shoreline. Figure 3-8 presents the changes in the MHW position from 2017 to 2018 along the westernmost shorelines of Holden Beach. GNV/2017/081687A/11/1/

52 Figure 3-6. MHW Shoreline Change from 2017 to Equilibration and landward movement of the MHW is observed within nourishment placements and MHW accretion is exhibited to the adjacent shorelines east and west of the nourishment footprint. Erosion is observed near the western end of Holden Beach and both Shallotte and LWF Inlet show accretion of the MHW shoreline. Table 3-3. MHW Shoreline Change by Reach for 2017 and 2018 Surveys 2017 to 2018 MHW Reach Averages Stations Included Change (ft) LWF Inlet 5 to USACE East 15 to Town East 40 to Pier 150 to Town West 190 to West Area 290 to Shallotte Inlet 380 to Central Reach 40 to GNV/2017/081687A/11/1/


53 Figure 3-7. Recent Photograph of Beach Conditions Within Central Reach Project at ~Station , Just East of the Pier (ATM Photo Taken August 2018). More Vulnerable Areas Dune System up to 600 ft wide ~ Stable Recent MHW Some Loss of Dune Vegetation Observed Here Figure 3-8. West End of Holden Beach Features a Very Large, Wide Dune Buffer (2017 aerial shown) (blue) and 2018 (black) mean high water (MHW) shorelines are also shown. GNV/2017/081687A/11/1/
54 Some erosion of the mean high water (MHW) line occurred here over the past year possibly due to more energetic wave conditions and/or inlet related processes. Areas of dune vegetation loss are observed where breaches and damage to the dune system were previously noted following Hurricane Matthew. Fortunately, dune system widths in the West Area can be up to 600 ft (around Stations to ; see Figure 3-8); therefore, large fluctuations in volume and/or shoreline position in this area are still several hundred feet from residential structures. This area will continue to be closely monitored and future efforts to enhance vegetation may be implemented as a proactive measure to mitigate erosion. Several homes on the extreme western end of the island near Station (~1359 OBW) are close enough to Shallotte Inlet that close monitoring of inlet migration and USACE/Ocean Isle activities in Shallotte Inlet is warranted. Note that the most recent Ocean Isle nourishment project was in 2014 while another is scheduled for 2018 or 2019 (SAW ). The Ocean Isle nourishments typically use Shallotte Inlet as a borrow area, and shoreline monitoring will occur to assess any potential effects on the Holden Beach shoreline. Appendix B provides figures of the 2018 survey MHW results for the entire Holden Beach shoreline. The TOD shoreline (7 ft NGVD contour) is shown on Figure 3-9. The TOD shoreline has generally accreted along the majority of the Holden Beach shoreline between the last two survey events. Erosion of the TOD location occurred on the extreme east end, which can likely be attributed to Lockwood Folly Inlet dynamics. Dune loss from Hurricane Matthew in 2016 was documented for the entire beach as well as many nearby beaches immediately following the storm s passing. The reconstruction of these dunes as part of the Central Reach project has helped a significant portion of the shoreline, as seen indicated by the accretional TOD areas in Figure 3-9. GNV/2017/081687A/11/1/

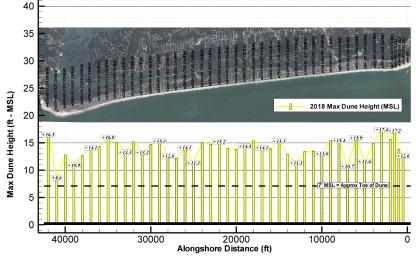
55 Figure 3-9. Toe of Dune (TOD, +7 ft NGVD) Change from 2017 to A mostly accretional beach trend is exhibited, with the highest accretion being observed on the extreme west end near Shallotte Inlet, and erosion observed near LWF Inlet generally in the west area. In general, TOD erosion occurred mainly along the more western portions of Holden Beach (within 1-2 miles of Shallotte Inlet). of the TOD occurred for ~7,000 feet west of the nourishment template indicating beach growth from downdrift spreading of the project, however, this effect tapers off west of Station where more erosion and less accretion was observed between the 2017 and 2018 surveys. Figure 3-10 presents maximum dune heights for each Holden Beach station. Dune heights are generally healthy and some regrowth following the impacts of Hurricane Matthew are reflected in the 2018 survey, especially on the extreme east end and west end. The west end saw some of the most significant reductions in dune heights between the 2016 and 2017 surveys as a result of Matthew related impacts. Despite some erosion of the TOD along this stretch of shoreline observed over the past year in the 2018 survey, dune heights have generally increased since 2017 and the dune system appears to be gradually recovering. Proactive dune enhancements, discussed in Section 2.6, are an important activity related to maintaining a healthy dune system. GNV/2017/081687A/11/1/

 are included in Figure 3-11 for comparison purposes (DCM assigns a minimum")
56 Figure Maximum 2018 Dune Height. Using 7 ft NGVD as the dune base, dunes are generally 5 to 8 high. 3.4 HISTORICAL ANALYSIS Figure 3-11 presents an approximately 18-year MHW shoreline comparison using 2000 and 2018 survey data. The 2000 survey represents a significantly erosional condition. A general accretional trend of 20 to 120 ft is exhibited for the MHW shoreline between 2000 and 2018 (not including the more variable inlet shorelines and east end nourishments). The most recent DCM long-term background erosion rates from 2011 (although they were not officially adopted until 2013) are included in Figure 3-11 for comparison purposes (DCM assigns a minimum long-term erosion of -2 ft/year). DCM 2011 erosion rates consider recent fill activities and, therefore, reflect lower erosion rates. This is a benefit in terms of reduced setback distances for several areas of the island (when compared to the older 2004 DCM erosion rates). GNV/2017/081687A/11/1/
 as the survey data in")

57 Figure MHW Change from 2000 to 2018 Compared to DCM Background Erosion for the Same Period The 2011 DCM erosion rate was converted to the same time span (January 2000 to April 2018) as the survey data in Figure In comparison to DCM long-term erosion rates, the shoreline has generally gained between 55 and 155 ft since the January 2000 survey. Table 3-4 presents average MHW change by reach over the last 18 years. Table 3-4 results show that Town and USACE fill and dune enhancement activities have been successful in combating erosion over the last 18 years and the Central Reach Project was constructed with this goal in mind. As a result of the equilibration and progression of the 2017 nourishment, the Pier exhibits the largest increases in MHW change over the last 18 years, and similarly, the Town East and Town West reaches show large increases as well. The increases within the inlet reaches can be attributed to inlet dynamics and channel maintenance activities. The West Area is the only reach of shoreline where actual long-term change (over the last 18 years) is worse than the extrapolated DCM long-term erosion. GNV/2017/081687A/11/1/
58 Table 3-4. Historical MHW Shoreline Change by Reach (2000 to 2018) Reach Averages Stations Included Historical MHW Change (2000 to 2018) (ft) LWF Inlet 5 to USACE East 15 to Town East 40 to Pier 150 to Town West 190 to West Area 290 to Shallotte Inlet 380 to Central Reach 40 to OAK ISLAND TRANSECTS The Town of Holden Beach has been collecting additional survey data on the western end of Oak Island to establish baseline conditions for this area. Additionally, because regional sediment transport is from east to west in this area, any changes in this area have the potential to affect Holden Beach shorelines (i.e., downdrift ). Surveying was needed because Oak Island only performed annual surveys down to the mean low water from 1998 to 2013, which are not sufficient to completely capture sediment movement. More recently, Oak Island has conducted some surveys to depth-of-closure but not on a consistent annual basis. Oak Island monitoring transects are shown in Figure As with the Holden Beach inlet transects, the Oak Island inlet transects 1 through 4 (i.e., not shoreline perpendicular) are excluded from some volume calculations. The west end of Oak Island has more development closer to the active beach than the west end of Holden Beach (where the dune system is up to 600 feet wide) and, therefore, is more vulnerable to short-term erosional episodes (both west ends are stable/accretional in the long term). Tables 3-5 and 3-6 present volume and MHW change for the Oak Island transects since the spring 2012 survey. Similar to the inlet-influenced transects on the west end of Holden Beach, large variation is typically exhibited for Oak Transects 1 through 4. Oak Transects 5 and 6 are transitional (i.e., partially inlet-influenced), while Oak Transect 7 is generally removed from inlet effects and has historically shown less variability and more stability. As Figure 3-12 shows, Oak GNV/2017/081687A/11/1/
.")
59 Transects 5, 6, and 7 were subject to some erosion of the MHW shoreline over the last year, however, overall these transects generally did show volumetric accretion (see Table 3-5). This is likely due to inlet effects, and sediment movement from a 2015 beach nourishment project (discussed in the following paragraph) Beach Nourishment Site Oak 1 Oak 2 Oak 3 Oak 4 Oak 5 Oak 6 Oak 7 Figure Oak Island Transects with 2017 MHW (blue) and 2018 MHW (black) Lines shown on a 2017 Aerial. Oak 2 and Oak 3 transects begin at the same location as Oak 1. Table 3-5. Oak Island Transect Volume Analysis from 2017 to 2018 Station Distance to Next Monument (ft) Volume Change (cy/ft) (Dune to -12 ft*) Volume Change (cy/ft) (Dune to -5 ft) Notes Oak LWF Inlet Oak LWF Inlet Oak LWF Inlet Oak LWF Inlet Shoulder Oak Oceanfront Oak Oceanfront Oak Oceanfront GNV/2017/081687A/11/1/
60 Table 3-6. Oak Island Transect MHW Change Transect MHW Change (ft) MHW Change (ft) MHW Change (ft) MHW Change (ft) MHW Change (ft) MHW Change (ft) Oak Notes Oak Channel Shoaling Oak Oak Oak Oak Oak Nourishment 2015 Nourishment The most recent nourishment to the west end of Oak Island was completed by the Town of Oak Island completed in April of Construction for this project, named the Eastern Channel Dredging/Beach Nourishment Project, began in March The project included dredging of the Eastern Channel from LWF Inlet to Horse Island and placing approximately 180,000 cy of sediment on the west end of Oak Island (Figure 3-13) along ~4,500 feet of shoreline (~40 cy/ft). Possibly some westward spreading benefits can still be seen in the MHW increases for Transect 3 and 4 between the 2017 and 2018 surveys (Figure 3-12 and Table 3-6). Another Oak Island west end nourishment project is slated to begin this upcoming winter 2018 / spring 2019 as part of the USACE LWFIX Inlet dredging that in the past has been used to replenish the habitually eroding east end of Holden Beach, and has relied on regular renourishments for the past. Figure 3-14 presents the proposed placement location for an estimated 88,000 cy. Town staff and ATM will continue to follow upcoming nourishments and shoreline changes along the western end of Oak Island, as it has the potential to affect LWF Inlet and Holden Beach. GNV/2017/081687A/11/1/
.")

61 Oak 5 Oak 6 Oak 7 Figure Eastern Channel Dredging/Beach Nourishment Project Overview. (From February 10, 2015 Town of Oak Island Council Meeting with Moffatt & Nichol). Oak Transect 5, 6 and 7 (which are surveyed by Holden Beach) are included for reference. Figure USACE LWFIX Dredging and Beach Placement Schematic (source USACE request for proposal). GNV/2017/081687A/11/1/
62 4.0 SUMMARY The Holden Beach shoreline has historically exhibited moderate erosion rates (with the exception of the inlets). As a result, the Town has instituted a nourishment and beach management program to offset this erosion. Dating back to January 2000 (approximately 18 years), the Town and the USACE have placed an average of approximately 200,000 cy/year on the beach. This rate of sand placement has been effective at keeping pace with background erosion. Holden Beach suffered significant erosion and damage to the upper beach and dune systems from Hurricane Matthew in October Similar to engineered beach mitigation projects following Hurricanes Hanna (2008) and Irene (2011), FEMA assistance was implemented following Matthew, and helped reimburse the cost of 131,000 cy included in the Central Reach Project. In addition to 131,000 cy of Matthew erosion mitigation, FEMA also participated in dredge mobilization/demobilization and dune fencing/vegetation costs. Fortunately, this past year (mid-2017 to mid-2018) was relatively mild in terms of extreme weather events and the beach has experienced some recovery while the newly constructed dunes and vegetation are establishing well (although Hurricanes Florence and Michael have recently setback this process). The majority of shoreline has benefitted from the equilibration of the substantial nourishments of the 2017 Central Reach Project and the LWFIX / Town Eastern Reach Project, which helped restore and widen significant portions of beachfront. The most recent annual shoreline survey occurred in April In comparing this survey to the April 2017 survey, the entire island experienced a net gain of approximately 440,000 cy. This gain was unexpected since no nourishment activities has occurred over this time. This gain is due to onshore movement of material from deeper water (>12 feet) and represents a recovery from Hurricane Matthew erosion. The Central Reach Project and the LWFIX Eastern Reach Project brought a much-needed addition of material into the Holden Beach littoral system in The equilibration and both eastward and westward spreading of this material was observed contributing to beach growth for much of the Holden Beach shoreline as well. GNV/2017/081687A/11/1/18 4-1
63 Historical annual losses have been documented at about 100,000 to 200,000 cy/year for Holden Beach and the losses from Hurricane Matthew alone in 2016 were right on par with this erosional trend. This past year indicates a recovering, accretional beach as sand carried offshore during Matthew appears to now be migrating shoreward, contributing to added volumes observed in the nearshore. Additionally, the two 2017 nourishment projects came at a very valuable time to offset the erosion of Hurricane Matthew and future beach surveys will continue to monitor the progress, equilibration, and spreading of these nourishments. From a shoreline contour perspective, the center ~5 miles of island (Central Reach STA to ) exhibited an average MHW erosion of -47 ft between surveys. This upper beach loss is not unexpected as the 2017 nourishment sand continues to equilibrate from a constructed profile to a natural profile. The MHW erosion indicating this movement was most notable for the stations within the project footprint and in general MHW accretion was observed to both the east and west due to spreading effects. The toe-of-dune (TOD) line within the Central Reach was generally much more accretional and exhibited an average accretion of approximately 14 ft, largely due to the establishment and growth of the starter dunes constructed as part of the Central Reach Project. Significant sand fencing and dune vegetation planting occurred following the nourishment projects which have helped mature and enhance these dunes over the past year. More prominent accretion of the TOD was observed along the far west end and near Shallotte Inlet. Erosion of the TOD line and MHW shoreline occurred in the West Area. This area features a wide dune buffer and did experience a net gain in sand based on the volumetric analyses. Although this portion of shoreline has historically been stable to accretional, it has been mostly erosional in recent years warranting close monitoring and proactive measures may be recommended (such as dune enhancement through mature vegetation plantings) to mitigate potential future concerns. In comparing the April 2018 survey with the January 2000 survey (18-year span), the MHW shoreline exhibits approximately 120 ft of accretion, in part due to the recent 2017 largescale nourishment activities. The Central Reach Project and other future planned projects of this scale are designed to enhance the beach and dune system which will result in protective, ecological, recreational, and economic benefits. GNV/2017/081687A/11/1/18 4-2
64 The Central Reach nourishment project, completed in March of 2017, represents the largest nourishment project on Holden Beach (approximately twice the size of the USACE 933 project). The purpose of the project, which is a component of the Town s comprehensive beach management program, is to provide beach restoration along eroding sections of shoreline sufficient to maintain the island s restored protective and recreational beachfront and natural dune system. The 2018 survey represents the one-year post-project survey of the nourishment, and continued monitoring will assess the equilibration and movement of the project sand. The 2017 LWFIX / Town Eastern Reach Project was similar to the 2014 piggyback project, and it came at an opportune time to supplement the Central Reach nourishment. Due to the close proximity to LWF Inlet, the east end is relatively dynamic and some erosional hotspots have been observed over the years. The 2018 survey showed that the additional 120,000 cy from the Eastern Reach Project has created a wide recreational beach and storm buffer to abate future erosion along this stretch of shoreline. It is recommended that the Town continue to evaluate the potential piggybacking and/or use of the 400-ft bend widener for any future USACE LWFIX projects that do not fully utilize the LWFIX borrow area (which is expected to happen most of the time due to USACE funding limitations). The NCDEQ Shallow Draft Inlet (SDI) program has provided the Town with permits to dredge the inner and outer portions of LWF Inlet. These permits essentially allow the Town, with potential help from the County and State, to perform the same inlet maintenance activities that the USACE currently performs (i.e., LWFIX dredging, outer channel sidecasting). The State has established an annual funding source for these projects with the new State Shallow Draft Navigation Channel and Aquatic Weed Fund, which has shown growth and stability since its inception. In summary, the 2016 North Carolina Beaches and Inlets Management Plan (NC BIMP) report estimated the 2013/2014 Beach Recreation Annual Total Impact Output for Holden Beach at $80.4 million, which accounted for 942 jobs. Additionally, the NC BIMP conducted a study of losses attributed to 50 percent beach width loss and found that, for Holden GNV/2017/081687A/11/1/18 4-3
65 Beach, the 2013/2014 estimated annual loss (including output/sales/business activity) would be $12.6 million. The Town s beach management and maintenance program strives to maintain and enhance this important economic and environmental benefit. Recommendations for future and ongoing beach management activities include: Continue annual island-wide monitoring with beach profiles Continue research into new potential borrow areas for large-scale nourishment projects Continue to coordinate with USACE and NCDEQ on future outer LWF Inlet channel sidecast/hopper dredging and nearshore sand placement Continue coordination and support of the State s SDI program and quarterly SDI MOA meetings held by the USACE and NCDEQ/NCDWR (regarding LWFIX, etc.) Continue proactive dune enhancement activities (planting, fertilizing, fencing, etc.). Work closely with Congressional representatives to assure continued support of future USACE nourishment projects for Holden Beach Extend DCM permits to match USACE permit expiration deadlines Specific needs in regard to ongoing beach management in the near future are related to 1) Oak Island receiving LWFIX sand that has traditionally been placed on Holden s east end, 2) Brunswick County s proposal to dredge the LWF outer ebb shoal and 3) the research and location of another offshore borrow area. The Town of Holden Beach worked proactively with the USACE to maximize the use of the LWFIX borrow area and bend-widener, even before shallow-draft dredging funds were available from the state. With the state shallow-draft dredging fund now available, Oak Island and Brunswick County have expressed increased interest in using LWF Inlet sand resources. Holden Beach is the downdrift beach to LWF Inlet, therefore the east end of Holden Beach is the most affected and most vulnerable to LWF Inlet processes (including any man-made changes to this system). Town and ATM staff will continue to actively engage in these projects and monitor their potential effects. The Offshore Borrow Area of the Central Reach project was delineated based on the need for enough sand for at least 2 nourishments. Following the 2017 Central Reach project, it is GNV/2017/081687A/11/1/18 4-4
66 estimated that at least 500,000 cy of material is still available for future nourishments however it is recommended that additional offshore borrow area reconnaissance occurs. Especially since the Town of Oak Island has expressed an interest in using the Central Reach offshore borrow area. GNV/2017/081687A/11/1/18 4-5
67 Appendix A Station Profile Analysis
68 APPENDIX A ELEVATION PROFILE TRANSECTS Survey Stationing Figure. Profile Transect Stationing shown in white and actual survey points shown with color legend on above figure. Plots below are from east (Lockwoods Folly Inlet) to west (Shallotte Inlet). Profile plots are zoomed in to nearshore area (typically from the dune to ~-20ft NGVD depth). Oak Island Transects are at the end of the section. Note Z is in ft-ngvd29. Zoomed in to eastern half of island (station is to the far left and just east of the pier). Note Z is in ft-ngvd29. Please Note: In the following cross sections, the Station Number is shown at the center top of the figure. Any notable features are described in call-outs or in blue below the figure. CHS/2018/ A-1
69 Dune Oak Island Intertidal Erosion Lockwoods Folly Inlet Channel Station (far east). Plots typically show from dune (between ~7 and ~15 NGVD) out to ~-20 NGVD. MHW=Mean high water, MLW=mean low water. LWF Inlet Channel appears relatively stable but some filling in of sand and channel widening is observed since the 2017 survey. Dune Upper Beach ~Stable Lockwoods Folly Inlet Channel Station Upper and Intertidal beach showing accretion. LWF Inlet Channel appears relatively stable but some filling in of sand is observed as the channel has become more shallow since the 2017 survey. CHS/2018/ A-2
70 Dune Lockwoods Folly Inlet Channel Station LWF Inlet Channel Approximately 800 ft from baseline. Upper beach accretion and accretion below MLW into the LWF Inlet Channel is seen. Channel is filling in since 2017 survey. Erosion Station Some significant upper beach accretion and intertidal erosion is seen and areas of accretion and erosion are observed moving offshore. CHS/2018/ A-3
71 Erosion Station Intertidal erosion of the shoreline has taken place and some significant intertidal and nearshore deposition is observed. Upper Beach Erosion Upper Beach Erosion Shoal Erosion Station Note some upper beach erosion and shoal movement into the offshore since 2017 survey. CHS/2018/ A-4
72 Town/LWFIX Beach Fill Equilibration Erosion Town/LWFIX Beach Fill Equilibration Station Upper beach and intertidal erosion and accretion into the nearshore below MLW is observed as the Town/LWFIX Beach Nourishment approaches an equilibrium beach profile. CHS/2018/ A-5
73 Central Reach Nourishment (~East Taper) Equilibration Station Note equilibration of the Central Reach Nourishment material observed since 2017 survey as some upper beach sand has moved into the nearshore and spread alongshore to the east and west as well. The Central Reach Nourishment Project was completed in early Sand placement extended from ~500 ft east of Station to ~Station Upper Beach Beach Fill Equilibration Station survey shows some vertical berm growth since the placement of the Central Reach Nourishment beach fill. CHS/2018/ A-6
74 Beach Fill Equilibration Berm Growth Beach Fill Equilibration Station Note nearshore accretion below MLW, due to cross-shore and longshore/downdrift movement of 2017 nourishment sand. Berm Growth Beach Fill Equilibration CHS/2018/ A-7
75 Growth of Starter Dune Beach Fill Equilibration Beach Fill Equilibration ~Stable CHS/2018/ A-8
76 Dune and Berm Growth Beach Fill Equilibration Minor Upper Beach Beach Fill Equilibration Upper Beach Berm Growth Beach Fill Equilibration CHS/2018/ A-9
77 Berm Growth Beach Fill Equilibration Beach Fill Equilibration Beach Fill Equilibration Nearshore CHS/2018/ A-10
78 Zoom in of western end (Station near the pier to Station at Shallotte Inlet). Note Z is in ft-ngvd29. Beach Fill Equilibration CHS/2018/ A-11
79 Beach Fill Equilibration Beach Fill Equilibration Beach Fill Equilibration ~Stable CHS/2018/ A-12
80 ~Stable Beach Fill Equilibration Beach Fill Equilibration ~Stable Minor Beach Fill Equilibration Minor CHS/2018/ A-13
81 Central Reach Nourishment (~West Taper) Beach Fill Equilibration Upper Beach. Westward Spreading of Central Reach Nourishment Nearshore ~Stable Station survey shows the benefits of some downdrift spreading of the 2017 Central Reach Project outside of the original fill template placement. CHS/2018/ A-14
82 ~Stable Upper Beach. Westward Spreading of Central Reach Nourishment ~Stable Dry Beach Nearshore Offshore CHS/2018/ A-15
83 ~Stable Erosion Dry Beach Minor Erosion Bar Formation Movement Station survey shows observed benefits of downdrift spreading of nourishment sand as well as accretion observed in the offshore as new sandbars are forming and appear to be moving onshore. This is likely due to the relatively mild conditions observed over the past year allowing nearshore sand lost during Hurricane Matthew to now make its way back into the nearshore. CHS/2018/ A-16
84 Dry Beach Station survey shows a generally stable beach profile with some upper beach accretion, likely due to downdrift spreading of nourishment material. Nearshore ~Stable CHS/2018/ A-17
85 - Bar Formation Nearshore Dry Beach - Bar Formation Erosion Dry Beach ~Stable - Bar Formation CHS/2018/ A-18
86 Dune and Upper Beach Erosion ~Stable Erosion Nearshore Bar Formation ~Stable Bar Movement Nearshore Erosion CHS/2018/ A-19
87 Bar Growth and Onshore Movement Station survey shows some significant upper beach growth and onshore movement of a sand bar since Shallotte Inlet Channel CHS/2018/ A-20
88 Shoal Movement Shoal Growth Erosion Shallotte Inlet Channel Station Erosion is seen on the Holden Beach side of the Shallotte Inlet Channel. Channel appears to be migrating towards Holden Beach. Oak Island Transects CHS/2018/ A-21
89 OAK- 1 Erosion Lockwoods Folly Inlet Channel Station OAK- 1. The dune system is relatively healthy but some significant erosion is seen in the intertidal and nearshore zones. Similar to Station , a widening of the LWF Inlet Channel is observed since the 2017 survey, and may indicate the channel is migrating east towards Oak Island. OAK- 2 LWF Inlet Channel Station OAK- 2. Some upper beach accretion is observed. The 2018 survey generally shows stable nearshore beach and inlet depths at this location. CHS/2018/ A-22
90 OAK-3 ~Stable OAK- 4 Erosion OAK- 5 Erosion ~Stable Station OAK- 5. Note the 2018 survey shows a general cross-shore sediment transport pattern as variable erosion and accretion are seen in the upper beach, intertidal area, and nearshore surf zone. CHS/2018/ A-23
91 OAK- 6 Erosion Nearshore OAK- 7 Erosion CHS/2018/ A-24
92 TABLE A-1: 2017 to 2018 Survey Transect Analysis General Note - Transects are primarily oceanfront perpendicular and parallel except for inlets and inlet shoulder transects Unit Volume (cy/ft) changes at inlet and inlet shoulder transects cannot use "average end" method for calculating volumes MHW change at inlet and inlet shoulder is not necessarily perpendicular to the shoreline due to variable orientation *all elevations relative to NGVD29 STATION Distance to Next Monument (ft) 2017 to 2018 Survey Analysis Volume Change (cy/ft) (Dune to -12 ft*) Volume Change (cy/ft) (Dune to -5 ft) MHW Change (ft) LWF Inlet LWF Inlet LWF Inlet Notes LWF Inlet Shoulder LWF Inlet Shoulder LWF Inlet Shoulder Oceanfront Perpendicular CHS/2018/ A-25
93 Oceanfront perpendicular Shallotte Inlet Shoulder Shallotte Inlet Shallotte Inlet OAK ISLAND TRANSECTS OAK LWF Inlet OAK LWF Inlet OAK LWF Inlet OAK LWF Inlet Shoulder OAK Oceanfront perpendicular OAK OAK CHS/2018/ A-26
 to west (Shallotte Inlet). Profile plots are zoomed in to nearshore area (typically from the dune to ~-20ft NGVD depth).")

94 APPENDIX A ELEVATION PROFILE TRANSECTS Survey Stationing Figure. Profile Transect Stationing shown in white and actual survey points shown with color legend on above figure. Plots below are from east (Lockwoods Folly Inlet) to west (Shallotte Inlet). Profile plots are zoomed in to nearshore area (typically from the dune to ~-20ft NGVD depth). Oak Island Transects are at the end of the section. Note Z is in ft-ngvd29. Zoomed in to eastern half of island (station is to the far left and just east of the pier). Note Z is in ft-ngvd29. Please Note: In the following cross sections, the Station Number is shown at the center top of the figure. Any notable features are described in call-outs or in blue below the figure. CHS/2018/ A-1
95 Dune Oak Island Intertidal Erosion Lockwoods Folly Inlet Channel Station (far east). Plots typically show from dune (between ~7 and ~15 NGVD) out to ~-20 NGVD. MHW=Mean high water, MLW=mean low water. LWF Inlet Channel appears relatively stable but some filling in of sand and channel widening is observed since the 2017 survey. Dune Upper Beach ~Stable Lockwoods Folly Inlet Channel Station Upper and Intertidal beach showing accretion. LWF Inlet Channel appears relatively stable but some filling in of sand is observed as the channel has become more shallow since the 2017 survey. CHS/2018/ A-2
96 Dune Lockwoods Folly Inlet Channel Station LWF Inlet Channel Approximately 800 ft from baseline. Upper beach accretion and accretion below MLW into the LWF Inlet Channel is seen. Channel is filling in since 2017 survey. Erosion Station Some significant upper beach accretion and intertidal erosion is seen and areas of accretion and erosion are observed moving offshore. CHS/2018/ A-3
97 Erosion Station Intertidal erosion of the shoreline has taken place and some significant intertidal and nearshore deposition is observed. Upper Beach Erosion Upper Beach Erosion Shoal Erosion Station Note some upper beach erosion and shoal movement into the offshore since 2017 survey. CHS/2018/ A-4
98 Town/LWFIX Beach Fill Equilibration Erosion Town/LWFIX Beach Fill Equilibration Station Upper beach and intertidal erosion and accretion into the nearshore below MLW is observed as the Town/LWFIX Beach Nourishment approaches an equilibrium beach profile. CHS/2018/ A-5
99 Central Reach Nourishment (~East Taper) Equilibration Station Note equilibration of the Central Reach Nourishment material observed since 2017 survey as some upper beach sand has moved into the nearshore and spread alongshore to the east and west as well. The Central Reach Nourishment Project was completed in early Sand placement extended from ~500 ft east of Station to ~Station Upper Beach Beach Fill Equilibration Station survey shows some vertical berm growth since the placement of the Central Reach Nourishment beach fill. CHS/2018/ A-6
100 Beach Fill Equilibration Berm Growth Beach Fill Equilibration Station Note nearshore accretion below MLW, due to cross-shore and longshore/downdrift movement of 2017 nourishment sand. Berm Growth Beach Fill Equilibration CHS/2018/ A-7
101 Growth of Starter Dune Beach Fill Equilibration Beach Fill Equilibration ~Stable CHS/2018/ A-8
102 Dune and Berm Growth Beach Fill Equilibration Minor Upper Beach Beach Fill Equilibration Upper Beach Berm Growth Beach Fill Equilibration CHS/2018/ A-9
103 Berm Growth Beach Fill Equilibration Beach Fill Equilibration Beach Fill Equilibration Nearshore CHS/2018/ A-10
. Note Z is in ft-ngvd29.")
104 Zoom in of western end (Station near the pier to Station at Shallotte Inlet). Note Z is in ft-ngvd29. Beach Fill Equilibration CHS/2018/ A-11
105 Beach Fill Equilibration Beach Fill Equilibration Beach Fill Equilibration ~Stable CHS/2018/ A-12
106 ~Stable Beach Fill Equilibration Beach Fill Equilibration ~Stable Minor Beach Fill Equilibration Minor CHS/2018/ A-13
107 Central Reach Nourishment (~West Taper) Beach Fill Equilibration Upper Beach. Westward Spreading of Central Reach Nourishment Nearshore ~Stable Station survey shows the benefits of some downdrift spreading of the 2017 Central Reach Project outside of the original fill template placement. CHS/2018/ A-14
108 ~Stable Upper Beach. Westward Spreading of Central Reach Nourishment ~Stable Dry Beach Nearshore Offshore CHS/2018/ A-15
109 ~Stable Erosion Dry Beach Minor Erosion Bar Formation Movement Station survey shows observed benefits of downdrift spreading of nourishment sand as well as accretion observed in the offshore as new sandbars are forming and appear to be moving onshore. This is likely due to the relatively mild conditions observed over the past year allowing nearshore sand lost during Hurricane Matthew to now make its way back into the nearshore. CHS/2018/ A-16
110 Dry Beach Station survey shows a generally stable beach profile with some upper beach accretion, likely due to downdrift spreading of nourishment material. Nearshore ~Stable CHS/2018/ A-17
111 - Bar Formation Nearshore Dry Beach - Bar Formation Erosion Dry Beach ~Stable - Bar Formation CHS/2018/ A-18
112 Dune and Upper Beach Erosion ~Stable Erosion Nearshore Bar Formation ~Stable Bar Movement Nearshore Erosion CHS/2018/ A-19
113 Bar Growth and Onshore Movement Station survey shows some significant upper beach growth and onshore movement of a sand bar since Shallotte Inlet Channel CHS/2018/ A-20

114 Shoal Movement Shoal Growth Erosion Shallotte Inlet Channel Station Erosion is seen on the Holden Beach side of the Shallotte Inlet Channel. Channel appears to be migrating towards Holden Beach. Oak Island Transects CHS/2018/ A-21
115 OAK- 1 Erosion Lockwoods Folly Inlet Channel Station OAK- 1. The dune system is relatively healthy but some significant erosion is seen in the intertidal and nearshore zones. Similar to Station , a widening of the LWF Inlet Channel is observed since the 2017 survey, and may indicate the channel is migrating east towards Oak Island. OAK- 2 LWF Inlet Channel Station OAK- 2. Some upper beach accretion is observed. The 2018 survey generally shows stable nearshore beach and inlet depths at this location. CHS/2018/ A-22
116 OAK-3 ~Stable OAK- 4 Erosion OAK- 5 Erosion ~Stable Station OAK- 5. Note the 2018 survey shows a general cross-shore sediment transport pattern as variable erosion and accretion are seen in the upper beach, intertidal area, and nearshore surf zone. CHS/2018/ A-23
117 OAK- 6 Erosion Nearshore OAK- 7 Erosion CHS/2018/ A-24
118 TABLE A-1: 2017 to 2018 Survey Transect Analysis General Note - Transects are primarily oceanfront perpendicular and parallel except for inlets and inlet shoulder transects Unit Volume (cy/ft) changes at inlet and inlet shoulder transects cannot use "average end" method for calculating volumes MHW change at inlet and inlet shoulder is not necessarily perpendicular to the shoreline due to variable orientation *all elevations relative to NGVD29 STATION Distance to Next Monument (ft) 2017 to 2018 Survey Analysis Volume Change (cy/ft) (Dune to -12 ft*) Volume Change (cy/ft) (Dune to -5 ft) MHW Change (ft) LWF Inlet LWF Inlet LWF Inlet Notes LWF Inlet Shoulder LWF Inlet Shoulder LWF Inlet Shoulder Oceanfront Perpendicular CHS/2018/ A-25
119 Oceanfront perpendicular Shallotte Inlet Shoulder Shallotte Inlet Shallotte Inlet OAK ISLAND TRANSECTS OAK LWF Inlet OAK LWF Inlet OAK LWF Inlet OAK LWF Inlet Shoulder OAK Oceanfront perpendicular OAK OAK CHS/2018/ A-26
120 Appendix B 2018 Survey Plan View Figures
121 MHW (358 SL) (348 SL) (336 SL) (344 OBE) Oak M HW _MHW ft_ngvd ,000 Feet 2, _MHW April_2018survey_ngvd Legend MHW FIGURE B Survey Data and Established Monitoring Transects Shown Mean High Water (MHW) Shoreline, 2017 MHW Shoreline, and 2000 MHW Shoreline (306 OBE) (264 OBE) 6 Oak (226 OBE) (148 OBE) (114 OBE) (184 OBE).
122 (114 OBE) Legend 2018_MHW _MHW 2000 MHW ft_ngvd ,000 Feet 2, April_2018survey_ngvd (121 OBW) (157 OBW) (197 OBW) (279 OBW) (311 OBW) (347 OBW) W M H FIGURE B Survey Data and Established Monitoring Transects Shown Mean High Water (MHW) Shoreline, 2017 MHW Shoreline, and 2000 MHW Shoreline (385 OBW) (427 OBW) (457 OBW) (507 OBW) (241 OBW).
123 (545 OBW) (585 OBW) (672 OBW) (667 OBW) Legend _MHW MHW -28 ft_ngvd ,000 Feet 2, April_2018survey_ngvd _MHW (705 OBW) (745 OBW) (785 OBW) W M H FIGURE B Survey Data and Established Monitoring Transects Shown Mean High Water (MHW) Shoreline, 2017 MHW Shoreline, and 2000 MHW Shoreline (825 OBW) (867 OBW) (907 OBW) (949 OBW) (507 OBW).
124 _MHW _MHW 2000 MHW 500 1,000 Feet 2, April_2018survey_ngvd29 ft_ngvd Legend (949 OBW) (987 OBW) (1027 OBW) (1067 OBW) (1109 OBW) M HW (1151 OBW) (1193 OBW) (1225 OBW) (1255 OBW) (1281 OBW) FIGURE B Survey Data and Established Monitoring Transects Shown Mean High Water (MHW) Shoreline, 2017 MHW Shoreline, and 2000 MHW Shoreline (1311 OBW) (1337 OBW) (1359 OBW).
125 Oak W M H ,000 Feet April_2018survey_ngvd29-26 ft_ngvd29 2, _MHW _MHW Legend MHW Oak FIGURE B Survey Data and Established Monitoring Transects Shown Mean High Water (MHW) Shoreline, 2017 MHW Shoreline, and 2000 MHW Shoreline Oak 4-4 Oak 6. Oak 1-11
126 Legend USACE March 2018 Survey (MLLW) -23 Feet, MLLW Elevation (1337 OBW) (1359 OBW) (1311 OBW) MH W Shoal area in 2018 survey Legend _MHW 2017_MHW 2000 MHW -5 April_2018survey_ngvd29 ft_ngvd , Feet , FIGURE B Survey Data and recent USACE Shallotte Inlet survey data (March 2018)


127 W. Legend USACE Feb 2018 Survey (MLLW) MH Observed Shoal area in 2018 survey Feet ft_ngvd , April_2018survey_ngvd , MHW -3-4 W 2017_MHW MH 2018_MHW Legend FIGURE B Survey Data and recent USACE Lockwood Folly Inlet survey data (February 2018) Oak Oak 4 Oak Elevation (358 SL) (348 SL) (336 SL) (344 OBE) Feet, MLLW
RE: Hurricane Matthew Beach Damage Assessment and Recommendations [CSE 2416]
![RE: Hurricane Matthew Beach Damage Assessment and Recommendations [CSE 2416]](/thumbs/83/87675702.jpg "RE: Hurricane Matthew Beach Damage Assessment and Recommendations [CSE 2416]") October 25, 2016 Iris Hill Town Administrator Town of Edisto Beach 2414 Murray St Edisto Beach SC 29438 RE: Hurricane Matthew Beach Damage Assessment and Recommendations [CSE 2416] Dear Iris, Hurricane
October 25, 2016 Iris Hill Town Administrator Town of Edisto Beach 2414 Murray St Edisto Beach SC 29438 RE: Hurricane Matthew Beach Damage Assessment and Recommendations [CSE 2416] Dear Iris, Hurricane
Coastal Hazards and Management in North Carolina. Braxton Davis April 14, 2015
 Coastal Hazards and Management in North Carolina Braxton Davis April 14, 2015 Coastal Facts and Figures 320 miles of ocean beaches 12,000+ miles of estuarine shoreline 2 million + acres of sounds, creeks,
Inlet Management Study for Pass-A-Grille and Bunces Pass, Pinellas County, Florida
 Inlet Management Study for Pass-A-Grille and Bunces Pass, Pinellas County, Florida Final Report Submitted By Ping Wang, Ph.D., Jun Cheng Ph.D., Zachary Westfall, and Mathieu Vallee Coastal Research Laboratory
2018 Beach Preservation Project Information
 QUICK FACTS Beach Renourishment to begin late April 2018 o U.S. Army Corps of Engineers project o Project Area: 8 th St. E. to end of E. Ashley Ave. o Project Length: 2 miles o Cost: $10,900,000 o Funding:
FINAL ENVIRONMENTAL IMPACT STATEMENT ON BROWARD COUNTY SHORE PROTECTION PROJECT SEGMENTS II AND III BROWARD COUNTY, FLORIDA
 FINAL ENVIRONMENTAL IMPACT STATEMENT ON BROWARD COUNTY SHORE PROTECTION PROJECT SEGMENTS II AND III BROWARD COUNTY, FLORIDA 1. PROJECT PURPOSE AND NEED 1.1. PROJECT AUTHORITY. 1.1.1. INITIAL AUTHORIZATION.
MOREHEAD CITY HARBOR, NC. Dredged Material Management Plan (DMMP)
") MOREHEAD CITY HARBOR, NC Dredged Material Management Plan (DMMP) Public Meeting/Info Session 15 January 2014 US Army Corps of Engineers Morehead City Harbor DMMP Presentation Topics Morehead City Harbor
MOREHEAD CITY HARBOR, NC Dredged Material Management Plan (DMMP) Public Meeting/Info Session 15 January 2014 US Army Corps of Engineers Morehead City Harbor DMMP Presentation Topics Morehead City Harbor
CORPS ON THE COAST. North Carolina Coastal Conference Coastal Infrastructure Raleigh, NC April 14, Jim Medlock Chief, Programs Management Branch
 CORPS ON THE COAST North Carolina Coastal Conference Coastal Infrastructure Raleigh, NC April 14, 2015 Jim Medlock Chief, Programs Management Branch US Army Corps of Engineers OVERVIEW What Are The Corps
Assateague Island National Seashore North End Restoration Project Timeline
 Assateague Island National Seashore North End Restoration Project Timeline Date Event Some information provided in the Project Introduction document. Detailed events are available in a timeline compiled
KEYNOTE PRESENTATION FSBPA olsen
 AMELIA ISAND, FLORIDA BEACH MANAGEMENT PARTNERING AND PERSERVERENCE Erik Olsen, PE associates, inc. KEYNOTE PRESENTATION FSBPA 2009 IN ORDER TO ADDRESS SHORE PROTECTION TODAY LOCAL INTERESTS PARTNER WITH:
Building Beaches with Navigation Sand, Just Don t Forget the Dunes!!
 Building Beaches with Navigation Sand, Just Don t Forget the Dunes!! Ken Willson Kenneth.Willson@CBI.com Introduction Decrease in Federal Funding (Shallow Draft Navigation Maintenance and Shore Protection)
Long Term Success and Future Approach of the Captiva and Sanibel Islands Beach Renourishment Program
 2017 National Conference on Beach Preservation Technology February 8-10, 2017; Stuart, Florida Long Term Success and Future Approach of the Captiva and Sanibel Islands Beach Renourishment Program Thomas
Dauphin Island East End Beach and Barrier Island Restoration Project. Beau Buhring South Coast Engineers
 Dauphin Island East End Beach and Barrier Island Restoration Project Beau Buhring South Coast Engineers Funding Funded with qualified outer continental shelf oil and gas revenues by the Coastal Impact
EVALUATION OF BEACH EROSION UP-DRIFT OF TIDAL INLETS IN SOUTHWEST AND CENTRAL FLORIDA, USA. Mohamed A. Dabees 1 and Brett D.
 EVALUATION OF BEACH EROSION UP-DRIFT OF TIDAL INLETS IN SOUTHWEST AND CENTRAL FLORIDA, USA Mohamed A. Dabees 1 and Brett D. Moore 1 The paper discusses the analysis of up-drift beach erosion near selected
ST. JOSEPH PENINSULA, GULF COUNTY, FLORIDA Beach Re-Nourishment and Environmental Enhancement Project RECOMMENDATIONS
 ST. JOSEPH PENINSULA, GULF COUNTY, FLORIDA Beach Re-Nourishment and Environmental Enhancement Project RECOMMENDATIONS January 23, 2018 543 Harbor Boulevard, Suite 204 Destin, Florida 32541 850.654.1555
Protecting our Beaches
 Protecting our Beaches South Amelia Island Shore Stabilization Project Nassau County, FL Mr. Drew Wallace President South Amelia Island Shore Stabilization Association (SAISSA) Mr. Bill Moore, AICP Project
Atlantic Coast of Long Island, Jones Inlet to East Rockaway Inlet, Long Beach Island, NY Construction Update
 Atlantic Coast of Long Island, Jones Inlet to East Rockaway Inlet, Long Beach Island, NY Construction Update June 2016 US Army Corps of Engineers Project Purpose Three specific damage mechanisms of coastal
30 DAY PUBLIC NOTICE MAINTENANCE DREDGING OF THE 8-FOOT CHANNEL OF THE FEDERAL NAVIGATION PROJECT IN KENNEBUNK RIVER KENNEBUNK & KENNEBUNKPORT, ME
 fr.iiif.i ~ US Anny Corps of Engineers New England District 696 Virginia Road Concord, MA 01742-2751 Public Notice In Reply Refer to: Mr. Jack Karalius nae-pn-nav@usace.army.mil Programs/Project Management
ST. LUCIE COUNTY, FLORIDA
 ST. LUCIE COUNTY, FLORIDA COASTAL STORM RISK MANAGEMENT STUDY Draft Feasibility Study & Integrated Environmental Assessment Public Meeting Presented by U.S. Army Corps of Engineers Jacksonville District
A REVIEW OF THE CONDITION OF THE MUNICIPAL BEACHES AS A RESULT OF HURRICANE SANDY IN THE BOROUGH OF STONE HARBOR, CAPE MAY COUNTY, NEW JERSEY
 A REVIEW OF THE CONDITION OF THE MUNICIPAL BEACHES AS A RESULT OF HURRICANE SANDY IN THE BOROUGH OF STONE HARBOR, CAPE MAY COUNTY, NEW JERSEY View along the dune scarp from 103 rd Street on October 31,
FINDING OF NO SIGNIFICANT IMPACT
 DEPARTMENT OF THE ARMY CHARLESTON DISTRICT, CORPS OF ENGINEERS 69A HAGOOD AVENUE CHARLESTON, SOUTH CAROLINA 29403-5107 FINDING OF NO SIGNIFICANT IMPACT EDISTO BEACH COASTAL STORM DAMAGE REDUCTION GENERAL
Dare County Nourishment Project Town of Duck
 Dare County Nourishment Project Town of Duck Julien Devisse, P.E. and Ken Willson CB&I / Coastal Planning & Engineering of North Carolina, Inc. February 15, 2017 A World of Solutions Outline Background
UPPER BEACH REPLENISHMENT PROJECT RELATED
 ASSESSMENT OF SAND VOLUME LOSS at the TOWNSHIP of UPPER BEACH REPLENISHMENT PROJECT RELATED to the LANDFALL OF HURRICANE SANDY - PURSUANT TO NJ-DR 4086 This assessment is in response to Hurricane Sandy
Town of Duck, North Carolina
 Tracking No. 00.00.2010 Erosion Mitigation And Shoreline Management Feasibility Study Town of Duck, North Carolina Coastal Planning & Engineering of North Carolina August 15, 2012 Tom Jarrett Robert Neal
Volume and Shoreline Changes along Pinellas County Beaches during Tropical Storm Debby
 Volume and Shoreline Changes along Pinellas County Beaches during Tropical Storm Debby Ping Wang and Tiffany M. Roberts Coastal Research Laboratory University of South Florida July 24, 2012 Introduction
ATLANTIC COAST OF LONG ISLAND, JONES INLET TO EAST ROCKAWAY INLET, LONG BEACH ISLAND, NY. Contract #2 Construction Scope. April 18th-19th 2018
 ATLANTIC COAST OF LONG ISLAND, JONES INLET TO EAST ROCKAWAY INLET, LONG BEACH ISLAND, NY Contract #2 Construction Scope April 18th-19th 2018 New York District PLAN COMPONENTS Length of Beachfill 35,000
Coastal Harbors and Waterways, NC (Shallow Draft Navigation) (O&M)
 (O&M)") Coastal Harbors and Waterways, NC (Shallow Draft Navigation) (O&M) Shallow draft coastal harbors include a subsistence harbor at Silver Lake CONGRESSIONAL DISTRICT: NC 3, 7 DATE: 23 April 2018 1. AUTHORIZATION:
Coastal Harbors and Waterways, NC (Shallow Draft Navigation) (O&M) Shallow draft coastal harbors include a subsistence harbor at Silver Lake CONGRESSIONAL DISTRICT: NC 3, 7 DATE: 23 April 2018 1. AUTHORIZATION:
Coastal Harbors and Waterways, NC (Shallow Draft Navigation) (O&M)
 (O&M)") Coastal Harbors and Waterways, NC (Shallow Draft Navigation) (O&M) Shallow draft coastal harbors include a subsistence harbor at Silver Lake CONGRESSIONAL DISTRICT: NC 3 and 7 DATE: 23 February 2015 1.
Coastal Harbors and Waterways, NC (Shallow Draft Navigation) (O&M) Shallow draft coastal harbors include a subsistence harbor at Silver Lake CONGRESSIONAL DISTRICT: NC 3 and 7 DATE: 23 February 2015 1.
Regular Workshop October 20, 2014 Agenda Item: Dr. Albert E. Browder, PE; Olsen Associates, Inc.
 Regular Workshop October 20, 2014 Agenda Item 8 Agenda Item: Presenter: Summary: Beach Update Town Manager; Dr. Albert E. Browder, PE; Olsen Associates, Inc. At the January 21, 2014 Regular Workshop Meeting,
New Jersey Coastal Zone Overview. The New Jersey Beach Profile Network (NJBPN) 3 Dimensional Assessments. Quantifying Shoreline Migration
 3 Dimensional Assessments. Quantifying Shoreline Migration") New Jersey Coastal Zone Overview The New Jersey Beach Profile Network (NJBPN) Objectives Profile Locations Data Collection Analyzing NJBPN Data Examples 3 Dimensional Assessments Methodology Examples Quantifying
New Jersey Coastal Zone Overview The New Jersey Beach Profile Network (NJBPN) Objectives Profile Locations Data Collection Analyzing NJBPN Data Examples 3 Dimensional Assessments Methodology Examples Quantifying
CRC Inlet Management Study. Matt Slagel Shoreline Management Specialist
 CRC Inlet Management Study Matt Slagel Shoreline Management Specialist Study Origin CRC shall study feasibility of creating new AEC for lands adjacent to mouth of Cape Fear River (HB 819) Collaborate with
North Shore of Long Island, Feasibility Study
 North Shore of Long Island, Asharoken New York Asharoken, Feasibility Study Asharoken, NY Public Meeting June 30, 2015 US Army Corps of Engineers US Army Corps of Engineers New York BUILDING STRONG BUILDING
Navarre Beach & Dune Restoration Project Status Report to be regularly updated June 17, 2016 Report
 Navarre Beach & Dune Restoration Project Status Report to be regularly updated June 17, 2016 Report Work Completed (June 11 to June 17) Weeks Marine Inc. (Contractor): o continued filling Segment 4 including
Figure79. Location map for the 10 NJBPN profile sites in Atlantic County, NJ 155
 154 Figure79. Location map for the 10 NJBPN profile sites in Atlantic County, NJ 155 ATLANTIC COUNTY SPRING 2009 to FALL 2010 The Atlantic County coastline consists of three barrier islands. Between Little
Estimated on-the-ground start and end dates: 1 June October 2018
 A. Applicant Information Name of Organization: U.S. Army Corps of Engineers, Carlyle Lake 801 Lake Road, Carlyle, IL 62231 Contact Information: Robert Wilkins, Operations Manager, (618) 594-2484, Robert.Wilkins@usace.army.mil
STATUS REPORT FOR THE SUBMERGED REEF BALL TM ARTIFICIAL REEF SUBMERGED BREAKWATER BEACH STABILIZATION PROJECT FOR THE GRAND CAYMAN MARRIOTT HOTEL
 August 23 STATUS REPORT FOR THE SUBMERGED REEF BALL TM ARTIFICIAL REEF SUBMERGED BREAKWATER BEACH STABILIZATION PROJECT FOR THE GRAND CAYMAN MARRIOTT HOTEL performed by Lee E. Harris, Ph.D., P.E. Consulting
2014 ANNUAL REPORT - TO THE CITY OF NORTH WILDWOOD ON THE CONDITION OF THE CITY BEACHES
 2014 ANNUAL REPORT - TO THE CITY OF NORTH WILDWOOD ON THE CONDITION OF THE CITY BEACHES View on September 25, 2014 looking northwest into Hereford Inlet. Considerable southerly expansion of the tip of
Beach Nourishment, Static Lines, and Static Line Exceptions
 Beach Nourishment, Static Lines, and Static Line Exceptions Matt Slagel, Shoreline Management Specialist Coastal Resources Commission February 26, 2014 Nags Head Defining the Static Line Defining the Static
The 2017 Panama City Beaches Beach Interim Renourishment Project. Answers to Common Questions
 The 2017 Panama City Beaches Beach Interim Renourishment Project The fourth renourishment of the Panama City Beaches will be under construction during March and April 2017, with a planned completion by
23- Year Sand Volume Changes at Site 132, 15th Street, Brigantine
 149 Figure75. Location map for the 9 NJBPN profile sites in Atlantic County, NJ ATLANTIC COUNTY SPRING 2008 to FALL 2009 150 The Atlantic County oceanfront shoreline consists of three barrier islands.
Delaware Chapter Surfrider Foundation - Indian River Inlet Monitoring
 Delaware Chapter Surfrider Foundation - Indian River Inlet Monitoring In 2012, the Delaware Surfrider Foundation Chapter formed the Surf Quality and Access Committee to focus on issues such as surf spot
Follets Island Nearshore Beach Nourishment Project
 Coast & Harbor Engineering A division of Hatch Mott MacDonald Follets Island Nearshore Beach Nourishment Project Arpit Agarwal, P.E. April 1, 2016 Project Site!"#$% &'(% &)*+% )#,'-+% Shoreline Erosion
US Beach Nourishment Experience:
 Beach Nourishment: Introduction of new sand to the beach by truck or dredge Large beach >1 million cubic yards (100,000 dump truck loads) Funding is a combination of federal, state, local & private Also
Climate Change Impacts to KSC Launch Complex
 Climate Change Impacts to KSC Launch Complex Presented to: 2010 International Workshop on Environment and Energy By: John Shaffer NASA Environmental Management Branch Kennedy Space Center Hurricane Season
FINAL REPORT FOR 2013 ON THE CONDITION OF THE MUNICIPAL OCEANFRONT BEACHES THE BOROUGH OF AVALON, CAPE MAY COUNTY, NEW JERSEY
 FINAL REPORT FOR 2013 ON THE CONDITION OF THE MUNICIPAL OCEANFRONT BEACHES THE BOROUGH OF AVALON, CAPE MAY COUNTY, NEW JERSEY View from 12 th Street to the south taken February 28, 2013, following completion
Absecon Island Shore Protection The planning behind the project
 Absecon Island Shore Protection The planning behind the project Most residents of Atlantic City, Ventnor, Margate and Longport are now aware of upcoming plans to protect their common coastline with a beachfill
Coastal Harbors and Waterways, NC (Shallow Draft Navigation) (O&M)
 (O&M)") Coastal Harbors and Waterways, NC (Shallow Draft Navigation) (O&M) Shallow draft coastal harbors include a subsistence harbor at Silver Lake CONGRESSIONAL DISTRICT: NC 3 and 7 DATE: 23 February 2015 1.
Coastal Harbors and Waterways, NC (Shallow Draft Navigation) (O&M) Shallow draft coastal harbors include a subsistence harbor at Silver Lake CONGRESSIONAL DISTRICT: NC 3 and 7 DATE: 23 February 2015 1.
Planning Considerations for Nearshore Placement of Mixed Dredged Sediments
 Planning Considerations for Nearshore Placement of Mixed Dredged Sediments PURPOSE: Dredging planning and management decisions are based on a combination of engineering and economic factors tempered by
New Jersey Beach Profile Network Atlantic County Profile Site Locations
 215 RICHARD STOCKTON COLLEGE OF NEW JERSEY New Jersey Beach Profile Network Atlantic County Profile Site Locations COASTAL RESEARCH CENTER Figure 128 There are nine NJBPN survey sites on the Atlantic County
SACO RIVER AND CAMP ELLIS BEACH SACO, MAINE SECTION 111 SHORE DAMAGE MITIGATION PROJECT APPENDIX F ECONOMIC ASSESSMENT
 SACO RIVER AND CAMP ELLIS BEACH SACO, MAINE SECTION 111 SHORE DAMAGE MITIGATION PROJECT APPENDIX F ECONOMIC ASSESSMENT Department of the Army New England District, Corps of Engineers 696 Virginia Road
Impact of Hurricane Matthew on the Atlantic Coast of Florida
 Impact of Hurricane Matthew on the Atlantic Coast of Florida A coastal engineer was driving across country and his jeep broke down in front of a monastery. It was late in the day and the monks invited
SPECIAL SPRING 2018 STORM REPORT ON THE CONDITION OF THE MUNICIPAL BEACHES FOR THE BOROUGH OF STONE HARBOR, CAPE MAY COUNTY, NEW JERSEY
 SPECIAL SPRING 2018 STORM REPORT ON THE CONDITION OF THE MUNICIPAL BEACHES FOR THE BOROUGH OF STONE HARBOR, CAPE MAY COUNTY, NEW JERSEY Aerial photograph taken April 21, 2018 showing the view up the beach
La Quinta Channel Extension Port of Corpus Christi Ingleside, Texas. Mark Coyle
 La Quinta Channel Extension Port of Corpus Christi Ingleside, Texas Mark Coyle Corpus Christi Navigation Channel PCCA La Quinta Expansion Project History Corpus Christi Ship Channel Improvement Projects
The Blue Heron Slough Conservation Bank
 1 The Blue Heron Slough Conservation Bank CONSERVATION BANKING July 19-23, 2010 CASE STUDY SERIES The Blue Heron Slough Conservation Bank (Washington) I. OVERVIEW & BACKGROUND: Location: Snohomish River
Beach Nourishment Impact on Beach Safety and Surfing in the North Reach of Brevard County, Florida
 Beach Nourishment Impact on Beach Safety and Surfing in the North Reach of Brevard County, Florida Prepared by John Hearin, Ph.D. Coastal Engineering Vice Chairman Cocoa Beach Chapter Port Canaveral Patrick
ATLANTIC COUNTY 2006 to 2008
 ATLANTIC COUNTY 2006 to 2008 The Atlantic County oceanfront shoreline consists of three barrier islands where the northern one, Little Beach Island and a third of the second, Brigantine Island, are undeveloped
Nome Harbor Page 2 of 12
 Nome Harbor Nome Harbor Page 2 of 12 Condition of Improvements 30 December 2015 Nome Harbor, Alaska (CWIS No. 010422, 012270, 072742, 087755) Authorization (1) Rivers and Harbors Act, 8 August 1917 (House
Broad Beach Sand & Dune Habitat Restoration Project. Revetment Owners Meeting July 12, 2017
 Broad Beach Sand & Dune Habitat Restoration Project Revetment Owners Meeting July 12, 2017 Status of Project Entitlement Coastal Commission CDP approved 10/15 (consolidated with City of Malibu), PTI conditions
The purpose and needs of the Figure Eight Island Inlet and Shoreline Management Project are as follows:
 Chapter 2 PURPOSE AND NEEDS 1. What are the purpose and needs of this project? The main concern of residents and owners at Figure Eight Island are economic losses resulting from damages to structures and
Feasibility Report and Environmental Impact Statement. Coastal Storm Damage Reduction SURF CITY AND NORTH TOPSAIL BEACH, NORTH CAROLINA.
 Feasibility Report and Environmental Impact Statement on Coastal Storm Damage Reduction SURF CITY AND NORTH TOPSAIL BEACH, NORTH CAROLINA Appendix H Correspondence Appendix H Correspondence This appendix
APPENDIX M DREDGED MATERIAL MANAGEMENT PLAN (DMMP) FINAL INTEGRATED FEASIBILITY REPORT AND ENVIRONMENTAL ASSESSMENT
 FINAL INTEGRATED FEASIBILITY REPORT AND ENVIRONMENTAL ASSESSMENT") APPENDIX M DREDGED MATERIAL MANAGEMENT PLAN (DMMP) Brazos Island Harbor, Texas Channel Improvement Study FINAL INTEGRATED FEASIBILITY REPORT AND ENVIRONMENTAL ASSESSMENT This page is intentionally left
APPENDIX M DREDGED MATERIAL MANAGEMENT PLAN (DMMP) Brazos Island Harbor, Texas Channel Improvement Study FINAL INTEGRATED FEASIBILITY REPORT AND ENVIRONMENTAL ASSESSMENT This page is intentionally left
Long Beach Island Holgate Spit Little Egg Inlet Historical Evolution Introduction Longshore Transport Map, Survey and Photo Historic Sequence
 Appendix B Long Beach Island Holgate Spit Little Egg Inlet Historical Evolution Introduction The undeveloped southern end of Long Beach Island (LBI) is referred to as the Holgate spit as it adjoins the
DUNE STABILIZATION AND BEACH EROSION
 DUNE STABILIZATION AND BEACH EROSION CAPE HATTERAS NATIONAL SEASHORE NORTH CAROLINA ROBERT DOLAN PAUL GODFREY U. S. DEPARTMENT OF INTERIOR NATIONAL PARK SERVICE OFFICE OF NATURAL SCIENCE WASHINGTON, D.
Building Coastal Resiliency at Plymouth Long Beach
 Building Coastal Resiliency at Plymouth Long Beach Department of Marine and Environmental Affairs March 30, 2017 Introducing Green Infrastructure for Coastal Resiliency Plymouth Long Beach & Warren s Cove
2015 ANNUAL REPORT - TO THE CITY OF NORTH WILDWOOD ON THE CONDITION OF THE CITY BEACHES
 2015 ANNUAL REPORT - TO THE CITY OF NORTH WILDWOOD ON THE CONDITION OF THE CITY BEACHES Ariel view of North Wildwood looking south from the Hereford Inlet perspective on June 24, 2015. The main channel
Table 4. Volumetric Change Rates Pre-Project and Post-Project for the Town of Duck
 V. VOLUMETRIC CHANGES General Volumetric changes measured over the entire monitoring area for various time periods are provided in Table 4. The volume changes are given in terms of cubic yards/foot of
Town of Duck, North Carolina
 Tracking No. 00.00.2010 Erosion Mitigation And Shoreline Management Feasibility Study Town of Duck, North Carolina Coastal Planning & Engineering of North Carolina February 28, 2013 Ken Willson 1 Tracking
HURRICANE SANDY LIMITED REEVALUATION REPORT UNION BEACH, NEW JERSEY DRAFT ENGINEERING APPENDIX SUB APPENDIX D SBEACH MODELING
 HURRICANE SANDY LIMITED REEVALUATION REPORT UNION BEACH, NEW JERSEY DRAFT ENGINEERING APPENDIX SUB APPENDIX D SBEACH MODELING Rev. 18 Feb 2015 1 SBEACH Modeling 1.0 Introduction Following the methodology
DELAWARE S VULNERABLE COASTAL AREAS. DELAWARE INLAND BAYS and DELAWARE BAY RECONNAISSANCE STUDY
 DELAWARE S VULNERABLE COASTAL AREAS and the DELAWARE INLAND BAYS and DELAWARE BAY RECONNAISSANCE STUDY Kimberly K. McKenna, PG Delaware Dept. of Natural Resources & Environmental Control Division of Watershed
The Sand Beaches of New Hampshire and Maine
 The Sand Beaches of New Hampshire and Maine Beach Preservation and Erosion Control Photographs provided by Joe Kelly and Steve Adams Cover photo: Reid State Park, ME Introduction The sand beaches of New
Shoalwater Bay Shorline Erosion Dredging
 Shoalwater Bay Shorline Erosion Dredging ROSS ISLAND SAND & GRAVEL CO. Saving the Tokeland Penninsula Willapa Bay & Tokeland Penninsula Southwestern Washington Coast Shoalwater Bay Historic View Settlements
2018 Annual Beach Monitoring Report
 May 1, 218 Town of Hilton Head Island, SC 218 Annual Beach Monitoring Report Submitted to: Town of Hilton Head Island, SC November 15, 217 Prepared by: Olsen Associates, Inc. 2618 Herschel Street Jacksonville,
Ninilchik Harbor Page 2 of 11
 Ninilchik Harbor Ninilchik Harbor Page 2 of 11 Condition of Improvements 31 December 2017 Ninilchik Harbor, Alaska (CWIS No. 012640, 087345) Authorization Rivers and Harbors Act, 3 July 1958 (P.L. 85-500
FINAL REPORT FOR 2013 ON THE CONDITION OF THE MUNICIPAL BEACHES IN THE TOWNSHIP OF UPPER, CAPE MAY COUNTY, NEW JERSEY
 FINAL REPORT FOR 2013 ON THE CONDITION OF THE MUNICIPAL BEACHES IN THE TOWNSHIP OF UPPER, CAPE MAY COUNTY, NEW JERSEY Aerial photograph at Corson s Inlet showing conditions on December 1, 2013 of the north
Beach Restoration in Okaloosa and Walton Counties. FSBPA Technology Conference Clearwater, FL
 Beach Restoration in Okaloosa and Walton Counties FSBPA Technology Conference Clearwater, FL Presented by: Duncan Greer, E.I. February 5, 2015 PRESENTATION OUTLINE 1. Overview of Project Locations 2. Eglin
County of Santa Barbara Permit Option Analysis Goleta Beach JULY 13, 2017
 County of Santa Barbara Permit Option Analysis Goleta Beach JULY 13, 2017 Introduction 2 Goleta Beach Park welcomes 1.5 million visitors annually Amenities include: Picnic Areas and Group Areas w/bbqs
TITLE: North Carolina s Changing Shorelines. KEYWORDS: erosion - shorelines - mapping - sustainability
 UNC Coastal Studies Institute Teacher Resources 1 TITLE: North Carolina s Changing Shorelines KEYWORDS: erosion - shorelines - mapping - sustainability Changing shorelines impact coastal infrastructure.
2013 ANNUAL REPORT - TO THE CITY OF NORTH WILDWOOD ON THE CONDITION OF THE CITY BEACHES
 2013 ANNUAL REPORT - TO THE CITY OF NORTH WILDWOOD ON THE CONDITION OF THE CITY BEACHES View on June 18, 2013 from the 2 nd Avenue jetty looking south while the 2013 beach nourishment project was under
HARBOUR SEDIMENTATION - COMPARISON WITH MODEL
 HARBOUR SEDIMENTATION - COMPARISON WITH MODEL ABSTRACT A mobile-bed model study of Pointe Sapin Harbour, in the Gulf of St. Lawrence, resulted in construction of a detached breakwater and sand trap to
Final Waterways Assets and Resources Survey Master Plan for Dredging and Beach Nourishment
 Final Waterways Assets and Resources Survey Master Plan for Dredging and Beach Nourishment For, Massachusetts Prepared For: Dennis Town Hall P.O. Box 2060 485 Main Street Dennis, MA 02660 Prepared By:
CHAPTER 281 INFLUENCE OF NEARSHORE HARDBOTTOM ON REGIONAL SEDIMENT TRANSPORT
 CHAPTER 281 INFLUENCE OF NEARSHORE HARDBOTTOM ON REGIONAL SEDIMENT TRANSPORT Paul C.-P. Lin, Ph.D., P.E. 1 and R. Harvey Sasso, P.E. 2 ABSTRACT The influence of nearshore hardbottom on longshore and cross-shore
ALTERNATIVES FOR COASTAL STORM DAMAGE MITIGATION
 ALTERNATIVES FOR COASTAL STORM DAMAGE MITIGATION Dave Basco Old Dominion University, Norfolk, Virginia, USA National Park Service Photo STRUCTURAL (changes to natural, physical system) hardening (seawalls,
Figure 106. Locations of the 28 NJBPN profile stations in Ocean County, NJ.
 130 Figure 106. Locations of the 28 NJBPN profile stations in Ocean County, NJ. 131 2016-2017 Beach Fills in Ocean County: The federal/state/local storm damage reduction project (beachfill) between Manasquan
STORM RESPONSE SIMULATION
 APPENDIX V STORM RESPONSE SIMULATION Final Environmental Impact Statement Village of Bald Head Island Shoreline Protection Project Brunswick County, North Carolina Delft3D Storm Response Simulations With
Juneau Douglas Harbor
 Juneau Douglas Harbor Douglas Harbor Page 2 of 8 Condition of Improvements 31 December 2015 Douglas Harbor, Alaska (CWIS No. 072789, 180942) Authorization Rivers and Harbors Act, 3 July 1958 (House Doc.
SHORE PROTECTION AND HABITAT CREATION AT SHAMROCK ISLAND, TEXAS ABSTRACT
 SHORE PROTECTION AND HABITAT CREATION AT SHAMROCK ISLAND, TEXAS M. Cameron Perry, P.E., and Daniel J. Heilman, P.E. Coastal Engineer Shiner Moseley & Associates., Inc. 555 N. Carancahua Corpus Christi,
ALTERNATIVES FOR COASTAL STORM DAMAGE MITIGATION AND FUNCTIONAL DESIGN OF COASTAL STRUCTURES
 The University of the West Indies Organization of American States PROFESSIONAL DEVELOPMENT PROGRAMME: COASTAL INFRASTRUCTURE DESIGN, CONSTRUCTION AND MAINTENANCE A COURSE IN COASTAL DEFENSE SYSTEMS I CHAPTER
North Carolina s Terminal Groins at Oregon Inlet and Fort Macon Descriptions and Discussions
 Attachment 2 North Carolina s Terminal Groins at Oregon Inlet and Fort Macon Descriptions and Discussions Oregon Inlet Terminal Groin Introduction/Background Oregon Inlet was created by a hurricane on
CHAPTER 134 INTRODUCTION
 CHAPTER 134 NEW JETTIES FOR TUNG-KANG FISHING HARBOR, TAIWAN Chi-Fu Su Manager Engineering Department Taiwan Fisheries Consultants, Inc. Taipei, Taiwan INTRODUCTION Tung-Kang Fishing Harbor, which is about
Nearshore Dredged Material Placement Pilot Study at Noyo Harbor, CA
 1 Nearshore Dredged Material Placement Pilot Study at Noyo Harbor, CA Noyo Cove N 2011 National Conference on Beach Preservation Technology 9-11, February 2011 Lihwa Lin, Honghai Li, Mitchell Brown US
Figure Eight Island Shoreline Management Project EIS. Chapter 3 PROJECT ALTERNATIVES. 1. What alternatives are evaluated in this EIS?
 Chapter 3 PROJECT ALTERNATIVES 1. What alternatives are evaluated in this EIS? This section describes in detail the various alternatives evaluated for responding to the erosion threat along the northern
3.0 PROJECT ALTERNATIVES
 3.0 PROJECT ALTERNATIVES The National Environmental Policy Act and the CEQ regulations for implementing the NEPA (40 CFR 1500 et. seq.) require the identification and evaluation of reasonable alternatives
PLAQUEMINES PARISH BARRIER ISLAND RESTORATION & SUSTAINABILITY. MVD/Gulf Coast Regional Dredging Meeting November 5, 2013
 PLAQUEMINES PARISH BARRIER ISLAND RESTORATION & SUSTAINABILITY MVD/Gulf Coast Regional Dredging Meeting November 5, 2013 OVERVIEW 1. Barrier Island Restoration Projects in Plaquemines Parish 2. Plaquemines
Union Pacific Railroad
 Input Questions: 404/401 Pre Application Meeting, December 18, 2013, Portland, Oregon 1. What is the project purpose and need? The purpose of the project is to improve the efficiency and average velocity
LAB: WHERE S THE BEACH
 Name: LAB: WHERE S THE BEACH Introduction When you build a sandcastle on the beach, you don't expect it to last forever. You spread out your towel to sunbathe, but you know you can't stay in the same spot
Salt Ponds Shore Zone Modeling for Breakwater Placement: Summary Report
 Salt Ponds Shore Zone Modeling for Breakwater Placement: Summary Report Virginia Institute of Marine Science May 2014 Salt Ponds Shore Zone Modeling for Breakwater Placement: Summary Report For Waterway
Controlling Coastal erosion
 Controlling Coastal erosion Coastal Erosion Rates in the U.S. Coastal Erosion and Stabilization Economic pressures demanding the stabilization of beaches and coastlines are immense Coastal Erosion and
CLAM PASS ANNUAL RESTORATION & MANAGEMENT PLAN TIDAL ANALYSIS ELEMENT REPORT NO. 13
 CLAM PASS ANNUAL RESTORATION & MANAGEMENT PLAN TIDAL ANALYSIS ELEMENT REPORT NO. 13 Submitted to: Pelican Bay Services Division Prepared by: Humiston & Moore Engineers H&M File No. 13-078 November 2012
Saco River Maintenance Dredge PROJECT PLAN AND TIMELINE JUNE 15, 2017
 Saco River Maintenance Dredge 2017-2018 PROJECT PLAN AND TIMELINE JUNE 15, 2017 Overview Last dredged in 1994 Removing ~150,000 cy of sand and silt from the upper and lower reaches Disposal sites: In-River
Figure 262. Location map for the 10 NJBPN profile sites in Atlantic County, NJ 279
 278 Figure 262. Location map for the 10 NJBPN profile sites in Atlantic County, NJ 279 ATLANTIC COUNTY SUMMARY The Atlantic County coastline consists of three barrier islands. The island of Little Beach
4/20/17. #32 - Coastal Erosion Case Histories - Lake Michigan
 Writing Assignment Due Monday by 11:59 pm #32 - Coastal Erosion Case Histories - Lake Michigan See main class web pages for detailed instructions Submit papers Illinois Compass No copying: Compass will