Section 3.8 Coastal Processes
|
|
|
- Maude Chase
- 6 years ago
- Views:
Transcription


1 Section 3.8 Coastal Processes
2 Terminal 0 Environmental Impact Statement Abbot Point Coal Terminal 0 EIS Adani
3 3.8 Coastal Processes This section of the EIS describes the processes and environmental values of the coastal zone within and surrounding the Project area. This chapter is based on a technical study carried out by SMEC and describes the existing physical coastal environment including hydrodynamics, waves, sediment transport, and address the potential marine and coastal impacts of the proposed overwater elements of the Project. The complete technical report is provided in Appendix E3. This section provides measures to avoid and mitigate the Project s impacts on the coastal zone and processes. The coastal processes and hydrodynamics assessment undertaken by GHD (2012b) for the Abbot Point Cumulative Impact Assessment (CIA) (ELA and OpenLines 2012) was used to determine the potential impacts from the Material Offloading Facility (MOF) for the Project. The assessment also provided relevant management and mitigation measures. Specific objectives of the coastal processes assessment were to: Detail the existing environmental values relating to coastal processes for the area surrounding the Project; Define potential adverse and beneficial impacts on the coastal environment associated with the overwater elements of the Project; and Detail mitigation measures for any potentially significant impacts, as required Relevant Legislation A full description of legislation is contained within Section 3.1 Legislation, Land Use and Planning. For the purposes of the marine environment, the following Acts are applicable. For this section, the components assessed will be within the Strategic Port Land (SPL) boundaries, and is adjacent to, not within, the GBRMP. Under the Great Barrier Reef Intergovernmental Agreement 2009 and the EPBC Act (see Section 3.1 Legislation, Land Use and Planning), activities within the coastal zone surrounding Abbot Point may be subject to both Commonwealth and Queensland legislative requirements Commonwealth Legislation Environment Protection and Biodiversity Conservation Act 1999 The Environment Protection and Biodiversity Conservation Act 1999 (EPBC Act) provides a legal framework to protect and manage matters of National Environmental Significance (MNES) including nationally and internationally important flora, fauna, ecological communities and heritage places within the coastal zone. Great Barrier Reef Marine Park Act 1975 The Great Barrier Reef Marine Park Act 1975 (GBRMP Act) provides the legislative framework that defines the GBRMP. The proposed overwater elements of the Project are not located within the GBRMP, and therefore the activities do not require approval under the Act. However, the Project is within the GBRWHA and due to its location, any indirect impacts on the GBRMP must be addressed as well as effects on the GBRWHA. Terminal 0 Environmental Impact Statement 3-189
4 Queensland Legislation Sustainable Planning Act 2009 The Sustainable Planning Act 2009 (SP Act) and Sustainable Planning Regulation 2009 (SP Regulation) seek to achieve sustainable planning outcomes through managing the process by which development takes place, managing the effects of development on the environment, and continuing the coordination and integration of local, regional and state planning. Refer to Section 3.1 Legislation, Land Use and Planning for an overview of the regulatory requirements under the SP Act. Coastal Protection and Management Act 1995 The Coastal Protection and Management Act 1995 (CPM Act) aims to provide protection and management to Queensland s coastal zone and coastal resources (s3 CPM Act). The act provides regulatory provisions for the assessment of development for the purposes of the SP Act. Refer to Section 3.1 Legislation, Land Use and Planning for an overview of the regulatory requirements under the CPM Act Method The coastal processes section of this EIS has involved undertaking the following: Literature and data collation, and review of all available relevant information; Description of the existing physical coastal processes and environmental values; Assessment of the impacts of the proposed development on existing coastal processes and the coastal environment through interpretation by experienced coastal process engineers and numerical techniques. The numerical techniques involved bed shear stress calculations (Soulsby 1997), scour calculations (Whitehouse 1998) and depth of closure calculations (Hallermeier 1978); Review and interpretation of existing three dimensional (3D) modelling conducted for the trestles and in particular the MOF (GHD 2012b) as part of the Abbot Point CIA (ELA and OpenLines 2012); and Detailing the potential impacts and identifying any mitigation or management measures that may be required. Details of the method adopted for each of these elements is provided in the following sections Literature and Data Review A desktop review has been undertaken to ensure all relevant available information was incorporated into the assessment. The desktop review involved collating and reviewing previous studies undertaken and data collected from the area including: WBM (2006), Abbot Point Coal Terminal, Stage 3 Expansion, Environmental Impact Statement. Report for the Ports Corporation of Queensland (PCQ); GHD (2010), Abbot Point Coal Terminal, X110 Expansion. Hydrodynamic, Transport and Water Quality Modelling. Report for North Queensland Bulk Ports Corporation (NQBP); Terminal 0 Environmental Impact Statement 3-190
5 GHD (2009), Proposed Abbot Point Multi Cargo Facility. Coastal Processes Assessment. Report as part of the Multi Cargo Facility EIS for NQBP; GHD (2012a), Report for Terminals 0, 2 and 3, Abbot Point, Queensland, Capital Dredging. Hydrodynamic and Sediment Transport Analysis. Report for NQBP; GHD (2012b), Coastal and Hydrodynamics Technical Report. Report for the Abbot Point CIA ; GHD (2012c), Sediment Sampling and Analysis Plan Implementation Report. Report for NQBP; and SMEC (2012), Abbot Point Water Quality Assessment: T0, T2 and T3. Report by SMEC for NQBP. The following data sources have been used as part of the assessment: Aerial photography from 2009 and 2012; Numerical modelling results from the hydrodynamic and wave models developed using DHI s Mike software by SMEC for the Abbot Point Water Quality Assessment: T0, T2 and T3; Water level and tidal current data from a numerical model calibrated at Abbot Point as part of a previous assessment; Wind data from the Bureau of Meteorology (BoM) weather station at Bowen Airport (Station Number ) and 30 km offshore of Abbot Point from hindcast wind data from MetOcean Solution Pty Ltd; Wave data from a numerical model which is driven by hindcast wind and wave data from MetOcean Solution Pty Ltd and calibrated using data from two ADCPs deployed by NQBP around Abbot Point as part of a previous assessment; Bathymetric data from surveys in 2004, 2007 and 2011; and Nearshore hydrographic beach profiles collected in Existing Environment The existing environment has been described based on relevant information and data available. Where available, the following have been used to describe the existing environment: Findings from previous investigations; Information obtained from the analysis of available data; Knowledge gained from previous studies of the area; and Numerical modelling results from existing models of the area (refer to Appendix E3). Terminal 0 Environmental Impact Statement 3-191
6 Impact Assessment Jetty and Berths The potential impacts have been assessed based on the proposed design of the overwater elements of the Project. The impacts were considered relative to the existing coastal conditions and infrastructure. As it was anticipated that the impacts would be very minor and localised in nature concerning any potential changes to the coastal processes that might be expected to occur, combined with the size of the structures likely to directly impact coastal processes (relatively small structures such as piles (1.2 m diameter), it was considered more appropriate to rely on the previous modelling as highlighted above and then use a range of interpretive methods to produce a robust assessment of the possible very fine scale impacts. These included: Numerical calculations of bed shear stress based on Soulsby (1997), scour based on Whitehouse (1998) and depth of closure based on Hallermeier (1978); Interpretation and analysis of existing information by experienced coastal process engineers; The use of analogues and findings from relevant research; and The outcomes from previous related studies (listed above). The possible impacts were defined based on: Whether the impacts were direct or indirect; Whether the impacts were adverse or beneficial; The timescale of the impacts; and Whether the impacts were temporary/reversible or permanent/irreversible. Material Offloading Facility The existing MOF was used during construction of the existing offshore facility in the early 1980s, and upgraded for the expansion of the facility to 50 Mtpa in For this Project, the MOF will be enhanced in stages as required to support the construction activities planned for the Project (see Section 2 Project Details for a full description of the MOF and its staging). Three dimensional modelling was undertaken for two MOF options as part of the Abbot Point CIA studies (GHD 2012b). The worst case scenario was used for the EIS to assess any potential for impact. GHD s assessment of the two MOF option utilised DHI s Mike modelling system, including both hydrodynamic and wave modules. The models were based on a scaled grid, which was refined down to 50 m in the immediate areas of impact at the MOF and gradually increased to 250 m resolution in a 4 km wide zone established parallel to the coast and extending from Camp Island to the northwest to the mouth of the Don River to the southeast. The MOF was incorporated in the model as a change to the bathymetry; the full future expansion of the MOF was included, considering beyond the development needed to support the Project. The bathymetry from the model was regenerated to include new LiDAR data obtained from NQBP and a recent 2012 bathymetric survey for the area of the existing MOF by Maritime Safety Queensland (MSQ). For details of model inputs and assumptions refer to GHD 2012b. Terminal 0 Environmental Impact Statement 3-192
. 3.")
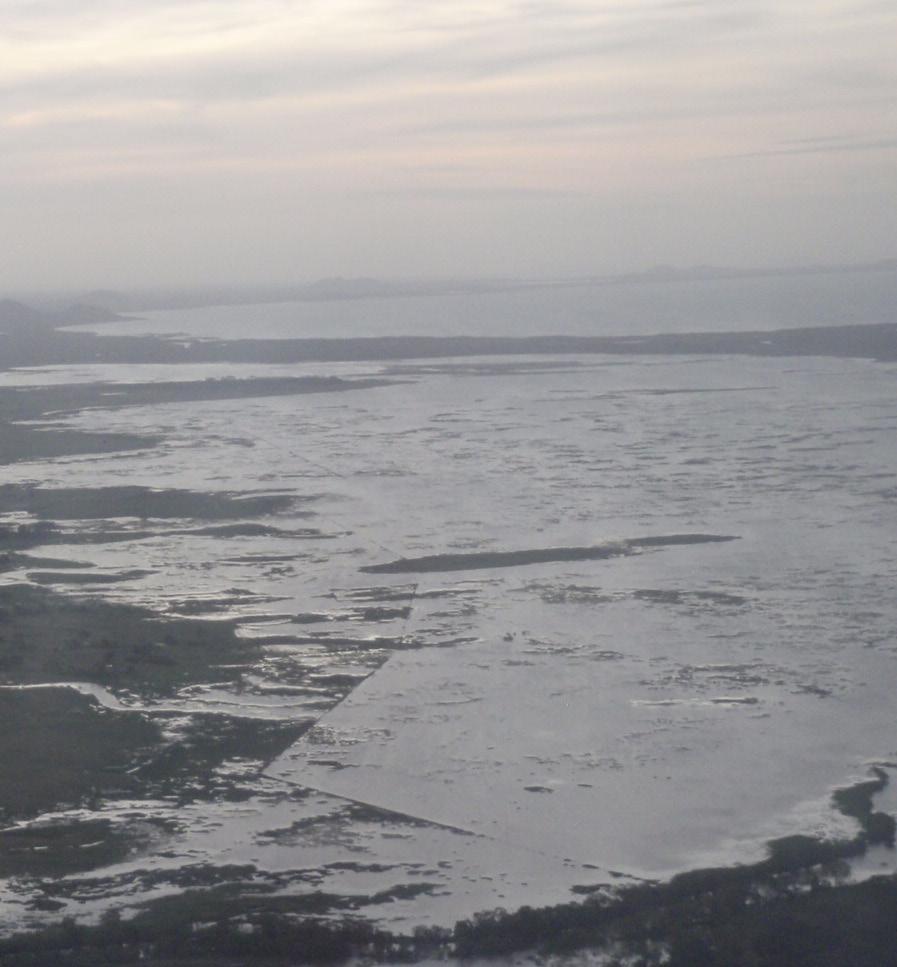
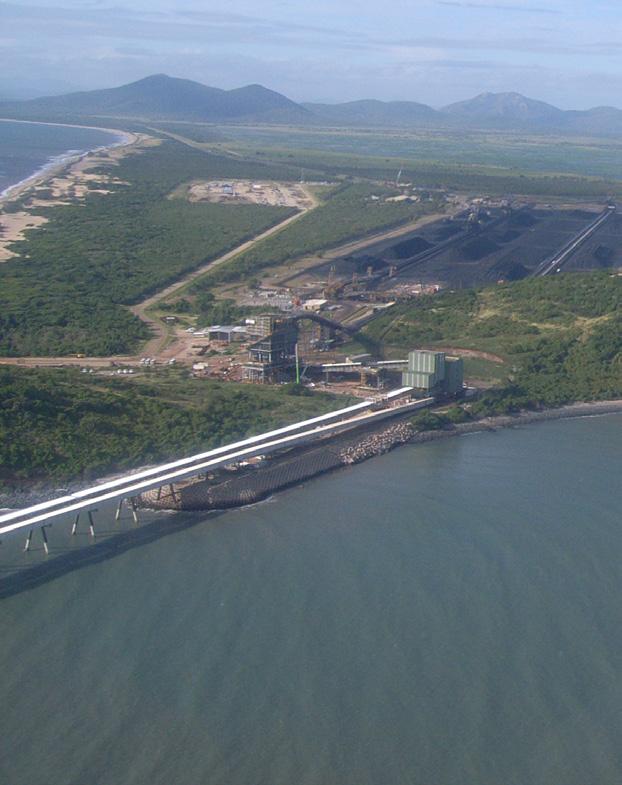
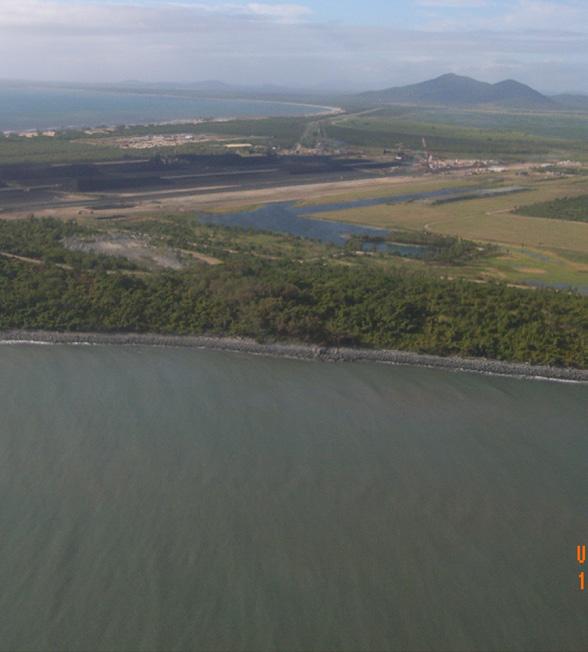
7 Potential changes in coastal processes, including erosion and accretion of sediments and changes to wave climate, resulting from the expansion of the MOF structure were assessed by comparing model runs before and after the proposed extension for a representative year of wind and wave climate at Abbot Point (GHD 2012b) Existing Coastal Environment and Values Existing Infrastructure The existing development at Abbot Point is a 50 Mtpa coal export Terminal. The Terminal consists of a single trestle jetty (trestle pile spacing of approximately 24 m) and a conveyor which is connected to two berths and shiploaders 2.75 km offshore. A small rock revetment is located along a 150 m length of the coastline and extending up to 60 m from the shoreline of Dingo Beach where the jetty and conveyor connect to the foreshore (Figure 3-47). At the northern end of Abbot Beach, a breakwater structure associated with the existing MOF has resulted in a build-up of sediment to the south that extends the width of the MOF (Figure 3-47). Figure 3-47 Aerial photograph showing the shoreline around the Abbot Point headland (Source: EHP aerial imagery 2012) The existing over water marine structures of the T1 development has resulted in negligible changes to the coastal processes including (Appendix E3): Very small localised increases in tidal current speed as a result of the jetty trestles blocking flow; Some scour may occur around piles during high wind and wave condition; however scour would be extremely localised around individual piles and naturally infill over time due to longshore sediment movement leaving no residual impact; Terminal 0 Environmental Impact Statement 3-193
8 Very localised changes in longshore sediment transport pathways as a result of the trestle abutment. As the revetment is located along the eastern end of Dingo Beach (a boulder beach interspersed with sand,), only minor changes are expected to have occurred to the longshore sediment transport where it extends into the sandy subtidal areas. It is more likely that the actual headland of Abbot Point has a greater impact on sediment transport in this fine scale area. Very minor and localised changes to the longshore transport pathways are also expected to have occurred as a result of the trestles and piles; however it is unlikely that this has resulted in any perceptible change to longshore sediment transport at Abbot Point and if so changes would be extremely negligible; and Very localised changes in wave condition as a result of the trestles. All the impacts to coastal processes expected to have resulted from the existing over water infrastructure would be negligible. Further, previous studies have found no evidence of any adverse impacts on coastal processes associated with the existing offshore infrastructure (WBM 2006). In contrast to the over water structures, the existing MOF has impacted the shoreline alignment and sediment transport regime by stopping sediment transport north along Abbot Beach resulting in sand accreting to the south of the breakwater forming a sand fillet. This sand accretion fillet appears to be full and sand bypassing of the structure is occurring as can be observed in Figure Accordingly, foreshore beach alignment and sediment transport rates are expected to have stabilised to a new equilibrium state Tidal Currents Previous investigations have identified that regional ocean current patterns are predominately influenced by the combined effects of the astronomical tide, wind and the East Australian Current (WBM 2006). Tidal currents have been recorded during previous studies that showed the following: Spring tidal current speeds adjacent to the existing berth are up to 0.5 m/s, with a flood tide direction of 120 and an ebb tide direction of between 300 and 320. Therefore, the dominant tidal currents flow approximately parallel with the wharf face; Similar spring tidal current speeds were prevalent 8.5 km to the west, 2 km to the north east and 4 km to the east of the existing berth. Tidal current directions were also similar to the east and north east of the berth, while to the west of the berth, the tidal currents tend to rotate throughout the tide. Tidal currents can therefore be considered relatively uniform in the deeper waters at the seaward end of the wharf; Neap tidal current speeds of up to 0.15 m/s occur at the sites to the north east and east of the wharf. Throughout neap tides, the tidal current direction is variable and does not show a clear pattern; Tidal current patterns remain consistent through the water column, with current speed magnitudes changing with depth. The highest speeds occur at the surface and the lowest at the bed. Measurements have shown that peak tidal current speeds at the surface can be close to double those at the bed; and Tidal currents can be significantly influenced by wind and wave conditions. Trade winds blow from the south-east from April through November at Abbot Point and it is wind and waves from an easterly direction which generally affect the tidal currents. During December through March, winds can come from a variety of directions including north-east and north-west, as well as south easterlies. These easterly wind and wave processes can result in both increases and Terminal 0 Environmental Impact Statement 3-194
9 decreases in tidal current speeds of up to m/s; the low water (LW) peak speed in a north-westerly direction is increased and the high water (HW) peak speed in an east-southeasterly direction is reduced. As a result, the overall dominant tidal flow at the site is in a northwesterly direction. Further details on the influence of wind and wave processes on the tidal currents are provided in Appendix E3. Time series plots show measured and modelled (extracted from SMEC s hydrodynamic model) tidal current speed and direction at a model calibration-site approximately 4 km to the east of the proposed Project during a period with relatively large waves and strong winds (up to 40 km/hr) from the east (see Appendix E3). The tidal currents were modelled to both include and exclude wind and wave processes. Comparison of these figures demonstrates the influence of wind and wave processes on the tidal currents at Abbot Point; with the easterly wind and waves resulting in the LW peak tidal current speed increasing by up to 0.1 m/s, while the HW peak is reduced by m/s. Further, the tidal current directions are also affected, with flows in a north-westerly direction occurring for a longer duration, while flows to the east-south-east occur for a shorter duration. The spatial change in tidal currents around the proposed Project caused by strong winds and large waves from the east result in a significant increase in tidal current speeds at LW when the flow is to the west-north-west (Figure 3-48) and a significant reduction in flow speeds at HW when the flow is to the south-east (Figure 3-49). The reduction in flow at HW results in almost no flow occurring in a south-easterly direction. Therefore, the occurrence of strong winds and large waves from the east results in a large inequality in the tidal flows at Abbot Point, significantly increasing the tidal flows in a north-westerly direction at LW and substantially reducing tidal flows at HW in a southeasterly direction. Previous investigations have also identified that wind-driven currents are important around Abbot Point, resulting in currents of up to 0.1 m/s flowing parallel to the coast in a westerly direction (GHD 2009; and GHD 2010). An assessment of tidal current speed and direction over a lunar cycle (approximately 29 days) show that higher tidal current speeds occur at the locations along the jetty which are further offshore, while the lowest peak tidal current speeds occur closer to the shore. Variations in peak tidal current speed of up to 0.1 m/s occur between the offshore and nearshore areas of the jetty. However, during neap tides there are periods with little to no variation in tidal current speed between the offshore and nearshore sections of the jetty. In addition, to determine how waves influence tidal currents along the Project, the wave conditions (which are directly related to the wind conditions) over the same period at the location of the proposed Project s berth were assessed. During periods when relatively large waves and therefore strong winds occur (e.g. significant wave height (Hs) greater than 1 m), similar increases in flow speed as a result of wind and waves occur at all locations along the proposed jetty. Terminal 0 Environmental Impact Statement 3-195

10 Figure 3-48 Modelled tidal current vectors and speeds at low water with and without wind and wave processes included Terminal 0 Environmental Impact Statement 3-196

11 Figure 3-49 Modelled tidal current vectors and speeds at high water with and without wind and wave processes included Terminal 0 Environmental Impact Statement 3-197
12 Water Level Abbot Point experiences semi-diurnal tides, with a semi-diurnal period of 12 hours and 25 minutes. There is a diurnal inequality in the tidal levels, with typical inequalities in the order of 1.0 m at HW and 0.5 m at LW. Abbot Point is classified as mesotidal with a tidal range of between 2 m and 4 m; tidal levels at Abbot Point are shown in Table Table 3-48 Tidal levels at Abbot Point relative to Australian Height Datum Tidal Level Abbot Point (19 51 S, E) (m Australian Heigh Highest Astronomical Tide (HAT) 1.97 Mean High Water Springs (MHWS) 1.07 Mean High Water Neap (MHWN) 0.44 Mean Sun Level (MSL) 0.06 Mean Low Water Neap (MLWN) Mean Low Water Springs (MLWS) Lowest Astronomical Tide (LAT) Wind The closest available long term wind data record to Abbot Point is located at Bowen Airport (20.02ºS, ºE), operated by the Bureau of Meteorology (BoM). The data collected at the weather station has been processed by BoM from 1987 to The data shows that average wind speeds at 9:00 am range from 17 to 21 km/hr throughout the year, and at 3:00 pm they range from 22 to 25 km/hr. Wave roses demonstrate that the dominant wind direction is from the south-east at 9:00 am, and from the east at 3:00 pm (see Appendix E3). The analysis shows that wind directions from the east and south-east dominate at Abbot Point, both in terms of duration and magnitude. Hindcast modelled wind conditions approximately 30 km offshore of Abbot Point were obtained between 1998 and 2011 from MetOcean Solution Pty Ltd (see Appendix E3). Comparison of the modelled wind data with the wind data measured at Bowen Airport (for direct comparison of the data, 12 m/s is approximately equal to 40 km/hr) shows similar patterns with winds from the south-east to east dominating, demonstrating that the hindcast modelled winds are representative of winds in the area. Seasonal wind roses have been created using the hindcast modelled wind conditions offshore of Abbot Point (see Appendix E3). Throughout all seasons, easterly winds dominate both in terms of duration and magnitude, with winds from the east-northeast and east-south-east also occurring frequently. During summer months, winds also occur from the northerly sector; however, these do not occur frequently and are of a lower magnitude than the easterly winds except in tropical cyclonic events Waves The outer GBR is located approximately 85 km offshore of Abbot Point and blocks, or significantly attenuates the majority of long period swell wave events from the Coral Sea. However, occasional large wave events generated inshore of the reef occur due to tropical cyclones. Accordingly, the wave climate which occurs at the site is variable. GHD (2010) suggested the site is exposed to both locally generated wind waves and long period swell waves, with spectral peak periods ranging from 2 to 13 seconds. Locally generated wind waves dominate with peak periods ranging from 2 to 5 seconds. Swell waves tend to be lower in height but have a much higher wave period, varying in peak period from 7 to 13 seconds. Terminal 0 Environmental Impact Statement 3-198
13 Wave conditions at the proposed Project berth have been represented by hindcast methods using a two dimensional spectral wave model, with modelled wave conditions from 1998 to The wave conditions over this period are predominantly from the east and east-south-east with significant wave heights (Hs) of between 0.5 and 1.5 m. An assessment of H s and wave direction shows that for 78% of the time Hs is less than 1 m, and Hs exceeds 1.5 m for less than 1% of the time. Joint frequency tables of Hs against peak wave period (Tp) and Tp against wave direction also shows that the largest wave heights which occur at the Project have a Tp of 6 to 7s, and that swell waves with a Tp of more than 7s have Hs of less than 1 m. The largest wave periods, associated with swell waves generated in the Coral Sea which have propagated through the GBR, are from the north to east-north-east. Peak wave periods for the dominant waves from the east and east-south-east tend to be in the 3 to 6s range. This shows that the proposed Project area is relatively sheltered for an open coastal environment as a result of the GBR blocking larger waves generated further offshore in the Coral Sea. However, the area can still be prone to larger waves but these occur infrequently as a result of storms and tropical cyclones. Assessments of cyclonic waves at Abbot Point have been undertaken as part of previous studies (GHD 2009; GHD 2010; and WBM 2006). The assessment undertaken by GHD (2010) included modelling of Cyclone Celeste which made landfall 40km northeast of Abbot Point in 1996 to represent the nearshore cyclonic wave conditions. Significant wave heights of up 3.6 m, peak wave periods of up to 14s and wave directions of between 30º and 90º were predicted to the west of the T1. However, it is important to note that these wave conditions are based on the representation of a single historic cyclone and as such must be treated with caution in terms of being representative of the extreme wave climate. The assessment undertaken by WBM (2006) predicted that cyclonic events could result in nearshore Hs exceeding 5.0 m in the area around Abbot Point. The highest nearshore Hs recorded by the former Beach Protection Authority (now Department of Environment and Heritage Protection EHP) at offshore locations near Abbot Point between 1977 and 2000 was approximately 3.5 m Storm Surge Abbot Point has the potential to be subject to storm surge which can result in substantially higher water levels than would be expected as a result of just astronomic tidal forcing. Large local storms are generally a result of low pressure cyclonic weather systems. At the east coast of Queensland these systems tend to track west to southwest at speeds of 5 to 20 km/hr, although actual windspeeds within the system can be in excess of 200 km/hr. The increase in water level arising from these storms is a combination of local barometric effects (i.e. the local low pressure causing a rise in local sea level), a kinematic effect due to the tracking of the weather system and a dynamic effect of the wind-stress on the ocean surface. Generally the storm tide level is used to describe storm surge; this is the combination of the tidal level plus any storm surge. Depending on the timing of the storm, the storm surge may occur at any stage of the tidal cycle. Accordingly, the probability of a large storm surge coinciding with high water on a large spring tide is low. A number of studies have been undertaken into storm surges at Abbot Point. The most recent, which is also considered the most representative, was undertaken by Connell Wagner et al. (2004), and provides prediction of storm tide levels at Abbot Point. Table 3-49 presents the predicted peak storm tide levels for a series of recurrence intervals, excluding wave set-up and any climate change impacts. Further, storm tide level predictions were made with cyclone central pressures reduced by 5 hpa to represent possible climate change response; this results in the levels detailed in Table 3-49 being increased by between 0.07 and 0.17 m. Wave set-up was also estimated to be 0.3 m for ARI events of 100 years or less and 0.4 m for ARI events greater than 100 years. At Abbot Point the 100 Terminal 0 Environmental Impact Statement 3-199
14 year ARI storm tide level is 0.34 m above the HAT level (the highest tidal level which can be predicted to occur under average meteorological conditions); this is considered a relatively small increase in water levels for a 100 year ARI storm tide. Table 3-49 Peak storm tide levels (excluding wave set-up and sea level rise) ARI Storm Tide Level (m AHD) Location 50 year 100 year 500 year 1,000 year 10,000 year Abbot Point North Abbot Point Abbot Point South Source: Connell Wagner et al. (2004) Sea Level Rise There still remains considerable uncertainty related to sea level rise (SLR) in terms of its magnitude and rate as a result of the thermal expansion of the oceans and the melting of glaciers and ice sheets. However, sufficient long term tide gauge data exists to demonstrate that global sea levels rose during the 20th Century, with a calculated average global rate of 1.7 ± 0.5 mm/yr (IPCC 2007). The latest Intergovernmental Panel on Climate Change (IPCC) reports, Assessment Report No. 4 (AR4) (IPCC 2007), provides modelled projections for SLR up to the end of the 21st Century with a 90% confidence range. SLR projections are provided for a range of different projected anthropogenic emission scenarios, resulting in a range of SLR values. The geographical pattern of mean sea level relative to the geoid is an aspect of the dynamical balance relating the ocean s density structure and its circulation (IPCC 2007), with localised variations. Furthermore, the IPCC AR4 reports detail that further acceleration in ice flow, as has been observed in some Greenland outlet glaciers and West Antarctic ice streams, could substantially increase the SLR contribution from the ice sheets. Therefore, if ice discharge from these processes were to scale up in future in proportion to global average surface temperature change, it would add 0.1 to 0.2 m to the upper bound of SLR by 2090 to However, it is also noted that the understanding of these effects is too limited to assess their likelihood or to give a best estimate. Based on the IPCC AR4 reports, a conservative SLR projection for Abbot Point would be 0.84 m by the end of the 21st Century. The recently suspended Queensland Coastal Plan (Department of Environment and Resource Management (DERM) 2012) provided specific projected SLR for Queensland based on the IPCC AR4 findings (Table 3-50). These values agree well with the values calculated directly from the IPCC AR4 reports, and show that a SLR of 0.8 to 0.84 m should be applied as a conservative representation of SLR by Table 3-50 Projected SLR for Queensland (Source: DERM 2012) Year Projected SLR Terminal 0 Environmental Impact Statement 3-200
15 Bathymetry Figure 3-50 Bathymetry for the area surrounding the Project The bathymetry for the area surrounding the Project is shown in Figure The nearshore bathymetry to the east and north-east of Abbot Point slopes gradually toward natural water depths of 20 m below AHD, where the existing T1 berths are located. Clark Shoal extends 5 to 6 km to the north-west of Abbot Point at depths of 5 to 6 m below AHD. Offshore from the Shoal, the seabed slopes steeply to 20 m AHD. The bathymetry adjacent to Abbot Beach has a steeper slope than the beaches to the west/south-west, indicating they are exposed to greater wave energy. Previous investigations have found that minimal infilling of the existing berth has occurred (WBM 2006). This indicates that the deep water area surrounding the berth has a relatively stable seabed with minimal sediment transport occurring. This is also supported by the minimum maintenance dredging requirements for the port. Since its construction in 1984 only two maintenance dredge activities have occurred at Abbot Point. The first event occurred in 1986 shortly after the initial capital dredging and involved the relocation of approximately 26,000 m 3 of sediment. The second event occurred in August 2008, when capital and maintenance dredging were undertaken for the new Berth 2 and existing Berth 1, respectively which involved the removal of approximately 200,000 m 3 in total of which maintenance dredging made up approximately 17,000 m 3. Terminal 0 Environmental Impact Statement 3-201
.")
16 Figure 3-51 Bathymetry around Abbot Point Figure 3-51 and Figure 3-52 show the nearshore bathymetry at cross-sections at five locations along Abbot Beach, at the existing jetty location and one location to the west (see Figure 3-53 for locations). The bathymetry along Abbot Beach (P01 to P03) is relatively uniform, with the profiles exhibiting a steep drop in bathymetry over the first 50 m from the shore, and a much gentler slope beyond this. P04 is also located to the south-east of the Abbot Point headland, but along the boulder beach stretch and immediately to the north of the MOF which would block some longshore drift. The profile shows a similar steep slope in bathymetry over the first 50 m from the shore, but with little change in bathymetry from a chainage of 50 to 100 m, beyond this it gradually becomes deeper. This feature is likely to be a result of the MOF blocking the nearshore sediment transport, resulting in an offshore bar forming as a result of the longshore transport of sediment bypassing the structure of its seaward extremity. The bathymetry at the jetty (P05) shows another bar which has formed between chainage 150 and 300 m, at this location the bar is likely to be a result of the longshore drift of material around the headland being deflected away from the shoreline as a result of wave and tidal processes. P06 is located on Clark Shoal and accordingly has the shallowest bathymetry of all the profiles, with a relatively uniform gentle slope away from the shoreline. Terminal 0 Environmental Impact Statement 3-202
17 Figure 3-52 Bathymetry at beach cross-sections around Abbot Point Terminal 0 Environmental Impact Statement 3-203

18 Figure 3-53 Location of the beach cross-sections around Abbot Point Sediment Properties It is important to determine the size and distribution of sediment in the location of the proposed structures as well as the adjacent subtidal and intertidal areas. The characteristics of the sediment influence the coastal processes that occur and will also influence how the areas respond to any change in coastal processes. A range of sediment types are present around Abbot Point, with fine silty sands being the dominant sediment type in subtidal areas, and coarser sand, boulders and rocks in the intertidal areas. An assessment of the beaches adjacent to Abbot Point was undertaken by GHD (2009). Sediment samples were collected as part of this work and analysed for a series of beaches adjacent to Abbot Point. Findings from the sampling show Abbot Beach to have medium sand sediment at high water and mean sea level height, and fine gravel and sand at the low water height. Dingo Beach is a boulder covered beach, containing boulders of m in diameter interspersed with some sand. To define the sediment types present in the subtidal areas associated with the Project, data from the proposed dredge berths and surrounding apron associated with the Project (T0), T2 and T3 developments has been used (GHD 2012c). Surficial sediment sampling was undertaken at a number of sites within the area. The surface sediment was found to be predominantly made up of a mixture of sands, silt and clay along with some shell fragments. On average approximately 50% of the material was made up of coarse to fine sand (medium sand being dominant), 30% was silt sized material and 20% was clay. Based on core data collected as part of the same study, around the Terminal 0 Environmental Impact Statement 3-204
19 proposed berths there is a depth of more than 2 m of sand, silt and clay. The composition of the sediment is variable, with layers of sandy gravel, sand, sandy clay, silty clay and clay all occurring. To summarise, the following sediment characteristics are directly relevant for this investigation: The headland at Abbot Point is a rocky outcrop, with approximately 0.5 km from the existing jetty to a sandy beach to the south-east and 2 km to the south-west; Abbot Beach is made up of medium sand and fine gravel; The closest sandy beach to the south-west of the headland is made up of fine sand; and The subtidal area where the proposed T0 berth and approach apron are planned is predominantly sand with some silt and clay Sediment Transport The intertidal and subtidal surface sediments around Abbot Point are predominantly made up of fine to coarse sand. Sediments in the intertidal zone are made up of fine to coarse sand with some gravel and small boulders present around the headlands and some of the beaches. The offshore sediments are predominantly sand with silt and clay also present. The dominant sediment transport processes at Abbot Point are: Offshore transport of sediment through a combination of waves and tidal currents. The wave orbital velocities agitate the sediment and bring it into suspension, which then allows the tidal currents to transport it; and Longshore transport of nearshore sediment in a north-westerly direction as a result of wave activity close to shore. In offshore areas sediment transport is controlled by both waves and tidal currents, while in the nearshore areas where the waves start to break, wave action dominates the sediment transport. Wind and wave processes have been shown to influence tidal currents, with tidal currents in a westerly direction dominating during periods of easterly waves. When there is sufficient wave activity to suspend sediment in the offshore areas, the residual tidal currents will therefore result in a net westerly sediment transport. As such, the net sediment transport direction both in the offshore and nearshore areas will be in a west, north-west direction around Abbot Point. The bed shear stresses (frictional stress on the seabed) resulting from tidal currents, with wind and wave effects included but excluding wave orbital velocities, were calculated at various locations around the proposed Project infrastructure. The critical erosion threshold (bed shear stress value which needs to be exceeded for sediment transport to be initiated) was also calculated, assuming the surface material as fine sand. The results show that at no location are the tidal currents, with wind and wave effects incorporated, sufficient to result in significant sediment transport. This highlights that it is the wave processes which will result in suspension of sediment while the tidal currents then transport the suspended material. Plots of shear stress forces at various points around the Project over water infrastructure are provided in Appendix E3. Depth of closure calculations have shown that sediment transport around Abbot Point generally occurs between Dingo Beach and a depth of 5 m below LAT (-6.63 m AHD). However, the majority of sediment transport will occur between Dingo Beach and a depth of 2.5 m below LAT (-4.13 m AHD), as this is the maximum depth of closure (depth to which active sediment transport occurs) for wave conditions which occur for more than 50% of the time at Abbot Point. Based on the Terminal 0 Environmental Impact Statement 3-205
20 bathymetry at the T1 jetty, sediment transport could occur within 1,000 m of the shoreline, and would generally occur within 500 m of the shoreline. This agrees with previous investigations which found negligible infilling of the existing offshore berth, demonstrating that sediment transport around the offshore end of the infrastructure is minimal (WBM 2006). As a result of the dominance of easterly wave conditions at Abbot Point (see Sub-section ), the net littoral drift is to the north-west. The build-up of sediment to the south of the MOF (Figure 3-47), located at the north end of Abbot Beach, shows the dominant longshore drift is in a northerly direction along this beach. The presence of the rocky headland at Abbot Point, the lack of sand along Dingo Beach and the location of Clark Shoal indicates that there is no longshore drift occurring in the intertidal zone along much of Abbot Point. For sediment to bypass the beaches and rocky intertidal zones west of Abbot Point headland, it would be transported from the Abbot Beach to Clark Shoal which acts as a store of sediment, periodically releasing sediment to the beaches to the south-west of the shoal during large wave events. It is expected that finer fractions of sediment would predominantly be transported around Abbot Point and along the coastline to the west, while much of the coarser material would be transported offshore over time. There has been limited investigation into longshore drift rates at Abbot Point and as such there is a large range of predicted drift rates based on the available information. Previous investigations have estimated that net south to north-west longshore drift rates of between 18,000 and 130,000 m 3 per annum are transported along Abbot Beach (Peter Hollingsworth and Associated Consultants 1979 and 1981; GHD 2009; and GHD 2010). Net longshore drift rates of 8,500 to 18,000 m 3 per annum have been predicted in a westerly direction at the T1 jetty location (GHD 2009; and GHD 2010) Shoreline Evolution EHP has collated maps of the coastal areas in Queensland showing erosion prone areas. Erosion prone areas are considered to be areas subject to inundation by the highest astronomical tides (HAT) or at risk of coastal erosion by the year The areas around Abbot Point identified as erosion prone are not currently subject to long term permanent recession; rather they could be subject to short term erosion as a result of storm events. The areas considered to be at risk are shown as widths of the erosion prone areas in metres measured from the seaward toe of the frontal dune, with the widths applying for the entire section of the coastline shown by the dividing lines (Refer to Appendix E3). The erosion prone areas were updated on 26 January 2012 for the Whitsunday Region Local Government Area. It is likely that the erosion prone areas are conservative and do not fully take into account the hard geological features present around Abbot Point; however, they do provide a comparative rate across the site. Abbot Beach has the widest erosion prone area, with a beach width of 170 m from the toe of the frontal dune being described as erosion prone. Comparison of historic aerial photography from 1971 to 2012 shows that the majority of the shoreline in the Abbot Point region is relatively stable, with little change in alignment occurring. This agrees with findings from an earlier study prior to the construction of the T1 jetty, where it was noted that there was a lack of coastal recession in the area demonstrating that the shoreline surrounding Abbot Point was relatively stable (Peter Hollingsworth and Associated Consultants, 1979 and 1981). A recent aerial photograph of Abbot Point is shown in Figure 3-47 showing the current stable configuration of the headland. The aerial photograph also shows the presence of stable vegetated coastal dunes backing Abbot Beach. To summarise, the following details about the shoreline evolution are directly relevant for this investigation: Terminal 0 Environmental Impact Statement 3-206
21 Previous assessments demonstrate that the shoreline around Abbot Point is relatively stable (no net recession or progradation) and has been so for more than 30 years; None of the Abbot Point headland is prone to recession owing to the boulder beaches and rocky features present; Abbot Beach is prone to the largest potential erosion events (storm bite) relative to the adjacent areas; and The beaches to the south-west of the Abbot Point headland are prone to lower erosion events (storm bite), with rocky features limiting erosion Potential Impacts Some components of the proposed Project have the potential to directly and indirectly impact on coastal processes including tidal currents, wave conditions, sediment transport and water quality during construction and operational phases of the Project. An assessment of the potential adverse and beneficial impacts associated with the Project on the marine and coastal environment is provided in this section. The assessment details the magnitude and extent of any impacts, with any necessary mitigation measures or monitoring activities detailed in Sub-section Given the similarities between the proposed Project and the existing T1 infrastructure, it is useful to review the level of impact resulting from the T1 development as an analogue to help predict possible impacts of the Project. It is therefore important to note that offshore infrastructure associated with T1 had no noticeable adverse impacts on coastal processes at Abbot Point (WBM 2006). GHD s (2012b) assessment on cumulative impacts of existing and proposed offshore infrastructure at Abbot Point, which included detailed coastal processes and 3d hydrodynamic modelling, concluded that trestle structures from the existing T1 and proposed T0, T2, T3 are not expected to have any significant impact on coastal processes (see Section 4 Cumulative and Consequential Impacts). Qualitative techniques have been used to assess the impacts from the Project as numerical modelling is considered unsuitable due to the very small and localised nature of changes to coastal processes and structures. There are limitations in numerical modelling techniques which result in uncertainty in predicting fine scale impacts for structures such as piles relative to a larger coastal/marine environment (e.g. 50 m modelling grids). Accordingly, the qualitative approach applied is considered the most appropriate method in this case. The influence of the proposed jetty and berth structures on coastal processes is determined by the following parameters: Number, size and spacing of the piles in the structure. Construction timing and duration is not expected to be a contributing factor to impacts on coastal processes; Angle between the main axis of the wharf and the direction of the approaching current; Strength of the local current; and Bathymetry. The proposed MOF upgrade also has the potential to impact on coastal processes. Any changes would be most influenced by: Size, location and permeability of protection (rock) structure; Terminal 0 Environmental Impact Statement 3-207
22 Amount and location of dredging (under separate approval to the T0 Project and with NQBP as applicant); and Orientation of MOF structure compared to local current. The potential impacts of the proposed structures on the various aspects of coastal processes are discussed in detail below. It is noted that dredging is not a component of this EIS. Approvals for dredging of the MOF are being undertaken by the Port Authority, NQBP under a separate approval process Local Hydrodynamics The Project design includes duplication replication of the existing jetty for the conveyor section of the jetty along with a new shiploading and berthing structure. The conveyor length of the existing jetty extends from the shoreline at an angle of approximately 20º. The tidal currents along the offshore half of the jetty flow through the jetty at an angle of approximately 10º to 15º off perpendicular, while along the inshore half of the jetty they flow through approximately perpendicular. The tidal currents flow approximately parallel to the berthing wharf. The jetty and berth wharf require similar trestles which have the potential to impact on hydrodynamic flows. A similar trestle configuration to the existing wharf and jetty will be applied, with trestle spacings of approximately 24 m along the jetty and closer together along the wharf. The trestles are only expected to result in small, localised increases in flow velocities owing to the relatively small, localised blockage they cause to the flow. The change in flow velocities would only be localised to the area around the wharf and jetty, with the largest changes occurring adjacent to the trestle piles; no measureable changes in flow velocities or direction are expected to occur away from the wharf or jetty structures. Previous studies have modelled the impacts of trestle piles associated with a jetty similar to the proposed development on tidal currents in the area and predicted changes in localised current speed of less than m/s (GHD 2010). This magnitude of change in tidal current velocities to an area localised around the trestle piles would be considered minor and would not result in any subsequent impacts to the coastal processes. Owing to the MOF only involving a 60 m extension to the existing wharf and the extension running parallel to the coastline, impacts to tidal currents are expected to be minimal. This is supported by modelling undertaken as part of the Abbot Point CIA studies (ELA and OpenLines 2012) Local Waves The open trestle design of the wharf and jetty structures is expected to result in only very minor local changes to the wave conditions. The trestles affect wave energy in their lee, resulting in a slight reduction in wave height; however the difference in height would be almost imperceptible and confined to the area immediately surrounding the piles. The orientation of the jetty relative to the dominant wave conditions ensures any impacts of the trestles are minimised as the wave approach direction is approximately perpendicular to the jetty. During occasional periods when waves approach at a more oblique angle the waves would be influenced by more of the trestle piles and as such impacts would be slightly greater although still considered minor. The orientation of the wharf relative to the dominant wave conditions will result in a greater impact than the jetty on the wave conditions. However, the impacts of the trestles are still expected Terminal 0 Environmental Impact Statement 3-208
23 to be minor and localised especially when considered in relation to the existing conditions which are already modified by the existing wharf. The extension of the wharf related to the MOF will also result in minor wave shielding of the beach in its lee, but will not impact on the overall wave climate for the site (GHD 2012b) Sediment Transport The minor impacts resulting from the proposed overwater infrastructure on tidal currents and waves (environmental drivers of sediment transport) have been shown to be localised around the trestles. Accordingly, any impacts to sediment transport would also be limited to the local area around the structures. The following potential impacts have been considered: Changes to bed shear stress and hence local sediment transport along the length of the structure; Localised scour at the piles; Changes to bed morphology adjacent to the trestles; and Longshore drift of sediment along the coastline. Details of the outcomes from each assessment are provided in the following sections. Local Sediment Transport Given the negligible predicted flow increases resulting from the proposed Project, it is not expected that there will be any changes to local sediment transport at Abbot Point. Modelling carried out for the Project predicts that the trestles from the jetty and wharf would result in very minor and localised increases in flow speeds owing to the partial blocking caused by the piles. The change in flow speed is expected to be in the order of m/s, which would be imperceptible on-site. The Project area currently experiences relatively low peak tidal flows of less than 0.5 m/s which is not sufficient to cause shear stress resulting from tidal currents. The stresses are generally well below the critical erosion threshold for the bed material of 0.15 N/m 2 ; as such any small increases in tidal current speed is not expected to impact on the local sediment transport and no additional sediment erosion of the seabed under the jetty is expected except in areas directly adjacent to the piles where some localised scour may occur. The existing MOF has a rock breakwater that acts as a groyne blocking the movement of sand along the shoreline. The groyne has accreted to capacity and currently bypasses sand. The Project may extend the MOF by up to 60 m in a northerly direction parallel with a slight easterly angel to the coastline (refer to Section 2 Project Details). This effectively results in an extension normal to the beach and direction of sediment transport, of approximately 20 m. This may have the effect of pushing the sediment pathway approximately 20 m further offshore, and increases the groyne effect by an equivalent distance. This will result in a small volume of additional accretion until the groyne capacity is reached, at which time bypass is expected to continue. The lee of the groyne is not further exposed to erosion by the extension as it is a rocky stretch of coast although may have a reduction in sand deposition. Morphology Changes The Project jetty and wharf are proposed to be located immediately east of the existing Terminal offshore. The dominant wave direction in the area is from the east and east-south-east and as a result minor sand shoals would be expected to form to the west of the jetty and wharf. However, as Terminal 0 Environmental Impact Statement 3-209
Australian Coastal Councils Conference
 Australian Coastal Councils Conference Kiama March 2019 Where Has My Beach Gone? (and what can I do about it?) Dr Andrew McCowan Water Technology Where Has My Beach Gone? Where Has My Beach Gone? Where
SELECTION OF THE PREFERRED MANAGEMENT OPTION FOR STOCKTON BEACH APPLICATION OF 2D COASTAL PROCESSES MODELLING
 SELECTION OF THE PREFERRED MANAGEMENT OPTION FOR STOCKTON BEACH APPLICATION OF 2D COASTAL PROCESSES MODELLING C Allery 1 1 DHI Water and Environment, Sydney, NSW Abstract This paper presents an approach
REPORT. Skardon River Bauxite Project - Additional Coastal Assessment. Ports and Coastal Environmental Pty Ltd
 REPORT Skardon River Bauxite Project - Additional Coastal Assessment Client: Ports and Coastal Environmental Pty Ltd Reference: M&APA1066R001F01 Revision: 01/Final Date: 14 March 2016 HASKONING AUSTRALIA
Shoreline Response to an Offshore Wave Screen, Blairgowrie Safe Boat Harbour, Victoria, Australia
 Shoreline Response to an Offshore Wave Screen, Blairgowrie Safe Boat Harbour, Victoria, Australia T.R. Atkins and R. Mocke Maritime Group, Sinclair Knight Merz, P.O. Box H615, Perth 6001, Australia ABSTRACT
IMPACTS OF COASTAL PROTECTION STRATEGIES ON THE COASTS OF CRETE: NUMERICAL EXPERIMENTS
 IMPACTS OF COASTAL PROTECTION STRATEGIES ON THE COASTS OF CRETE: NUMERICAL EXPERIMENTS Tsanis, I.K., Saied, U.M., Valavanis V. Department of Environmental Engineering, Technical University of Crete, Chania,
ST LEONARDS COASTAL HAZARD VULNERABILITY ASSESSMENT
 Level 12, 333 Collins Street Melbourne VIC 3000 Australia Telephone: +61 3 8676 3500 Facsimile: +61 3 8676 3505 www.worleyparsons.com WorleyParsons Services Pty Ltd ABN 61 001 279 812 23 November 2011
# Post Consultation and Submissions Resource Consent Conditions for Surfing Impact Mitigation August 2016
 # Post Consultation and Submissions Resource Consent Conditions for Surfing Impact Mitigation August 2016 Surf Mitigation Management Plan 1 1 Not less than 6 months prior to the commencement of the construction
DUXBURY WAVE MODELING STUDY
 DUXBURY WAVE MODELING STUDY 2008 Status Report Duncan M. FitzGerald Peter S. Rosen Boston University Northeaster University Boston, MA 02215 Boston, MA 02115 Submitted to: DUXBURY BEACH RESERVATION November
Inlet Management Study for Pass-A-Grille and Bunces Pass, Pinellas County, Florida
 Inlet Management Study for Pass-A-Grille and Bunces Pass, Pinellas County, Florida Final Report Submitted By Ping Wang, Ph.D., Jun Cheng Ph.D., Zachary Westfall, and Mathieu Vallee Coastal Research Laboratory
Appendix E Cat Island Borrow Area Analysis
 Appendix E Cat Island Borrow Area Analysis ERDC/CHL Letter Report 1 Cat Island Borrow Area Analysis Multiple borrow area configurations were considered for Cat Island restoration. Borrow area CI1 is located
Beach profile surveys and morphological change, Otago Harbour entrance to Karitane May 2014 to June 2015
 Beach profile surveys and morphological change, Otago Harbour entrance to Karitane May 2014 to June 2015 Prepared for Port Otago Ltd Martin Single September 2015 Shore Processes and Management Ltd Contact
Request Number IR1-12: Flow Passage. Information Request
 Request Number IR1-12: Flow Passage Information Request Provide additional information about the 100 metre flow passage channel scenario between the Westshore Terminals and the proposed Project terminal
THE HYDRAULIC AND MORPHOLOGICAL RESPONSE OF A LARGE COASTAL LAKE TO RISING SEA LEVELS
 THE HYDRAULIC AND MORPHOLOGICAL RESPONSE OF A LARGE COASTAL LAKE TO RISING SEA LEVELS Mr Evan K Watterson 1 Dr Joanna M Burston 1 Ms Heather Stevens 2 Mr Dan J Messiter 1 1 Author affiliation: WorleyParsons
Chapter 10 Lecture Outline. The Restless Oceans
 Chapter 10 Lecture Outline The Restless Oceans Focus Question 10.1 How does the Coriolis effect influence ocean currents? The Ocean s Surface Circulation Ocean currents Masses of water that flow from one
Shorelines Earth - Chapter 20 Stan Hatfield Southwestern Illinois College
 Shorelines Earth - Chapter 20 Stan Hatfield Southwestern Illinois College The Shoreline A Dynamic Interface The shoreline is a dynamic interface (common boundary) among air, land, and the ocean. The shoreline
LAB: WHERE S THE BEACH
 Name: LAB: WHERE S THE BEACH Introduction When you build a sandcastle on the beach, you don't expect it to last forever. You spread out your towel to sunbathe, but you know you can't stay in the same spot
April 7, Prepared for: The Caribbean Disaster Emergency Response Agency Prepared by: CEAC Solutions Co. Ltd.
 April 7, 2006 Prepared for: The Caribbean Disaster Emergency Response Agency Prepared by: Introduction CEAC Solutions Co. Ltd was commissioned in May 2005 to prepare coastal beach erosion hazard maps for
Technical Brief - Wave Uprush Analysis Island Harbour Club, Gananoque, Ontario
 Technical Brief - Wave Uprush Analysis RIGGS ENGINEERING LTD. 1240 Commissioners Road West Suite 205 London, Ontario N6K 1C7 October 31, 2014 Table of Contents Section Page Table of Contents... i List
HURRICANE SANDY LIMITED REEVALUATION REPORT UNION BEACH, NEW JERSEY DRAFT ENGINEERING APPENDIX SUB APPENDIX D SBEACH MODELING
 HURRICANE SANDY LIMITED REEVALUATION REPORT UNION BEACH, NEW JERSEY DRAFT ENGINEERING APPENDIX SUB APPENDIX D SBEACH MODELING Rev. 18 Feb 2015 1 SBEACH Modeling 1.0 Introduction Following the methodology
INTRODUCTION TO COASTAL ENGINEERING
 The University of the West Indies Organization of American States PROFESSIONAL DEVELOPMENT PROGRAMME: COASTAL INFRASTRUCTURE DESIGN, CONSTRUCTION AND MAINTENANCE A COURSE IN COASTAL DEFENSE SYSTEMS I CHAPTER
HARBOUR SEDIMENTATION - COMPARISON WITH MODEL
 HARBOUR SEDIMENTATION - COMPARISON WITH MODEL ABSTRACT A mobile-bed model study of Pointe Sapin Harbour, in the Gulf of St. Lawrence, resulted in construction of a detached breakwater and sand trap to
Appendix D: SWAN Wave Modelling
 Appendix D: SWAN Wave Modelling D.1 Preamble The Eurobodalla Shire Council area is subject to extreme waves originating from offshore storms. When swell waves approach the coast, they are modified by the
Implications of proposed Whanganui Port and lower Whanganui River dredging
 PO Box 637 Wanganui 4540 Attention: Rowan McGregor Dear Rowan 1 Summary We understand that it has been proposed to bring large vessels into the Port at Whanganui requiring the excavation of a channel up
Julebæk Strand. Effect full beach nourishment
 Julebæk Strand Effect full beach nourishment Aim of Study This study is a part of the COADAPT funding and the aim of the study is to analyze the effect of beach nourishment. In order to investigate the
Currents measurements in the coast of Montevideo, Uruguay
 Currents measurements in the coast of Montevideo, Uruguay M. Fossati, D. Bellón, E. Lorenzo & I. Piedra-Cueva Fluid Mechanics and Environmental Engineering Institute (IMFIA), School of Engineering, Research
Lecture Outlines PowerPoint. Chapter 15 Earth Science, 12e Tarbuck/Lutgens
 Lecture Outlines PowerPoint Chapter 15 Earth Science, 12e Tarbuck/Lutgens 2009 Pearson Prentice Hall This work is protected by United States copyright laws and is provided solely for the use of instructors
OECS Regional Engineering Workshop September 29 October 3, 2014
 B E A C H E S. M A R I N A S. D E S I G N. C O N S T R U C T I O N. OECS Regional Engineering Workshop September 29 October 3, 2014 Coastal Erosion and Sea Defense: Introduction to Coastal Dynamics David
Appendix M: Durras Lake Tailwater Conditions
 Appendix M: Durras Lake Tailwater Conditions M.1 Preamble WRL has completed a tailwater condition assessment for the entrance to Durras Lake, to be used as an ocean boundary condition for a future flood
Oceans and Coasts. Chapter 18
 Oceans and Coasts Chapter 18 Exploring the oceans The ocean floor Sediments thicken and the age of the seafloor increases from ridge to shore The continental shelf off the northeast United States Constituent
Available online at ScienceDirect. Procedia Engineering 116 (2015 )
") Available online at www.sciencedirect.com ScienceDirect Procedia Engineering 116 (2015 ) 320 325 8th International Conference on Asian and Pacific Coasts (APAC 2015) Department of Ocean Engineering, IIT
Available online at www.sciencedirect.com ScienceDirect Procedia Engineering 116 (2015 ) 320 325 8th International Conference on Asian and Pacific Coasts (APAC 2015) Department of Ocean Engineering, IIT
: Hydrodynamic input for 2D Vessel Simulations (HY- 0027)
") Technical Note To : Christian Taylor (PoHDA) From : Rohan Hudson Cc : Ben Gray Date : 1/04/2015 (Final Draft) Subject : Hydrodynamic input for 2D Vessel Simulations (HY- 0027) Introduction This Technical
Technical Note To : Christian Taylor (PoHDA) From : Rohan Hudson Cc : Ben Gray Date : 1/04/2015 (Final Draft) Subject : Hydrodynamic input for 2D Vessel Simulations (HY- 0027) Introduction This Technical
CROSS-SHORE SEDIMENT PROCESSES
 The University of the West Indies Organization of American States PROFESSIONAL DEVELOPMENT PROGRAMME: COASTAL INFRASTRUCTURE DESIGN, CONSTRUCTION AND MAINTENANCE A COURSE IN COASTAL DEFENSE SYSTEMS I CHAPTER
MIAMI BEACH 32ND STREET HOT SPOT: NUMERICAL MODELING AND DESIGN OPTIMIZATION. Adam Shah - Coastal Engineer Harvey Sasso P.E.
 ABSTRACT MIAMI BEACH 32ND STREET HOT SPOT: NUMERICAL MODELING AND DESIGN OPTIMIZATION Adam Shah - Coastal Engineer Harvey Sasso P.E. - Principal Coastal Systems International, Inc. 464 South Dixie Highway
Volume and Shoreline Changes along Pinellas County Beaches during Tropical Storm Debby
 Volume and Shoreline Changes along Pinellas County Beaches during Tropical Storm Debby Ping Wang and Tiffany M. Roberts Coastal Research Laboratory University of South Florida July 24, 2012 Introduction
Figure 4, Photo mosaic taken on February 14 about an hour before sunset near low tide.
 The Impact on Great South Bay of the Breach at Old Inlet Charles N. Flagg and Roger Flood School of Marine and Atmospheric Sciences, Stony Brook University Since the last report was issued on January 31
BYPASS HARBOURS AT LITTORAL TRANSPORT COASTS
 BYPASS HARBOURS AT LITTORAL TRANSPORT COASTS by K. Mangor 1, I. Brøker 2, R. Deigaard 3 and N. Grunnet 4 ABSTRACT Maintaining sufficient navigation depth in front of the entrance at harbours on littoral
VOLUME B: AIRPORT AND SURROUNDS Coastal Processes and Natural Features NEW PARALLEL RUNWAY DRAFT EIS/MDP FOR PUBLIC COMMENT B4-148
 B4 VOLUME B: AIRPORT AND SURROUNDS Coastal Processes and Natural Features B4-148 B4 VOLUME B: AIRPORT AND SURROUNDS Coastal Processes and Natural Features CONTENTS 4.1 Introduction 153 4.2 Proposed Development
Technical Brief - Wave Uprush Analysis 129 South Street, Gananoque
 Technical Brief - Wave Uprush Analysis 129 South Street, Gananoque RIGGS ENGINEERING LTD. 1240 Commissioners Road West Suite 205 London, Ontario N6K 1C7 June 12, 2013 Table of Contents Section Page Table
COFFS HARBOUR SEDIMENT MODELLING AND INVESTIGATION
 COFFS HARBOUR SEDIMENT MODELLING AND INVESTIGATION Luke McAvoy Undergraduate Engineer (Civil) Griffith School of Engineering, Griffith University, Gold Coast, Australia Daniel Rodger Senior Engineer Water
NORTHERN CELL OPTIONS SHORTLIST RECOMMENDATIONS
 OPTIONS SHORTLIST RECOMMENDATIONS Coastal Unit C: Bayview Options recommended for MCDA scoring. Status quo. Planting 3. Renourishment (gravel) 6. Beach-scraping 7. Restore shingle crest. Inundation accommodation
14.0 MARINE ENVIRONMENT
 14.0 MARINE ENVIRONMENT 14.1 INTRODUCTION This Chapter provides an assessment of the physical and ecological effects of the proposed marine facilities in Rupert s Bay. The proposed works at Rupert s Bay
Reading Material. Inshore oceanography, Anikouchine and Sternberg The World Ocean, Prentice-Hall
 Reading Material Inshore oceanography, Anikouchine and Sternberg The World Ocean, Prentice-Hall BEACH PROCESSES AND COASTAL ENVIRONMENTS COASTAL FEATURES Cross section Map view Terminology for Coastal
CHAPTER 134 INTRODUCTION
 CHAPTER 134 NEW JETTIES FOR TUNG-KANG FISHING HARBOR, TAIWAN Chi-Fu Su Manager Engineering Department Taiwan Fisheries Consultants, Inc. Taipei, Taiwan INTRODUCTION Tung-Kang Fishing Harbor, which is about
The Impact on Great South Bay of the Breach at Old Inlet Charles N. Flagg School of Marine and Atmospheric Sciences, Stony Brook University
 The Impact on Great South Bay of the Breach at Old Inlet Charles N. Flagg School of Marine and Atmospheric Sciences, Stony Brook University The previous report provided a detailed look at the conditions
page - Laboratory Exercise #5 Shoreline Processes
 page - Laboratory Exercise #5 Shoreline Processes Section A Shoreline Processes: Overview of Waves The ocean s surface is influenced by three types of motion (waves, tides and surface currents). Shorelines
ACOUSTIC DOPPLER CURRENT PROFILING FROM KIRRA BEACH TO COOK ISLAND FIELD EXERCISES UNDERTAKEN BY THE TWEED RIVER ENTRANCE SAND BYPASSING PROJECT
 ACOUSTIC DOPPLER CURRENT PROFILING FROM KIRRA BEACH TO COOK ISLAND FIELD EXERCISES UNDERTAKEN BY THE TWEED RIVER ENTRANCE SAND BYPASSING PROJECT Z Helyer 1, C Acworth 1, K Nielsen 1, 1 Coastal Impacts
CHAPTER 8 ASSESSMENT OF COASTAL VULNERABILITY INDEX
 124 CHAPTER 8 ASSESSMENT OF COASTAL VULNERABILITY INDEX 8.1 INTRODUCTION In order to assess the vulnerability of the shoreline considered under this study against the changing environmental conditions,
Cross-shore sediment transports on a cut profile for large scale land reclamations
 Cross-shore sediment transports on a cut profile for large scale land reclamations Martijn Onderwater 1 Dano Roelvink Jan van de Graaff 3 Abstract When building a large scale land reclamation, the safest
COUPLED MANAGEMENT STRATEGY LAKE CATHIE ESTUARY & COAST
 Lake Cathie Progress Association Inc. ABN 28 251 433 854 P.O. Box 247 Lake Cathie NSW 2445 PHONE/FAX: 02 6584 8211 EMAIL: r3packag@bigpond.com 20 th October 2009 Port Macquarie Hastings Council PO Box
EVALUATION OF BEACH EROSION UP-DRIFT OF TIDAL INLETS IN SOUTHWEST AND CENTRAL FLORIDA, USA. Mohamed A. Dabees 1 and Brett D.
 EVALUATION OF BEACH EROSION UP-DRIFT OF TIDAL INLETS IN SOUTHWEST AND CENTRAL FLORIDA, USA Mohamed A. Dabees 1 and Brett D. Moore 1 The paper discusses the analysis of up-drift beach erosion near selected
SAND BOTTOM EROSION AND CHANGES OF AN ACTIVE LAYER THICKNESS IN THE SURF ZONE OF THE NORDERNEY ISLAND
 SAND BOTTOM EROSION AND CHANGES OF AN ACTIVE LAYER THICKNESS IN THE SURF ZONE OF THE NORDERNEY ISLAND Kos'yan R. 1, Kunz H. 2, Podymov l. 3 1 Prof.Dr.,The Southern Branch of the P.P.Shirshov Institute
To: William Woods, Jenni Austin Job No: CentrePort Harbour Deepening Project - Comments on community queries
 Memo To: William Woods, Jenni Austin From: Richard Reinen-Hamill Date: Subject: cc: 1 Purpose This memo sets out our response to issues raised at and after Seatoun community consultation sessions held
CMS Modeling of the North Coast of Puerto Rico
 CMS Modeling of the North Coast of Puerto Rico PRESENTED BY: Dr. Kelly Rankin Legault, Ph.D., P.E. 1 Dr. Alfredo Torruella, Ph.D. 2 1 USACE Jacksonville District 2 University of Puerto Rico October 2016
SORTING AND SELECTIVE MOVEMENT OF SEDIMENT ON COAST WITH STEEP SLOPE- MASUREMENTS AND PREDICTION
 SORTING AND SELECTIVE MOVEMENT OF SEDIMENT ON COAST WITH STEEP SLOPE- MASUREMENTS AND PREDICTION Toshiro San-nami 1, Takaaki Uda 2, Masumi Serizawa 1 and Toshinori Ishikawa 2 Conveyer belts carrying gravel
Inspection of Clarence City Beaches following Winter 2011 Storm Events
 18 July 2011 WRL Ref: WRL10086TDS L20110718 Messrs P Watson & I Preece Clarence City Council PO Box 96 Rosny Park TAS 7018 By email: pwatson@ccc.tas.gov.au ipreece@ccc.tas.gov.au Dear Phil/Ian, Inspection
C3 VOLUME C: MIDDLE BANKS, MORETON BAY. Coastal Processes and Natural Features NEW PARALLEL RUNWAY DRAFT EIS/MDP FOR PUBLIC COMMENT C3-42
 C3 VOLUME C: MIDDLE BANKS, MORETON BAY Coastal Processes and Natural Features C3-42 C3 VOLUME C: MIDDLE BANKS, MORETON BAY Coastal Processes and Natural Features CONTENTS 3.1 Introduction 48 3.2 Proposed
Low-crested offshore breakwaters: a functional tool for beach management
 Environmental Problems in Coastal Regions VI 237 Low-crested offshore breakwaters: a functional tool for beach management K. Spyropoulos & E. Andrianis TRITON Consulting Engineers, Greece Abstract Beach
Marine Renewables Industry Association. Marine Renewables Industry: Requirements for Oceanographic Measurements, Data Processing and Modelling
 Marine Renewables Industry Association Marine Renewables Industry: Requirements for Oceanographic Measurements, Data Processing and Modelling October 2009 Table of Contents 1. Introduction... 1 2. Measurements
SURFACE CURRENTS AND TIDES
 NAME SURFACE CURRENTS AND TIDES I. Origin of surface currents Surface currents arise due to the interaction of the prevailing wis a the ocean surface. Hence the surface wi pattern (Figure 1) plays a key
Chapter. The Dynamic Ocean
 Chapter The Dynamic Ocean An ocean current is the mass of ocean water that flows from one place to another. 16.1 The Composition of Seawater Surface Circulation Surface Currents Surface currents are movements
Wave-dominated embayed beaches. Andrew D Short School of Geosciences University of Sydney
 Wave-dominated embayed beaches Andrew D Short School of Geosciences University of Sydney Wave-dominated embayed beaches wave-dominated beaches embayed beaches morphodynamics of W-D embayed beaches circulation,
Appendix 3. Hydrodynamic and sedimentation studies
 Appendix 3 Report EX 4945 Rev 3.0 November 2004 Document Information Project Report title Client Borough of Poole Client Representative Mr Stuart Terry Project No. DDR3553 Report No. EX 4945 Doc. ref.
Coastal Change and Conflict
 Coastal Change and Conflict Outline of the Topic Contrasting Coasts why do all coasts not look the same? Geology of the coast the impact rock structure has on the coastline Waves Constructive and destructive
Impacts of breakwaters and training walls
 Across the eastern seaboard of Australia, breakwaters and training walls have instigated fundamental perturbations to coastal and estuary processes. This has induced long-term changes to foreshore alignments,
Coastal Inundation. An Overview for TCDC
 Coastal Inundation An Overview for TCDC Rick Liefting Team Leader Regional Hazards and Environmental Compliance Integrated Catchment Management Waikato Regional Council Photo: Sugar Loaf Wharf, Coromandel.
Appendix 5: Currents in Minas Basin. (Oceans Ltd. 2009)
") Appendix 5: Currents in Minas Basin (Oceans Ltd. 29) Current in Minas Basin May 1, 28 March 29, 29 Submitted To: Minas Basin Pulp and Power P.O. Box 41 53 Prince Street Hansport, NS, BP 1P by 22, Purdy
Appendix 5: Currents in Minas Basin (Oceans Ltd. 29) Current in Minas Basin May 1, 28 March 29, 29 Submitted To: Minas Basin Pulp and Power P.O. Box 41 53 Prince Street Hansport, NS, BP 1P by 22, Purdy
Concepts & Phenomena
 Concepts & Phenomena in coastal and port sedimentation R. Kamalian Ports and Maritime Organization of Iran and PIANC-Iran 7 9 December 2015 What is the problem? Many harbours have sedimentation problems
Artificial headlands for coastal restoration
 Artificial headlands for coastal restoration J. S. Mani Professor, Department of Ocean Engineering, Indian Institute of Technology Madras, Chennai 636, India Abstract Construction of a satellite harbour
STORM RESPONSE SIMULATION
 APPENDIX V STORM RESPONSE SIMULATION Final Environmental Impact Statement Village of Bald Head Island Shoreline Protection Project Brunswick County, North Carolina Delft3D Storm Response Simulations With
Shoreline changes and reef strengthening at Kavaratti island in Lakshadweep Archipelago - A case study
 Indian Journal of Geo-Marine Sciences Vol. 43(7), July 2014, pp. 1140-1144 Shoreline changes and reef strengthening at Kavaratti island in Lakshadweep Archipelago - A case study T.N.Prakash*, L.Sheela
Long Beach Island Holgate Spit Little Egg Inlet Historical Evolution Introduction Longshore Transport Map, Survey and Photo Historic Sequence
 Appendix B Long Beach Island Holgate Spit Little Egg Inlet Historical Evolution Introduction The undeveloped southern end of Long Beach Island (LBI) is referred to as the Holgate spit as it adjoins the
Delaware Chapter Surfrider Foundation - Indian River Inlet Monitoring
 Delaware Chapter Surfrider Foundation - Indian River Inlet Monitoring In 2012, the Delaware Surfrider Foundation Chapter formed the Surf Quality and Access Committee to focus on issues such as surf spot
Beach Nourishment Impact on Beach Safety and Surfing in the North Reach of Brevard County, Florida
 Beach Nourishment Impact on Beach Safety and Surfing in the North Reach of Brevard County, Florida Prepared by John Hearin, Ph.D. Coastal Engineering Vice Chairman Cocoa Beach Chapter Port Canaveral Patrick
Nearshore Morphodynamics. Bars and Nearshore Bathymetry. Sediment packages parallel to shore, that store beach sediment
 Nearshore Morphodynamics http://coastal.er.usgs.gov/bier/images/chandeleur-xbeach-lg.jpg Bars and Nearshore Bathymetry Sediment packages parallel to shore, that store beach sediment Can be up to 50 km
EXISTING AND PLANNED STRATEGIES AND ACTIONS CONNECTED WITH COASTAL PROTECTION IN ASPECT OF PREDICTED SEA LEVEL RISE
 EXISTING AND PLANNED STRATEGIES AND ACTIONS CONNECTED WITH COASTAL PROTECTION IN ASPECT OF PREDICTED SEA LEVEL RISE Andrzej Cieślak Long term coastal protection strategy In 2000 a new 1 Polish long term
E4014 Construction Surveying. Hydrographic Surveys
 E4014 Construction Surveying Hydrographic Surveys Charts And Maps Hydrographic Chart an information medium and a tool for maritime traffic for the safety and ease of navigation contains information on
SWASH MODELLING OF A COASTAL PROTECTION SCHEME
 SWASH MODELLING OF A COASTAL PROTECTION SCHEME Mark Klein 1, Andrew Symonds 2, Marcel Zijlema 3, Dan Messiter 4 and Michael Dufour 5 The Beresford shoreline, Australia, is subject to a complex interaction
The Islands. Barbados. A prefeasibility study. R. Drieman M. Hinborch M. Monden E.A.J. Vendrik
 The Islands Barbados A prefeasibility study R. Drieman M. Hinborch M. Monden E.A.J. Vendrik General notice to the reader: In the academic programme for Hydraulic Engineering we have in the 4th year (i.e.
INTRODUCTION TO COASTAL ENGINEERING AND MANAGEMENT
 Advanced Series on Ocean Engineering Volume 16 INTRODUCTION TO COASTAL ENGINEERING AND MANAGEMENT J. William Kamphuis Queen's University, Canada World Scientific Singapore New Jersey London Hong Kong Contents
BEACH PROCESSES AND COASTAL ENVIRONMENTS
 BEACH PROCESSES AND COASTAL ENVIRONMENTS COASTAL FEATURES Cross section Map view TOPICS: Terminology Waves Beach Morphology Barriers Coastal Migration Tides Tidal Flats and Marshes Sediment Budgets Human
Taranaki Tsunami Inundation Analysis. Prepared for Taranaki Civil Defence Emergency Management Group. Final Version
 Taranaki Tsunami Inundation Analysis Prepared for Taranaki Civil Defence Emergency Management Group Final Version June 2012 AM 12/07 HBRC Plan Number 4362 Asset Management Group Technical Report Prepared
Compiled by Uwe Dornbusch. Edited by Cherith Moses
 REPORT ON WAVE AND TIDE MEASUREMENTS Compiled by Uwe Dornbusch. Edited by Cherith Moses 1 Aims...1 2 Summary...1 3 Introduction...1 4 Site selection...1 5 Wave recorder settings...2 6 Results...2 6.1 Water
Undertow - Zonation of Flow in Broken Wave Bores
 Nearshore Circulation Undertow and Rip Cells Undertow - Zonation of Flow in Broken Wave Bores In the wave breaking process, the landward transfer of water, associated with bore and surface roller decay
Hinchinbrook Shire Council Report for Forrest Beach Boat Ramp. Options Report
 Hinchinbrook Shire Council Report for Forrest Beach Boat Ramp August 2010 Contents 1. Introduction 1 1.1 Background 1 1.2 Scope of Works 1 2. Study Parameters 2 2.1 Location 2 2.2 Environmental Data 2
POOLE HARBOUR APPROACH CHANNEL DEEPENING EIA: SEDIMENT MANAGEMENT PLAN
 POOLE HARBOUR APPROACH CHANNEL DEEPENING EIA: SEDIMENT MANAGEMENT PLAN 1. Introduction The purpose of the Poole Harbour Sediment Management Plan (SedMP) is twofold: to mitigate the predicted impact of
consulting engineers and scientists
 consulting engineers and scientists Coastal Processes Presented by: January 9, 2015 Varoujan Hagopian, P.E. F.ASCE Senior Consultant, Waterfront Engineer Living Shoreline Workshop Lets Remember Why We
3/9/2013. Build house on cliff for a view of the ocean - be one with said view Pearson Education, Inc. Shorelines: summary in haiku form
 Introduction to Environmental Geology, 5e Edward A. Keller Shorelines: summary in haiku form Chapter 11 Coastal Processes Lecture Presentation prepared by X. Mara Chen, Salisbury University Build house
Performance of Upham Beach T-Groin Project and Its Impact to the Downdrift Beach
 Performance of Upham Beach T-Groin Project and Its Impact to the Downdrift Beach Progress Report for the Period of October 2008 to April 2009 Submitted by Ping Wang, Ph.D., and Tiffany M. Roberts Department
Exemplar for Internal Assessment Resource Geography Level 3. Resource title: The Coastal Environment Kaikoura
 Exemplar for internal assessment resource Geography 3.5A for Achievement Standard 91430 Exemplar for Internal Assessment Resource Geography Level 3 Resource title: The Coastal Environment Kaikoura This
UPPER BEACH REPLENISHMENT PROJECT RELATED
 ASSESSMENT OF SAND VOLUME LOSS at the TOWNSHIP of UPPER BEACH REPLENISHMENT PROJECT RELATED to the LANDFALL OF HURRICANE SANDY - PURSUANT TO NJ-DR 4086 This assessment is in response to Hurricane Sandy
2. Water levels and wave conditions. 2.1 Introduction
 18 2. Water levels and wave conditions 2.1 Introduction This Overtopping Manual has a focus on the aspects of wave run-up and wave overtopping only. It is not a design manual, giving the whole design process
Undertow - Zonation of Flow in Broken Wave Bores
 Lecture 22 Nearshore Circulation Undertow - Zonation of Flow in Broken Wave Bores In the wave breaking process, the landward transfer of water, associated with bore and surface roller decay within the
CLAM PASS RESTORATION AND MANAGEMENT PLAN BATHYMETRIC MONITORING REPORT NO. 7 Including Interior Bay Dredge Cuts and Tidal Data
 CLAM PASS RESTORATION AND MANAGEMENT PLAN BATHYMETRIC MONITORING REPORT NO. 7 Including Interior Bay Dredge Cuts and Tidal Data Submitted to: Florida Department of Environmental Protection DEP File No.
Variation in Beach Profile and Sediment Characteristics at Popham Beach, Phippsburg, ME
 Colby College Digital Commons @ Colby Undergraduate Research Symposium Student Research 2006 Variation in Beach Profile and Sediment Characteristics at Popham Beach, Phippsburg, ME Kathryn Lidington Colby
SAND ACCUMULATION IN WAVE-SHELTER ZONE OF OHARAI PORT AND CHANGE IN GRAIN SIZE OF SEABED MATERIALS ON NEARBY COAST
 SAND ACCUMULATION IN WAVE-SHELTER ZONE OF OHARAI PORT AND CHANGE IN GRAIN SIZE OF SEABED MATERIALS ON NEARBY COAST Takeo Matsu-ura, Takaaki Uda, Takayuki Kumada and Michio Sumiya Beach changes around facing
Deep-water orbital waves
 What happens when waves approach shore? Deep-water orbital waves Fig. 9.16, p. 211 Wave motion is influenced by water depth and shape of the shoreline wave buildup zone surf zone beach Wave base deepwater
An Update of Coastal Erosion in Puerto Rico
 Jack Morelock and Maritza Barreto An Update of Coastal Erosion in Puerto Rico Department of Marine Sciences, University of Puerto Rico at Mayagüez and Geography Department, University of Puerto Rico at
STATUS REPORT FOR THE SUBMERGED REEF BALL TM ARTIFICIAL REEF SUBMERGED BREAKWATER BEACH STABILIZATION PROJECT FOR THE GRAND CAYMAN MARRIOTT HOTEL
 August 23 STATUS REPORT FOR THE SUBMERGED REEF BALL TM ARTIFICIAL REEF SUBMERGED BREAKWATER BEACH STABILIZATION PROJECT FOR THE GRAND CAYMAN MARRIOTT HOTEL performed by Lee E. Harris, Ph.D., P.E. Consulting
MESSOLOGI LAGOON AREA (GREECE)
") MESSOLOGI LAGOON AREA (GREECE) 20 Contact: Kyriakos SPYROPOULOS TRITON Consulting Engineers 90 Pratinou Str. 11634 Athens (GREECE) Tel: +32 10 729 57 61 Fax: +32 10 724 33 58 e-mail: kspyropoulos@tritonsa.gr
MESSOLOGI LAGOON AREA (GREECE) 20 Contact: Kyriakos SPYROPOULOS TRITON Consulting Engineers 90 Pratinou Str. 11634 Athens (GREECE) Tel: +32 10 729 57 61 Fax: +32 10 724 33 58 e-mail: kspyropoulos@tritonsa.gr
PHYSICAL MODELLING AND DESIGN FOR SHORELINE REDEVELOPMENT ON THE SOUTH COAST OF BARBADOS
 Proceedings of the 6 th International Conference on the Application of Physical Modelling in Coastal and Port Engineering and Science (Coastlab16) Ottawa, Canada, May 10-13, 2016 Copyright : Creative Commons