US 1 Roosevelt Boulevard Corridor Study TABLE OF CONTENTS. 1.0 Executive Summary Purpose and Need Land Use...
|
|
|
- Godfrey Crawford
- 5 years ago
- Views:
Transcription
1
2
3
4 Created in 1965, the Delaware Valley Regional Planning Commission (DVRPC) is an interstate, intercounty and intercity agency that provides continuing, comprehensive and coordinated planning to shape a vision for the future growth of the Delaware Valley region. The region includes Bucks, Chester, Delaware, and Montgomery counties, as well as the City of Philadelphia, in Pennsylvania; and Burlington, Camden, Gloucester and Mercer counties in New Jersey. DVRPC provides technical assistance and services; conducts high priority studies that respond to the requests and demands of member state and local governments; fosters cooperation among various constituents to forge a consensus on diverse regional issues; determines and meets the needs of the private sector; and practices public outreach efforts to promote two-way communication and public awareness of regional issues and the Commission. Our logo is adapted from the official DVRPC seal, and is designed as a stylized image of the Delaware Valley. The outer ring symbolizes the region as a whole, while the diagonal bar signifies the Delaware River. The two adjoining crescents represent the Commonwealth of Pennsylvania and the State of New Jersey. DVRPC is funded by a variety of funding sources including federal grants from the U.S. Department of Transportation s Federal Highway Administration (FHWA) and Federal Transit Administration (FTA), the Pennsylvania and New Jersey departments of transportation, as well as by DVRPC s state and local member governments. The authors, however, are solely responsible for its findings and conclusions, which may not represent the official views or policies of the funding agency. DVRPC fully complies with Title VI of the Civil Rights Act of 1964 and related statutes and regulations in all programs and activities. DVRPC s website may be translated into Spanish, Russian, and Traditional Chinese online by visiting Publications and other public documents can be made available in alternative languages or formats, if requested. For more information, please call (215)
5 US 1 Roosevelt Boulevard Corridor Study i TABLE OF CONTENTS 1.0 Executive Summary Purpose and Need Land Use Demographics Population and Employment Age Public Transportation Environmental Justice Public Transit Service Bus Network Future Rail Service Crosswalk Analysis Crosswalk Analysis Overview Intersection Crosswalks Mid-Block Crosswalks Long-Term Mobility Improvement Lane Crossover Redesign Boulevard Lane Reduction and Consolidation Implementation Plan LIST OF MAPS 1 Land Use (2000) Total Population of Ages 6 through Workers Using Public Transportation Environmental Justice Degrees of Disadvantage Crossover Locations Panel Crossover Locations Panel Crossover Locations Panel Crossover Locations Panel Crossover Locations Panel
6 ii US 1 Roosevelt Boulevard Corridor Study LIST OF FIGURES 1 Study Area Bus Service Roosevelt Boulevard near Welsh Road Roosevelt Boulevard at Cottman Avenue (SE Quadrant) Crosswalk Safety Educational Sign Ninth Street and Roosevelt Boulevard Fifth Street and Roosevelt Boulevard North Front Street and Roosevelt Boulevard Rising Sun Avenue and Roosevelt Boulevard C Street and Roosevelt Boulevard F Street and Roosevelt Boulevard Bridge Street and Roosevelt Boulevard Harbison Avenue and Roosevelt Boulevard Tyson Avenue and Roosevelt Boulevard Cottman Avenue and Roosevelt Boulevard Rhawn Street and Roosevelt Boulevard Welsh Road and Roosevelt Boulevard Grant Avenue and Roosevelt Boulevard At Bingham Street and Rorer Street At Smylie Road At Garland Street and Whitaker Avenue At Sanger Street At Benner Street At Unruh Avenue At Longshore Avenue Between Princeton Avenue and Friendship Street Between Friendship Street and Saint Vincent Avenue Between Shelmire Avenue and Faunce Street At Loney Street Five-Lane Cross Section Concept Existing Roadway Configuration Conflict Points Proposed Roadway Configuration Conflict Points... 85
7 US 1 Roosevelt Boulevard Corridor Study iii LIST OF TABLES 1 Study Corridor Land Use Population Forecasts for Philadelphia and Select Planning Areas Employment Forecasts for Philadelphia and Select Planning Areas Population by Age Environmental Justice Populations and Concentrations Summary of Crosswalk Recommendations Southbound Crossovers Northbound Crossovers Summary of Crossover Recommendations Improvements Implementation Matrix LIST OF APPENDICES I. Summary of Pedestrian Count Data II. Wednesday, May 16 Pedestrian Count Data III. Thursday, May 17 Pedestrian Count Data IV. Saturday, May 19 Pedestrian Count Data V. Five-Lane Cross Section Concept
8 [This page intentionally left blank]
9 US 1 Roosevelt Boulevard Corridor Study EXECUTIVE SUMMARY The US 1 Roosevelt Boulevard Corridor Study was conducted by the Delaware Valley Regional Planning Commission (DVRPC) to address the transportation and safety issues within the corridor. The study area extends along US 1, the Boulevard, in Philadelphia, from Ninth Street to Grant Avenue, a distance of approximately 8 miles. The Boulevard is a major north-south twelve-lane artery that runs parallel to, and serves as an alternate route for, I-95, which is located to the east. This high volume roadway lies next to a dense urbanized population housed primarily in row homes and other multifamily dwellings, which produces high pedestrian traffic. Conflict between pedestrian traffic and vehicular traffic has led to numerous fatalities over the years. This study documents the existing conditions and identifies operational and safety improvements for corridor traffic. In an effort to define improvement strategies for this corridor, a field assessment was conducted at nine intersection crosswalks and 11 mid-block crosswalks along Roosevelt Boulevard on typical weekdays, and at four intersection crosswalks on a typical Saturday. These assessments identified utilization rates of crosswalks along the Boulevard, underutilized crosswalks, crosswalks with a potential for consolidation, and priorities based on use. As a result of this assessment, improvements, such as installing pedestrian countdown signals with illuminated pedestrian push buttons, restriping all crosswalks using the international style, installing crosswalk safety educational signs, and retiming pedestrian crossing time allowance, were recommended as improvements. All 37 roadway crossovers in the corridor were also evaluated to determine how their safety and operation can be improved. It was determined that crossovers should be lengthened only where it is possible to create a significant increase in length. Doing so would allow for an upgrade in functionality. In general, crossovers that are closer than one-quarter mile to another crossover, and adjacent crossovers of different types were identified to be eliminated. Improved signage that marks crossover locations was also recommended. In total, twelve crossovers were targeted for elimination, ten were targeted for expansion, and fifteen would be unchanged. A long-term reconfiguration of the Boulevard to ten lanes was considered. This would be configured to allow pedestrians, bicycles, buses, and cars to coexist within the cartway in a safe and efficient environment. An implementation plan was developed that prioritizes the recommendations to improve safety and mobility along the corridor.
10 2 US 1- Roosevelt Boulevard Corridor Study 2.0 PURPOSE AND NEED This study was conducted as part of DVRPC s 2030 long-range plan for the region. The selection of this corridor evolved from a combination of evaluating and ranking the corridors identified by the Congestion Management Process and Long Range Planning corridors in Pennsylvania. In light of the safety issues within this corridor, PennDOT and the city of Philadelphia requested that DVRPC conduct a traffic and safety study of this corridor. The section of this corridor studied extends from Ninth Street in the south to Grant Avenue in the north and is approximately 8 miles in length. The extensive breadth of the corridor--twelve travel lanes and three medians--has become an obstacle for pedestrian traffic. The corridor has experienced numerous pedestrian fatalities over the years and also experiences heavy peak-hour vehicular congestion. This study attempts to identify the constraints and opportunities on the Boulevard and makes recommendations for its improvement as a travel corridor in terms of pedestrian safety and mobility. 3.0 LAND USE Every five years, DVRPC conducts a land use inventory aimed at cataloging the various types of land use in the region. The most recent available data is from Roughly 5,600 acres are within a half mile on either side of Roosevelt Boulevard. See Map 1 for a visualization of the study area s land use. This section of Philadelphia is very dense, and consequently, most of the land surrounding the corridor has been developed. Open space is limited within neighborhoods, but there are several larger parks, such as Hunting Park, cemeteries, and playgrounds. Additionally, the land on either side of two creeks that cut through the corridor has remained undeveloped and is used for various types of recreation. Vacant land, here more often than not, is in a place where a home or business once stood, and is limited. The majority of land is used for residential uses, comprising over 50 percent of the area, with the majority being row and multi-family homes. Commercial uses are located along Roosevelt Boulevard, comprising seven percent of the land. The Cottman / Roosevelt Boulevard intersection is a major commercial hub within the corridor, where the 76 unit Roosevelt Mall, 28 unit Cottman Bustleton Shopping Center, and 16 unit Great Northeast Plaza are all located. Further north between Welsh Road and Grant Avenue are at least five large commercial locations, including the Blue Grass Mall, the Tremont Shopping Center, the Northeast Shopping Center, and the Mall at One. Other commercial shopping centers are located at Harbison Avenue and Adams Avenue. Several smaller neighborhood commercial locations can be found along 2 nd Street, 5 th Street, Oxford Avenue, and Rising Sun Avenue.
11 Roosevelt Boulevard Corridor Study Land Use (2005) Map 1 Montgomery County PHILADELPHIA Delaware River 95 Residential:Detached Residential:Multi-Family Residential:Row Home Commercial Community Services Recreation Manufacturing Transportation Utility Parking Vacant Wooded Water QR 90 Camden County 130 Delaware Valley Regional Planning Commission June 2007 K 0QR Miles
12 4 US 1- Roosevelt Boulevard Corridor Study Community Services are plentiful here; there are numerous schools, churches and medical facilities. Specifically, there are 39 public and private schools within the corridor, with 22 schools located west of the Tacony Creek. Two hospitals can be found on Roosevelt Boulevard, including Friends Hospital near Adams Avenue and Nazareth Hospital along Holme Avenue. Several aging facilities, including nursing homes, are located within the corridor, with four facilities located near Holme Avenue and Roosevelt Boulevard. Religious institutions are also plentiful, with over a dozen located on either side of the roadway. Table 1 illustrates land use by type within the corridor. Table 1: Study Corridor Land Use Total Land Use Type Acres Percent Residential:Single-Family Detached % Residential:Row Home 1, % Residential:Multi-Family % Commercial % Community Services % Manufacturing:Light Industrial % Recreation % Utility % Transportation % Parking % Vacant % Water % Wooded % Total 5, % Source: DVRPC, 2005
13 US 1 Roosevelt Boulevard Corridor Study DEMOGRAPHICS 4.1 Population and Employment The City of Philadelphia is divided into 12 planning areas. This section of Roosevelt Boulevard crosses four planning areas: Upper North Philadelphia, Olney / Oak Lane, Near Northeast Philadelphia, and Far Northeast Philadelphia. The corridor runs through the entire Near Northeast section and portions of the other three. All demographic information for this study is based on information obtained from the 2000 US Census, except where otherwise noted. The study area had a population of roughly 181,000 residents, approximately 12 percent of Philadelphia s total population, within 188 block groups in It should be noted that the US Census Bureau estimated that between 2000 and 2006 Philadelphia lost 4.6 percent of its population, although estimates were not provided by planning area. The block groups in the study area encompass 10,555 acres. Four block groups do not contain residents. When these block groups are removed from the equation, population density is high, roughly 19.3 residents per acre. Densities are higher south of Cottman Avenue, with 12 of the 14 block groups having densities greater then 60 residents per acre. Four square blocks in the southern end of the corridor, between Louden Street, Ruscomb Street, and C Street in Feltonville have some of the highest densities within the corridor, at over 80 residents per acre. DVRPC forecasts population and employment for the nine county region through Population is forecasted to remain roughly the same in terms of total number, as illustrated in Table 2, increasing by 0.3 percent. The Far Northeast is forecasted to increase by 8,877 residents (5.6 percent) while Olney / Oak Lane is forecasted to lose 5,038 residents (-2.9 percent). Table 2: Population Forecasts for Philadelphia and Select Planning Areas Absolute Change Percent Change Philadelphia County 1,517,550 1,484,990 1,515,010 1,505,000 (12,550) -0.8% Near Northeast Philadelphia 241, , , ,500 1, % Olney Oak Lane 171, , , ,500 (5,038) -2.9% Far Northeast Philadelphia 158, , , ,000 8, % Upper North Philadelphia 93,763 91,160 91,980 90,500 (3,263) -3.5% Source: DVRPC Regional Data Bulletin No 73, 2005
14 6 US 1- Roosevelt Boulevard Corridor Study In 2000, there were 741,397 jobs in Philadelphia. The Near Northeast has the highest local employment at 69,672 jobs while Olney / Oak Lane has 25,512 jobs. By 2030, employment is expected to increase by 21,779 jobs (2.9 percent) in the city, but the same is not true for this area. The four planning districts are forecasted to have a net loss of 6,110 jobs (-3.2 percent), as is illustrated in Table 3. Table 3: Employment Forecasts for Philadelphia and Select Planning Areas Absolute Change Percent Change Philadelphia County 741, , , ,176 21, % Near Northeast Philadelphia 69,672 68,535 69,996 69, % Far Northeast Philadelphia 60,567 60,117 63,180 63,854 3, % Upper North Philadelphia 32,962 28,135 26,136 26,089-6, % Olney Oak Lane 25,512 23,341 22,999 22,781-2, % Source: DVRPC Regional Data Bulletin No 73, Age The age distribution of study area residents is very similar to all of Philadelphia. See Table 4 for age distribution comparisons and Map 2 for a visualization of youth distribution. While the age distributions compare well overall, certain census block groups within the study area stand out as anomalies with extremes at one end or the other. Table 4: Population by Age Roosevelt Boulevard Philadelphia Population Percent Population Percent Under 5 15, % 118, % 6 to 17 34, % 264, % 18 to 24 16, % 168, % 25 to 64 87, % 752, % Over 65 27, % 214, % Total 181, % 1,517, % Source: DVRPC Regional Data Bulletin No 73, 2005 South of Tacony Creek Park the majority of block groups are younger, where fewer than ten percent of the block group is over 65 years. North of Tacony Creek Park, ages tend to rise between ten and 35 percent. Several block groups near Holme Avenue in the northern end of the study area have a third to a half of all residents over 65 years.
15 n n Roosevelt Boulevard Corridor Study Total Population of Ages 6 Through 17 n QR 63 Map 2 n 532 n Montgomery County 232 n n 1 n n n n n n n n n n n n n n n n n n n n n n n n n n n n 1 n n n n n n n n n n n n n n n nn 13 Delaware River 611 PHILADELPHIA 95 n QR 90 Camden County 130 *Source : US Census nbureau, 2000 n n Delaware Valley Regional Planning Commission June 2007 Population* N/A n Schools K QR Miles
16 8 US 1- Roosevelt Boulevard Corridor Study Those under 18 years are located evenly throughout the corridor, but younger residents tend to be located at the southern end of the study area and are roughly 20 percent of the block groups. As the overwhelming majority of children under 18 do not drive, many walk or bike to places in their community. This is especially true for children who walk to school as there are 39 schools within a half mile of Roosevelt Boulevard. Map 2 illustrates school age population 5 to 17 years within the corridor. Public and private schools have been included in this figure as well. 4.3 Public Transportation Of the 67,000 workers living in the study area block groups, twenty percent use public transportation to get to work. This is lower than the City of Philadelphia as a whole (25 percent) and is illustrated in Map 3. Individual block groups range from two to 79 percent, with 66 block groups containing at least 25 percent of the workers using public transportation. Block groups north of Levick Street tend to have less than 20 percent of workers using public transportation. Higher concentrations of workers using public transportation, between 20 and 60 percent, are located in the southern end of the study area. Four percent of the population walks to work and less than one percent of the population rides a bike to work. Alternate transportation mode usage tends to be higher in the southern half of the study area while the northern half is more likely to use private automobiles.
17 # Roosevelt Boulevard Corridor Study # # Workers Using Public Transportation QR 63 Map 3 # 532 Montgomery County 232 # 1 # # # # # # # # 13 # # # 1 # # # ## # # # # # 611 # # # # PHILADELPHIA # # # # # # 95 QR 90 # # # Camden County Delaware River # 130 # *Source : US Census Bureau, 2000 # Delaware Valley Regional Planning Commission June 2007 Percent of Workers* 31% - 40% 0% - 15% 41% - 60% 16% - 30% 61% - 80% Bus Routes Commuter Rail # Rail Stations K QR Miles
18 10 US 1- Roosevelt Boulevard Corridor Study 4.4 Environmental Justice DVRPC employs an environmental justice (EJ) methodology that quantifies levels of disadvantage within the nine-county region. Using 2000 census tract information, categories of eight potential disadvantaged groups are analyzed, including female head of household with child, non-hispanic minority, Hispanic, carless households, impoverished, elderly over 85 years of age, physically disabled, and limited English proficiency. Each category is analyzed for the total concentration in the region, generating a baseline. If a census tract contains a concentration higher than the baseline, it is considered disadvantaged. Census tracts can therefore contain zero to eight degrees of disadvantage (DOD). Census tracts with five or more DOD are regionally significant in terms of environmental justice sensitivity. Within a half mile on either side of Roosevelt Boulevard lies part of forty seven census tracts. These census tracts contain one to eight DOD. Thirty-six census tracts, or 77 percent, have five or more DOD, where sixteen census tracts have 7 to 8 DOD. Map 4 illustrates census track degree of disadvantage within the corridor. While all of the population groups are represented in the EJ analysis, several populations stand out. Population concentrations are itemized in Table 5 below, and include: Forty-one tracts, or 87 percent, contain concentrations of carless households at or above the regional threshold of sixteen percent, while 18 tracts (38 percent) contain concentration levels over thirty-two percent. The highest concentration is over 51 percent of the tract. This finding suggests that in addition to workers using mass transit for employment, mass transit is being used for other trips made by additional family members within the entire corridor. Forty-two tracks, or 89 percent, contain concentrations of physically disabled residents at or above the regional threshold. Again, this indicates that collectively there are many residents within the entire corridor that are mobility challenged. Thirty-seven tracts, or 78 percent, contain concentrations of non-english speaking populations at or above the regional threshold of two percent. Thirty tracts contain concentration levels twice as high as the regional average. The highest concentration is over 14 percent of the tract. Twenty-seven tracts, or 57 percent, contain concentrations of Hispanic populations at or above the regional threshold of five percent. Twenty-three tracts contain concentration levels twice as high as the regional average. The highest concentration is over 62 percent of the tract.
19 US 1 Corridor Study Environmental Justice - Degrees of Disadvantage Map 4 Montgomery County Delaware River PHILADELPHIA 130 Camden County *Degrees of Disadvantage include: Poverty, Non-Hispanic Minority, Hispanic, Elderly, Carless, Disabled, Limited English Proficiency, and Female Head of Household with Child QR Delaware Valley Regional Planning Commission June 2007 Degrees of Disadvantage* K Miles
20 12 US 1- Roosevelt Boulevard Corridor Study Table 5: Environmental Justice - Populations and Concentrations Regional Threshold Number of DOD Census Tracts Percent DOD Census Tracts Concentration Level Range Tracts with 2x Threshold Tracts with 2x Threshold Percent Non Hispanic Minority 24% % 1-96% % Carless Households 16% % 7-51% % Poverty 11% % 5-47% % Female Head of House with Child 8% % 1-23% % Physically Disabled 7% % 3-18% 4 8.5% Hispanic 5% % 1-62% % Limited English Proficiency 2% % 0-14% % Elderly over % % 1-9% % Source: DVRPC, 2007 This corridor contains higher concentrations of census tracts with five or more DODs than much of the region. Census tracts south of Oxford Avenue (Route 232) are more disadvantaged than the census tracts to the north. There are other demographic characteristics that further define this disparity between the north and south, such as; higher concentrations of school-aged children, greater levels of public transportation use, and higher population densities in the south. In summary, Oxford Avenue is the line of demarcation between the two distinct population groups that are found in the Roosevelt Boulevard corridor.
 is the sole means of mass transit within the study corridor.")

21 US 1 Roosevelt Boulevard Corridor Study PUBLIC TRANSIT SERVICE 5.1 Bus Network Bus service offered by the Southeastern Pennsylvania Transportation Authority (SEPTA) is the sole means of mass transit within the study corridor. There are eight routes that operate on Roosevelt Boulevard within the study area and eleven routes that cross Roosevelt Boulevard at intersections analyzed by DVRPC. Route 1 is the only route that travels the entire length of the study area. Routes Eight and J operate on C Street, but only north of Roosevelt Boulevard. C Street and Cottman Avenue each have two routes. The intersections of Roosevelt Boulevard and North Front Street, F Street, Bridge Street, and Tyson Avenue were analyzed but do not have bus routes. Figure 1: Study Area Bus Service, below, shows the bus routes that operate on, or cross, Roosevelt Boulevard at an analyzed intersection. Routes that appear to begin or end prior to an intersection enter or exit Roosevelt Boulevard at nonanalyzed cross streets. The cross streets and mid-block crosswalks shown in the Figure 1 are those that have been analyzed and by no means are an exhaustive list. Figure 1 Study Area Bus Service Source: DVRPC, 2007, based on SEPTA schedules as of 22 June 2007

 Source: DVRPC, 2007 As shown in Figure 3, the bus stop at Roosevelt")
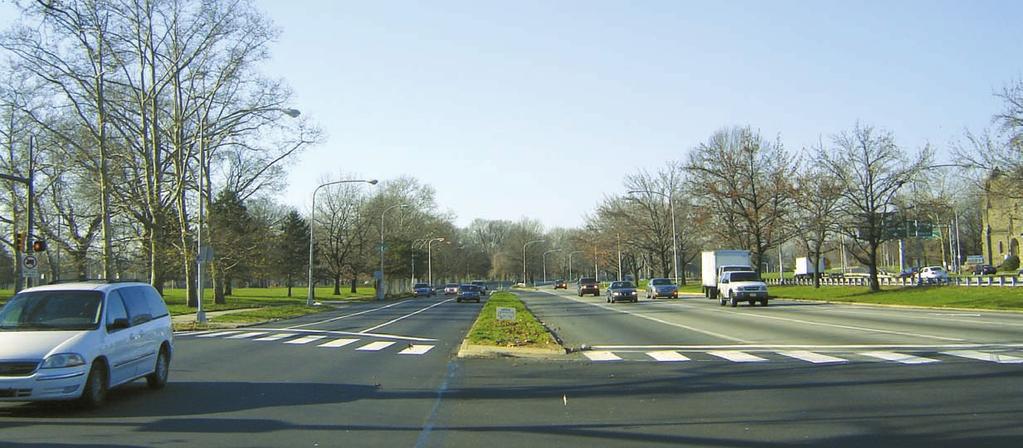
22 14 US 1- Roosevelt Boulevard Corridor Study In several instances the infrastructure at bus stop locations is not adequate. Particularly, where not already present, bus stop shelters should be installed at peak load points and intersections that act as bus route transfer locations, and, at minimum, benches should be installed at other heavily-used boarding locations. Figures 2 and 3 demonstrate the need for bus stop shelters and benches. Figure 2 Roosevelt Boulevard near Welsh Road Source: DVRPC, 2007 Figure 3 Roosevelt Boulevard at Cottman Avenue (SE Quadrant) Source: DVRPC, 2007 As shown in Figure 3, the bus stop at Roosevelt Boulevard and Cottman Avenue, the busiest bus boarding and alighting intersection in the corridor, the adjoining gas station property does not have clearly defined ingress and egress locations, thereby creating
23 US 1 Roosevelt Boulevard Corridor Study 15 unnecessary pedestrian/vehicle conflict points. These issues are discussed in more detail in Section 6.0: Crosswalk Analysis. 5.2 Future Rail Service In 2003 a team of consultants, including, Parsons Brinckerhoff, STV Incorporated, Eng- Wong, Taub and Associates, Kise Straw and Kolodner, Milligan and Company LLC, and Hill International, published the Roosevelt Boulevard Corridor Study. The study analyzed multiple transportation options for improving connectivity between the Greater Northeast and Center City Philadelphia. The Preferred Alternative, called Alternative C Prime, consists of a new subway that branches off of the Broad Street Line at Erie Station and travels under Roosevelt Boulevard s center median most of the way with the final two miles elevated, until it reaches a terminus at Southampton. The report mentioned that it is only one of several similar-topic studies that have been conducted since the Boulevard was constructed. The study laid out a time line and cost estimate for construction of the proposed subway line. The consultants estimated that the entire project s cost, adjusted for inflation, would be $4.6 billion. The construction would evolve in phases, the first of which would begin in 2009 and end in The entire project could be completed by The potential benefits of improved mobility, better air quality, decreased congestion, and improved pedestrian safety are tremendous if the Preferred Alternative were to become reality. The consultants forecasted daily ridership of 124,500 on the new subway line and a reduction in auto trips by 83,300 per day. Due to its relative cost-effectiveness among proposed New Starts in the region, the project is currently listed as a Major Regional Transportation Aspiration in the DVRPC Destination 2030 Long Range Plan.
24 16 US 1- Roosevelt Boulevard Corridor Study 6.0 CROSSWALK ANALYSIS 6.1 Crosswalk Analysis Overview Introduction A field assessment was conducted at nine intersection crosswalks and all ten mid-block crosswalks along Roosevelt Boulevard between 9 th Street and Grant Avenue on typical weekdays. In addition, a field assessment was conducted on a typical Saturday at five intersections: Roosevelt Boulevard and 9 th Street, Welsh Road, Tyson Avenue, Cottman Avenue and Grant Avenue. Purpose The assessment was conducted in order to determine the utilization rate of crosswalks along the Boulevard, identify underutilized crosswalks, identify potential for consolidation, determine whether there is a need for vertical separation of pedestrian traffic, and prioritize based on use. Methodology Typically, one staff person was assigned to monitor an intersection. In cases where visibility of the intersection was impaired, a second staff member was assigned to provide assistance. Staff were required to tabulate pedestrian movement using the following procedure: 1. Count pedestrians and bicyclists crossing at all four legs of an intersection, or, in the case of a mid-block crosswalk, those crossing the Boulevard at or near the crosswalk. 2. Pedestrian movement was tabulated within 15 minute increments by direction as indicated on a map of the area. 3. Staff recorded the number of pedestrians crossing during the Walk phase and Don t Walk phase. If a pedestrian was in the roadway and the indicator turned to a solid Don t Walk, then the pedestrian would be listed in the Don t Walk category. Conversely, if the pedestrian entered and exited the roadway during the Walk phase, they would be listed in the Walk category. This was used to determine the number of pedestrians who were able to cross successfully during the time allotted. 4. Pedestrians crossing the roadway using a portion of the marked crosswalk but deviating from it for a part of their journey were listed as crossing in the Don t Walk phase. This label was used as surrogate to indicate that the crossing was illegal.
25 US 1 Roosevelt Boulevard Corridor Study 17 Field Operations Staff were instructed on how to record pedestrian movement along or parallel to the crosswalks. Each staff person was given a package, which included a map of the intersection identifying how pedestrian movements should be coded, and assessment forms grouped by time of day to be recorded. Periodic rain showers occurred during the Wednesday and Saturday counts. Results of the assessment are tabulated in Appendices I, II, III, and IV. A. Intersection Crosswalk Locations Wednesday Counts Pedestrian counts were taken at the following intersection crosswalks during discrete time periods: 7:00 am 9:00 am and 2:00 pm 7:00 pm on May 16, 2007: a typical weekday. Weekday counts were intended to capture work trips as well as school trips, which are heaviest during the week. These locations were selected based on pedestrian crash clusters, pedestrian fatalities, proximity to schools, and high bus transit boarding and transfer volumes. Pedestrian volumes were tabulated at 15 minute intervals, tracking crossings along the crosswalks. 1. Ninth Street and Roosevelt Boulevard 2. Fifth Street and Roosevelt Boulevard 3. North Front Street and Roosevelt Boulevard 4. Rising Sun Avenue and Roosevelt Boulevard 5. C Street and Roosevelt Boulevard 6. F Street and Roosevelt Boulevard 7. Bridge Street and Roosevelt Boulevard 8. Harbison Avenue and Roosevelt Boulevard 9. Rhawn Street and Roosevelt Boulevard Weekend Counts Counts were taken at the following intersection crosswalks during the time period of 12:00 pm - 4:00 pm on Saturday, May 19, Saturday was chosen as a typical shopping day. These locations were selected based on proximity to major retail areas, high bus transit boardings, and high transfer volumes. 1. Ninth Street and Roosevelt Boulevard 2. Tyson Avenue and Roosevelt Boulevard 3. Cottman Avenue and Roosevelt Boulevard 4. Welsh Road and Roosevelt Boulevard 5. Grant Avenue and Roosevelt Boulevard

26 18 US 1- Roosevelt Boulevard Corridor Study In the following crosswalk descriptions section, the intersection crosswalks are discussed in their respective geographic order south to north, regardless of the day of assessment. B. Mid-Block Crosswalk Locations Weekday counts were only taken at the following mid-block crosswalks during discrete time periods: 7:00am 9:00am and 2:00pm 7:00pm on Thursday, May 17, These represent all mid-block crosswalks along the Boulevard between 9 th Street and Grant Avenue. Pedestrian volumes were tabulated at 15 minute intervals, tracking pedestrian movement across the Boulevard. The crosswalks are listed as either on Roosevelt Boulevard at the listed perpendicular street, or on Roosevelt Boulevard between listed perpendicular streets. 1. Bingham Street and Rorer Street 2. Smylie Road 3. Garland Street and Whitaker Avenue 4. Sanger Street 5. Benner Street 6. Unruh Avenue 7. Longshore Avenue 8. Princeton Avenue and Friendship Street 9. Friendship Street and Saint Vincent Avenue 10. Shelmire Avenue and Faunce Street 11. Loney Street Improvements Several recommended improvements are common among many crosswalk locations. Foremost, we recommend installing pedestrian countdown signals at all intersection crosswalk locations. Additionally, each crosswalk should be restriped, if not so already, in the international style, and have crosswalk safety educational signs posted at each crosswalk. See Figure 4 for an example of a crosswalk safety educational sign. All of the signalized crosswalks should be timed to allow pedestrians to reach the center median with a 3.5 feet per second gait in a single cycle. Furthermore, we recommend installing pedestrian countdown signals at all mid-block crosswalk locations. Table 6 summarizes these improvements, along with all other recommended improvements. They are explained in greater detail in the following sections. Figure 4- Crosswalk Safety Educational Sign (DVRPC, 2007)


27 US 1 Roosevelt Boulevard Corridor Study 19 Table 6 Summary of Crosswalk Recommendations Source: DVRPC, Intersection Crosswalks I. Ninth Street and Roosevelt Boulevard This intersection is the southernmost intersection prior Roosevelt Boulevard beginning to function as an expressway. The intersection is surrounded by vacant land to the west, Hunting Park to the southeast, and a dense concentration of row homes to the northeast. The area is home to a high concentration of public transportation users (16-
28 20 US 1- Roosevelt Boulevard Corridor Study 40%). The intersection is angled at approximately 45/135º. The angled nature of the intersection adds an additional 130 feet to the crossing. The total crossing distance is 380 feet. A southbound express-to-local crossover is located approximately 400 feet north of the intersection ({listed: segment/offset, beginning - ending}, 0161/ /536). In the southbound direction, a large overhead directional sign is present. The intersection is served by bus stops in all directions and acts as a transfer point between SEPTA Routes 1 and R on Roosevelt Boulevard, and Route C on Ninth Street. Between 2001 and 2005 numerous pedestrian/vehicle crashes occurred at this intersection. The northbound express lanes saw six crashes over this period; two daylight and four evening. All crashes resulted in injury to the pedestrian. A seventh crash occurred during daylight within the southbound local lanes, also resulted in injury to the pedestrian. Of the seven, five were considered to be caused by the pedestrian. This intersection was assessed by DVRPC personnel on Wednesday, May 16 and Saturday, May 19, During the assessment the following observations were noted: 1) There are no pedestrian crossing signals for those crossing Ninth Street; 2) At a normal adult gait (~3.5 feet per second), it would likely require four signal cycles to safely cross Roosevelt Boulevard; 3) There is a long lag time between the Don t Walk signal and the opposing green light; 4) The majority of the crossing activity can be attributed to bus route transfers; 5) Few pedestrians observed were able to cross half of the boulevard in a single light cycle; 6) Many pedestrians were observed crossing diagonally; 7) Traffic traveling from westbound Ninth Street to northbound Roosevelt Boulevard often conflicts with pedestrian movement in the crosswalk; and 8) There is not a bus stop shelter on the northbound side of Roosevelt Boulevard. During the Wednesday, May 16 assessment, 172 pedestrians crossed Roosevelt Boulevard and 155 crossed Ninth Street. The morning assessment found an average of 46 pedestrians crossing per hour. The afternoon was higher, averaging 58 pedestrians per hour with a peak hour of 76 pedestrians between 3:30 and 4:30. The Saturday assessment averaged 36 pedestrians per hour between noon and 4:00pm. Recommended Improvements: Install pedestrian countdown signals with illuminated pedestrian push buttons. Restripe all crosswalks using the international style. Install crosswalk safety educational signs. Retime pedestrian crossing time allowance to accommodate a slower speed of 3.5 feet per second and ensure that the new time enables pedestrians to reach the center median in one signal cycle. Move the overhead southbound directional sign further beyond the intersection to avoid driver distraction. Install a bus stop shelter for northbound bus riders.
29 Roosevelt Boulevard Corridor Study Ninth Street and Roosevelt Boulevard HUTCHINSON ST Figure 5 COURTLAND ST Overhead Directional Sign ROOSEVELT BLVD ROOSEVELT BLVD 250 Ft. 380 Ft. ROOSEVELT BLVD ROOSEVELT BLVD Recommended Bus Stop Shelter Location 8TH ST 9TH ST Orthophotography - DVRPC, Spring 2005 Delaware Valley Regional Planning Commission June 2007 K Feet
30 22 US 1- Roosevelt Boulevard Corridor Study II. Fifth Street and Roosevelt Boulevard The intersection at Fifth Street and Roosevelt Boulevard is surrounded by dense row home neighborhoods and small pockets of commercial- and light industry-zoned land. The dominant physical characteristic of this intersection is the grade separation. The Roosevelt Boulevard express lanes travel over Fifth Street, requiring Roosevelt Boulevard crossing pedestrians to walk through the underpass. There are no crossovers in the vicinity of this intersection. The intersection is served by SEPTA Routes 1 and R on Roosevelt Boulevard and Route 47 on Fifth Street. It is a bus transfer location. Despite the grade separation and the need to only cross two series of three traffic lanes, this intersection has realized multiple pedestrian/vehicle crashes between 2001 and All crashes occurred in the local lanes. The southbound local lanes had two crashes: a daytime driver-caused crash and an evening pedestrian-caused crash. The northbound local lanes had four crashes: two daylight pedestrian-caused crashes, and one daylight and one evening driver-caused crashes. All six crashes resulted in injury to the pedestrian. This intersection was assessed by DVRPC personnel on Wednesday, May 16, During the assessment the following observations were noted: 1) Approximately 40% of the pedestrian traffic was attributable to bus route transferring; 2) Pedestrians paid less attention to cross signals during periods of low automobile congestion; and 3) A lot of school-aged children were noted using the crossing around the morning and afternoon peak school traffic times. During the assessment 244 pedestrians crossed Roosevelt Boulevard and 274 crossed Fifth Street. The morning assessment averaged 78 pedestrians per hour. The afternoon averaged 73 pedestrians per hour with a 126 pedestrian peak between 3 and 4:00pm. Pedestrian levels declined to a low of 21 pedestrians between 6 and 7:00pm. Recommended Improvements: Install pedestrian countdown signals with illuminated pedestrian push buttons. Restripe all crosswalks using the international style. Install crosswalk safety educational signs. Retime pedestrian crossing time allowance to accommodate a slower speed of 3.5 feet per second and ensure that the new time enables pedestrians to reach the center median in one signal cycle. Ensure adequate lighting is present through the underpass.
31 LAWRENCE ST Roosevelt Boulevard Corridor Study Fifth Street and Roosevelt Boulevard Figure 6 LOUDEN ST ROOSEVELT BLVD 5TH ST ROOSEVELT BLVD ROOSEVELT BLVD Orthophotography - DVRPC, Spring 2005 Delaware Valley Regional Planning Commission June 2007 K Feet
32 24 US 1- Roosevelt Boulevard Corridor Study III. North Front Street and Roosevelt Boulevard This intersection is surrounded by a variety of land uses. The western half is primarily row home neighborhoods, with Olney High School and athletic fields approximately 1,000 feet from the intersection. The eastern side of Roosevelt Boulevard opens primarily to row home neighborhoods and Feltonville Elementary School. This intersection is unique due to its proximity to crossovers and a second intersection. Beginning 100 feet south of the intersection, in the southbound direction, is a local-toexpress crossover (0181/ /342). Additionally, ending 100 feet south of the intersection, a northbound express-to-local crossover is present (0180/ /302). The intersection of Roosevelt Boulevard and Rising Sun Avenue is as close as 225 feet on the eastern side. SEPTA Routes 1 and R serve this intersection. This intersection has seen four pedestrian/vehicle crashes between 2001 and 2005, including one fatality. The fatality occurred during the day in the southbound express lanes and was pedestrian caused. A driver-caused crash occurred during the evening in the southbound local lanes. The northbound lanes had a driver-caused daylight crash in the local lanes and a pedestrian-caused daylight crash in the express lanes. The intersection was assessed by DVRPC personnel on Wednesday, May 16, During the assessment the following observations were noted: 1) The majority of pedestrians were school-aged children, including many who ran across the intersection in one light cycle; 2) North Front Street traffic often encroached on the crosswalk during red lights; and 3) The sidewalks along North Front Street are in disrepair. During the assessment, 241 pedestrians crossed Roosevelt Boulevard and 201 crossed North Front Street. The morning had 160 pedestrians and the afternoon had 282. Nearly half of the total was school-aged children. Recommended Improvements: Install pedestrian countdown signals with illuminated pedestrian push buttons. Restripe all crosswalks using the international style. Install crosswalk safety educational signs. Retime pedestrian crossing time allowance to accommodate a slower speed of 3.5 feet per second and ensure that the new time enables pedestrians to reach the center median in one signal cycle. Install Stop on Red signs where Front Street meets Roosevelt Boulevard. Upgrade sidewalks along North Front Street. Conduct pedestrian safety outreach at Olney High School. Ensure signals are coordinated with Rising Sun Avenue signals to prevent dilemma vehicles (drive indecision) traveling northbound through North Front Street, or southbound through Rising Sun Avenue.
33 Roosevelt Boulevard Corridor Study North Front Street and Roosevelt Boulevard ASHDALE ST Olney High School Figure 7 RUSCOMB ST ALBANUS ST FRONT ST ROOSEVELT BLVD Crossovers ROOSEVELT BLVD 225 ft. Recommended "Stop on Red" Sign Locations RISING SUN AVE RUSCOMB ST Feltonville Elementary School A ST ROCKLAND ST HOPE ST Orthophotography - DVRPC, Spring 2005 Delaware Valley Regional Planning Commission June 2007 K Feet
34 26 US 1- Roosevelt Boulevard Corridor Study IV. Rising Sun Avenue and Roosevelt Boulevard Rising Sun Avenue crosses Roosevelt Boulevard between 225 and 300 feet, depending on the spot of measurement, north of North Front Street. This intersection is sharply angled, which creates an extended crossing distance of 340 feet. As mentioned, the intersection is very close to its southern neighbor, but it is a quarter-mile from its nearest northern counterpart. There is a local-to-express and an express-to-local crossover north of the intersection on the southbound side (0181/ /2026 and 0181/ /1599). This intersection is served by SEPTA Routes 1 and R on Roosevelt Boulevard and Route 57 on Rising Sun Avenue. It is a bus transfer location. Six pedestrian/vehicle crashes have occurred at this intersection between 2001 and Five of the crashes occurred on the northbound side, four of which were in the northbound express lanes. Three of the crashes occurred during daylight hours, one was at night. Three were pedestrian caused and one was driver caused. The northbound local lanes crash occurred during daylight and was pedestrian caused. The single southbound crash occurred in the express lanes during daylight and was pedestrian caused. All crashes resulted in injury to the pedestrian. The intersection was assessed by DVRPC personnel on Wednesday, May 16, The only observation noted was that an additional lane of traffic must be crossed on each side due to the presence of turning lanes. During the assessment 87 pedestrians crossed Roosevelt Boulevard and 206 crossed Rising Sun Avenue. The average was 65 pedestrians per hour with a peak of 104 pedestrians between 2:30 and 3:30 pm. This intersection had the second fewest illegal crossings, behind only the Harbison Avenue and Roosevelt Boulevard intersection, with a 15% illegal crossing rate. Recommended Improvements: Install pedestrian countdown signals with illuminated pedestrian push buttons. Restripe all crosswalks using the international style. Install crosswalk safety educational signs. Retime pedestrian crossing time allowance to accommodate a slower speed of 3.5 feet per second and ensure that the new time enables pedestrians to reach the center median in one signal cycle. Ensure signals are coordinated with North Front Street signals to prevent dilemma vehicles traveling northbound through Rising Sun Avenue, or southbound through North Front Street. Conduct pedestrian safety outreach at Olney High School.
35 Roosevelt Boulevard Corridor Study Rising Sun Avenue and Roosevelt Boulevard Olney High School Figure 8 RUSCOMB ST ALBANUS ST FRONT ST ROOSEVELT BLVD ROOSEVELT BLVD 225 ft. RISING SUN AVE A ST Feltenville Elementary School RUSCOMB ST Orthophotography - DVRPC, Spring 2005 Delaware Valley Regional Planning Commission June 2007 K Feet
36 28 US 1- Roosevelt Boulevard Corridor Study V. C Street and Roosevelt Boulevard The intersection of C Street and Roosevelt Boulevard is surrounded by dense row home neighborhoods and the Saint Ambrose School, which is located in the northwest quadrant of the intersection. Physically, the intersection is not unique. C Street crosses Roosevelt Boulevard at nearly 90º and there is a southbound local-to-express crossover directly south of the intersection (0181/ /2026). The intersection is served by SEPTA Routes 1 and R on Roosevelt Boulevard and Routes 8 and J on C Street. It is a bus transfer location. This intersection has witnessed six pedestrian/vehicle crashes between 2001 and 2005, including one fatality. The fatality was pedestrian caused and occurred during the evening in the northbound local lanes. The northbound local lanes also had one drivercaused evening crash resulting in injury to the pedestrian. The northbound express lanes had an evening pedestrian-caused crash and a daylight driver-caused crash, both resulting in injury to the pedestrian. The southbound lanes each had one daylight driver-caused crash. 67% of the pedestrian/vehicle crashes at this intersection were caused by the driver. The intersection was assessed by DVRPC personnel on Wednesday, May 16, During the assessment the following observations were noted: 1) The pedestrians using this intersection were primarily school-aged children; 2) There was a high percentage of jaywalkers; 3) There is a corner store at the intersection, but otherwise it is primarily surrounded by residential neighborhoods; and 4) The pavement markings on C Street are worn and in need of restriping. This was the busiest intersection assessed by DVRPC during weekday hours. A total of 376 pedestrians crossed Roosevelt Boulevard and 216 crossed C Street. The assessment averaged 103 pedestrians per hour in the morning, and 77 pedestrians per hour in the afternoon. There was a distinctive afternoon peak between 2:45 and 3:45, with 129 pedestrians crossing. Recommended Improvements: Install pedestrian countdown signals with illuminated pedestrian push buttons. Restripe all crosswalks using the international style. Install crosswalk safety educational signs. Retime pedestrian crossing time allowance to accommodate a slower speed of 3.5 feet per second and ensure that the new time enables pedestrians to reach the center median in one signal cycle. Improve pavement markings on C Street by restriping the stop bar. Conduct pedestrian safety outreach at Saint Ambrose School.
37 Roosevelt Boulevard Corridor Study C Street and Roosevelt Boulevard ARBOR ST Figure 9 C ST ALBANUS ST Saint Ambrose School Crossover ROOSEVELT BLVD ROOSEVELT BLVD ROSEHILL ST BOUDINOT ST Orthophotography - DVRPC, Spring 2005 Delaware Valley Regional Planning Commission June 2007 K Feet
38 30 US 1- Roosevelt Boulevard Corridor Study VI. F Street and Roosevelt Boulevard This intersection is surrounded by row home neighborhoods, Tacony Creek Park, a gas station, and two small automobile dealerships. A prominent characteristic of the intersection is its proximity to Tacony Creek Park. Northbound traffic is unimpeded as it crosses the Park for a quarter-mile prior to the intersection. There is also a northbound express-to-local crossover ending 200 feet prior to intersection (0190/ /1862). The intersection is served by SEPTA Routes 1, 8, J, and R. This intersection has seen seven pedestrian/vehicle crashes between 2001 and 2005, six of which occurred during daylight hours. The sole evening crash occurred in the northbound local lanes and was caused by the driver. The northbound local lanes also had three daylight crashes: two driver caused and one pedestrian caused. The northbound express, southbound local, and southbound express lanes each had one pedestrian-caused daylight crash. All seven crashes resulted in injury to the pedestrian. The intersection was assessed by DVRPC personnel on Wednesday, May 16, During the assessment the following observations were noted: 1) Approximately 25% of the pedestrian traffic was school related and 25% was bus related; 2) Pedestrians adhered to crosswalk markings; and 3) The southeast corner gas station does not have a curb along its border with Roosevelt Boulevard. During the assessment at total of 99 pedestrians crossed Roosevelt Boulevard and 248 crossed F Street. This is below average for assessed intersections. The assessmentlong average was 50 pedestrians per hour, with a peak between 3:30 and 4:30pm, during which 84 pedestrians crossed. This intersection was noted as having the highest percentage of illegal crossings (74%). People who cross illegally are not necessarily jaywalkers; rather, they are often unable to cross before the walk signal expires. Recommended Improvements: Install pedestrian countdown signals with illuminated pedestrian push buttons. Restripe all crosswalks using the international style. Install crosswalk safety educational signs. Retime pedestrian crossing time allowance to accommodate a slower speed of 3.5 feet per second and ensure that the new time enables pedestrians to reach the center median in one signal cycle. Install a curb along the gas station property to clearly define ingress and egress points. Ensure signs are posted in both directions approaching the intersection that indicate Speed Limit, Crosswalk Ahead, and Signal Ahead. Follow recommendations for associated crossovers, which include moving NB 4 and eliminating SB 14 (Crossover designations discussed in Section 7.1).
39 F ST Roosevelt Boulevard Corridor Study F Street and Roosevelt Boulevard Figure 10 Tacony Creek Park Auto Dealerships ROOSEVELT BLVD ROOSEVELT BLVD Crossover Gas Station Recommended Curb Location HERKNESS ST Orthophotography - DVRPC, Spring 2005 Delaware Valley Regional Planning Commission June 2007 K Feet
40 32 US 1- Roosevelt Boulevard Corridor Study VII. Bridge Street and Roosevelt Boulevard The area surrounding the intersection of Bridge Street and Roosevelt Boulevard begins the demographic characteristics more in line with the northern half of the study area. The Saint Martin of Tours School is in the northwest quadrant, but two other Roosevelt Boulevard crosswalks are closer to the school. The land use is dense row home neighborhoods west of Roosevelt Boulevard and multifamily housing neighborhoods to the east. The intersection is served only by SEPTA Route 1 on Roosevelt Boulevard. This intersection has seen four pedestrian/vehicle crashes between 2001 and All four were confined to the northbound lanes. The northbound local lanes had a daylight driver-caused crash. The northbound express lanes had two daylight crashes: one pedestrian caused and one driver caused. The fourth crash occurred during the evening and was pedestrian caused. All four crashes resulted in injury to the pedestrian. The intersection was assessed by DVRPC personnel on Wednesday, May 16, During the assessment the following observations were noted: 1) There are no pedestrian cross signals for crossing Bridge Street; 2) The majority of the pedestrians were school-aged children; 3) A drainage problem exists that causes ponding at the walkway in the southwest quadrant median; 4) The northbound crossover prior to the intersection causes significant weaving due to the grade separation at Oxford Circle; 5) There is poor sight distance for southbound express lane traffic approaching the intersection due to the lanes returning to grade; and 6) The southbound travel lanes do not have advanced advisory signs for the crosswalk. The Bridge Street and Roosevelt Boulevard intersection had the fewest pedestrian crossings of any assessed intersection. In seven hours of DVRPC assessment, 95 pedestrians crossed Roosevelt Boulevard and 118 crossed Bridge Street. Recommended Improvements: Install pedestrian countdown signals with illuminated pedestrian push buttons. Restripe all crosswalks using the international style. Install crosswalk safety educational signs. Retime pedestrian crossing time allowance to accommodate a slower speed of 3.5 feet per second and ensure that the new time enables pedestrians to reach the center median in one signal cycle. Improve drainage in the southwest quadrant median. Install advanced crosswalk advisory signs in the southbound express lanes prior to the intersection. Install permanent speed display signs at the southbound overpass at Oxford Avenue.
41 Roosevelt Boulevard Corridor Study Bridge Street and Roosevelt Boulevard Figure 11 St. Martin of Tours School MIRIAM RD BRIDGE ST ROOSEVELT BLVD Depressed Express Lanes ROOSEVELT BLVD Drainage Problem Crossovers CASTOR AVE Orthophotography - DVRPC, Spring 2005 Delaware Valley Regional Planning Commission June 2007 K Feet
42 34 US 1- Roosevelt Boulevard Corridor Study VIII. Harbison Avenue and Roosevelt Boulevard A variety of land uses surround this intersection. The western side is primarily row homes, multifamily homes, and a school. The eastern side opens to numerous shopping centers. There is a northbound express-to-local crossover ending 280 feet south of the intersection (0240/ /2620) and a mid-block crosswalk 400 feet north of the intersection. Pedestrians crossing the northern side of Harbison Avenue must cross an additional lane of traffic. The intersection is served by SEPTA Routes 1, 14, 20, and 50 on Roosevelt Boulevard and Route 26 on Harbison Avenue. It is a bus transfer location. The intersection has seen seven pedestrian/vehicle crashes between 2001 and 2005, all caused by the pedestrian. The northbound local lanes had three evening crashes, and the northbound and southbound express lanes each had a day and evening crash. Six of the crashes resulted in injury to the pedestrian and one resulted in a fatality. This intersection was assessed by DVRPC personnel on Wednesday, May 16, During the assessment the following observations were noted: 1) Much of the pedestrian traffic was attributable to the ACME store; 2) Most pedestrians crossed legally; however, some crossed in front of the ACME store; 3) Motorist traveling from westbound Harbison to the northbound Roosevelt express lanes often do not yield at the crosswalk; 4) The Harbison Avenue sidewalk needs upgrading in places; 5) The median walkway is narrow and overrun with vegetation; 6) The Harbison Avenue channelized right-turn lane needs a Yield to Peds sign; and 7) There is a conflict between the northbound bus stop location and the shopping center driveway. This intersection had the second fewest pedestrian crossings at an intersection recorded during the assessment. 116 pedestrians crossed Roosevelt Boulevard and 113 crossed Harbison Avenue. There were 70 pedestrians during the two morning hours and 159 during the five afternoon hours. Only 6.1 percent crossed illegally. Recommended Improvements: Install pedestrian countdown signals with illuminated pedestrian push buttons. Restripe all crosswalks using the international style. Install crosswalk safety educational signs. Retime pedestrian crossing time allowance to accommodate a slower speed of 3.5 feet per second and ensure that the new time enables pedestrians to reach the center median in one signal cycle. Install a Yield to Peds sign at the right turn ramp from Harbison to Roosevelt. Increase the width of the pedestrian walkway across Roosevelt Boulevard. Keep the median walkways clear of vegetation. Move the northbound Roosevelt Boulevard bus stop away from the driveway. Upgrade the sidewalk along Harbison Avenue.
43 Roosevelt Boulevard Corridor Study Harbison Avenue and Roosevelt Boulevard Figure 12 Our Lady of Ransom School LEONARD ST UNRUH AVE Mid-Block Crosswalk ROOSEVELT BLVD UNRUH AVE Crossover ROOSEVELT BLVD Recommended Location for "Yield to Peds" Sign Acme Supermarket Bus Stop Conflicts with Driveway Channelized Right-Turn Lanes Shopping Center MAGEE AVE HARBISON AVE Orthophotography - DVRPC, Spring 2005 Delaware Valley Regional Planning Commission June 2007 K Feet
44 36 US 1- Roosevelt Boulevard Corridor Study IX. Tyson Avenue and Roosevelt Boulevard The area surrounding the Tyson Avenue and Roosevelt Boulevard intersection is primarily row home neighborhoods. There is an automobile dealership in the northeast quadrant of the intersection. There are no other significant landmarks near by. The intersection is in between four mid-block crosswalks. There are two southbound crossovers near this intersection: a local-to-express crossover north of the intersection (0261/ /660), and an express-to-local crossover south of the intersection (0251/ /1657). The intersection is served by SEPTA Routes 1, 14, 20, and 50 on Roosevelt Boulevard only. This intersection has seen five pedestrian/vehicle crashes between 2001 and 2005, including one fatality. The fatality occurred during the evening in the northbound express lanes and was caused by the pedestrian. The northbound express lanes also had three other evening crashes: two were caused by the pedestrian and one by environmental conditions, and all three resulted in injury to the pedestrian. The final pedestrian/vehicle crash occurred in the southbound express lanes, was pedestrian caused, and resulted in injury to the pedestrian. The intersection was assessed by DVRPC personnel on Saturday, May 19, During the assessment the following observation was noted: the intersection crosswalks appeared to be used minimally. A total of 98 pedestrians crossed Roosevelt Boulevard and 69 crossed Tyson Avenue during the four hours of assessment. The average was 42 pedestrian crossings per hour. Recommended Improvements: Install pedestrian countdown signals with illuminated pedestrian push buttons. Restripe all crosswalks using the international style. Install crosswalk safety educational signs. Retime pedestrian crossing time allowance to accommodate a slower speed of 3.5 feet per second and ensure that the new time enables pedestrians to reach the center median in one signal cycle.
45 Roosevelt Boulevard Corridor Study Tyson Avenue and Roosevelt Boulevard CALVERT ST FRIENDSHIP ST Figure 13 Mid-Block Crosswalks BRIGHTON ST CALVERT ST PRINCETON AVE Crossover PRINCETON AVE TYSON AVE ROOSEVELT BLVD ROOSEVELT BLVD Auto Dealership BRIGHTON PL ROOSEVEL T BL VD TYSON AVE T BL VD Orthophotography - DVRPC, Spring 2005 BROUS AVE Delaware Valley Regional Planning Commission June 2007 K Feet
46 38 US 1- Roosevelt Boulevard Corridor Study X. Cottman Avenue and Roosevelt Boulevard This intersection is surrounded primarily by commercial establishments, most notably by the Roosevelt Mall in the northwest quadrant. Row home neighborhoods are present beyond the commercial establishments. Transportation mode choice stands out as higher than average for the surrounding population; 6 10% walk to their place of employment and 16 30% use public transportation. Physically, the intersection is grade separated with the Roosevelt Boulevard express lanes traveling beneath Cottman Avenue. This intersection is served by SEPTA Routes 1, 14, 20, and 50 on Roosevelt Boulevard and Routes 70 and 77 on Cottman Avenue. It is a bus transfer location. Five pedestrian/vehicle crashes occurred at this intersection between 2001 and 2005; all in the northbound local lanes. There were three day and one evening driver-caused crashes, and one day pedestrian-caused crash. All resulted in injury to the pedestrian. The intersection was assessed by DVRPC personnel on Saturday, May 19, During the assessment the following observations were noted: 1) There are no pedestrian cross signals present; 2) Left-turning cars entered the box before it was clear, which created gridlock; 3) The traffic flow was primarily oriented towards Roosevelt Mall; 4) The traffic signal poles are in the middle of the walkway at the median, thereby impeding pedestrian movement; 5) There are near-side bus stops on both streets in both directions, including at the southeast corner gas station; 6) The southeast corner bus stop does not have a shelter; and 7) The southeast corner gas station does not have a curb along its property border. By far the busiest assessed intersection, 346 pedestrians crossed Roosevelt Boulevard and 421 crossed Cottman Avenue during the four assessment hours. This translates into 192 pedestrian crossings per hour with no distinct peak in usage. Only 9% of the pedestrians crossed the intersection illegally, which is reflective of the high automobile traffic volume and the minimal crossing distance. Recommended Improvements: Install pedestrian countdown signals with illuminated pedestrian push buttons. Restripe all crosswalks using the international style. Install crosswalk safety educational signs. Retime pedestrian crossing time allowance to accommodate a slower speed of 3.5 feet per second and ensure that the new time enables pedestrians to reach the center median in one signal cycle. Install a curb along the southeast corner gas station s property due to the presence of a bus stop and undefined ingress and egress points. Install a bus stop shelter on Roosevelt Boulevard at the southeast corner of the intersection.
47 Roosevelt Boulevard Corridor Study Cottman Avenue and Roosevelt Boulevard Figure 14 Roosevelt Mall CALVERT ST COTTMAN AVE Grade-Separated Express Lanes ROOSEVELT BLVD ROOSEVELT BLVD Recommended Bus Stop Shelter Location Recommended Curb Location ROOSEVELT BLVD REVERE ST BROUS AVE Orthophotography - DVRPC, Spring 2005 AI Delaware Valley Regional Planning Commission June 2007 K Feet
48 40 US 1- Roosevelt Boulevard Corridor Study XI. Rhawn Street and Roosevelt Boulevard This intersection is the northernmost intersection in the DVRPC corridor study assessed on a weekday. The intersection is surrounded by small commercial establishments and multifamily housing. The small commercial establishments include a southeast corner gas station, a southwest corner car dealership, a northwest corner convenience store, and a northeast corner fast food restaurant. The residential areas surrounding the intersection are the least dense of the entire study area, with only 0 15 residents per acre. The intersection is between a mid-block crosswalk and the southern end of the Holme Avenue express-lane grade separation. Also, unique to this intersection are split center medians that contain left turning lanes. These lanes add an additional obstacle for pedestrian crossings. The intersection is served by SEPTA Routes 1, 14, 20, and 50 on Roosevelt Boulevard and Route 28 on Rhawn Street. It is a bus transfer location. This intersection has seen little pedestrian/vehicle crash activity between 2001 and 2005, though there was one fatality. The pedestrian-caused fatality occurred during the evening in the northbound express lanes. The only other crash occurred during the day in the northbound express lanes and resulted in injury to the pedestrian. The intersection was assessed by DVRPC personnel on Wednesday, May 16, During the assessment, the following observations were noted: 1) The majority of the pedestrians were adults; 2) All pedestrians crossed within the confines of the crosswalk; 3) There are no pedestrian signals for those crossing Rhawn Street; 4) The walkways in the north-side center median are narrow; and 5) There are not advanced crosswalk advisory signs for southbound express lane traffic. During the assessment 244 pedestrians crossed Roosevelt Boulevard and 226 crossed Rhawn Street. The morning had 171 pedestrians, with an 86 pedestrian hourly average. The afternoon had 299 pedestrians, with a 59 pedestrian hourly average. A peak occurred between 3:00 pm and 4:00 pm, with 114 pedestrian crossings. The intersection had an illegal crossing rate of 65%, all of which can be attributed to pedestrians not completing the crossing prior to signal expiration. Recommended Improvements: Install pedestrian countdown signals with illuminated pedestrian push buttons. Restripe all crosswalks using the international style. Install crosswalk safety educational signs. Create a center median pedestrian safety refuge. Retime pedestrian crossing time allowance to accommodate a slower speed of 3.5 feet per second and ensure that the new time enables pedestrians to reach the center median in one signal cycle. Install advisory signs for the southbound express lanes returning to grade. Widen the walkways in the north-side center median.
49 Roosevelt Boulevard Corridor Study Rhawn Street and Roosevelt Boulevard LEONARD ST Figure 15 Recommended Location for Advisory Sign RHAWN ST Wawa ROOSEVELT BLVD Narrow Walkways Auto Dealership Fast Food Restaurant ROOSEVELT BLVD ROOSEVELT BLVD Gas Station RHAWN ST Orthophotography - DVRPC, Spring 2005 Delaware Valley Regional Planning Commission June 2007 K Feet
50 42 US 1- Roosevelt Boulevard Corridor Study XII. Welsh Road and Roosevelt Boulevard The Welsh Road and Roosevelt Boulevard intersection is surrounded by commercial establishments at all four corners. Beyond the commercial establishments in the northwest and southeast corners is a mix of single-family and multifamily housing. The southwest quadrant has a mixed variety of housing beyond the commercial establishments. The intersection is unique due to the lack of a significant center median. While this decreases the crossing distance to only 220 feet, there is not a safe place for pedestrians who cannot complete the entire crossing in one light cycle to wait. The crosswalks at this intersection are all painted in the international style, which increases their visibility. SEPTA Routes 1 and 14 on Roosevelt Boulevard and Route 88 on Welsh Road serve this intersection. It is a bus transfer location that does not have shelters. Between 2001 and 2005, five pedestrian/vehicle crashes have occurred at the intersection. All five crashes resulted in injury to the pedestrian. A driver-caused crash occurred during the evening in the northbound local lanes, three pedestrian-caused crashes occurred during daylight in the northbound express lanes, and a final pedestrian-caused crash occurred during daylight in the southbound express lanes. The intersection was assessed by DVRPC personnel on Saturday, May 19, During the assessment the following comments were noted: 1) A large portion of the pedestrian traffic was elderly; and 2) Nearly all pedestrians were attributed to either buses or the nearby shopping centers. During the assessment 185 pedestrians crossed Roosevelt Boulevard and 100 crossed Welsh Road. The average was 71 pedestrian crossings per hour. The numbers are significant due to the low-density residential neighborhoods in the vicinity of the intersection. Recommended Improvements: Install pedestrian countdown signals with illuminated pedestrian push buttons. Restripe all crosswalks using the international style. Install crosswalk safety educational signs. Create a center median pedestrian safety refuge. Retime pedestrian crossing time allowance to accommodate a slower speed of 3.5 feet per second and ensure that the new time enables pedestrians to reach the center median in one signal cycle. Install bus stop shelters.
51 Roosevelt Boulevard Corridor Study Welsh Road and Roosevelt Boulevard Figure 16 Gas Station ROOSEVELT BLVD WELSH RD Recommended Bus Shelter Location ROOSEVELT BLVD Narrow Center Median Northeast Shopping Center Recommended Bus Shelter Location WELSH RD Shopping Center Orthophotography - DVRPC, Spring 2005 Delaware Valley Regional Planning Commission June 2007 K Feet
52 44 US 1- Roosevelt Boulevard Corridor Study XIII. Grant Avenue and Roosevelt Boulevard This intersection is between low-density residential housing to the west and commercial establishments to the east. It is in between four local-to-express crossovers from feet away from the intersection (0310/ /2171, 0311/ /2153, 0321/ /764, and 0320/ /900). There are also left-turn lanes adjacent to the express lanes and two in the southbound direction, which increases the crossing distance. Despite the extra lanes, this intersection provides one of Roosevelt Boulevard s shortest crossing distances, only 205 feet. However, the turning lanes have made the center medians narrow in size, as narrow as four feet on the northern side of Roosevelt Boulevard. Lastly, there are no sidewalks present on Roosevelt Boulevard or Grant Avenue in the northeast quadrant of the intersection. The intersection is served by SEPTA Routes 1 and 14 on Roosevelt Boulevard and Route 19 on Grant Avenue. It is a bus transfer location that does not have shelters. Between 2001 and 2005 four pedestrian/vehicle crashes occurred at this intersection. The southbound local lanes had an evening pedestrian-caused crash and the northbound express lanes had three daylight crashes; two driver caused and one pedestrian caused. All crashes resulted in injury to the pedestrian. The intersection was assessed by DVRPC personnel on Saturday, May 19, During the assessment the following observations were noted: 1) Nearly all pedestrian traffic was attributable to buses and the shopping centers; 2) The three-phase signal timing plan confused pedestrians with its all-red control during the third phase and protected left turns from Roosevelt Boulevard. During this interval many pedestrians either started or continued their crossing; and 3) There is heavy truck traffic turning onto eastbound Grant Avenue. During the four hours of assessment, 88 pedestrians crossed Roosevelt Boulevard and 55 crossed Grant Avenue. This translates into an average of 36 pedestrian crossings per hour. The intersection had a 60% illegal crossing rate, which is in part due to the third signal phase. Recommended Improvements: Install pedestrian countdown signals with illuminated pedestrian push buttons. Restripe all crosswalks using the international style. Install crosswalk safety educational signs. Create a center median pedestrian safety refuge. Retime pedestrian crossing time allowance to accommodate a slower speed of 3.5 feet per second and ensure that the new time enables pedestrians to reach the center median in one signal cycle. Construct a continuous sidewalk in the northeast quadrant of the intersection. Install a bus stop shelter.


53 Roosevelt Boulevard Corridor Study Grant Avenue and Roosevelt Boulevard HILSPACH ST GRANT AVE Office Building Recommended Bus Shelter Location ROOSEVELT BLVD Figure 17 ROOSEVELT BLVD Office Building Narrow Center Median Recommended New Sidewalk ROOSEVELT BLVD ROOSEVELT BLVD Recommended Bus Shelter Location Gas Station GRANT AVE Orthophotography - DVRPC, Spring 2005 Delaware Valley Regional Planning Commission June 2007 K Feet
54 46 US 1- Roosevelt Boulevard Corridor Study 6.3 Mid-Block Crosswalks I. At Bingham Street and Rorer Street This is a signalized crosswalk that crosses Roosevelt Boulevard where Bingham Street meets the southbound side of Roosevelt Boulevard and Rorer Street meets the northbound side. It is the southernmost mid-block crosswalk in the DVRPC study corridor. The nearest crosswalk is at the C Street and Roosevelt Boulevard intersection. Both ends of the crosswalk open to dense row home neighborhoods. Landmarks in the vicinity include Tacony Creek Park beginning north of the crosswalk, and The Saint Ambrose School approximately 400 feet from the crosswalk s western end. This is a signalized crosswalk. There is a crossover for each direction of travel directly north of the crosswalk (0190/ /1123 and 0191/ /1058). SEPTA Routes 1, 8, J, and R serve the area. Between 2001 and 2005 two bicycle/vehicle crashes occurred near this crosswalk. The crashes did not physically take place on the crosswalk; however, the locations suggest that the cyclists may have been avoiding one end of the crosswalk due to the associated center-median offset. This crosswalk was assessed by DVRPC personnel on Thursday, May 17 and Thursday, May 31, During the assessment the following observations were noted: 1) There are large gaps in north to south traveling traffic, which encourages crossing during Don t Walk signals; 2) Most pedestrians did not press the signal button; 3) Pedestrians approaching Roosevelt Boulevard from D Street tended to cross the first half of Roosevelt Boulevard outside of the crosswalk; 4) Either the west-side signal button does not function properly or there is an extensive wait after the button is pushed for a Walk signal; and 5) Traffic, particularly southbound, has approximately one-quarter mile of unimpeded flow, causing high speeds to be reached near the crosswalk. A total of 128 pedestrians used this crosswalk during the DVRPC assessment on May 17. There was a slight peak in usage during afternoon school dismissal. Recommended Improvements: Install pedestrian countdown signals with illuminated pedestrian push buttons. Restripe the crosswalk using the international style. Install crosswalk safety educational signs. Retime pedestrian crossing time allowance to accommodate a slower speed of 3.5 feet per second and ensure that the new time enables pedestrians to reach the center median in one signal cycle. Install permanent speed display signs. Examine the potential for a pedestrian overpass for this location.
55 Roosevelt Boulevard Corridor Study At Bingham Street and Rorer Street Figure 18 BINGHAM ST Tacony Creek Park Saint Ambrose School D ST Recommended Location for Permanent Speed Display Sign ROOSEVELT BLVD Crossovers ROOSEVELT BLVD GRANSBACK ST RORER ST Orthophotography - DVRPC, Spring 2005 Delaware Valley Regional Planning Commission June 2007 K Feet
56 48 US 1- Roosevelt Boulevard Corridor Study II. At Smylie Road This crosswalk is located where Smylie Road would theoretically cross Roosevelt Boulevard if it were a through street. It is approximately 500 feet north of the F Street and Roosevelt Boulevard intersection, and approximately 400 feet south of the Whitaker Avenue mid-block crosswalk. There are no significant landmarks in the vicinity. The surrounding area is primarily row home residential neighborhoods. A southbound localto-express crossover is directly north of the crosswalk (0201/ /872). SEPTA Routes 1, 8, J, and R serve the area. The crosswalk had no pedestrian/vehicle crashes between 2001 and However, a pedestrian was struck in the southbound express lanes during daylight hours approximately 72 feet south of the crosswalk. The crosswalk was assessed by DVRPC personnel on Thursday, May 17, During the assessment the following observations were noted: 1) Traffic regularly backed up past the crosswalk in both directions between 3:00 pm and 6:30 pm, most often in the northbound inner lanes. The outer lanes backed up every signal cycle between 4:00 pm and 6:30 pm; 2) The crosswalk does not have a signal; and 3) There are no northbound warning signs. 112 pedestrians were witnessed using this crosswalk during the seven hours of the assessment. A slight peak was evident around the afternoon school dismissal time. Due to the nature of the crosswalk, unsignalized and straight across, no pedestrians were noted as crossing illegally. Recommended Improvements: Based on the close proximity to the Whitaker Avenue crosswalk, it is recommended that this crosswalk be eliminated. Install signs directing pedestrians to use the Whitaker Avenue or F Street crosswalk. Consolidate associated bus stops with the nearby intersection bus stops.
57 Roosevelt Boulevard Corridor Study At Smylie Road Figure 19 G SMYLIE RD ROOSEVELT BLVD Crossover Recommended to be Eliminated ROOSEVELT BLVD SMYLIE RD Orthophotography - DVRPC, Spring 2005 Delaware Valley Regional Planning Commission June 2007 K Feet
58 50 US 1- Roosevelt Boulevard Corridor Study III. At Garland Street and Whitaker Avenue This signalized crosswalk runs from where Garland Street meets Roosevelt Boulevard to the west and Whitaker Avenue meets Roosevelt Boulevard to the east. It is the only crosswalk, with the exception of the Smylie Road crosswalk, for a considerable distance. The eastern side is primarily row homes and the western side includes a hotel, a carwash, and row homes. The Wal-Mart shopping center is approximately 1,000 feet north on the western side. There is a southbound crossover directly south of the crosswalk (0201/ /872). The area is served by SEPTA Routes 1, 8, J, and R. Between 2001 and 2005 there were no pedestrian/vehicle crashes at or near this crosswalk. The crosswalk was assessed by DVRPC personnel on Thursday, May 17, During the assessment the following observations were noted: 1) The majority of pedestrian foot traffic was school children; 2) The crosswalk signals are pedestrian actuated; 3) A curve in the roadway for southbound approaching traffic shortens the line of sight; and 4) There are no crosswalk advisory signs at the crosswalk on the southbound side. During the seven hours of DVRPC assessment, 287 pedestrians crossed Roosevelt Boulevard at this crosswalk. An extremely high percentage, 72%, completed the crossing illegally, or against a Don t Walk signal. As with most crossings, a peak pedestrian usage was recorded around the afternoon school dismissal time. Although this is the most utilized mid-block crosswalk in the corridor, preliminary analysis suggests that the construction of a pedestrian overpass at this location may not be feasible. Recommended Improvements: Install pedestrian countdown signals with illuminated pedestrian push buttons. Restripe the crosswalk using the international style. Install crosswalk safety educational signs. Retime pedestrian crossing time allowance to accommodate a slower speed of 3.5 feet per second and ensure that the new time enables pedestrians to reach the center median in one signal cycle. Install pedestrian crosswalk advisory signs at the crosswalk on the southbound side.
59 Roosevelt Boulevard Corridor Study At Garland Street and Whitaker Avenue Figure 20 Hotel Recommended Permanent Speed Display Sign Location GARLAND ST Car Wash Recommended Locations for Advisory Signs Crossover ROOSEVELT BLVD WHITAKER AVE Orthophotography - DVRPC, Spring 2005 Delaware Valley Regional Planning Commission June 2007 K Feet
60 52 US 1- Roosevelt Boulevard Corridor Study IV. At Sanger Street This crosswalk connects East and West Sanger Streets across Roosevelt Boulevard. The western side of the crosswalk is primarily row home neighborhoods and the Saint Martin of Tours School. The east side is multifamily home neighborhoods and a McDonald s Restaurant. The crosswalk benefits from the grade separation of the Roosevelt Boulevard express lanes under Oxford Avenue. The crosswalk goes over the express lanes, leaving only two series of three lanes for at-grade pedestrian crossing. There are signals present to aid pedestrians across the local lanes of Roosevelt Boulevard. SEPTA Route 1 serves the area. Between 2001 and 2005 there were no pedestrian/vehicle crashes at or near this crosswalk. The crosswalk was assessed by DVRPC personnel on Thursday, May 17, The surveyors observed no issues. 184 pedestrians crossed Roosevelt Boulevard at this crosswalk during the seven hours of assessment. Half of the pedestrians crossed without a Walk signal when there were gaps in traffic. Recommended Improvements: Install pedestrian countdown signals with illuminated pedestrian push buttons. Install crosswalk safety educational signs.
61 Roosevelt Boulevard Corridor Study At Sanger Street CHELTENHAM AVE Figure 21 Saint Martin of Tours School SANGER ST ROOSEVELT BLVD Pedestrian Bridge Over Express Lanes ROOSEVELT BLVD McDonald's Restaurant CASTOR AVE SANGER ST OXFORD AVE Orthophotography - DVRPC, Spring 2005 Delaware Valley Regional Planning Commission June 2007 K Feet
62 54 US 1- Roosevelt Boulevard Corridor Study V. At Benner Street This crosswalk crosses Roosevelt Boulevard where Benner Street would be if it were a through street. It splits the distance between the Large Street intersection and the Devereaux Avenue intersection, approximately 700 feet from either. Both sides of Roosevelt Boulevard at the crosswalk open to extensive row home residential housing. Physically, the crosswalk is angled at approximately 45º from Roosevelt Boulevard. The angled nature, along with creating a greater crossing distance, forces pedestrians to look over their shoulder during the second half of the crossing to view oncoming traffic. There are crossovers for each direction of travel directly south of the crosswalk (0230/ /2165 and 0231/ /1730). The area is served by SEPTA Route 1. Two pedestrian/vehicle crashes occurred at this crosswalk between 2001 and 2005, including one fatality. Both crashes occurred in the northbound local lanes. The fatality was at night and caused by the pedestrian, while the other was a daylight driver-caused crash. The crosswalk was assessed by DVRPC personnel on Thursday, May 17, During the assessment the following observations were noted: 1) There appears to be a drainage problem at the median walkways; 2) It can be difficult for merging traffic at this location to see pedestrians in the crosswalk ahead of time; and 3) There are no crosswalk advisory signs for southbound traffic at the crosswalk. During the seven hours of assessment, only 27 pedestrians used this crosswalk. Recommended Improvements: Based on the minimal usage, proximity to crossovers, and proximity to intersection crosswalks, this crosswalk is recommended to be eliminated. Install signs directing pedestrians to use the nearby intersection crosswalks. Consolidate the associated bus stops with the nearby intersection bus stops.
63 Roosevelt Boulevard Corridor Study At Benner Street Figure 22 LARDNER ST Drainage Problem BENNER ST ROOSEVELT BLVD Recommended to be Eliminated Drainage Problem Crossovers ROOSEVELT BLVD BENNER ST HORROCKS ST Orthophotography - DVRPC, Spring 2005 Delaware Valley Regional Planning Commission June 2007 K Feet
64 56 US 1- Roosevelt Boulevard Corridor Study VI. At Unruh Avenue This mid-block crosswalk crosses Roosevelt Boulevard where Unruh Avenue would if it were a through street. It is one block north of the Roosevelt Boulevard and Harbison Avenue intersection and approximately 1,200 feet south of the next crossing point to the north. The crosswalk departs from the northwest corner of the ACME supermarket property and arrives at the southeast corner of Our Lady of Ransom church and school. There is also a large amount of row home housing in the vicinity. This is a pedestrianactuated, signalized crosswalk. SEPTA Routes 1, 14, 20, and 50 serve the area. Between 2001 and 2005, two pedestrian/vehicle crashes occurred at this crosswalk; both were pedestrian caused, in the evening, and resulted in pedestrian injury. One was in the northbound local lanes and the other was in the southbound express lanes. The crosswalk was assessed by DVRPC personnel on Thursday, May 17, During the assessment the following observations were noted: 1) There are bus stops at both ends of the crosswalk. The one on the southbound side has a shelter; 2) The bus stops were noted as being lightly used; 3) There is a slight curve in the road approaching the crosswalk; 4) Pedestrians were noted as being approximately 50% school-aged children and 50% patrons of the ACME supermarket; 5) The pedestrian-actuated cross signals require a stop and wait at each of the three medians; and 6) Unneeded disruptions to traffic flow were created by pedestrians pushing the signal actuation buttons and then crossing before the signal changed to Walk. During the assessment 144 pedestrians were recorded using the Unruh Avenue midblock crosswalk. The two AM hours of assessment found light use while the PM assessment had moderate use. There were two distinct peaks in usage: one around the afternoon school dismissal time and another around 6:00 pm. This crosswalk had the third-greatest number of pedestrian mid-block crossings and the greatest percentage (75%) of illegal crossings of all mid-block crosswalks. Recommended Improvements: Install pedestrian countdown signals with illuminated pedestrian push buttons. Restripe the crosswalk using the international style. Install crosswalk safety educational signs. Retime pedestrian crossing time allowance to accommodate a slower speed of 3.5 feet per second and ensure that the new time enables pedestrians to reach the center median in one signal cycle. Redesign the operation of the pedestrian-actuated push button controls to best prevent vehicle starvation. Install a bus stop shelter for the northbound direction. Examine the feasibility of constructing a pedestrian bridge at this location due to high pedestrian volumes.
65 Roosevelt Boulevard Corridor Study At Unruh Avenue Our Lady of Ransom School Figure 23 UNRUH AVE HARBISON AVE ROOSEVELT BLVD UNRUH AVE ROOSEVELT BLVD Recommended Bus Shelter Location Acme Supermarket MAGEE AVE Orthophotography - DVRPC, Spring 2005 Delaware Valley Regional Planning Commission June 2007 K Feet
66 58 US 1- Roosevelt Boulevard Corridor Study VII. At Longshore Avenue This intersection is located at the approximate midpoint of the DVRPC study area. It connects Longshore Avenue across Roosevelt Boulevard. Longshore Avenue itself does not cross Roosevelt Boulevard. There is considerable distance to the nearest crosswalk to the south, and a one-block distance, or about 450 feet, to the next northern crosswalk at the Tyson Avenue and Roosevelt Boulevard intersection. The surrounding area is entirely row home neighborhoods. There is a southbound express-to-local crossover beginning at the crosswalk (0251/ /1657). SEPTA Routes 1, 14, 20, and 50 serve the area. This crosswalk had zero pedestrian/vehicle crashes between 2001 and However, one crash did occur in the vicinity. The location of the crash suggests that the pedestrian was attempting to cross 48 feet south of the crosswalk on the side of Longshore Avenue that does not have a crosswalk. The crosswalk was assessed by DVRPC personnel on Thursday, May 17, During the assessment the following observations were noted: 1) The southbound crosswalk advisory signs are absent; 2) The crosswalk was very lightly used; and 3) The pedestrians all either appeared to be school-aged children or bus passengers. During the seven hours of assessment, only 74 pedestrians crossed Roosevelt Boulevard at this crosswalk. Recommended Improvements: Due to minimal usage and the proximity to Tyson Avenue, it is recommended that this crosswalk is eliminated. Install signs directing pedestrians to use the Tyson Avenue intersection crosswalks. Consolidate associate bus stops with nearby intersection bus stops.
67 Roosevelt Boulevard Corridor Study At Longshore Avenue Figure 24 LONGSHORE AVE ROOSEVELT BLVD Recommended to be Eliminated ROOSEVELT BLVD LONGSHORE AVE REVERE ST Orthophotography - DVRPC, Spring 2005 Delaware Valley Regional Planning Commission June 2007 K Feet
68 60 US 1- Roosevelt Boulevard Corridor Study VIII. Between Princeton Avenue and Friendship Street This intersection falls between the Tyson Avenue and Roosevelt Boulevard intersection, 630 feet to the south, and another mid-block crosswalk 355 feet north. There is a Kmart shopping center on the eastern side of the crosswalk and row home residential housing on the western side. There is a southbound local-to-express crossover that begins at the crosswalk (0251/ /1657). The area is served by SEPTA Routes 1, 14, 20, and 50. Between 2001 and 2005 this crosswalk had no pedestrian/vehicle crashes. Several crashes occurred in the vicinity which are further discussed in the Friendship Street and Saint Vincent Avenue mid-block crosswalk section. The crosswalk was assessed by DVRPC personnel on Thursday, May 17, During the assessment the following observations were noted: 1) There is no crosswalk advisory signs at the crosswalk on the southbound side; 2) Motorists may be unable to see pedestrians in the southbound median due to a large pole that supports an overhead sign; 3) The majority of jaywalkers were pedestrians who had alighted a bus; and 4) No school-aged children were observed using the crosswalk. During the seven hours of assessment, 60 pedestrians crossed Roosevelt Boulevard at this crosswalk. There was a fairly even distribution throughout the entire assessment period. Recommended Improvements: Consolidate crosswalk with northern neighbor, between Friendship Street and Saint Vincent Avenue, and create a new signalized crosswalk that extends from the southern side of Friendship Street. Install pedestrian countdown signals with illuminated pedestrian push buttons at the new crosswalk. Stripe the new crosswalk using the international style. Install crosswalk safety educational signs at the new location. Retime pedestrian crossing time allowance to accommodate a slower speed of 3.5 feet per second and ensure that the new time enables pedestrians to reach the center median in one signal cycle. Ensure crosswalk advisory signs are posted at the crosswalk and at advanced locations. Consolidate bus stops in the vicinity to stop at each end of the new crosswalk only.
69 Roosevelt Boulevard Corridor Study Between Princeton Avenue and Friendship Street Figure 25 FRIENDSHIP ST Recommended Location for Advisory Sign Recommended Bus Shelter Location ROOSEVELT BLVD ROOSEVELT BLVD PRINCETON AVE Recommended Location for Advisory Sign Recommended Elimination of Current Crosswalk Recommended Bus Shelter Location Kmart PRINCETON AVE Orthophotography - DVRPC, Spring 2005 Delaware Valley Regional Planning Commission June 2007 K Feet
70 62 US 1- Roosevelt Boulevard Corridor Study IX. Between Friendship Street and Saint Vincent Avenue This mid-block crosswalk is very similar to the one located 355 feet to the south between Princeton Avenue and Friendship Street. The eastern end of the crosswalk opens to a shopping center while row home housing and a church dominate the western end. There is a northbound express-to-local crossover beginning at this crosswalk (0260/ /1243). Also north of the intersection is the beginning of the depression of the express lanes for travel under Cottman Avenue. This depression is a safety issue due to southbound traffic returning to grade just prior to the crosswalk, thereby diminishing visibility for both pedestrians and traffic. This portion of Roosevelt Boulevard is served by SEPTA Routes 1, 14, 20, and 50, though the nearest bus stops are 140 feet north of the intersection, again creating a safety issue due to pedestrian traffic crossing at the location of the bus stop as is demonstrated with the third fatality discussed below. This crosswalk has seen one bicycle/vehicle crash at the crosswalk and numerous pedestrian/vehicle crashes in the vicinity between 2001 and The bicycle crash occurred in the southbound express lanes and resulted in the death of the cyclist. Between this crosswalk and its southern neighbor, between Princeton Avenue and Friendship Street, three pedestrian/vehicle crashes occurred. One of these crashes resulted in the death of the pedestrian. Additionally, a third fatal crash occurred directly north of the crosswalk in the southbound local lanes. The crosswalk was assessed by DVRPC personnel on Thursday, May 17, During the assessment the following observations were noted: 1) There were no school-aged children using the crosswalk; 2) Some pedestrians crossed outside of the marked crosswalk; 3) The associated bus stops are not at the crosswalk; and 4) There are no southbound local warning signs. During the assessment 47 pedestrians used this crosswalk. This is an average of seven pedestrians per hour. Though this number may appear to be insignificant, if combined with the nearby mid-block crosswalk, between Princeton Avenue and Friendship Street, the number of pedestrian crossings would be above average for midblock crosswalks. Recommended Improvements: Remove existing crosswalk and create a new, consolidated crosswalk which extends across Roosevelt Boulevard from the southern side of Friendship Street. Follow the recommendations listed for crosswalk VIII.
71 Roosevelt Boulevard Corridor Study Between Friendship Street and Saint Vincent Avenue Figure 26 CALVERT ST Grade-Separated Express Lanes SAINT VINCENT ST Office Building ROOSEVELT BLVD ROOSEVELT BLVD Recommended Elimination of Current Crosswalk Crossover FRIENDSHIP ST Recommended Location of New Crosswalk SAINT VINCENT ST Medical Office REVERE ST Kmart Orthophotography - DVRPC, Spring 2005 Delaware Valley Regional Planning Commission June 2007 K Feet
72 64 US 1- Roosevelt Boulevard Corridor Study X. Between Shelmire Avenue and Faunce Street This crosswalk crosses Roosevelt Boulevard 40 feet south of Faunce Street on the western side, and 170 feet south of Revere Street on the eastern side. The area surrounding the crosswalk is a mix of single-family homes, multifamily homes, and apartments, with the exception of the motel and bar that occupy the land on the crosswalk s eastern end. Very little of the surrounding population walks to work (0-3%) and public transportation use is also very low (0-15%), thereby creating a very autodependent portion of the study area. Physical traits include crossovers for each direction of travel beginning at the crosswalk (0271/ /2117 and 0270/ /2528) and a southern curve and down slope, which, particularly for northbound traffic, reduces visibility and contributes to higher automobile speeds. The crosswalk does not end at a street on either end, which does not encourage its use for local pedestrian traffic. SEPTA Routes 1, 14, 20, and 50 serve the area. No pedestrian/vehicle crashes occurred at this crosswalk between 2001 and There were two fatal pedestrian/vehicle crashes 175 feet north of the crosswalk. The location of the crashes suggests that the pedestrians were attempting to cross to or from Revere Street. The crosswalk was assessed by DVRPC personnel on Thursday, May 17, During the assessment the following observations were noted: 1) No single demographic characteristic stood out among the pedestrians; 2) Many people were seen crossing near Revere Street; 3) High vehicle speeds were witnessed at this crosswalk; and 4) There are no crosswalk advisory signs on the southbound side. Only 25 pedestrians were seen crossing this crosswalk during the seven hours of assessment. This ranks second in terms of fewest pedestrian crossings. There were periods as long as two hours with no pedestrian activity. Recommended Improvements: Install pedestrian-actuated traffic control signals. Also, install complementary signs that warn pedestrians to only cross with the signal. Restripe the crosswalk using the international style. Install crosswalk safety educational signs. Reconfigure so that the crosswalk crosses Roosevelt Boulevard at 90 with any offset needed occurring in the center median. This will allow pedestrians to view oncoming traffic before and during their crossing. Install crosswalk advisory signs for southbound traffic at the crosswalk and at an advanced location.
73 Roosevelt Boulevard Corridor Study Between Shelmire Avenue and Faunce Street Figure 27 Recommended Location for Advisory Signs FAUNCE ST ROOSEVELT BLVD Crossover Recommended Location for Advisory Signs REVERE ST FAIRFIELD ST Motel and Bar Crossover Recommended New Crossing Alignment ROOSEVELT BLVD LEXINGTON AVE BROUS AVE Orthophotography - DVRPC, Spring 2005 Delaware Valley Regional Planning Commission June 2007 K Feet
74 66 US 1- Roosevelt Boulevard Corridor Study XI. At Loney Street The Loney Street mid-block crosswalk is the northern-most mid-block crosswalk within the DVRPC study corridor. It is surrounded by a level of dense housing along Roosevelt Boulevard, which quickly becomes single-family and multifamily housing. There is a catering hall and a fitness center southwest of the crosswalk. The crosswalk is in between the Rhawn Street intersection, 460 feet to the north, and the Borbeck Avenue intersection, 390 feet to the south. There is a crossover for each direction of travel beginning at the crosswalk (0280/ /612 and 0281/ /544). Unique to this crosswalk is a 200-foot center-median offset. SEPTA Routes 1, 14, 20, and 50 serve the area. There were no pedestrian/vehicle crashes at this crosswalk, or in the vicinity, between 2001 and The crosswalk was assessed by DVRPC personnel on Thursday, May 17, During the assessment the following observations were noted: 1) There is adequate signage present; and 2) There is not a pedestrian crossing signal. This crosswalk had the fewest pedestrian crossings of any DVRPC study area crosswalk. Only 20 pedestrians used the crosswalk during the seven hours of assessment. Of this total, few used the full length of the crosswalk. Recommended Improvements: Due to low utilization rates and the presence of two nearby crosswalks, this crosswalk is recommended to be eliminated. Consolidate associated bus stops with nearby intersection bus stops.
75 Roosevelt Boulevard Corridor Study At Loney Street Figure 28 LONEY ST LEONARD ST Car Wash ROOSEVELT BLVD Recommended Elimination of Crosswalk ROOSEVELT BLVD Fitness Center Crossover LONEY ST Recommended Elimination of Crosswalk BORBECK AVE Orthophotography - DVRPC, Spring 2005 FAIRFIELD ST Delaware Valley Regional Planning Commission June 2007 K Feet
76 68 US 1- Roosevelt Boulevard Corridor Study 7.0 LONG-TERM MOBILITY IMPROVEMENT 7.1 Lane Crossover Redesign Introduction Along Roosevelt Boulevard, crossovers are in place to permit traffic to move from the inner roadway to the outer, and vice versa. There are two types of crossovers: local-to-express and express-to-local. The two types of crossovers have been grouped together at some major intersections. This configuration accommodates all potential movements. Local traffic can move to the express lanes to turn left and express traffic can move to the local lanes to turn right. DVRPC has studied the Roosevelt Boulevard crossovers in order to identify opportunities for the improvement or elimination of deficient crossovers. Methodology There are 37 crossovers on Roosevelt Boulevard between Ninth Street and Grant Avenue. There are 16 crossovers in the northbound direction, approximately one per one-half mile, and 21 crossovers in the southbound direction, approximately one per four-tenths mile. Each of the crossovers is a unique entity. No single factor or set of criteria can be applied across the full spectrum of crossovers. Each crossover has been studied individually, with the exception of their functional relationships, and therefore decision rationale will be discussed for each crossover that DVRPC recommends to change or eliminate. Crossovers In order to easily identify the individual crossovers, DVRPC has provided a designation based on its order in the direction of traffic flow (see Maps: 5, 6, 7, 8, and 9). There are two general types of crossovers: express-to-local, and local-to-express. Additionally, all crossovers have been constructed in different lengths and at different distances from each other. The following are two tables (Tables 7 and 8) of crossover data and include; DVRPC designations, locations, functional types, lengths, and approximate distances from the next of the same type:
77 US 1 Roosevelt Boulevard Corridor Study 69 Table 7 Southbound Crossovers Southbound DVPRC Nearest Distance to Designation Street Type Length (feet) next (feet)* SB 1 Michener local-to-express 235 4,000 SB 2 Goodnaw express-to-local 122 3,500 SB 3 Winchester express-to-local 180 4,800 SB 4 Rahle local-to-express 226 5,800 SB 5 Loney express-to-local 213 3,300 SB 6 Shelmire local-to-express 197 3,600 SB 7 Sandyford express-to-local 314 3,300 SB 8 Princeton local-to-express 287 3,200 SB 9 Longshore express-to-local 281 5,400 SB 10 Hellerman local-to-express 251 6,400 SB 11 Benner express-to-local 269 3,600 SB 12 Bridge local-to-express 255 5,800 SB 13 Pratt express-to-local 246 2,800 SB 13B Langdon express-to-local 244 3,600 SB 14 Garland local-to-express 245 3,100 SB 15 Bingham express-to-local 292 1,700 SB 16 C local-to-express 250 1,500 SB 17 Rising Sun express-to-local 237 2,300 SB 18 Front local-to-express 234 N/A SB 19 Rockland express-to-local 241 2,500 SB 20 Eighth express-to-local 216 N/A *Distance to next of the same type Source: DVRPC, 2007
78 70 US 1- Roosevelt Boulevard Corridor Study Table 8 Northbound Crossovers Northbound DVPRC Nearest Distance to Designation Street Type Length (feet) next (feet)* NB 1 Second local-to-express 256 4,200 NB 2 Front express-to-local 269 3,600 NB 3 Rorer local-to-express 178 7,000 NB 4 Front express-to-local 230 7,000 NB 5 Kenwyn local-to-express 232 6,700 NB 6 Bridge express-to-local 226 3,400 NB 7 Benner express-to-local 405 2,900 NB 8 Levick local-to-express 260 8,800 NB 9 Harbison express-to-local 246 3,700 NB 10 Saint Vincent express-to-local 184 5,100 NB 11 Revere local-to-express 223 7,600 NB 12 Loney express-to-local 123 4,900 NB 13 Winchester express-to-local 236 3,200 NB 14 Woodward local-to-express 252 4,000 NB 15 Welsh express-to-local 230 N/A NB 16 Grant local-to-express 233 N/A *Distance to next of the same type Source: DVRPC, 2007
79 Roosevelt Boulevard Corridor Study - Crossover Locations (Panel 1) Map 5 MAYFAIR ST E CLARKSON AVE W TABOR RD N AMERICAN ST W SOMERVILLE AVE WAGNER AVE E OLNEY AVE LIMA ST W FISHER AVE E TABOR RD N FRONT ST LINDLEY AVE N 9TH ST MASCHER ST SB 20 SB 19 L NB 1 L SB 18 NB 2 SB 17 SB 16 L SB 15 NB 3 NB 4 L F ST A ST N 8TH ST N 6TH ST N 2ND ST N WARNOCK ST N 11TH ST N HUTCHINSON ST N 4TH ST N 7TH ST N FAIRHILL ST D ST W DUNCANNON AVE W ASHDALE ST N FRANKLIN ST N WATER ST WINDRIM AVE SYCAMORE ST DELPHINE ST GENEVA AVE LANDIS ST GARLAND ST W WELLENS AVE E FISHER AVE N MARVINE ST BINGHAM ST WESTFORD RD ARBOR ST E ALBANUS ST HERKNESS ST W ROCKLAND ST E ROOSEVELT BLVD PENNWAY ST ORMES ST N MARSHALL ST N 3RD ST B ST E WELLENS AVE E SHELDON ST W ALBANUS ST E SOMERVILLE AVE MARLEY RD MARWOOD RD SMYLIE RD RUBICAM ST ROBAT ST E DUNCANNON AVE W SHELDON ST MEBUS ST E RUSCOMB ST W RUSCOMB ST EALBANUS ST JERICHO RD W ROOSEVELT BLVD E ROCKLAND ST E ELEANOR ST WHITAKER AVE RISING SUN AVE W WYOMING AVE E LOUDON ST B ST W LURAY ST N 5TH ST N LAWRENCE ST SULIS ST E ASHDALE ST GRANSBACK ST N LEITHGOW ST W ELEANOR ST RORER ST HOPE ST PALETHORP ST W LOUDON ST N 2ND ST N 2ND ST MARWOOD RD ELLA ST N HOWARD ST N 10TH ST MAYFAIR ST WESTFORD RD W DUNCANNON AVE RORER ST HOPE ST A ST N MARSHALL ST SMYLIE RD W RUSCOMB ST W ALBANUS ST E ROOSEVELT BLVD RORER ST ROSEHILL ST W ROCKLAND ST N MARSHALL ST N FRANKLIN ST W WELLENS AVE N LAWRENCE ST ELLA ST N HOWARD ST N AMERICAN ST EASHDALE ST W RUSCOMB ST PALETHORP ST E RUSCOMB ST E RUSCOMB ST N LAWRENCE ST BOUDINOT ST W LOUDON ST W LOUDON ST N HOWARD ST GRANSBACK ST W WYOMING AVE W LOUDON ST W MENTOR ST W LOUDON ST W MENTOR ST D ST N LAWRENCE ST N FAIRHILL ST BINGHAM ST E MENTOR ST W ROOSEVELT BLVD W COURTLAND ST W LURAY ST W COURTLAND ST E WYOMING AVE N 3RD ST C ST ROSEHILL ST ELLA ST W RAYMOND ST MAPLE LN E COURTLAND ST WEYMOUTH ST G ST H ST RORER ST TIBER ST TAMPA ST W LURAY ST W COURTLAND ST E LURAY ST W THELMA ST W CAYUGA ST W WINGOHOCKING ST N REESE ST REACH ST SHELBOURNE ST PENHURST ST BOUDINOT ST HURLEY ST BLAVIS ST W ANNSBURY ST W RAYMOND ST N AMERICAN ST TAMPA ST N ORIANNA ST N BODINE ST N LEE ST N HOWARD ST SABER ST W LURAY ST W ANNSBURY ST E LURAY ST E THELMA ST N 8TH ST W ANNSBURY ST E MENTOR ST W RAYMOND ST PALETHORP ST W WINGOHOCKING ST W COURTLAND ST Map Panel Index TAMPA ST CASKEY ST N 6TH ST E THELMA ST E COURTLAND ST PURDY ST N 4TH ST N FAIRHILL ST E RAYMOND ST SAINT LUKES ST N 7TH ST N DARIEN ST N MARSHALL ST W BRISTOL ST N 10TH ST E ANNSBURY ST E WINGOHOCKING ST SAINT PAUL ST N FAIRHILL ST N MARSHALL ST N FRANKLIN ST E COURTLAND ST Orthophotography - DVRPC, Spring 2005 K Feet Express to Local Crossover Local to Express Crossover SB 19 Crossover ID L Crossover Lengthening Recommended Crossover Elimination Recommended Delaware Valley Regional Planning Commission June 2007
80 Roosevelt Boulevard Corridor Study - Crossover Locations (Panel 2) Map 6 ROBBINS ST SB 14 SB 13B SB 13 L SB 12 NB 5 NB 6 SB 11 NB 7 L BRIDGE ST PRATT ST ELBRIDGE ST HALE ST ANDALE ST IRLING ST ELMHURST ST ALLENGROVE ST LEVICK ST E GODFREY AVE HORROCKS ST MC KINLEY ST LORETTO AVE BENNER ST TABOR AVE DEVEREAUX AVE BUSTLETON AVE CASTOR AVE SUMMERDALE AVE OAKLAND ST AKRON ST HORROCKS ST E ROOSEVELT BLVD SANGER ST SAUL ST LARGE ST FRONTENAC ST AGUSTA ST HOWELL ST SYLVESTER ST BELDEN ST VAN KIRK ST EVERETT AVE ALMA ST EVENS ST SHISLER ST HIGBEE ST OXFORD AVE HARRISON ST CLARIDGE ST HOWLAND ST CARVER ST WHITAKER AVE GRANITE ST CRESTON ST HOWELL ST ALCOTT ST ROSALIE ST COMLY ST LARDNER ST SCATTERGOOD ST MARCELLA ST E CHELTENHAM AVE RUTLAND ST KINDRED ST SOUDER ST EASTWOOD ST OAKLAND ST ALCOTT ST MC KINLEY ST ROSALIE ST LARDNER ST CASTOR AVE ALCOTT ST SANGER ST ANCHOR ST COMLY ST E TABOR RD BENNER ST OXFORD CIR TROTTER ST MONTOUR ST LANDIS ST MAYFAIR ST MIRIAM RD GARLAND ST ANCHOR ST LANGDON ST TOWER BOULEVARD DWY DISCHER ST ALCOTT ST BRILL ST SMYLIE RD LEONARD ST FILLMORE TER PENNWAY ST SYLVESTER ST WAKELING ST KENNEDY ST KENWYN ST CRESTON ST SYLVESTER ST ADAMS AVE MONTOUR ST VAN KIRK ST LORETTO AVE GRANITE ST ANCHOR ST HAWORTH ST ALLENGROVE ST ADAMS ST FILLMORE ST ADAMS AVE FRANKFORD AVE FOULKROD ST HAWORTH ST WAKELING ST HERBERT ST ALLENGROVE ST LEIPER ST LANGDON ST E ROOSEVELT BLVD E CHELTENHAM AVE ANCHOR ST BRILL ST FOULKROD ST HOWELL ST HOWLAND ST ALCOTT ST HOWELL ST SYLVESTER ST E GODFREY AVE WHITAKER AVE SYLVESTER ST FOULKROD ST OXFORD AVE KENWYN ST E GODFREY AVE BRILL ST Map Panel Index KENWYN ST RUTLAND ST BRILL ST DARRAH ST PENN ST DYRE ST RAMONA AVE LESHER ST BRIDGE ST GRISCOM ST HARRISON ST FILLMORE ST GRANITE ST NORTHWOOD ST ARROTT ST Orthophotography - DVRPC, Spring 2005 K Feet Express to Local Crossover Local to Express Crossover SB 19 Crossover ID L Crossover Lengthening Recommended Crossover Elimination Recommended Delaware Valley Regional Planning Commission June 2007
81 Roosevelt Boulevard Corridor Study - Crossover Locations (Panel 3) Map 7 CARNWATH ST LEXINGTON AVE SHELMIRE AVE LEONARD ST FRIENDSHIP ST CALVERT ST CASTOR AVE RYAN AVE HORROCKS ST SB 10 NB 8 L NB 9 SB 9 SB 8 NB 10 SB 7 LARGE ST LORETTO AVE PENNYPACK PTH RUTLAND ST OAKLAND ST SANDYFORD AVE SAUL ST BROUS AVE TYSON AVE BUSTLETON AVE EASTWOOD ST DISSTON ST VISTA ST BRADFORD ST COTTMAN AVE LEONARD ST KINDRED ST HANFORD ST E ROOSEVELT BLVD SAUL ST NESPER ST CRISPIN ST SACKETT ST ROWLAND AVE HAWTHORNE ST GUILFORD ST LONGSHORE AVE SOUDER ST LYNFORD ST BATTERSBY ST REVERE ST SYLVESTER ST DISSTON ST BLEIGH AVE ENGLEWOOD ST LEON ST TUDOR ST ALDINE ST FRIENDSHIP ST UNRUH AVE WELLINGTON ST SAINT VINCENT ST KNORR ST ERDRICK ST FRANKFORD AVE LEVICK ST GLENVIEW ST PRINCETON AVE HELLERMAN ST MAGEE AVE HARBISON AVE CHARLES ST WALKER ST MONTAGUE ST RAWLE ST ELBRIDGE ST GILHAM ST ROBBINS ST BLEIGH AVE SOUDER ST BRIGHTON ST ENGLEWOOD ST AKRON ST WINDISH ST BRIGHTON ST VISTA ST RUPERT ST SAINT VINCENT ST CALVERT ST FRIENDSHIP ST CALVERT ST OAKMONT AVE OAKLAND ST BARNARD ST SHELMIRE AVE TEESDALE ST KNORR ST CRABTREE ST BRIGHTON PL FANSHAWE ST LONGSHORE AVE ALDINE ST TEESDALE ST LEONARD ST ALGARD ST COTTAGE ST FARNSWORTH ST MC KINLEY ST TEESDALE ST PRINCETON AVE CALVERT ST GLENVIEW ST VISTA ST BRADFORD ST AKRON ST EASTWOOD ST DISSTON ST REVERE ST BATTERSBY ST CALVERT ST BRIGHTON ST TUDOR ST GLENVIEW ST AKRON ST EASTWOOD ST REVERE ST E ROOSEVELT BLVD Map Panel Index UNRUH AVE MAGEE AVE FANSHAWE ST HELLERMAN ST PRINCETON AVE Orthophotography - DVRPC, Spring 2005 K CALVERT ST Feet Express to Local Crossover Local to Express Crossover SB 19 Crossover ID L Crossover Lengthening Recommended Crossover Elimination Recommended Delaware Valley Regional Planning Commission June 2007
82 ST ALGON Roosevelt Boulevard Corridor Study - Crossover Locations (Panel 4) Map 8 MACON SPERRY ST LANGDON ST RAHLE ST ARTHUR ST MANCHESTER ST SB 4 L BENSON ST HOFFNAGLE ST CASTOR AVE FRONTENAC ST HORROCKS ST EMERSON ST RHAWN ST ANWOOD ST SUMMERDALE AVE TAUNTON ST HARGRAVE ST PENNYPACKPTH SOLLY AVE TOLBUT ST EASTWOOD ST LONEY ST FULLER ST CLAYTON ST CHANDLER ST BORBECK AVE LARGE ST MOWER ST ARTHUR ST GRIFFITH ST POQUESSING AVE RIPLEY ST AMFORD ST COLONY DR AXE FACTORY RD GELENA RD BUSTLETON AVE NAPFLE AVE WALNUT HILL ST HOLME AVE HARTEL AVE REVERE ST E ROOSEVELT BLVD LENOLA ST WINCHESTER AVE SB 5 L GLENDALE AVE NARVON ST Pennypack Creek BORBECK AVE ALMA ST LORETTO AVE BRIER ST SB 6 NB 11 NB 12 COLFAX ST AMFORD ST CHELFIELD ST HARGRAVE ST CALVERT ST LANSING ST FARNSWORTH ST ALBION ST BRADFORD ST RICHARD ST OAKMONT ST SHELMIRE AVE FAIRFIELD ST FAIRFIELD ST LEONARD ST RIPLEY ST SOLLY AVE ANWOOD ST AFTON ST MARTINDALE ST LISTER ST FAUNCE ST GRIFFITH ST VISTA ST CHANDLER ST AFTON ST FARNSWORTH ST LANSING ST REVERE ST BROUS AVE ANWOOD ST FULLER ST HARTEL AVE WINTHROP ST RYAN AVE LEONARD ST HOLMEHURST AVE BLEIGH AVE LONEY ST AMFORD ST HARTEL AVE REVERE ST BROUS AVE BROCKLEHURST ST LEXINGTON AVE CARNWATH ST VISTA ST BLEIGH AVE COTTMAN AVE KINDRED ST HORROCKS ST LISTER ST Map Panel Index OAKMONT ST CALVERT ST Orthophotography - DVRPC, Spring 2005 K Feet Express to Local Crossover Local to Express Crossover SB 19 Crossover ID L Crossover Lengthening Recommended Crossover Elimination Recommended Delaware Valley Regional Planning Commission June 2007
83 Roosevelt Boulevard Corridor Study - Crossover Locations (Panel 5) Map 9 CLARK ST JAMISON AVE GREGG ST ALTON ST EVANS ST HOFF ST VOITS LN OLD BUSTLETON AVE KREWSTOWN RD HILSPACH ST BLUE GRASS RD MICHENER ST CLARK ST BEYER AVE DALE RD SB 1 NB 16 GOODNAW ST AMBASSADOR ST GREGG ST MASLAND ST AMBASSADOR PL DIPLOMAT PL COLIMA RD NESTER ST OLD NEWTOWN RD GREGG ST GOODNAW ST MASLAND ST BLUE GRASS RD SB 2 L GREGG ST MATHER ST GRANT AVE BICKLEY ST FRONTENAC ST ALGON AVE NB 15 BENTON AVE AGUSTA ST ACID ST CARWITHAN ST WINCHESTER AVE TOLBUT ST TREMONT ST ACID ST CASTOR AVE AGUSTA ST E ROOSEVELT BLVD MOWER ST MARSHALL ST TREMONT ST EVARTS ST LEONARD ST FAIRFIELD ST TOLBUT ST WOODWARD ST TUSTIN ST WELSH RD BRADFORD ST BENTON AVE MEGARGEE ST CALVERT ST PENNYPACK PTH Pennypack Creek LORETTO AVE DANFORTH ST EVARTS ST LARGE ST CASTOR AVE KENDRICK ST SB 3 NB 13 NB 14 Map Panel Index HAVEN PL ARNOLD ST BERGEN ST BLUE GRASS RD AXE FACTORY RD BUSTLETON AVE FOX CHASE RD REVERE ST BROUS AVE ALMA ST ASHTON RD MAXWELL ST WILLITS RD DEWEES ST BROCKLEHURST ST LISTER ST WINCHESTER AVE MACON ST AXE FACTORY LN AXE FACTORY DWY E ROOSEVELT BLVD Orthophotography - DVRPC, Spring 2005 K CASTOR AVE Feet Express to Local Crossover Local to Express Crossover SB 19 Crossover ID L Crossover Lengthening Recommended Crossover Elimination Recommended Delaware Valley Regional Planning Commission June 2007 RAHLE ST
84 76 US 1- Roosevelt Boulevard Corridor Study Existing Conditions Approximately one-half the crossovers have signage at the crossover to mark the location, but the signs are small. There is no advanced advisory signage upstream of the crossovers. In most instances, there are also no signs that identify a connection between crossovers and major streets or destinations downstream to which they provide access. Most crossovers are between 200 feet and 250 feet in length. The shortest is 123 feet and the longest is 405 feet. Most of the crossovers have one or more functional defects, including the following: 1. Lack of acceleration lane. This creates a speed differential with traffic on the roadway. 2. Lack of storage capacity. This causes traffic to backup onto the roadway 3. Lack of deceleration lane/taper. This causes exiting traffic to slow on the roadway ahead of the crossover, impeding through traffic. In general, there are two types of entry points onto Roosevelt Boulevard from adjacent residential neighborhoods and businesses. Major entry points at complete intersections provide access to express and local lanes. Minor entry points, for example, retail driveways, provide access to local lanes only. Traffic that enters at minor entry points must use a crossover to enter the express lanes. Improvement Strategy To reduce impedance and vehicle conflicts associated with Roosevelt Boulevard crossovers, the following strategies are recommended: Construct longer, safer crossovers where conditions permit. Provide one-mile spacing between crossovers where possible, per PennDOT Design Manual: Urban Highway Interchange Standards. Direct traffic from adjacent neighborhoods to major entry points (cross streets that offer access to local and express lanes). Rely more on the local street network to reach express lanes, and rely less on crossovers. To implement these strategies, the following design concepts have been used in the analysis of Roosevelt Boulevard crossovers: 1. Lengthen crossovers only where it is possible to create a significant increase in length. Significant is defined as 500 feet being available (including the existing crossover) for construction. It is assumed that this length would allow an upgrade in functionality. The top priority should be increasing the length of acceleration lanes. 2. Eliminate crossovers that would become redundant after construction of improved crossovers.
85 US 1 Roosevelt Boulevard Corridor Study Eliminate crossovers that are closer than one-quarter mile to another crossover. If adjacent crossovers are different types, crossing traffic creates vehicle conflicts. 4. Maintain existing crossovers where there is an overriding reason to do so, such as access to a hospital. 5. Add/improve signage that marks crossover locations. 6. Improve signage upstream of crossovers. The signage should identify connections between crossovers and major streets or destinations downstream to which they provide access. Summary of Recommendations Table 9 Summary of Crossover Recommendations Southbound Best opportunity Lengthen deceleration lane Lengthen acceleration lane Eliminate Move Install signs Northbound Best opportunity Lengthen deceleration lane Lengthen acceleration lane SB 2 NB 1 SB 3 NB 3 SB 4 NB 4 SB 5 NB 6 SB 7 NB 7 SB 9 NB 8 SB 10 NB 9 SB 12 NB 12 SB 13 NB 13 SB 13B SB 14 SB 16 SB 17 SB 18 SB 19 Source: DVRPC, 2007 Crossovers Recommended to Remain As Is The following crossovers have been determined by DVRPC to be, at a minimum, satisfactorily serving their intended purpose: Southbound - SB 1, SB 6, SB 8, SB 11, SB 12, SB 15, and SB 20 Northbound NB 2, NB 5, NB 10, NB 11, NB 12, NB 14, NB 15, and NB 16 Eliminate Move Install signs
86 78 US 1- Roosevelt Boulevard Corridor Study Exception: SB 12 and NB 12 are recommended to have advanced signs installed upstream of their locations. Crossovers Considered Best Opportunities Crossovers in this category have significant room for expansion and a functional deficiency. Following is a list of crossovers considered to be the Best Opportunities for improvement along with the associated rationale: SB 4 This crossover is located at the end of a long stretch of unimpeded roadway as Roosevelt Boulevard crosses Pennypack Park. It provides express lane access from the local lanes, which enables drivers to benefit from the grade separation at the Solly Avenue/Holme Avenue underpass. This is the final opportunity for drivers who wish to turn left onto Rhawn Avenue or Ryan Avenue to enter the express lanes. There are no scenarios in which this crossover must be used. All traffic to this point could use the like crossover south of Grant Avenue, or enter Roosevelt Boulevard at a signalized intersection. However, due to the relatively short length of the crossover (226 feet), and associated unimpeded traffic flow prior to the crossover, it is recommended that the deceleration lane be lengthened to allow traffic to reduce speed within the confines of the crossover. This will allow for safer crossovers. There is ample room for easy expansion of the deceleration lane at this location. SB 5 This crossover is located in a highly residential portion of Roosevelt Boulevard. DVRPC recommends lengthening this crossover for two reasons: first, the like crossovers before and after are recommended to be eliminated, which will increase demand, and second, the site is favorable for lengthening both the acceleration and deceleration lane. There is a mid-block crosswalk that would interfere with lengthening; however, the crosswalk is recommended to be eliminated. Since SB 7, the next like crossover to the south, is recommended to be eliminated, this crossover would gain all of the demand of drivers who previously used SB 7 to access Cottman Avenue and Roosevelt Mall. Additionally, a sign that dictates Cottman Ave and Roosevelt Mall Crossover should be installed prior to SB 5. SB 13 This crossover is located at the beginning of a long block, which enables the easy expansion of its acceleration lane. It is followed by SB 13B, which is recommended to be eliminated. The traffic that previously used SB 13B to access the Northeast Tower Center and Wal-Mart will now be using SB 13. This increased demand and the crossover s suitable location are the decisive factors leading to the recommendation for the lengthening of the acceleration lane. Additionally, a sign should be placed prior to this crossover that directs Northeast Tower Center and Wal-Mart traffic to use this crossover. SB 16 This crossover will see increased demand due to the elimination of the before and after same-type crossovers. The crossover with which this one shares a block, SB 17, is also recommended to be eliminated. SB 16 provides express lane access, enabling left turns onto Rising Sun Avenue, North Front
87 US 1 Roosevelt Boulevard Corridor Study 79 Street, Third Street, and Ninth Street. In addition, it allows for the avoidance of traffic controls at the Fifth Street overpass. If SB 18 is eliminated, SB 16 would be the final southbound crossover of its type, with the exception of the lastchance crossover located 6,900 feet south where Roosevelt becomes an expressway,. The block that the crossover is situated on is long and straight, thereby providing the opportunity for easily lengthening the acceleration lane. NB 1 This is the first northbound local-to-express crossover within the study area. There is another like crossover south of Ninth Street. The next like crossover (NB 3) provides for left turns into the Northeast Tower Center and Wal- Mart, and is recommended to be eliminated. With that elimination, it is expected that this crossover will experience increased demand. The location of the crossover provides ample space for the lengthening of both the acceleration and deceleration lanes. A sign that informs drivers to use the crossover for Northeast Tower Center, Wal-Mart, and Oxford Avenue should be installed prior to the crossover. NB 7 This crossover is located north of Oxford Circle. The residential areas west of Roosevelt Boulevard have the opportunity to choose express or local lanes at intersection access points other than Oxford Circle. The elimination of NB 9, located south of Harbison Avenue, will increase the crossover demand at this location. There is a mid-block crosswalk at the north end of this crossover. The median prior to the crossover is suitable for the lengthening of the deceleration lane. A sign should be installed prior to this crossover that directs drivers to use this crossover for right-turn access onto Harbison Avenue and Tyson Avenue. NB 8 This is the only crossover of its type for considerable distance in both directions. It allows for left turns onto Harbison Avenue and Tyson Avenue, as well as the avoidance of the signalized intersection at Cottman Avenue. The crossover with which this one shares a block, NB 9, is recommended to be eliminated. The extensive space for easy expansion is the primary decisive factor leading to the lengthening recommendation. It is recommended that both the acceleration and decelerations are lengthened. Crossovers Recommended to be Eliminated Following is a list of crossovers, including decision rationale, recommended to be eliminated: SB 3 This crossover is a redundancy of SB 2. It is located along an unimpeded portion of the roadway across Pennypack Park and does not have the physical space for expansion. There are no scenarios in which this crossover must be used: southbound traffic can use the preceding crossover or enter the roadway in the local lanes at any signalized intersection. If eliminated, a sign would need to be installed prior to SB 2 that directs drivers to use that crossover for access to Oxford Avenue. SB 7 Despite this crossover potentially being the best engineered crossover on Roosevelt Boulevard, it is unsafe. The approaching roadway is unimpeded and
88 80 US 1- Roosevelt Boulevard Corridor Study curving. Additionally, Bleigh Avenue enters the local lanes at the crossover. There is a dedicated local lane for those using this crossover; however, it is also the turning lane for left turns onto Cottman Avenue. Southbound local lane traffic merges into this lane for left turns and the crossover traffic crosses three traffic lanes to make right turns onto Cottman Avenue. The distance between this crossover and Cottman Avenue is not sufficient to handle all of the lane changes safely. Due to the unimpeded traffic and extensive lane changing in the vicinity, the elimination of the third obstacle - this crossover - would greatly enhance safety. A sign should be installed at SB 5 directing traffic to use SB 5 for Cottman Avenue and Roosevelt Mall. SB 9 This crossover is located on a heavily-traveled portion of Roosevelt Boulevard: between Harbison Avenue and Cottman Avenue. A mid-block crosswalk is present at the beginning of the crossover. The primary factor leading to this recommendation is that there are no significant traffic-drawing locations on the western side of Roosevelt Boulevard between this crossover and SB 11. Therefore, SB 9 is a redundancy of SB 11. SB 10 This crossover is a redundancy of SB 8. Traffic entering the roadway in between SB 8 and this crossover has the opportunity to choose local or express when they enter Roosevelt Boulevard at a signalized intersection. It is recommended to be eliminated due to its redundant nature. SB 13B This crossover is a redundancy of SB 13. Its location entices drivers to use the crossover and cross three lanes of traffic in a short distance to enter the Northeast Tower Center and Wal-Mart. The traffic can more safely cross over at SB 13. SB 14 This crossover is a redundancy of SB 16. There is very little traffic entering the roadway between the before and after like crossovers, with the exception of the Northeast Tower Center and Wal-Mart traffic. Motorist who had previously used this crossover to execute left turns onto F Street and C Street will now need to use SB 12. This scenario can be compensated for by installing an advisory sign prior to SB 12. SB 17 This crossover is a redundancy of SB 15 and SB 19. Also, it is located on the same block as SB 16, which creates unnecessary traffic conflicts. SB 18 This crossover is located on a short block and is a redundancy of SB 16. Within the study corridor, this is the final attempt to cross over into the express lanes. However, an additional opportunity is present one mile south, at the location where Roosevelt becomes an expressway. NB 3 This crossover is a redundancy of NB 1 and NB 5. It is located on an unimpeded portion of roadway, contributing to high speeds and an unsafe crossover. The elimination will not hamper access to any locations. Local traffic can enter express or local lanes at signalized intersections, and through traffic has the opportunity to enter the express lanes at NB 1. The site of this crossover is not conducive to lengthening.
89 US 1 Roosevelt Boulevard Corridor Study 81 NB 6 This crossover is on a short block, which prevents significant lengthening. No traffic entering the roadway between NB 4 and NB 6 is without the opportunity to enter the local lanes. A sign that directs Oxford Avenue traffic to use the NB 4 should be installed prior to NB 4. NB 9 The primary function of this crossover is to allow for right turns onto Harbison Avenue. However, the crossover is located too close to Harbison Avenue to allow for the crossing of three traffic lanes safely in order to execute the right turn. Eastbound Harbison Avenue traffic is better served by using NB 7. Additionally, there is a conflicting crossover located on the same block. A sign should be installed prior to NB 7 that directs motorists to use NB 7 for eastbound Harbison Avenue access. NB 13 This crossover is a redundancy of NB 15. It is located at the end of a long stretch of unimpeded roadway. Also, it is located a short distance prior to a conflicting crossover. The primary access lost through this elimination is right turns onto Welsh Road. This can be compensated for by installing a sign prior to NB 12 directing traffic wishing to turn east onto Welsh Road to use NB 12. Crossovers Recommended for Lengthening Though all Best Opportunity crossovers were recommended for lengthening, this section contains a second tier of crossovers that can be lengthened. Following is a list of those along with the associated rationale: SB 2 This crossover is currently the shortest crossover on Roosevelt Boulevard. The site of this crossover is suitable for acceleration lane lengthening. A sign should be installed prior to SB 2 that directs drivers to use this crossover for access to Oxford Avenue. SB 19 This crossover will see increased demand due to the elimination of others. Its site is suitable for the lengthening of both the acceleration and deceleration lanes. NB 4 This crossover is located at the end of a long stretch of unimpeded roadway. The crossover length is 230 feet, but the site is not suitable for lengthening. It will see increased demand due to the elimination of SB 2, so it is recommended that the crossover is moved to the block framed by C Street and Rorer Street. The new location provides ample room for lengthening as well as potentially slower speeds due to the nearby signalized intersection and signalized mid-block crosswalk. 7.2 Boulevard Lane Reduction and Consolidation Introduction At the request of the city of Philadelphia s Streets Department, DVRPC analyzed Roosevelt Boulevard reconfigured from twelve to ten lanes to determine its potential impact on mobility and safety. This design would consolidate the existing inner and
90 82 US 1- Roosevelt Boulevard Corridor Study outer (express and local) lanes into one roadway. This consolidation would take place in both the north and southbound directions of the Boulevard, which would still be separated by the central median. This would simplify vehicle operations for travel along, as well as at cross streets on Roosevelt Boulevard. Parallel to this effort is an interest in reducing excessive speeding, as well as encouraging multimodal travel along the corridor. The resulting roadway would be ten lanes, directionally split by a landscaped central median, but without any further separation. The remaining cartway width would be reconfigured to accommodate bus/transit and bicyclists. Figure 29 is a graphic representation of this reconfigured roadway. These are stylized cross sections that illustrate the concept of accommodating all users cars, buses, bicycles, and pedestrians. While this design may not be applicable at all areas of the Boulevard, it contains elements that should be considered in any redesign. A direct benefit of the consolidation would be an immediate reduction in the number of vehicular conflict points, such as those posed by crossovers. This reduction is a result of the elimination of the outer medians, which create a redundancy in vehicular conflict points due to the division of both the northbound and the southbound roadways. Figures 30 and 31 illustrate the difference between the existing number of conflict points and the proposed number of conflict points, respectively. Though the diagrams exhibit only one lane of travel in either direction, the positive implication of a lane reduction is strengthened by the growing number of conflict points introduced with each additional lane. Furthermore, lane consolidation would also improve pedestrian safety by reducing the distance pedestrians would be exposed to traffic in the crosswalk. Lastly, DVRPC sought to quantitatively evaluate the impacts of such a roadway design upon vehicular service. Background Gannett Fleming has been contracted by PennDOT to create a coordinated signal plan along the entire length of Roosevelt Boulevard. The project is currently progressing in segments. Thus, in order to perform the necessary timing and delay equations, turning movement counts were taken at each signalized intersection along the southern onethird of the corridor. These counts were taken during three time periods throughout the day: morning, midday, and, evening. With these counts, as well as the pertinent signal timing information, a SYNCHRO network utilizing the respective volumes, signal timing, roadway geometrics, and geographic layout was created for each time period. These SYNCHRO files provided the data necessary to evaluate Roosevelt Boulevard as a consolidated ten-lane roadway.
91 6 12 Bus Stop Curb Extension Vehicular Roadway Width BUS ONLY BUS ONLY BUS ONLY BUS ONLY Extension Bike Lane Roosevelt Boulevard Corridor Study - Five-Lane Cross Section Concept Figure 29 Bike Lane Vehicular Roadway Width Bus Stop Curb Road Median 12 6 Delaware Valley Regional Planning Commission June 2007
92 Southbound Northbound Local Express Express Local Roosevelt Boulevard Corridor Study - Existing Roadway Configuration Conflict Points Figure 30 Diagram not to scale Diverging Merging Crossing Delaware Valley Regional Planning Commission June 2007
93 Roosevelt Boulevard Corridor Study - Proposed Roadway Configuration Conflict Points Figure 31 Southbound Northbound Diagram not to scale Diverging Merging Crossing Delaware Valley Regional Planning Commission June 2007
94 86 US 1- Roosevelt Boulevard Corridor Study Methodology The Gannett Fleming Synchro files were designed as the roadway exists today: three local and three express lanes separated by a local median in both directions. The resulting ten-lane SYNCHRO files simply removed the outer local three-lane roadway in each direction. Two travel lanes were then added to the remaining three-lane express roadway. But before doing so, the turning-movement volumes were tabulated for every potential movement at each intersection, for each of the three time periods. The summation of these movements would provide the volumes that would use the consolidated roadway, as well as the total volume of turning vehicles at each signalized intersection. As a result, the new SYNCHRO files carry the exact equivalent number of vehicles per turning movement, per direction of travel, per intersection, and per time period. Furthermore, only intersections that were considered to have typical cross sections were analyzed for comparison. Specific details that excluded an intersection include exclusive left turn lanes, grade separation, and closely spaced intersections. Interpretation of Results Utilizing data extracted from the Gannett Fleming SYNCHRO files, delay and Level of Service (LOS) measures were calculated and consequently tabulated for each local and express roadway, per direction of travel, intersection, and time of day. These delay and LOS measures would serve as the baseline, or before, scenario in order to offer future comparison. The alternative, or future, scenario calculated and tabulated the same data, except that it no longer needed to account for separate local and express lanes. Thus, delay and LOS measures were exclusively ascertained per direction of travel, intersection, and time of day. However, these measures only reflect the effects of the lane reduction and consolidation, since the signal timing was neither revised nor optimized to reflect the new roadway geometry. The differences in delay and LOS between the before and future scenarios are color coded per time period and per intersection in Appendix V. A positive valued % reduction implies a beneficial impact upon delay and LOS, while a negative value signifies a detrimental impact. Interesting implications of the analysis include the performance of consolidated Roosevelt Boulevard approaches, whereas they currently carry imbalanced volumes between local and express lanes. A consolidated roadway would lead to an equalization of volume on all lanes. Of the 11 intersections analyzed between Ninth Street and Langdon Street, almost all exhibit a negative percent reduction for the relevant peak direction per peak period, i.e.
95 US 1 Roosevelt Boulevard Corridor Study 87 southbound during the AM peak hour and northbound during the PM peak hour. Specifically, for these peak directions there is an average delay increase of 33 and 56 seconds per intersection for the AM and PM peak hours, respectively. However, it is possible that a combination of signal timing optimization and coordination may appreciably reduce these delay increases. Such signal timing measures may also minimize or possibly eliminate the minor delay increases exhibited by the non-peak direction intersections, of which roughly half actually experience a benefit in service already. And as for the mid-day peak, the proposed roadway geometry benefits the majority of intersections, for either direction. With regards to specific intersections along Roosevelt Boulevard, the lane reduction and consolidation would most positively impact the intersections at 3 rd /4 th Street, Front Street, and Rising Sun Avenue; whereas, F Street, Whitaker North Avenue, and Langdon Street would experience the most detrimental effects. The remaining intersections exhibit a mixture of delay increases and reductions.
96 88 US 1- Roosevelt Boulevard Corridor Study 8.0 IMPLEMENTATION PLAN The Improvements Implementation Matrix can be used as a dynamic long-range tool for the systematic selection of projects to create a significantly improved transportation system within the study area. This document can serve as a punch list for the government agencies with a stake in the implementation of improvements. Characteristics In choosing which projects should advance first, stakeholders can be guided by the information presented in Table 10 below. Each improvement scenario identified is evaluated in terms of project priority, cost range, and project benefits. Priority Priorities are estimated in terms of three categories: high, moderate and low. Priorities are assigned based on the perception of the extent of the problems they present drivers, with safety being most important, but congestion (or time delay) and mobility also being considered. Cost Range Costs are also assigned to categories of high, moderate, and low. High-cost projects usually involve a major commitment from one or more funding sources, lengthy public involvement, and several years lead time in programming the required funds. They are typically large-scale, complex, or multiphased improvements and can entail the construction of new facilities. In general, a project in this category is estimated to cost between $5 and $35 million; however, some major projects have been known to cost in the hundreds of millions of dollars. An improvement estimated to have a moderate cost could involve a major reconstruction of an intersection, construction of a short connector road, or a widening of an existing road. In general, a project in this category is estimated to cost between $2 and $5 million. Low-cost projects can often be fast tracked with maintenance or pool funding. They are often operational type improvements at isolated locations and typically cost less than $2 million. These cost ranges are generalized estimates and could be significantly changed for a specific location due to environmental, right-of-way, or other factors uncovered during detailed design of the improvement. Benefits Benefits describe the kind of impact the improvement will yield, such as enhancing safety, lessening congestion, or improving mobility.
97 US 1 Roosevelt Boulevard Corridor Study 89 Table 10 - Improvements Implementation Matrix INTERSECTION CROSSWALKS Improvement Priority Cost Range Benefits Install Pedestrian Countdown Signals H L Safety Locations: 9th St, 5th St, N Front St, Rising Sun Ave, C St, F St, Bridge St, Harbison Ave, Tyson St, Cottman Ave, Rhawn St, Welsh St, Grant Ave Restripe Crosswalks H L Safety Locations: 9th St, 5th St, N Front St, Rising Sun Ave, C St, F St, Bridge St, Harbison Ave, Tyson St, Cottman Ave, Rhawn St, Welsh St, Grant Ave Install Crosswalk Safety Signage H L Safety Locations: 9th St, 5th St, N Front St, Rising Sun Ave, C St, F St, Bridge St, Harbison Ave, Tyson St, Cottman Ave, Rhawn St, Welsh St, Grant Ave Create Median Safety Refuge L L Safety Locations: Rhawn St, Welsh St, Grant Ave Re-time Crossing Time Allowance H L Safety Locations: 9th St, 5th St, N Front St, Rising Sun Ave, C St, F St, Bridge St, Harbison Ave, Tyson St, Cottman Ave, Rhawn St, Welsh St, Grant Ave Conduct Crosswalk Safety Outreach H L Safety Locations: N Front St, Rising Sun Ave, C St Install Bus Stop Shelter M L Safety Locations: 9th St, Cottman Ave, Welsh St, Grant Ave Upgrade Sidewalks or Walkways M L Safety Locations: N Front St, Harbison Ave, Rhawn St, Grant Ave Install Crosswalk Advisory Signage H L Safety Locations: Bridge St, Rhawn St Install Regulatory or Other signage M L Safety Locations: N Front St, F St, Harbison Ave Restripe Stop Bar H L Safety Locations: C St Install a Curb M L Safety Locations: F St, Cottman Ave Improve Drainage M L Safety Locations: Bridge St Source: DVRPC, 2007
98 90 US 1- Roosevelt Boulevard Corridor Study INTERSECTION CROSSWALKS (Continued) Improvement Priority Cost Range Benefits Clear Protruding Vegetation H L Safety Locations: Harbison Ave Move Bus Stop M L Safety Locations: Harbison Ave Move Overhead Destination Sign L M Safety Locations: 9th St Ensure Adequate Lighting H L Safety Locations: 5th St Ensure Signal Coordination H L Safety Locations: Rising Sun Ave Follow Complimentary Recommendations H L Safety Locations: F St MID-BLOCK CROSSWALKS Improvement Priority Cost Range Benefits Install Pedestrian Countdown Signals H L Safety Locations: Bingham & Rorer, Garland & Whitaker, Sanger, Unruh, Princeton & Friendship Install Traffic Control Signal H M Safety Locations: Shelmire & Faunce Restripe Crosswalks H L Safety Locations: Bingham & Rorer, Garland & Whitaker, Unruh, Longhore, Princeton & Friendship Shelmire & Faunce Install Crosswalk Safety Signs H L Safety Locations: Bingham & Rorer, Garland & Whitaker, Sanger, Unruh, Princeton & Friendship Shelmire & Faunce Re-time Crossing Time Allowance H L Safety Locations: Bingham & Rorer, Garland & Whitaker, Unruh, Princeton & Friendship Install Bus Stop Shelter M L Safety Locations: Unruh Consolidate Crosswalks H L Safety Locations: Source: DVRPC, 2007 Princeton & Friendship, Friendship & Saint Vincent
99 US 1 Roosevelt Boulevard Corridor Study 91 MID-BLOCK CROSSWALKS (Continued) Improvement Priority Cost Range Benefits Eliminate Crosswalk: M L Safety Locations: Smylie, Benner, Longshore, Loney Install Crosswalk Advisory Signage H L Safety Locations: Garland & Whitaker, Princeton & Friendship, Shelmire & Faunce Install Permanent Speed Display Signs M M Safety Locations: Bingham & Rorer Install Regulatory or Other Signage H L Safety Locations: Smylie, Benner, Longshore Consolidate Bus Stops H L Safety Locations: Smylie, Benner, Longshore, Princeton & Friendship, Loney Follow Complimentary Recommendations H L Safety Locations: Friendship & Saint Vincent Re-Align Crosswalk H L Safety Locations: Shelmire & Faunce CROSSOVERS Improvement Priority Cost Range Benefits Best Opportunity Crossover H M Mobility, Locations: SB 4, SB 5, SB 13, SB, 16, NB 1, NB 7, NB 8 Safety Lengthen Deceleration Lane H M Mobility, Safety Locations: SB 4, SB 5, SB 19, NB 1, NB 4, NB 7, NB 8 Congestion Lengthen Acceleration Lane H M Mobility, Locations: SB 2, SB 5, SB 13, SB 16, SB 19, NB 1, NB 4, NB 8 Safety Eliminate Crossover M M Mobility, Locations: SB 3, SB 7, SB 9, SB 10, SB 13B, SB 14, SB 17, SB 18, NB 3, NB 6, NB 9, NB 13 Safety Move the Crossover M H Mobility, Locations: NB 4 Safety Install Advisory Signs H L Mobility, Locations: SB 2, SB 5, SB 12, SB 13, NB 1, NB 4, NB 7, NB 12 Congestion Source: DVRPC, 2007
100 [This page intentionally left blank]
101 APPENDIX I Summary of Pedestrian Count Data
102
103 Appendix I. - Summary of Pedestrian Count Data Wednesday May 16th - Intersections Intersection Crossings (and Roosevelt Blvd.) 9th 5th N. Front Rising Sun C F Bridge Harbison Rhawn 7-9 AM Pedestrian* Bicycle Roosevelt only** PM Pedestrian Bicycle Roosevelt only Total Pedestrian Bicycle Roosevelt only Thursday May 17th - Mid-Block Mid-Block Crossings (on Roosevelt Blvd., between or at) Bingham & Smylie Garland & Sanger Benner Unruh Longshore Princeton & Friendship & Shelmire & Loney Rorer Whitaker Friendship Saint Vincent Faunce 7-9 AM Pedestrian Bicycle PM Pedestrian Bicycle Total Pedestrian Bicycle Saturday May 19th - Intersections Intersection Crossings (and Roosevelt Blvd.) 9th Tyson Cottman Welsh Grant 12-4 PM Pedestrian Bicycle Roosevelt only * Includes all pedestrian movements at the intersection ** Includes pedestrian movements across Roosevelt Blvd only Source: DVRPC, 2007
104
105 APPENDIX II Wednesday, May 16 Pedestrian Count Data
106
107 Appendix II. - Wednesday May 16th Pedestrian Count Data DIRECTI LOCATION 1 LOCATION 2 LOCATION 3 LOCATION 4 LOCATION 5 LOCATION 6 LOCATION 7 LOCATION 8 LOCATION 9 TIME ON 9th Street 5th Street N. Front Street Rising Sun Avenue C Street F Street Bridge Street Harbison Avenue Rhawn Street 7:00am - 9:00am "walk" "don't walk" Bicycles "walk" "don't walk" Bicycles "walk" "don't walk" Bicycles "walk" "don't walk" Bicycles "walk" "don't walk" Bicycles "walk" "don't walk" Bicycles "walk" "don't walk" Bicycles "walk" "don't walk" Bicycles "walk" "don't walk" Bicycles SW -SE :00am - SW - NW :15am SE - NE NE - NW Total SW -SE :15am - SW - NW :30am SE - NE NE - NW Total SW -SE :30am - SW - NW :45am SE - NE NE - NW Total SW -SE :45am - SW - NW :00am SE - NE NE - NW Total SW -SE :00am - SW - NW :15am SE - NE NE - NW Total SW -SE :15am - SW - NW :30am SE - NE NE - NW Total SW -SE :30am - SW - NW :45am SE - NE NE - NW Total SW -SE :45am - SW - NW :00am SE - NE NE - NW Total AM TOTAL :00pm - 7:00pm "walk" "don't walk" Bicycles "walk" "don't walk" Bicycles "walk" "don't walk" Bicycles "walk" "don't walk" Bicycles "walk" "don't walk" Bicycles "walk" "don't walk" Bicycles "walk" "don't walk" Bicycles "walk" "don't walk" Bicycles "walk" "don't walk" Bicycles SW -SE :00pm - SW - NW :15pm SE - NE NE - NW Total SW -SE :15pm - SW - NW :30pm SE - NE NE - NW Total SW -SE :30pm - SW - NW :45pm SE - NE NE - NW Total Source: DVRPC, 2007
108 DIRECTI LOCATION 1 LOCATION 2 LOCATION 3 LOCATION 4 LOCATION 5 LOCATION 6 LOCATION 7 LOCATION 8 LOCATION 9 TIME ON 9th Street 5th Street N. Front Street Rising Sun Avenue C Street F Street Bridge Street Harbison Avenue Rhawn Street 7:00am - 9:00am "walk" "don't walk" Bicycles "walk" "don't walk" Bicycles "walk" "don't walk" Bicycles "walk" "don't walk" Bicycles "walk" "don't walk" Bicycles "walk" "don't walk" Bicycles "walk" "don't walk" Bicycles "walk" "don't walk" Bicycles "walk" "don't walk" Bicycles SW -SE :45pm - SW - NW :00pm SE - NE NE - NW Total SW -SE :00pm - SW - NW :15pm SE - NE NE - NW Total SW -SE :15pm - SW - NW :30pm SE - NE NE - NW Total SW -SE :30pm - SW - NW :45pm SE - NE NE - NW Total SW -SE :45pm - SW - NW :00pm SE - NE NE - NW Total SW -SE :00pm - SW - NW :15pm SE - NE NE - NW Total SW -SE :15pm - SW - NW :30pm SE - NE NE - NW Total SW -SE :30pm - SW - NW :45pm SE - NE NE - NW Total SW -SE :45pm - SW - NW :00pm SE - NE NE - NW Total SW -SE :00pm - SW - NW :15pm SE - NE NE - NW Total SW -SE :15pm - SW - NW :30pm SE - NE NE - NW Total SW -SE :30pm - SW - NW :45pm SE - NE NE - NW Total Source: DVRPC, 2007
109 TIME DIRECTI LOCATION 1 LOCATION 2 LOCATION 3 LOCATION 4 LOCATION 5 LOCATION 6 LOCATION 7 LOCATION 8 LOCATION 9 ON 9th Street 5th Street N. Front Street Rising Sun Avenue C Street F Street Bridge Street Harbison Avenue Rhawn Street 7:00am - 9:00am "walk" "don't walk" Bicycles "walk" "don't walk" Bicycles "walk" "don't walk" Bicycles "walk" "don't walk" Bicycles "walk" "don't walk" Bicycles "walk" "don't walk" Bicycles "walk" "don't walk" Bicycles "walk" "don't walk" Bicycles "walk" "don't walk" Bicycles SW -SE :45pm - SW - NW :00pm SE - NE NE - NW Total SW -SE :00pm - SW - NW :15pm SE - NE NE - NW Total SW -SE :15pm - SW - NW :30pm SE - NE NE - NW Total SW -SE :30pm - SW - NW :45pm SE - NE NE - NW Total SW -SE :45pm - SW - NW :00pm SE - NE NE - NW Total PM TOTAL "walk" "don't walk" Bicycles "walk" "don't walk" Bicycles "walk" "don't walk" Bicycles "walk" "don't walk" Bicycles "walk" "don't walk" Bicycles "walk" "don't walk" Bicycles "walk" "don't walk" Bicycles "walk" "don't walk" Bicycles "walk" "don't walk" Bicycles DAY TOTAL Source: DVRPC, 2007
110
111 APPENDIX III Thursday, May 17 Pedestrian Count Data
112
113 Appendix III. - Thursday May 17th Pedestrian Count Data TIME LOCATION 1 LOCATION 2 LOCATION 3 LOCATION 4 LOCATION 5 LOCATION 6 LOCATION 7 LOCATION 8 LOCATION 9 LOCATION 10 LOCATION 11 Bingham & Rorer Smylie Garland & Whitaker Sanger Benner Unruh Longshore Princeton & Friendship Friendship & Saint Vincent Shelmire & Faunce Loney 7:00am - 9:00am "walk" "don't walk" Bicycles "walk" "don't walk" Bicycles "walk" "don't walk" Bicycles "walk" "don't walk" Bicycles "walk" "don't walk" Bicycles "walk" "don't walk" Bicycles "walk" "don't walk" Bicycles "walk" "don't walk" Bicycles "walk" "don't walk" Bicycles "walk" "don't walk" Bicycles "walk" "don't walk" Bicycles 7:00am - 7:15am Total :15am - 7:30am Total :30am - 7:45am Total :45am - 8:00am Total :00-8:15am Total :15am - 8:30am Total :30am - 8:45am Total :45am - 9:00am Total AM TOTAL :00pm - 7:00pm 2:00pm - 2:15pm "walk" "don't walk" Bicycles "walk" "don't walk" Bicycles "walk" "don't walk" Bicycles "walk" "don't walk" Bicycles "walk" "don't walk" Bicycles "walk" "don't walk" Bicycles "walk" "don't walk" Bicycles "walk" "don't walk" Bicycles "walk" "don't walk" Bicycles "walk" "don't walk" Bicycles "walk" "don't walk" Bicycles Total 2:15pm - 2:30pm Total 2:30pm - 2:45pm Total 2:45pm - 3:00pm Total 3:00pm - 3:15pm Total 3:15pm - 3:30pm Total :30pm - 3:45pm Total 3:45pm - 4:00pm Total :00pm - 4:15pm Total 4:15pm - 4:30pm Total :30pm - 4:45pm Total :45pm - 5:00pm Total :00pm - 5:15pm Total 5:15pm - 5:30pm Total :30pm - 5:45pm Total 5:45pm - 6:00pm Total :00pm - 6:15pm Total 6:15pm - 6:30pm Total :30pm - 6:45pm Total 6:45pm - 7:00pm Total PM TOTAL "walk" "don't walk" Bicycles "walk" "don't walk" Bicycles "walk" "don't walk" Bicycles "walk" "don't walk" Bicycles "walk" "don't walk" Bicycles "walk" "don't walk" Bicycles "walk" "don't walk" Bicycles "walk" "don't walk" Bicycles "walk" "don't walk" Bicycles "walk" "don't walk" Bicycles "walk" "don't walk" Bicycles DAY TOTAL Source: DVRPC, 2007
114
115 APPENDIX IV Saturday, May 19 Pedestrian Count Data
116
117 Appendix IV. - Saturday May 19th Pedestrian Count Data TIME DIRECTION LOCATION 1 LOCATION 2 LOCATION 3 LOCATION 4 LOCATION 5 9th Street Tyson Avenue Cottman Avenue Welsh Road Grant Avenue 12:00pm - 4:00pm "walk" "don't walk" Bicycles "walk" "don't walk" Bicycles "walk" "don't walk" Bicycles "walk" "don't walk" Bicycles "walk" "don't walk" Bicycles SW -SE :00pm - SW - NW :15pm SE - NE NE - NW Total SW -SE :15pm - SW - NW :30pm SE - NE NE - NW Total SW -SE :30pm - SW - NW :45pm SE - NE NE - NW Total SW -SE :45pm - SW - NW :00pm SE - NE NE - NW Total SW -SE :00pm - SW - NW :15pm SE - NE NE - NW Total SW -SE :15pm - SW - NW :30pm SE - NE NE - NW Total SW -SE :30pm - SW - NW :45pm SE - NE NE - NW Total SW -SE :45pm - SW - NW :00pm SE - NE NE - NW Total SW -SE :00pm - SW - NW :15pm SE - NE NE - NW Total SW -SE :15pm - SW - NW :30pm SE - NE NE - NW Total SW -SE :30pm - SW - NW :45pm SE - NE NE - NW Total SW -SE :45pm - SW - NW :00pm SE - NE NE - NW Total SW -SE :00pm - SW - NW :15pm SE - NE NE - NW Total SW -SE :15pm - SW - NW :30pm SE - NE NE - NW Total SW -SE :30pm - SW - NW :45pm SE - NE NE - NW Total SW -SE :45pm - SW - NW :00pm SE - NE NE - NW Total TOTAL Source: DVRPC, 2007
118
119 APPENDIX V Five-Lane Cross Section Concept
120
121 Appendix V - Five-Lane Cross Section Concept AM, Mid-Day, and PM Peak Hour LOS with Average Delay / Vehicle Intersection Direction of Travel Existing Geometry (90 second Cycle Length) 5-Lane Geometry (90 second Cycle Length) 9th Street AM Peak Mid-Day Peak PM Peak AM Peak Mid-Day Peak PM Peak Volume Delay (sec) LOS Volume Delay (sec) LOS Volume Delay (sec) LOS Delay (sec) LOS % Reduction Delay (sec) LOS % Reduction Delay (sec) LOS % Reduction Blvd NB Local B B B Blvd NB Express B D C Blvd NB Total 15.2 B 36.0 D 27.9 C 16.1 B -5.7% 16.3 B 54.7% 65.6 E % Blvd SB Local F B B Blvd SB Express A A A Blvd SB Total F 8.4 A 8.1 A F % 7.9 A 6.2% 7.4 A 8.7% NB Local B B B NB Express B D C Total NB Intersection 15.9 B 29.1 C 25.1 C 19.3 B -21.2% 18.4 B 36.7% 59.4 E % SB Local F B B SB Express A A A Total SB Intersection 89.7 F 10.8 B 10.5 B F -97.9% 10.4 B 3.3% 9.9 A 5.5% 7th Street AM Peak Mid-Day Peak PM Peak AM Peak Mid-Day Peak PM Peak Volume Delay (sec) LOS Volume Delay (sec) LOS Volume Delay (sec) LOS Delay (sec) LOS % Reduction Delay (sec) LOS % Reduction Delay (sec) LOS % Reduction Blvd NB Local B B B Blvd NB Express B A B Blvd NB Total 11.8 B 11.4 B 15.5 B 10.8 B 8.3% 9.9 A 12.9% 16.7 B -7.6% Blvd SB Local E A C Blvd SB Express B B C Blvd SB Total 46.2 D 11.2 B 29.6 C F % 15.8 B -41.6% 18.3 B 38.1% NB Local B B B NB Express B A B Total NB Intersection 10.6 B 10.5 B 14.3 B 10.3 B 2.4% 9.4 A 10.1% 15.9 B -11.0% SB Local E B C SB Express A B C Total SB Intersection 43.5 D 11.7 B 27.6 C F % 16.2 B -38.6% 18.3 B 33.7% 3rd/4th Street AM Peak Mid-Day Peak PM Peak AM Peak Mid-Day Peak PM Peak Volume Delay (sec) LOS Volume Delay (sec) LOS Volume Delay (sec) LOS Delay (sec) LOS % Reduction Delay (sec) LOS % Reduction Delay (sec) LOS % Reduction Blvd NB Local A A A Blvd NB Express B B E Blvd NB Total 12.4 B 14.9 B 50.3 D 10.1 B 18.3% 10.2 B 31.3% 49.7 D 1.2% Blvd SB Local B B B Blvd SB Express B C B Blvd SB Total 18.5 B 19.8 B 18.1 B 19.4 B -4.8% 9.6 A 51.6% 14.4 B 20.5% NB Local A B B NB Express B B D Total NB Intersection 11.9 B 14.2 B 43.0 D 10.8 B 9.0% 10.7 B 24.5% 45.1 D -5.0% SB Local C B B SB Express B C B Total SB Intersection 18.9 B 19.4 B 17.2 B 19.7 B -4.2% 12.7 B 34.7% 16.2 B 5.6% Source: DVRPC, 2007
122 Appendix V - Five-Lane Cross Section Concept (Continued) Mascher Street AM Peak Mid-Day Peak PM Peak AM Peak Mid-Day Peak PM Peak Volume Delay (sec) LOS Volume Delay (sec) LOS Volume Delay (sec) LOS Delay (sec) LOS % Reduction Delay (sec) LOS % Reduction Delay (sec) LOS % Reduction Blvd NB Local B B B Blvd NB Express C B C Blvd NB Total 19.4 B 12.9 B 19.9 B 16.5 B 14.8% 19.4 B -50.0% 27.7 C -39.5% Blvd SB Local B B B Blvd SB Express A A B Blvd SB Total 10.2 B 8.5 A 14.5 B 12.9 B -27.0% 7.3 A 14.0% 15.2 B -4.6% NB Local A A B NB Express B B B Total NB Intersection 14.2 B 10.4 B 15.8 B 13.9 B 2.0% 17.2 B -65.8% 24.4 C -54.8% SB Local D C C SB Express A A B Total SB Intersection 25.3 C 14.0 B 18.9 B 27.5 C -8.8% 11.6 B 17.4% 17.7 B 6.1% Front Street AM Peak Mid-Day Peak PM Peak AM Peak Mid-Day Peak PM Peak Volume Delay (sec) LOS Volume Delay (sec) LOS Volume Delay (sec) LOS Delay (sec) LOS % Reduction Delay (sec) LOS % Reduction Delay (sec) LOS % Reduction Blvd NB Local B B B Blvd NB Express B A A Blvd NB Total 12.2 B 7.9 A 9.8 A 6.1 A 50.1% 6.9 A 12.8% 6.9 A 29.5% Blvd SB Local B B B Blvd SB Express A A A Blvd SB Total 9.8 A 7.4 A 7.7 A 27.4 C % 5.2 A 30.1% 6.9 A 10.8% NB Local B B C NB Express B A A Total NB Intersection 13.2 B 9.6 A 12.1 B 8.2 A 37.8% 8.6 A 10.8% 9.2 A 24.0% SB Local B A A SB Express A A A Total SB Intersection 9.1 A 7.0 A 7.8 A 25.6 C % 6.0 A 14.6% 8.5 A -9.4% Rising Sun Avenue AM Peak Mid-Day Peak PM Peak AM Peak Mid-Day Peak PM Peak Volume Delay (sec) LOS Volume Delay (sec) LOS Volume Delay (sec) LOS Delay (sec) LOS % Reduction Delay (sec) LOS % Reduction Delay (sec) LOS % Reduction Blvd NB Local B B B Blvd NB Express A A E Blvd NB Total 7.1 A 5.6 A 49.6 D 3.0 A 58.0% 1.3 A 76.9% 57.9 E -16.8% Blvd SB Local B A B Blvd SB Express D E B Blvd SB Total 34.2 C 51.2 D 13.5 B 5.9 A 82.8% 8.5 A 83.4% 12.5 B 7.3% NB Local B B B NB Express A A E Total NB Intersection 9.5 A 8.3 A 39.6 D 15.0 B -58.6% 7.3 A 12.6% 51.2 D -29.1% SB Local B B B SB Express D E B Total SB Intersection 29.8 C 38.3 D 13.5 B 9.4 A 68.5% 13.7 B 64.3% 14.8 B -9.3% Source: DVRPC, 2007
123 Appendix V - Five-Lane Cross Section Concept (Continued) C Street AM Peak Mid-Day Peak PM Peak AM Peak Mid-Day Peak PM Peak Volume Delay (sec) LOS Volume Delay (sec) LOS Volume Delay (sec) LOS Delay (sec) LOS % Reduction Delay (sec) LOS % Reduction Delay (sec) LOS % Reduction Blvd NB Local A B B Blvd NB Express C A B Blvd NB Total 25.2 C 9.8 A 15.3 B 22.9 C 9.2% 9.5 A 2.8% 18.9 B -23.2% Blvd SB Local A A C Blvd SB Express A A B Blvd SB Total 4.1 A 5.9 A 17.4 B 7.9 A -91.4% 9.6 A -62.3% 15.5 B 11.2% NB Local B B B NB Express C A B Total NB Intersection 19.7 B 9.7 A 14.2 B 21.2 C -7.8% 11.4 B -17.0% 19 B -33.7% SB Local A B C SB Express A A B Total SB Intersection 6.3 A 7.2 A 16.0 B 9.3 A -46.6% 10.5 B -46.8% 16.4 B -2.2% F Street AM Peak Mid-Day Peak PM Peak AM Peak Mid-Day Peak PM Peak Volume Delay (sec) LOS Volume Delay (sec) LOS Volume Delay (sec) LOS Delay (sec) LOS % Reduction Delay (sec) LOS % Reduction Delay (sec) LOS % Reduction Blvd NB Local B C F Blvd NB Express B B E Blvd NB Total 15.2 B 17.0 B F 22.2 C -45.6% 40.5 D % F -85.5% Blvd SB Local B B B Blvd SB Express A A B Blvd SB Total 11.8 B 10.1 B 13.2 B 42.5 D % 16.0 B -58.6% 20.5 C -55.4% NB Local B B F NB Express A B D Total NB Intersection 13.7 B 15.6 B F 20.6 C -50.5% 37.4 D % F -98.4% SB Local B B B SB Express A A B Total SB Intersection 13.4 B 10.9 B 14.5 B 38.3 D % 16.6 B -52.0% 20.8 C -43.4% Whitaker South/Garland Street AM Peak Mid-Day Peak PM Peak AM Peak Mid-Day Peak PM Peak Volume Delay (sec) LOS Volume Delay (sec) LOS Volume Delay (sec) LOS Delay (sec) LOS % Reduction Delay (sec) LOS % Reduction Delay (sec) LOS % Reduction Blvd NB Local B B B Blvd NB Express C A B Blvd NB Total 19.4 B 10.3 B 14.2 B 24.6 C -27.0% 2.4 A 76.7% 17.7 B -25.0% Blvd SB Local B A A Blvd SB Express B B B Blvd SB Total 12.6 B 12.5 B 9.8 A 15.4 B -21.9% 7.7 A 38.4% 15.0 B -52.5% NB Local A A B NB Express C B B Total NB Intersection 19.5 B 11.8 B 16.1 B 26.6 C -36.2% 6.0 A 49.0% 19.7 B -22.6% SB Local B A A SB Express B B B Total SB Intersection 12.6 B 12.5 B 9.8 A 15.4 B -21.9% 7.7 A 38.4% 15.0 B -52.5% Source: DVRPC, 2007
124 Appendix V - Five-Lane Cross Section Concept (Continued) Whitaker North Avenue AM Peak Mid-Day Peak PM Peak AM Peak Mid-Day Peak PM Peak Volume Delay (sec) LOS Volume Delay (sec) LOS Volume Delay (sec) LOS Delay (sec) LOS % Reduction Delay (sec) LOS % Reduction Delay (sec) LOS % Reduction Blvd NB Local B B B Blvd NB Express C A F Blvd NB Total 19.8 B 10.3 B 75.4 E 14.1 B 28.9% 9.1 A 11.8% F % Blvd SB Local B B B Blvd SB Express A A D Blvd SB Total 12.1 B 6.4 A 32.2 C 60.3 E % 2.4 A 62.5% 34.8 C -8.0% NB Local B B B NB Express B A F Total NB Intersection 15.6 B 8.4 A 60.0 E 11.9 B 23.6% 8.4 A 0.6% F % SB Local C C C SB Express A A C Total SB Intersection 14.7 B 10.4 B 25.9 C 51.5 D % 7.8 A 25.1% 31.5 C -21.6% Langdon Street AM Peak Mid-Day Peak PM Peak AM Peak Mid-Day Peak PM Peak Volume Delay (sec) LOS Volume Delay (sec) LOS Volume Delay (sec) LOS Delay (sec) LOS % Reduction Delay (sec) LOS % Reduction Delay (sec) LOS % Reduction Blvd NB Local B C C Blvd NB Express B C F Blvd NB Total 19.5 B 20.9 C F 97.7 F % 25.5 C -21.8% F % Blvd SB Local C C C Blvd SB Express C B C Blvd SB Total 25.4 C 17.5 B 29.5 C F % 18.9 B -8.3% F % NB Local B B D NB Express B B F Total NB Intersection 18.1 B 18.6 B F 87.9 F % 24.0 C -29.1% F % SB Local C C C SB Express C B C Total SB Intersection 24.4 C 18.5 B 29.1 C F % 20.4 C -10.3% F % Source: DVRPC, 2007
125 Title of Report: US 1 Roosevelt Boulevard Corridor Study Publication No.: Date Published: June 2007 Geographic Area Covered: The study area includes the US 1 Roosevelt Boulevard Corridor between 9 th Street and Grant Avenue in Northeast Philadelphia. Key Words: Intersection analysis, crossovers, crosswalks, mid-block crosswalks, level of service, improvement options, crashes, traffic calming, sight distance, lane reconfiguration, bus transit ABSTRACT: This study was conducted as part of DVRPC s 2030 long-range plan for the region. The section of this corridor studied extends from Ninth Street in the south to Grant Avenue in the north and is approximately 8 miles in length. The extensive breadth of the corridor has become an obstacle for pedestrian traffic. The corridor has experienced numerous pedestrian fatalities over the years and also experiences heavy peak-hour vehicular congestion. This study attempts to identify the constraints and opportunities on the Boulevard and makes recommendations for its improvement as a travel corridor in terms of operational safety and mobility. Delaware Valley Regional Planning Commission 8 th Floor 190 North Independence Mall West Philadelphia, PA Phone: Fax: Internet: Staff Contacts: Direct phone: David Anderson, Project Manager danderson@dvrpc.org Ellis Kim, Transportation Engineer ekim@dvrpc.org Robert Berger, Transportation Planner rberger@dvrpc.org Eric Grugel, Regional Planner egrugel@dvrpc.org Michael Becker, Transportation Intern mbecker@dvrpc.org

126
Project Kickoff Meeting February 15, 2018
 Project Kickoff Meeting February 15, 2018 Scope of Work: Study Area Project Goals Develop traffic calming alternatives to the Vine Street local right of way, to mitigate speeding. Develop concept plans
MEMORANDUM. Charlotte Fleetwood, Transportation Planner
 MEMORANDUM Date: Updated August 22, 2017 To: Organization: Charlotte Fleetwood, Transportation Planner Boston Transportation Department From: Jason DeGray, P.E., PTOE, Regional Director of Engineering
Executive Summary Route 30 Corridor Master Plan
 Route Corridor Master Plan Project Overview The Route Corridor Master Plan is a coordinated multimodal transportation and land use plan for the entire stretch of Route through East Whiteland Township,
Executive Summary Introduction Methodology...3 Level of Service (LOS) Analysis...4. Study Location... 5
 Analysis...4. Study Location... 5") The Delaware Valley Regional Planning Commission is dedicated to uniting the region s elected officials, planning professionals, and the public with a common vision of making a great region even greater.
The Delaware Valley Regional Planning Commission is dedicated to uniting the region s elected officials, planning professionals, and the public with a common vision of making a great region even greater.
Comments EXECUTIVE SUMMARY
 Comments 1. Under any Alternatives, MCDOT should provide better at-grade pedestrian crossing of Georgia Avenue and Forest Glen Road, including improved crosswalks with wider medians and adequate signal
THIS PAGE LEFT BLANK INTENTIONALLY
 GA SR 25 Spur at Canal Road Transportation Impact Analysis PREPARED FOR GLYNN COUNTY, GEORGIA 1725 Reynolds Street, Suite 300 Brunswick, Georgia 31520 PREPARED BY 217 Arrowhead Boulevard Suite 26 Jonesboro,
1999 On-Board Sacramento Regional Transit District Survey
 SACOG-00-009 1999 On-Board Sacramento Regional Transit District Survey June 2000 Sacramento Area Council of Governments 1999 On-Board Sacramento Regional Transit District Survey June 2000 Table of Contents
PEDESTRIAN ACTION PLAN
 ATTACHMENT 2 CITY OF SANTA MONICA PEDESTRIAN ACTION PLAN CITY OF SANTA MONICA PEDESTRIAN ACTION PLAN This page intentionally left blank EXECUTIVE SUMMARY CHAPTER 1 EXECUTIVE SUMMARY Setting the Stage
Transportation Impact Study for Abington Terrace
 Transportation Impact Study for Abington Terrace Abington Township, Montgomery County, PA Sandy A. Koza, P.E., PTOE PA PE License Number PE059911 Prepared by McMahon Associates, Inc. 425 Commerce Drive,
6.0 PEDESTRIAN AND BICYCLE FACILITIES 6.1 INTRODUCTION 6.2 BICYCLE DEMAND AND SUITABILITY Bicycle Demand
 6.0 PEDESTRIAN AND BICYCLE FACILITIES 6.1 INTRODUCTION Bicycle and pedestrian travel along and in the vicinity of the corridor is part of the vision of Somerset and Hunterdon counties and the integrated
North Shore Transportation Improvement Strategy
 North Shore Transportation Improvement Strategy Preliminary, Near-term Recommendation 2016 April Transportation Improvement Strategy (TIS) Comprehensive and Analytical A multi-modal transportation strategy
ALLEY 24 TRAFFIC STUDY
 ALLEY 24 TRAFFIC STUDY in City of Frostburg, Maryland January 2013 3566 Teays Valley Road Hurricane, WV Office: (304) 397-5508 www.denniscorporation.com Alley 24 Traffic Study January 2013 Frostburg, Maryland
NJ Transit River LINE Survey
 NJ Transit River LINE Survey March, 2013 NJ Transit River LINE Survey March, 2013 PA Wilmington MD Baltimore DE BUCKS MERCER MONTGOMERY CHESTER PHILADELPHIA DELAWARE BURLINGTON CAMDEN GLOUCESTER New York
ADOT Statewide Bicycle and Pedestrian Program Summary of Phase IV Activities APPENDIX B PEDESTRIAN DEMAND INDEX
 ADOT Statewide Bicycle and Pedestrian Program Summary of Activities APPENDIX B PEDESTRIAN DEMAND INDEX May 24, 2009 Pedestrian Demand Index for State Highway Facilities Revised: May 29, 2007 Introduction
A Matter of Fairness: ROCOG s Environmental Justice Protocol. What is Mobility Limitation?
 No Person Left Behind What is Mobility Limitation? What is the Access Limitation? Environmental Justice population should be provided adequate mobility & access to meet their needs; Identify acceptable
State Street Transit Signal Priority Study
 State Street Transit Signal Priority Study April 2015 The Delaware Valley Regional Planning Commission is dedicated to uniting the region s elected officials, planning professionals, and the public with
o n - m o t o r i z e d transportation is an overlooked element that can greatly enhance the overall quality of life for the community s residents.
 N o n - m o t o r i z e d transportation is an overlooked element that can greatly enhance the overall quality of life for the community s residents. 84 Transportation CHAPTER 11 INTRODUCTION Transportation
Bikeway action plan. Bicycle Friendly Community Workshop March 5, 2007 Rochester, MN
 Bikeway action plan Summary The was held on March 5, 2007 at the Rochester Mayo Civic Center. The workshop was hosted by Rochester-Olmsted County Planning Department in collaboration with the League of
BICYCLE FACILITIES INVENTORY: SUMMARY REPORT
 BICYCLE FACILITIES INVENTORY: SUMMARY REPORT Southern New Jersey September 2008 2002 D Lincoln Drive West Marlton, NJ 08053 (856) 596-8228 www.driveless.com BICYCLE FACILITIES INVENTORY SUMMARY REPORT
Orange Center Elementary School
 Drag and drop pic and stretch/crop to the limits of the blue rectangle (delete this text box) Orange Center Elementary School Drag and drop pic and stretch/crop to the limits of the blue rectangle (delete
Bridge Street Corridor Study Report
 Bridge Street Corridor Study Report Prepared for: Prepared by: BRIDGE STREET CORRIDOR STUDY REPORT PREPARED FOR: CITY OF ARROYO GRANDE COMMUNITY DEVELOPMENT DEPARTMENT 300 EAST BRANCH STREET ARROYO GRANDE,
EUCLID AVENUE PARKING STUDY CITY OF SYRACUSE, ONONDAGA COUNTY, NEW YORK
 EUCLID AVENUE PARKING STUDY CITY OF SYRACUSE, ONONDAGA COUNTY, NEW YORK CITY OF SYRACUSE DEPARTMENT OF PUBLIC WORKS 1200 CANAL STREET EXTENSION SYRACUSE, NEW YORK 13210 DRAFT REPORT DATE: November 13,
This page intentionally left blank.
 This page intentionally left blank. COMMUNITY Glenpool Community Overview Glenpool Glenpool is a city of nearly 12,000 residents located in Tulsa County southwest of Tulsa and Jenks. The city is growing
M-58 HIGHWAY ACCESS MANAGEMENT STUDY Mullen Road to Bel-Ray Boulevard. Prepared for CITY OF BELTON. May 2016
 M-58 HIGHWAY ACCESS MANAGEMENT STUDY Prepared for CITY OF BELTON By May 2016 Introduction Missouri State Highway 58 (M-58 Highway) is a major commercial corridor in the City of Belton. As development has
Bay to Bay Boulevard Complete Streets Project
 Bay to Bay Boulevard Complete Streets Project Dale Mabry Highway to Bayshore Boulevard February 08, 2018 Photo Source: Tampa Bay Times Alessandra Da Pra Meeting Format Introduction Resurfacing Information
Evaluation of M-99 (Broad Street) Road Diet and Intersection Operational Investigation
 Road Diet and Intersection Operational Investigation") Evaluation of M-99 (Broad Street) Road Diet and Intersection Operational Investigation City of Hillsdale, Hillsdale County, Michigan June 16, 2016 Final Report Prepared for City of Hillsdale 97 North Broad
Evaluation of M-99 (Broad Street) Road Diet and Intersection Operational Investigation City of Hillsdale, Hillsdale County, Michigan June 16, 2016 Final Report Prepared for City of Hillsdale 97 North Broad
Agenda. Overview PRINCE GEORGE S PLAZA METRO AREA PEDESTRIAN PLAN
 PRINCE GEORGE S PLAZA METRO AREA PEDESTRIAN PLAN May 28, 2008 Agenda Welcome and introductions Project overview and issue identification Planning context and strengths Design challenges and initial recommendations
Sixth Line Development - Transit Facilities Plan
 Memorandum Date: November 13, 2012 To: From: c.c. Subject: Rob Freeman (Freeman Planning) Kevin Phillips Sixth Line Development - Transit Facilities Plan 33016631 This memo was prepared to review the transit
Burlington County Bicycle Level of Service Study
 Burlington County Bicycle Level of Service Study June 2013 The Delaware Valley Regional Planning Commission is dedicated to uniting the region s elected officials, planning professionals, and the public
Traffic Impact Memorandum. May 22, 2018
 BISHOP PROFESSIONAL DEVELOPMENT BUILDING Proposed Land-use Change & Parking Modification 3601 SW 31st Street Topeka, Kansas 66614 CFS Project No. 185077 Traffic Impact Memorandum May 22, 2018 Prepared
Chapter 5 Future Transportation
 Chapter 5 Future Transportation The Future Land Use Plan identifies the desired land use designations. The land uses desired for Crozet depend, in large part, on the success of the transportation system,
3.0 Future Conditions
 3.0 Future Conditions In order to be able to recommend appropriate improvements to the transportation system of the Town, it is important to first understand the nature and volume of traffic that is expected
Complete Street Analysis of a Road Diet: Orange Grove Boulevard, Pasadena, CA
 Complete Street Analysis of a Road Diet: Orange Grove Boulevard, Pasadena, CA Aaron Elias, Bill Cisco Abstract As part of evaluating the feasibility of a road diet on Orange Grove Boulevard in Pasadena,
TRANSPORTATION ANALYSIS REPORT US Route 6 Huron, Erie County, Ohio
 TRANSPORTATION ANALYSIS REPORT US Route 6 Huron, Erie County, Ohio December 12, 2012 Prepared for: The City of Huron 417 Main Huron, OH 44839 Providing Practical Experience Technical Excellence and Client
CONNECTING PEOPLE TO PLACES
 CONNECTING PEOPLE TO PLACES 82 EAST BENCH MASTER PLAN 07 Introduction The East Bench transportation system is a collection of slow moving, treelined residential streets and major arteries that are the
Pedestrian Road Safety Audit
 Pedestrian Road Safety Audit Middlebrook Road From Father Hurley Boulevard to Waring Station Road December 2017 Montgomery County Department of Transportation Table of Contents 1. Introduction... 1 1.1
HENDERSON DEVELOPMENT 213, 217, 221, 221 ½, 223 HENDERSON AVENUE and 65 TEMPLETON STREET OTTAWA, ONTARIO TRANSPORTATION OVERVIEW.
 HENDERSON DEVELOPMENT 213, 217, 221, 221 ½, 223 HENDERSON AVENUE and 65 TEMPLETON STREET OTTAWA, ONTARIO TRANSPORTATION OVERVIEW Prepared for: 2294170 Ontario Inc. February 2, 2017 117-652 Report_1.doc
This page intentionally left blank.
 This page intentionally left blank. COMMUNITY Coweta Community Overview Coweta Coweta, a residential community located in Wagoner County, is a suburb of Tulsa situated southeast of the metropolitan area
MEMORANDUM INTRODUCTION/PURPOSE/OVERALL FINDINGS
 MEMORANDUM Date: To: From: Subject: Steve, City of Tacoma Dan Grayuski and Will Lisska, Fehr & Peers Schuster Corridor Trail Project SE12-0265.00 INTRODUCTION/PURPOSE/OVERALL FINDINGS The City of Tacoma
Traffic Impact Analysis Chatham County Grocery Chatham County, NC
 Chatham County Grocery Chatham County, NC TABLE OF CONTENTS 1. INTRODUCTION... 1 1.1. Location and Study Area... 1 1.2. Proposed Land Use and Access... 2 1.3. Adjacent Land Uses... 2 1.4. Existing ways...
APPENDIX E: Transportation Technical Report
 New Jersey Pennsylvania Lackawanna Cut-Off Passenger Rail Service Reston Project Environmental Assessment APPENDIX E: Transportation Technical Report E.1 Introduction As part of the overall environmental
ARTINSVILLE ENRY OUNTY REA RANSPORTATION TUDY
 ARTINSVILLE ENRY OUNTY REA RANSPORTATION TUDY DEVELOPED BY THE TRANSPORTATION AND MOBILITY PLANNING DIVISION OF THE VIRGINIA DEPARTMENT OF TRANSPORTATION IN COOPERATION WITH THE U.S. DEPARTMENT OF TRANSPORTATION,
Draft North Industrial Area-Wide Traffic Plan
 Summary of North Industrial and Hudson Bay Industrial Recommended Improvements Table 1. Summary of s Item Location 1 2 3 4 5 6 7 8 9 10 11 12 Millar Ave north of 51st St Super 8 Motel back lane 400 Block
Project Description Form 8EE
 Project Description Form 8EE Basic Project Information Submitting Jurisdiction/Agency: Town of Dumfries Project Title: Route 1 (Fraley Blvd) Widening: Brady's Hill Road to Dumfries Road Project Location:
CITY OF ALPHARETTA DOWNTOWN MASTER PLAN TRAFFIC EVALUATION
 CITY OF ALPHARETTA DOWNTOWN MASTER PLAN TRAFFIC EVALUATION June 2015 CITY OF ALPHARETTA DOWNTOWN MASTER PLAN TRAFFIC EVALUATION Introduction The Alpharetta Downtown Master Plan was developed in the fall
Highway 49, Highway 351 and Highway 91 Improvements Feasibility Study Craighead County
 Highway 49, Highway 351 and Highway 91 Improvements Feasibility Study Craighead County Executive Summary March 2015 Highway 49, Highway 351 and Highway 91 Improvements Feasibility Study Craighead County
Rank #1 Highest Priority Intersection
 Rank #1 Highest Priority Intersection Attachment 3: Proposed Interventions Pedestrian Safety City of Toronto s 10 Priority Intersections Sheppard Avenue East and Ambrose Road/Provost Drive Located in the
Route 7 Corridor Study
 Route 7 Corridor Study Executive Summary Study Area The following report analyzes a segment of the Virginia State Route 7 corridor. The corridor study area, spanning over 5 miles in length, is a multi
INTRODUCTION THOROUGHFARE SYSTEM CLASSIFICATIONS
 INTRODUCTION The thoroughfare plan will assist public officials in the development of a specialized system for efficient and safe movement of vehicular traffic while minimizing potential conflicts with
Grove Hall Business District Parking Analysis
 Grove Hall Business District Parking Analysis February 2014 Prepared for The Roxbury Great Neighborhoods Partnership Nuestra Comunidad Development Corporation Dudley Square Main Streets Greater Grove Hall
Highway 217 Corridor Study. Phase I Overview Report
 Highway 217 Corridor Study Phase I Overview Report November 3, 24 BACKGROUND AND OVERVIEW Study purpose The Highway 217 Corridor Study is developing multi-modal transportation solutions for traffic problems
Philadelphia Bus Network Choices Report
 Philadelphia Bus Network Choices Report JUNE 2018 SEPTA Table of Contents Executive Summary...7 What if transit gave us more freedom?... 8 What is this report?... 8 The main conclusions... 9 What is happening
TRAFFIC IMPACT ANALYSIS
 TRAFFIC IMPACT ANALYSIS FOR THE CHAMPAIGN UNIT#4 SCHOOL DISTRICT PROPOSED HIGH SCHOOL (SPALDING PARK SITE) IN THE CITY OF CHAMPAIGN Final Report Champaign Urbana Urbanized Area Transportation Study 6/24/2014
Brian McHugh, Buckhead Community Improvement District. SUBJECT: Wieuca Road at Phipps Boulevard Intersection Improvements Project
 MEMO TO: FROM: Brian McHugh, Buckhead Community Improvement District Jagan Kaja, AICP, WSP Parsons Brinckerhoff SUBJECT: Wieuca Road at Phipps Boulevard Intersection Improvements Project DATE: October
Prepared For: Shieldbay Developments Inc. c/o Matson, McConnell Ltd. 2430A Bloor Street West Toronto, Ontario M6S 1P9.
 Prepared For: Shieldbay Developments Inc. c/o Matson, McConnell Ltd. 2430A Bloor Street West Toronto, Ontario M6S 1P9 Prepared By: URS Canada Inc. 4 th Floor, 30 Leek Crescent Richmond Hill, Ontario L4B
Proposed Action, Purpose and Need Technical Memorandum
 Proposed Action, Purpose and Need Technical Memorandum MoPac (State Loop 1) Intersections, Austin District From North of Slaughter Lane to South of La Crosse Avenue CSJ: 3136-01-015 Travis County, Texas
CITY OF LOS ANGELES INTER-DEPARTMENTAL MEMORANDUM
 CITY OF LOS ANGELES INTER-DEPARTMENTAL MEMORANDUM Date: April 1, 219 To: Honorable City Council c/o City Clerk, Room 395, City Hall Attention: Honorable Mike Bonin, Chair, Transportation Committee From:
4. ENVIRONMENTAL IMPACT ANALYSIS 9. TRANSPORTATION AND TRAFFIC
 4. ENVIRONMENTAL IMPACT ANALYSIS 9. TRANSPORTATION AND TRAFFIC 4.9.1 INTRODUCTION The following section addresses the Proposed Project s impact on transportation and traffic based on the Traffic Study
DRAFT BUENA VISTA 2020 TRANSPORTATION PLAN
 DRAFT BUENA VISTA 2020 TRANSPORTATION PLAN DEVELOPED BY THE TRANSPORTATION PLANNING DIVISION OF THE VIRGINIA DEPARTMENT OF TRANSPORTATION IN COOPERATION WITH THE U.S. DEPARTMENT OF TRANSPORTATION, FEDERAL
Pocatello Regional Transit Master Transit Plan Draft Recommendations
 Pocatello Regional Transit Master Transit Plan Draft Recommendations Presentation Outline 1. 2. 3. 4. What is the Master Transit Plan? An overview of the study Where Are We Today? Key take-aways from existing
City of Gainesville Transportation/Roadway Needs PROJECT SUMMARY
 A1 Roadway Resurfacing $23,846,000 TYPE: Preservation of existing system Roadway resurfacing A2 Signal Replacement $6,000,000 TYPE: Preservation of existing system Replace traffic signals. B1 W 6th St
City of Homewood Transportation Plan
 City of Homewood Transportation Plan Prepared for: City of Homewood, Alabama Prepared by: Skipper Consulting, Inc. May 2007 TABLE OF CONTENTS INTRODUCTION... 1 BACKGROUND INFORMATION... 1 EXISTING TRANSPORTATION
SECTION 1 - TRAFFIC PLANNING
 SECTION 1 - TRAFFIC PLANNING 1.1 TRAFFIC OPERATIONS 1.1.1 Roadway Functional Classification The Multnomah County Comprehensive Framework Plan s Policy 34: Trafficways and the Functional Classification
Appendix C. NORTH METRO STATION AREA TRAFFIC IMPACT STATEMENT 88th Avenue Station
 Appendix C NORTH METRO STATION AREA TRAFFIC IMPACT STATEMENT 88th Avenue Station Prepared for: Regional Transportation Department and URS Corporation as part of the North Metro EIS David Evans and Associates,
Harrah s Station Square Casino
 Transportation Analysis Harrah s Station Square Casino Pittsburgh, Pennsylvania Submitted To: City of Pittsburgh and Pennsylvania Gaming Control Board Prepared By: DKS Associates GAI Consultants December
TRASBURG RANSPORTATION
 TRASBURG RANSPORTATION LAN DEVELOPED BY THE TRANSPORTATION PLANNING DIVISION OF THE VIRGINIA DEPARTMENT OF TRANSPORTATION IN COOPERATION WITH THE U.S. DEPARTMENT OF TRANSPORTATION, FEDERAL HIGHWAY ADMINISTRATION
Xin Ge, MCP Candidate 14, PennDesign. Roosevelt Boulevard Transit Improvement Plan
 Roosevelt Boulevard Transit Improvement Plan 1 Executive Summary Most of the trips in the US, no matter it is for work, errands, or leisure, are made by cars. Nevertheless, public transit is increasingly
Outreach Approach RENEW SF served as the primary liaison with the North Beach community; the Chinatown. Executive Summary
 Executive Summary Executive Summary The Columbus Avenue Neighborhood Transportation Study s objective is to identify changes to transportation infrastructure and policies that could enhance the livability
Chapter 14 PARLIER RELATIONSHIP TO CITY PLANS AND POLICIES. Recommendations to Improve Pedestrian Safety in the City of Parlier (2014)
") Chapter 14 PARLIER This chapter describes the current status and future plans for biking and walking in the City of Parlier. RELATIONSHIP TO CITY PLANS AND POLICIES The Parlier General Plan is the primary
Chapter 14 PARLIER This chapter describes the current status and future plans for biking and walking in the City of Parlier. RELATIONSHIP TO CITY PLANS AND POLICIES The Parlier General Plan is the primary
Purpose and Need. Chapter Introduction. 2.2 Project Purpose and Need Project Purpose Project Need
 Chapter 2 Purpose and Need 2.1 Introduction The El Camino Real Bus Rapid Transit (BRT) Project (Project) would make transit and other transportation improvements along a 17.6-mile segment of the El Camino
SETTINGS AND OPPORTUNITIES MOBILITY & ACCESS
 7 mobility & access how do people use el camino what is it like to drive on el camino/to park along el camino what is the pedestrian experience like what is the role of transit along the corridor what
5858 N COLLEGE, LLC N College Avenue Traffic Impact Study
 5858 N COLLEGE, LLC nue Traffic Impact Study August 22, 2016 Contents Traffic Impact Study Page Preparer Qualifications... 1 Introduction... 2 Existing Roadway Conditions... 5 Existing Traffic Conditions...
Chapter 2: Standards for Access, Non-Motorized, and Transit
 Standards for Access, Non-Motorized, and Transit Chapter 2: Standards for Access, Non-Motorized, and Transit The Washtenaw County Access Management Plan was developed based on the analysis of existing
City of Davis East Covell Corridor Plan
 Community Open House #2 January 22, 2014 6:00 8:00 p.m. Veterans Memorial Center, Club Room City of Davis Introduction The (ECCP) is a taking a comprehensive look at the existing transportation systems
Travel and Rider Characteristics for Metrobus
 Travel and Rider Characteristics for Metrobus 040829040.15 Travel and Rider Characteristics for Metrobus: 2012-2015 Overview The Miami Dade County Metropolitan Planning Organization (MPO) conducted a series
CAPITOL DRIVE & FOND DU LAC AVENUE INTERSECTION ANALYSIS. Urban Planning 772 SARAH BREGANT, RYAN PETERSON, & MATT WERDERITCH
 CAPITOL DRIVE & FOND DU LAC AVENUE INTERSECTION ANALYSIS Urban Planning 772 SARAH BREGANT, RYAN PETERSON, & MATT WERDERITCH OVERVIEW N 51 ST BOULEVARD N 51 ST BOULEVARD 12,100 44,700 W CAPITOL DRIVE 52,600
TRANSPORTATION & MOBILITY VISIONING MEETING. August 23 24, 2017
 TRANSPORTATION & MOBILITY VISIONING MEETING August 23 24, 2017 Project Team 1999 South Lakefront Framework Plan In 1999, the Chicago Park District authorized framework plans for three historic parks: Jackson,
Solana Beach Comprehensive Active Transportation Strategy (CATS)
") Solana Beach Comprehensive Active Transportation Strategy (CATS) 3.0 Goals & Policies The Solana Beach CATS goals and objectives outlined below were largely drawn from the Solana Beach Circulation Element
Solana Beach Comprehensive Active Transportation Strategy (CATS) 3.0 Goals & Policies The Solana Beach CATS goals and objectives outlined below were largely drawn from the Solana Beach Circulation Element
MOBILITY WORKSHOP. Joint City Council and Transportation Commission May 5, 2014
 MOBILITY WORKSHOP Joint City Council and Transportation Commission May 5, 2014 Review of General Plan M-1 Develop world-class transit system M-3 Maintain/enhance pedestrian-oriented City M-4 Create comprehensive
MUTCD Part 6G: Type of Temporary Traffic Control Zone Activities
 MUTCD Part 6G: Type of Temporary Traffic Control Zone Activities 6G.01 Typical Applications Each temporary traffic control (TTC) zone is different. Many variables, such as location of work, highway type,
3.9 Recreational Trails and Natural Areas
 3.9 Recreational Trails and Natural Areas 3.9.1 Introduction Parks and other recreational facilities such as trails, bicycle routes, and open space are important community resources. This section discusses
University Hill Transportation Study Technical Memorandum Alternatives Modeling and Analysis May 2007
 Technical Memorandum May 2007 Syracuse Metropolitan Transportation Council Edwards and Kelcey with Wallace Roberts and Todd Alta Planning and Design CONTENTS SECTION ONE- INTRODUCTION...1 SECTION TWO-
US 130 NJ TURNPIKE AREA INFRASTRUCTURE NEEDS ANALYSIS
 US 130 NJ TURNPIKE AREA INFRASTRUCTURE NEEDS ANALYSIS DELAWARE VALLEY REGIONAL PLANNING COMMISSION JUNE 2001 861-7XUQSLNH$UHD,QIUDVWUXFWXUH 1HHGV$QDO\VLV June, 2001 DELAWARE VALLEY REGIONAL PLANNING COMMISSION
CITY OF BLOOMINGTON COMPLETE STREETS POLICY
 CITY OF BLOOMINGTON COMPLETE STREETS POLICY POLICY OBJECTIVE: The City of Bloomington will enhance safety, mobility, accessibility and convenience for transportation network users of all ages and abilities,
JULY Ridge Pike. Lower Providence Township MONTGOMERY COUNTY
 JULY 2013 Ridge Pike Lower Providence Township MONTGOMERY COUNTY JULY 2013 Ridge Pike Lower Providence Township MONTGOMERY COUNTY PA BUCKS MERCER MONTGOMERY CHESTER PHILADELPHIA DELAWARE BURLINGTON New
Americans with Disabilities Act Transition Plan for Public Right-of-Way Improvements
 Americans with Disabilities Act Transition Plan for Public Right-of-Way Improvements Prepared by: Public Works Department Engineering Division October 2015 Table of Contents Section I Introduction.. 3
Multi-Modal Traffic Analysis. Parisi and Associates
 Mill Valley to Corte Madera Bicycle and Pedestrian Corridor Study Appendix D: Multi-Modal Traffic Analysis Prepared by Parisi and Associates August 2009 Appendix D - Multi-Modal Traffic Analysis Table
NEWMARKET CENTRE Mobility Hub Profile
 Mobility Hub Profile Dundas Newmarket West-Bloor Centre Anchor Hub Gateway Hub N MOBILITY HUBS: Places of connectivity between regional and rapid transit services, where different modes of transportation
Corridor Advisory Group and Task Force Meeting #10. July 27, 2011
 Corridor Advisory Group and Task Force Meeting #10 July 27, 2011 1 Agenda Recap CAG/TF #9 Public Meeting #2 Summary Single Mode Alternatives Evaluation Results Next Steps 2 3 CAG/TF #9 Recap CAG /TF #9
Dr. M.L. King, Jr. Street North Complete Streets Resurfacing Opportunities HOUSING, LAND USE, AND TRANSPORTATION COMMITTEE MARCH 22, 2018
 Dr. M.L. King, Jr. Street North Complete Streets Resurfacing Opportunities HOUSING, LAND USE, AND TRANSPORTATION COMMITTEE MARCH 22, 2018 What s Happening The City plans to mill and resurface Dr. M.L.
Non-Motorized Transportation 7-1
 Non-Motorized Transportation 7-1 Transportation facilities no longer mean just accommodating a vehicle powered by a combustion engine. Pedestrian and non-motorized facilities are important modes of travel
MCTC 2018 RTP SCS and Madera County RIFP Multi-Modal Project Eval Criteria GV13.xlsx
 MCTC 8 RTP SCS and Madera County RIFP Multi-Modal Project Eval Criteria GV.xlsx Madera County Transportation Commission Regional Transportation Plan / Sustainable Communities Strategy Multi-Modal Project
Bridgewater Complete Streets Prioritization Plan and Pedestrian Safety Assessment
 Bridgewater Complete Streets Prioritization Plan and Pedestrian Safety Assessment Presented by Luciano Rabito Manager of Complete Streets Presented to Bridgewater, MA Wednesday, April 26, 2017 6:30 P.M.
4. Action Plan & Projects
 4. Action Plan & Projects 45 46 ACTION PLAN AND PROJECTS The Action Plan organizes the list of transportation projects described in the Mobility Framework Plan section into short-term (0-5 years) and long-term
PRELIMINARY DRAFT WADDLE ROAD / I-99 INTERCHANGE PROJECT ALTERNATIVE ANALYSIS FINAL TRAFFIC SUMMARY REPORT
 PRELIMINARY DRAFT WADDLE ROAD / I-99 INTERCHANGE PROJECT ALTERNATIVE ANALYSIS FINAL TRAFFIC SUMMARY REPORT Prepared by: In Association with: November 2013 EXECUTIVE SUMMARY Patton Township, in partnership
Lincoln Avenue Road Diet Trial
 Lincoln Avenue Road Diet Trial Data Collection Report June 1, 2015 Department of Transportation Table of Contents I. Introduction...... 3 II. Data Collection Methodology & Results...... 5 A. Traffic Volume
Regional Transportation Needs Within Southeastern Wisconsin
 Regional Transportation Needs Within Southeastern Wisconsin #118274 May 24, 2006 1 Introduction The Southeastern Wisconsin Regional Planning Commission (SEWRPC) is the official areawide planning agency
APPENDIX A. Outreach Summary
 APPENDIX A Outreach Summary COUNTYWIDE TRANSPORTATION PLAN Summary of Public Outreach and Engagement To gather an understanding of the transportation issues and priorities throughout the county, and inform
STONY PLAIN ROAD STREETSCAPE
 Jasper Place Revitalization Strategy: Vision The people involved in the Jasper Place Revitalization Strategy envision: Goal 1: Feeling safe in our community Create a community where feeling safe is common--where
summary of issues and opportunities
 1 summary of issues and opportunities EXECUTIVE SUMMARY CHAPTER 2: HISTORY - 3: LAND USE This first chapter is an overview of lessons learned from analysis of the existing conditions on El Camino as well