Urban transportation in emerging cities
|
|
|
- Daniel Day
- 5 years ago
- Views:
Transcription
1 February 2017 Urban transportation in emerging cities Gilles Duranton Wharton
2 Congestion, mobility, and accessibility in emerging cities The current state of the debate: Very little academic interest outside of congestion A traditional policy focus on mobility that ignores accessibility A new academic focus on accessibility that often negates mobility This is clearly undesirable 2
3 Accessibility, mobility, and congestion in emerging cities What I want to do: Rekindle interest in urban transportation in emerging cities Propose an integrated framework to think about accessibility, mobility, and congestion consistently Show that we can make progress by combing simple economics with novel sources of data 3
4 Roadmap The importance of urban transportation in emerging cities and the transportation wedge Redefining the mobility vs. accessibility debate Mobility and accessibility in Indian cities A focus on congestion 4
5 Urban transportation matters The benefits from cities and urbanization Cities make workers and firms more productive Cities allow residents to consume a greater variety of goods at a lower price Cities allow residents to enjoy urban amenities But for this, city residents need to be able to go places 5
6 Urban transportation matters Extremely large investments are involved Transportation represents more than 20% of World Bank commitments A kilometer of subway costs at least 100 m$ Roadway expansion plans may involve the conversion of 5 to 10% of urban land 6
7 Urban transportation matters Urban households allocate considerable monetary resources to be able to move around us households devote 17.5% of their expenditure to transportation French households devote 13.5% of their expenditure to transportation Colombian households spend 9% of their income on transportation 7
8 Urban transportation matters Urban households allocate considerable time resources to be able to move around us households devote 17.5% of their expenditure to transportation French households devote 13.5% of their expenditure to transportation Colombian households spend 9% of their income on transportation 8
9 Urban transportation matters In a typical us metropolitan area: A traveler takes 4.2 trips per day Each trip is on average 12.8 kilometers long and takes 17.5 minutes Reported travel speed is 38.5 km/h and overwhelmingly by car In Bogota, Colombia: A traveler takes 2.7 trips per day Each trip is on average 10.9 kilometers long and takes 38.2 minutes Reported travel speed is 17.1 km/h and car and taxi are only about a quarter of all trips 9
10 Mobility Historically, urban transportation has been managed by transportation planners Mobility has been their key concern Mobility is essentially the speed at which one can travel from O to D Mobility is easily measurable To accommodate a growing demand, increasing capacity is usually the answer 10
11 Accessibility When traveling from O to D, the relevant measure is not speed but the total cost of reaching a destination (time, monetary, and other) Accessibility is essentially the ease of reaching a destination Accessibility is hard to measure, be it because the choice of a destination is endogenous Accessibility is usually managed by land-use planners with little consideration of mobility, sometimes in opposition to mobility 11
12 Accessibility and mobility For a given trip: Start with a simple relationship: total cost = distance cost per unit of distance To simplify, we only consider the time element: duration = distance / speed or: - log duration = -log distance + log speed or: time accessibility = distance accessibility + mobility In turn, we can decompose mobility: time accessibility = distance accessibility + free mobility + congestion factor 12
13 Measuring accessibility and mobility in cities This is a real data challenge Ideally, we need a very large, precise, sample of trips taken by travelers everywhere Transportation surveys are scarce and sparse (and often lack key elements and their reliability is questionable) Road censors are also problematic: we need to know about trips Recent alternative: counterfactual trips using mapping/navigagtion websites/apps Key limitation: these are not real trips and thus may not be representative of actual travel 13
14 Measuring accessibility and mobility in cities Use Google Maps in 154 large Indian cities Delineate these cities using light nights (DN>34) Four trip design strategies: Radial trips Circumferential trips Gravity trips Trips to remarkable places These strategies aim to mimic actual trips in key dimensions (length, destinations, etc) or some idealized travel behavior Data collection to be extended to many more cities in the world 14
 and J (right) (JRC) gives us land cover classi cations (e.g. 15 bare soil and rocks, roads, surface water, medium built-up, etc.) across space.")
15 Illustration, Jamnagar in Gujarat Land Code Classification Jamnagar Figure 1: Google Maps representation Lighted built-up areas Degree of build-up in lit-up areas of Mumbai (left) and J (right) (JRC) gives us land cover classi cations (e.g. 15 bare soil and rocks, roads, surface water, medium built-up, etc.) across space. We b
16 Geometric (circum) trips Mumbai (Bombay) s Illustration, Jamnagar in Gujarat Geometric (circum) trips Jamnagar Geometric (abs) trips Jamnagar Clockwise Counter Clockwise Clockwise 2 Counter Clockwise 5 Radial trips Circumferential trips olute 2 km, 5 km, 10 km, around and 15 km igurelengths 4: Circumferential trips thefrom center for: Mumbai (left) and Jam and Jamnagar (right) agar (right) 16
17 hospital trips Mumbai (Bombay) Illustration, Jamnagar in Gujarat shopping_mall trips Jamnagar hospital trips Jamnagar the mall Trips and to the hospital (right) Figure 8: Trips Tripstoto hospitals in Mumbai (left) Jamnagar malls in Mumbai (left) and Jamnagar (right) trip was queried 10 times (with a standard deviation of 1.9). In fact, 99% o 17
18 Trip sampling We defined about 15 population trips per city Each trip was sampled about 10 times in the Fall of 2016 In total: about 22 million observations For each trip we know: duration, duration in absence of traffic, length, effective length, origin, destination, city, day, time of day 18
19 Some descriptive statistics: trips Table 1: Trip statistics percentile: Mean St. dev Speed Duration Duration (no traffic) Trip length Effective distance Notes: 22,728,842 observations. Durations are in minutes; distances are in kilometres; speeds are in kilometre per hour. 4. Mobility in Indian cities 4.1 Descriptive statistics 19
20 Some descriptive statistics: cities Table 2: Summary statistics for Indian cities Mean St. dev. Min. Max. Population ( 000), ,319 3, ,888 Metropolitan population ( 000), ,538 3, ,703 Population growth (%) Total area (km 2 ) Total road length (km) 1,384 3, ,513 Motorways (km) Primary roads Share households with car access (%) Share households with motorcycle access (%) Mean daily earnings ($) Notes: Cross-city averages not weighted by population. 154 cities except for vehicles registrations for which one city is missing. 1 also reports summary statistics for effective (or Euclidean) distance covered by trips. Average trip length is about 50% larger than20 average effective distance.
21 Some descriptive statistics: trips in cities Table 3: Summary statistics for travel speed in Indian cities Mean St. dev. Min. Max. All trips Radial trips Circumferential trips Gravity trips Trip to remarkable places All trips, unweighted by distance All trips in absence of traffic All trip, effective speed Notes: 154 cities. Speed in kilometers per hour. reported in table 1. As we will see below, this small difference arises because travel speed is faster in smaller cities for which we have fewer observations. 21 This value of 24.4 kilometers per hour is rather low, especially because night trips are
22 Estimating accessibility and mobility in cities We estimate the following regressions: For Y, we use: log Y i = αx i + FE c(i) + ɛ i Trip duration ( 1) for time-accessibility Trip length ( 1) for distance-accessibility Trip speed for mobility Trip speed in absence of traffic for free mobility Trip speed in absence of traffic / trip speed for the congestion factor In X we include: time of day, day of week, weather, type of destination (for accessibility), distance to center, and trip length and trip type (for mobility) 22
23 Estimating accessibility and mobility in cities Obviously many variants are possible depending on: What is included among the controls Which sample of trips is considered (weekend or not, specific hours of the day, etc) We can allow coefficients to vary across cities and estimate Laspeyres and Paasche type indices We can weight slower trips more For congestion we can use alternative measures, etc 23
24 Mobility in cities: some results Longer trips and trips further away from the center are faster Minimal differences between different types of trips Mild evidence of positive effects of bad weather Interesting time of day patterns 24
25 Time of day effects Figure 1: Estimated hour effects for weekday travel Estimated time effect Hour of the day The plain black line represents the hour effects estimated in column 5 of table 4 for all 154 cities. All the plotted coefficients larger than in absolute value are significant at 99%. The dashed black line represents the hour effects from the same estimation but restricts observations to the 20 largest cities. The plain grey line duplicates the same exercise for Delhi only. The dotted grey line only uses observations for which the distance to the center of the origin and destination 25 is on average less than 5 kilometers in Delhi.
26 Mobility in cities: some results Standard deviation of city fixed effects: 0.11 The fastest city is twice as fast as the slowest These differences are much larger than among us metropolitan areas 26
27 Who s slow? Table 5: Ranking of the 20 slowest cities, slowest at the top Rank City State Index 1 Kolkata West Bengal Bangalore Karnataka Hyderabad Andhra Pradesh Mumbai Maharashtra Varanasi (Benares) Uttar Pradesh Patna Bihar Bhagalpur Bihar Delhi Delhi Bihar Sharif Bihar Chennai Tamil Nadu Muzaffarpur Bihar Aligarh Uttar Pradesh English Bazar (Malda) West Bengal Darbhanga Bihar Gaya Bihar Allahabad Uttar Pradesh Ranchi Jharkhand Dhanbad Jharkhand Akola Maharashtra Pune Maharashtra Notes: Mobility index is measured by the city effect estimated in column 5 of table 4. 27
28 Who s fast? Table 6: Ranking of the 10 fastest cities, fastest at the top Rank City Index 1 Ranipet Tamil Nadu Bokaro Steel City Jharkhand Srinagar Jammu and Kashmir Kayamkulam Kerala Jammu Jammu and Kashmir Thrissur Kerala Palakkad Kerala Chandigarh Chandigarh Alwar Rajasthan Thoothukkudi Tamil Nadu 0.15 Mobility index is measured by the city effect estimated in column 5 of table 4. 28
29 Mobility in cities: how robust Results are highly robust to the exact estimation procedure, hours of the days being considered, and type of trips Exception: the correlations between our preferred index and measures of mean speed are lower because means do not condition out trip length Laspeyres-type indices are more fragile because they require wild out of sample predictions 29
30 Accessibility in cities: some results For distance accessibility Standard deviation of city fixed effects: 0.20 to 0.29 The distance ratio between the extremes is 2.7 to 4.0 For time accessibility Standard deviation of city fixed effects: 0.14 to 0.22 The distance ratio between the extremes is 2.2 to
31 Who s least time accessible? Table 10: Ranking of the 20 least time-accessible cities cities, worst at the top Rank City State Index 1 Kolkata West Bengal Mumbai Maharashtra Delhi Delhi Bokaro Steel City Jharkhand Asansol West Bengal Hyderabad Andhra Pradesh Dehradun Uttaranchal Mathura Uttar Pradesh Dhanbad Jharkhand Guntur Andhra Pradesh Chandrapur Maharashtra Vijayawada Andhra Pradesh Bangalore Karnataka Aligarh Uttar Pradesh Begusarai Bihar Chennai Tamil Nadu Bhagalpur Bihar Allahabad Uttar Pradesh Jalandhar Punjab Gulbarga Karnataka Notes: Time-accessibility index is measured as described in the text. 31
32 Who s most time accessible? Table 11: Ranking of the 10 most time-accessible cities, best at the top Rank City State Index 1 Anantapur Andhra Pradesh Anand Gujarat Kannur Kerala Latur Maharashtra Hubli-Dharwad Karnataka Brahmapur Orissa Nizamabad Andhra Pradesh Davangere Karnataka Palakkad Kerala Bhilwara Rajasthan 0.34 e-accessibility index is measured as described in the text. 32
33 Decomposing mobility We can decompose mobility into free mobility and a congestion factor Free mobility and the congestion factor factor fully explain mobility by construction Free mobility explains 70% of the variance of mobility The congestion factor explains 15% (and this is broader than just too many vehicles travelling) Cities that are intrinsically faster are also more congested The congestion factor has more explanatory power during peak hours and in large cities Still poor mobility appears to be driven by intrinsic poor mobility rather than overcrowded roads for the most part 33
34 Decomposing time accessibility We can also decompose time-accessibility into distance accessibility and mobility Distance accessibility and mobility explain most of time accessibility in practice Mobility explains 21% of the variance of time accessibility Distance accessibility explains 81% (and this is broader than just too many vehicles travelling) Distance accessibility are essentially uncorrelated 34
35 Explaining accessibility and mobility We now try to explain free mobility, the congestion factor, distance accessibility, and time accessibility with a range of city level characteristics Population worsens free mobility and congestion and improves distance accessibility. The resulting effect on time accessibility is small Area improves free mobility, has little effect on congestion, and worsens distance accessibility. The resulting effect on time accessibility negative 35
36 Explaining accessibility and mobility Primary roads improve free mobility, do little to the congestion factor, improve distance accessibility. The resulting effect on time accessibility is large The explanatory power of roads is small Vehicles are strongly positively associated with free mobility, have a large negative effect on congestion, and are positively associated with distance accessibility. The overall association with time accessibility is positive 36
37 Some more speculative conclusions There is tremendous heterogeneity in mobility and accessibility across India Congestion matters but maybe not as much as we think There is general mobility problem in Indian cities More roadway allows people to go places but it has only a small effect on mobility The organisation and the management of the roadway is perhaps more important than its sheer quantity The roadway in Indian cities appears to serve many purposes beyond motorized travel. Specializing the roadway for motorized travel entails both costs and benefits 37
38 More on congestion Because of data limitations, congestion is anything that slows down traffic relative to free mobility We know what congestion does to mobility but cannot provide a measure of its welfare costs For this we need more data 38
39 The fundamental diagram of traffic congestion S Congested region S 0 V V 0 Hypercongested region N 0 N 39
40 1 / S = The supply and demand of travel (ignoring hypercongestion) C E MC (marginal cost) τ B A C (average cost) D (demand) V V opt V eq 40
41 The social of congestion To compute the deadweight loss of congestion We need to know about supply (cost) We need to know about demand We need to know about the distortion The distortion is easy: travelers pay the average cost of travel, not the marginal cost For demand, we know about travel conditions when travelers choose to travel and when they choose not to This requires both actual and counterfactual travel data: the Bogota transportation survey and Google Maps 41

42 Colombia 42
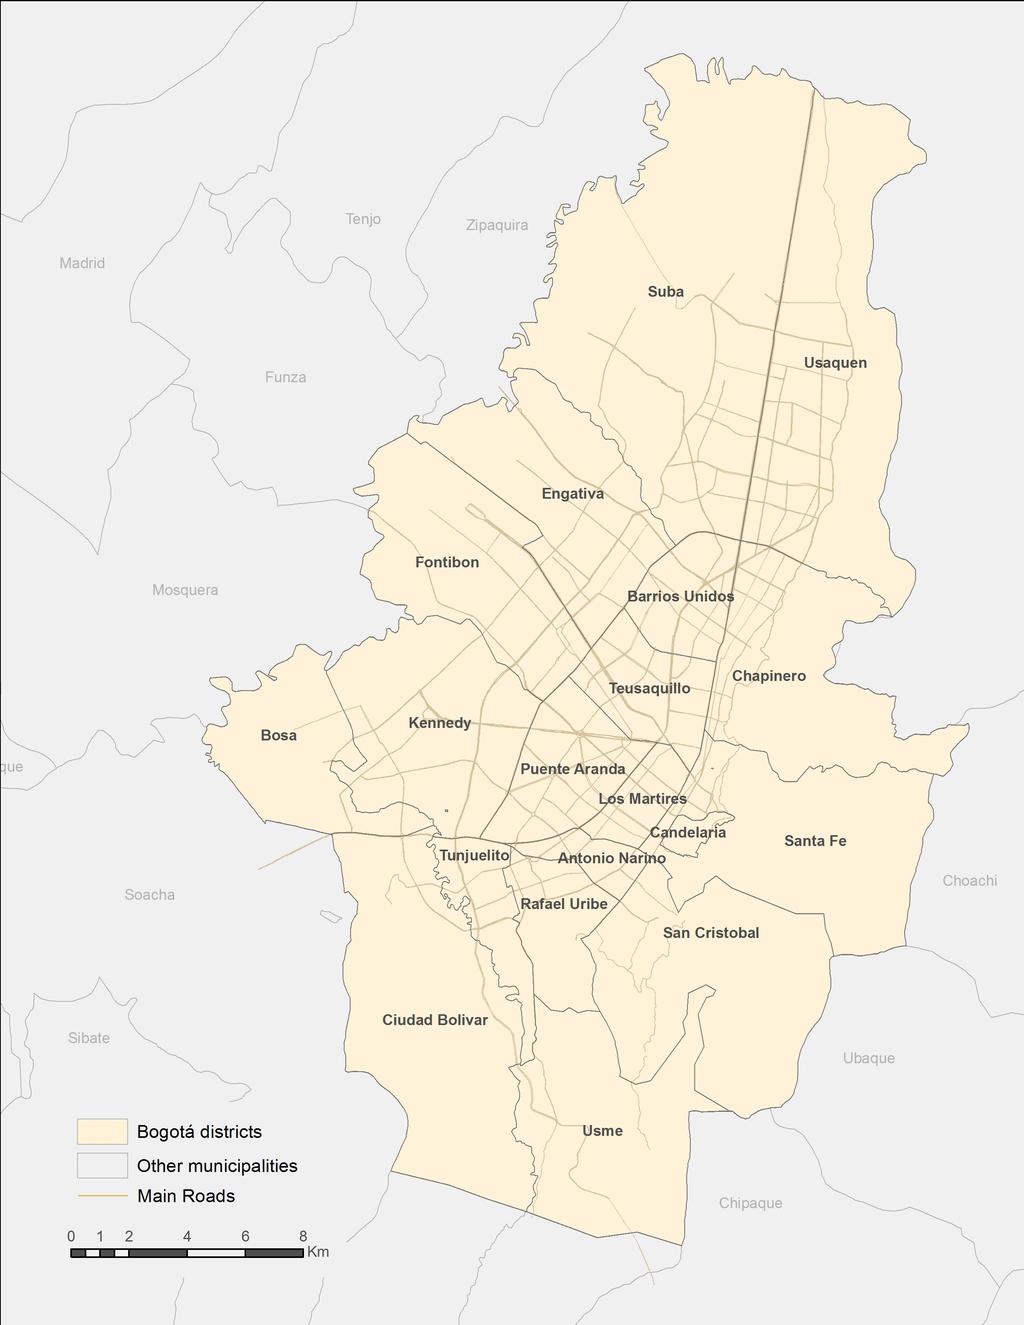
43 Bogotá 43
44 The Bogota transportation survey Travel diary from 2011 (similar to us nhts or the French Enquête Transport) 16,157 households representing about 100,000 trips, 65,000 unique OD pairs Reports origin, destination, time of departure, time of arrival, purpose, mode, etc Day of the week trips 44
45 Estimating travel supply Regress the time cost of travel on the number of travelers controlling for trip and traveler characteristics Worry: simultaneous determination of the time cost of travel and number of travelers Shocks lead travelers to stay home, get stuck, take an alternative mode of transport, or re-route their trip Some of these shocks like the weather are observable To avoid biases from re-routing, we need to consider entire areas Use counterfactual travel times and number of travelers instead of actual ones 45
46 Actual times cost on all trips Local polynomial smooth l_timecost_reported l_densityr bwidth=1 95% CI lpoly smooth 46
47 Counterfactual time costs on all trips at stated times Local polynomial smooth l_timecost_traffic l_densityx 95% CI lpoly smooth bwidth=1 47
48 Counterfactual time costs on all trips at all times Local polynomial smooth l_timecost_traffic l_densityx 95% CI lpoly smooth bwidth=1 48
49 Estimating travel supply Our preferred estimate indicates an elasticity of the time cost of travel with respect to the number of travelers of 0.06 on average and 0.20 at the steepest This is a small number The existence of local streets puts a ceiling on the time cost of travel 49
50 Estimating travel demand We want to estimate the propensity to travel on a trip given the time cost of that trip We want to account for the fact that demand is stronger at certain hours of the day In practice we regress whether a traveler travels on a trip as a function of the time cost of travel for that trip, trip and traveler characteristics This yields an individual demand for travel time that we can aggregate and transform into an aggregate demand for kilometers traveled The main worry is that individual travel demand will be correlated with aggregate travel demand We can reduce the problem by imposing specific intercepts by 50
51 time of the day and sub-areas If we underestimate the elasticity of travel demand, we can obtain an upper bound by assuming a flat demand curve 51
52 Estimating travel demand We estimate a demand elasticity of about -1.2 to -1.8 The elasticity varies during the day but not sensitive to the exact estimation used 52
53 Computing the deadweight loss of congestion The wedge on the supply side is about 6% With the estimated demand elasticity, the amount of excess driving is of the same magnitude or smaller That means a loss triangle of about 0.2% or less - this is negligible Even with a supply wedge of 30% and a demand elasticity of 20, the loss is still only about 12% of travel time The problem is again a lack of capacity and slow traffic more than congestion narrowly defined 53
54 The road forward transit more big data streets and networks traffic management policies environmental issues self driving vehicles 54
Accessibility and Mobility in Urban India
 Accessibility and Mobility in Urban India Prottoy Akbar, Victor Couture, Gilles Duranton, Ejaz Ghani, Adam Storeygard Work in progress, September 2017 Victor Couture Accessibility and Mobility in Urban
1-3 Business Days. 1-3 Business Days. 1-9 Business Days
 HOW TO CALCULATE THE CHARGES THAT APPLY TO YOUR SHIPMENT Choose the service you wish to use. Find the zone in which your destination/origin falls in the Zone Tables. Determine the total weight of your
CONSUMER PRICE INDEX NUMBERS FOR ALL INDIA & VARIOUS CENTRES FOR INDUSTR
 CONSUMER PRICE INDEX NUMBERS FOR ALL INDIA & VARIOUS CENTRES FOR INDUSTR BASE 1982 = 100 JANUARY FEBRUARY MARCH APRIL MAY JUNE JULY 2004 2004 2004 2004 2004 2004 2004 ***************************** ****************
Mobility and congestion in urban India
 Mobility and congestion in urban India Prottoy A. Akbar * Victor Couture * University of Pittsburgh University of California, Berkeley Gilles Duranton * Adam Storeygard * University of Pennsylvania Tufts
Mobility and congestion in urban India
 Mobility and congestion in urban India Prottoy A. Akbar * University of Pittsburgh Victor Couture * University of California, Berkeley Gilles Duranton * University of Pennsylvania Ejaz Ghani * World Bank
CHAPTER 1 ACCIDENTAL DEATHS IN INDIA
 CHAPTER 1 ACCIDENTAL DEATHS IN INDIA Incidence and Rate of Accidental Deaths during the Decade (1997-2007) The incidence of accidental deaths has shown a mixed trend during the decade 1997-2007 with an
Road Safety Infrastructure Facility Standards Indian Context
 Road Safety Infrastructure Facility Standards Indian Context Tony Mathew Road Safety Professional Advisor, IRF Tony.maths@gmail.com Contents AH & NH network in India Key Infrastructure Issues affecting
Impact of Preservation of Subsoil Water Act on Groundwater Depletion: The Case of Punjab, India
 Impact of Preservation of Subsoil Water Act on Groundwater Depletion: The Case of Punjab, India Amarnath Tripathi 1, Ashok K. Mishra 2, & Geetanjali Verma 3 1 FASAL Programme, Institute of Economic Growth,
Meerut: Source: RTO & Census Cars Jeeps Taxis Buses. Wheelers. Rise of Vehicle Population in Meerut
 Presenter: Sandeep Laha & Parvez Bashir Mentor: Mr. Pawan Kumar Meerut: Meerut is the 16 th Largest Metropolitan area in India. Urban Population was approx 13.5 lacs in 2011 and Projected compounded annual
Transportation Trends, Conditions and Issues. Regional Transportation Plan 2030
 Transportation Trends, Conditions and Issues Regional Transportation Plan 2030 23 Regional Transportation Plan 2030 24 Travel Characteristics Why Do People Travel? Over one-half of trips taken in Dane
DEVELOPMENT OF A SET OF TRIP GENERATION MODELS FOR TRAVEL DEMAND ESTIMATION IN THE COLOMBO METROPOLITAN REGION
 DEVELOPMENT OF A SET OF TRIP GENERATION MODELS FOR TRAVEL DEMAND ESTIMATION IN THE COLOMBO METROPOLITAN REGION Ravindra Wijesundera and Amal S. Kumarage Dept. of Civil Engineering, University of Moratuwa
Pocatello Regional Transit Master Transit Plan Draft Recommendations
 Pocatello Regional Transit Master Transit Plan Draft Recommendations Presentation Outline 1. 2. 3. 4. What is the Master Transit Plan? An overview of the study Where Are We Today? Key take-aways from existing
LYNNWOOD ROAD ARTERIAL STUDY The effect of intersection spacing on arterial operation
 LYNNWOOD ROAD ARTERIAL STUDY The effect of intersection spacing on arterial operation A J Joubert*, S L Burnett**, and T Ueckermann* *PWV Consortium, PO Box 1109, Sunninghill 2157 **Gautrans, Gauteng Department
3. Trends in accidents, injuries, fatalities, motor vehicles & road network
 2.2 In economic terms, the cost of road crash injuries is estimated at roughly 1 percent of gross national product (GNP) in low-income countries, 1.5 percent in middle-income countries and 2 percent in
Market Factors and Demand Analysis. World Bank
 Market Factors and Demand Analysis Bank Workshop and Training on Urban Transport Planning and Reform. Baku, April 14-16, 2009 Market Factors The market for Public Transport is affected by a variety of
International Journal of Research (IJR) Vol-1, Issue-8, September *
 Vol-1, Issue-8, September *") Development towards Sustainable Transportation Planning in India through Management of Non-motorized Transport Akshay Patil 1 * & 2 * 1 3 rd year B. Tech Planning student at College of Engineering Pune,
Development towards Sustainable Transportation Planning in India through Management of Non-motorized Transport Akshay Patil 1 * & 2 * 1 3 rd year B. Tech Planning student at College of Engineering Pune,
More than half the world lives on less than $2 a day
 More than half the world lives on less than $2 a day PRB s 2005 World Population Data Sheet reveals persisting global inequalities in health and well-being Presentation by Bill Butz, Carl Haub, Linda Jacobsen,
Planning Daily Work Trip under Congested Abuja Keffi Road Corridor
 ISBN 978-93-84468-19-4 Proceedings of International Conference on Transportation and Civil Engineering (ICTCE'15) London, March 21-22, 2015, pp. 43-47 Planning Daily Work Trip under Congested Abuja Keffi
MOBILITY CHALLENGES IN HILL CITIES
 MOBILITY CHALLENGES IN HILL CITIES Lalmuansanga Ralte, MCS Pvt Secretary to Minister & Under Secretary Urban Development & Poverty Alleviation Department Govt. of Mizoram DEMOGRAPHIC OVERVIEW INDIA MIZORAM
CAPACITY ESTIMATION OF URBAN ROAD IN BAGHDAD CITY: A CASE STUDY OF PALESTINE ARTERIAL ROAD
 VOL. 13, NO. 21, NOVEMBER 218 ISSN 1819-668 26-218 Asian Research Publishing Network (ARPN). All rights reserved. CAPACITY ESTIMATION OF URBAN ROAD IN BAGHDAD CITY: A CASE STUDY OF PALESTINE ARTERIAL ROAD
How Effective is Change of Pace Bowling in Cricket?
 How Effective is Change of Pace Bowling in Cricket? SAS and all other SAS Institute Inc. product or service names are registered trademarks or trademarks of SAS Institute Inc. in the USA and other countries.
Briefing Paper #1. An Overview of Regional Demand and Mode Share
 2011 Metro Vancouver Regional Trip Diary Survey Briefing Paper #1 An Overview of Regional Demand and Mode Share Introduction The 2011 Metro Vancouver Regional Trip Diary Survey is the latest survey conducted
Road Congestion Measures Using Instantaneous Information From the Canadian Vehicle Use Study (CVUS)
") Proceedings of Statistics Canada Symposium 2016 Growth in Statistical Information: Challenges and Benefits Road Congestion Measures Using Instantaneous Information From the Canadian Vehicle Use Study (CVUS)
Proceedings of Statistics Canada Symposium 2016 Growth in Statistical Information: Challenges and Benefits Road Congestion Measures Using Instantaneous Information From the Canadian Vehicle Use Study (CVUS)
VI. Market Factors and Deamnd Analysis
 VI. Market Factors and Deamnd Analysis Introduction to Public Transport Planning and Reform VI-1 Market Factors The market for Public Transport is affected by a variety of factors No two cities or even
Philadelphia Bus Network Choices Report
 Philadelphia Bus Network Choices Report JUNE 2018 SEPTA Table of Contents Executive Summary...7 What if transit gave us more freedom?... 8 What is this report?... 8 The main conclusions... 9 What is happening
CONGESTED LOS ANGELES
 CONGESTED LOS ANGELES Prepared For: Mayor Antonio Villaraigosa and City Council City of Los Angeles Prepared By: Jacki Murdock Transportation Analyst LADOT December 11 th, 2011 Outline What causes congestion?
OXFORDSHIRE & OXFORD CITY CONGESTION MONITORING 2015
 OXFORDSHIRE & OXFORD CITY CONGESTION MONITORING 2015 Introduction Congestion to most people means a motionless or slow moving line of vehicles. Congestion has many negative social, environmental and economic
Urban planners have invested a lot of energy in the idea of transit-oriented
 DOES TRANSIT-ORIENTED DEVELOPMENT NEED THE TRANSIT? D A N I E L G. C H AT M A N Urban planners have invested a lot of energy in the idea of transit-oriented developments (TODs). Developing dense housing
The Case for New Trends in Travel
 The Case for New Trends in Travel The Future of Cities and Travel Steven E. Polzin, PhD. Center for urban Transportation Research University of South Florida October 19, 2008 Successful Strategies from
Life Transitions and Travel Behaviour Study. Job changes and home moves disrupt established commuting patterns
 Life Transitions and Travel Behaviour Study Evidence Summary 2 Drivers of change to commuting mode Job changes and home moves disrupt established commuting patterns This leaflet summarises new analysis
SAFETY EVALUATION OF AN UNCONTROLLED
 SAFETY EVALUATION OF AN UNCONTROLLED INTERSECTION USING SURROGATE SAFETY MEASURES By S. Shekhar Babu Research scholar (Ext) IITB Asso Prof CME Pune Prof. P. Vedagiri Asst Prof Dept of civil Engg IIT Bombay
TomTom South African Congestion Index
 TomTom South African Congestion Index Disclaimer All copyrights, commercial rights, design rights, trademarks and other elements considered intellectual property that are published in this report are reserved
Travel and Use of Mass Media and Financial Services by Indian Households
 Report No. 450(54/31/2) Travel and Use of Mass Media and Financial Services by Indian Households NSS 54th Round (Jan June 1998) National Sample Survey Organisation Department Of Statistics Government Of
Road Accidental Analysis: A Case Study of Rajasthan State, India
 IOSR Journal Of Humanities And Social Science (IOSR-JHSS) Volume 19, Issue 5, Ver. V (May. 2014), PP 34-40 e-issn: 2279-0837, p-issn: 2279-0845. Road Accidental Analysis: A Case Study of Rajasthan State,
Temporal and Spatial Variation in Non-motorized Traffic in Minneapolis: Some Preliminary Analyses
 Temporal and Spatial Variation in Non-motorized Traffic in Minneapolis: Some Preliminary Analyses Spencer Agnew, Jason Borah, Steve Hankey, Kristopher Hoff, Brad Utecht, Zhiyi Xu, Greg Lindsey Thanks to:
Transit Ridership - Why the Decline and How to Increase. Hosted by the. Virginia Transit Association
 Transit Ridership - Why the Decline and How to Increase Hosted by the Virginia Transit Association Virginia Transit Association 1108 East Main Street, Suite 1108 Richmond, VA 23219 804.643.1166 www.vatransit.com
El Paso County 2040 Major Transportation Corridors Plan
 El Paso County 2040 Major Transportation Corridors Plan Connect-our-County Online Transportation User Survey Preliminary Results June 24, 2010 Years of Residence 2. How many years have you LIVED HERE?
Making Dublin More Accessible: The dublinbikes Scheme. Martin Rogers Colm Keenan 13th November 2012
 : The dublinbikes Scheme Martin Rogers Colm Keenan 13th November 2012 Modal Splits for Dublin 2001-2011 Dublin Mode Share Summary - Persons Crossing Canal Cordon 07.00-10.00 Year Total All PT % Car % Walk
Mobility and Congestion
 Technical Memorandum Mobility and Congestion Prepared for: Prepared by: September 25, 2013 1 Table of Contents 1. Introduction... 1 2. Congestion Forecasting Process... 1 2.1 Mobility and Congestion Terms...
CITY OF ABBOTSFORD TRANSPORTATION AND TRANSIT MASTER PLAN
 CITY OF ABBOTSFORD TRANSPORTATION AND TRANSIT MASTER PLAN EXECUTIVE COMMITTEE MONDAY, OCTOBER 2, 2017 TRANSPORTATION & TRANSIT AGENDA 1. Plan Overview 2. Shaping Influences 3. Existing Conditions and What
Can PRT overcome the conflicts between public transport and cycling?
 Can PRT overcome the conflicts between public transport and cycling? J. Meggs, F. Rupi, J. Schweizer Università di Bologna - DICAM Abstract Personal Rapid Transit (PRT) offers exceptional service characteristics,
Government of India Earth System Science Organization Ministry of Earth Sciences India
 Government of India Earth System Science Organization Ministry of Earth Sciences India Meteorological Department Dated: 10 May, 2018 Current Weather Status and Outlook for next two weeks Highlights of
NACTO Designing Cities Conference Project Evaluation: Tools for Measuring Success and Building Support. October 29, 2015
 NACTO Designing Cities Conference Project Evaluation: Tools for Measuring Success and Building Support October 29, 2015 The case for evaluation: Have a social contract with City Council, staff and community
An Analysis of the Travel Conditions on the U. S. 52 Bypass. Bypass in Lafayette, Indiana.
 An Analysis of the Travel Conditions on the U. S. 52 Bypass in Lafayette, Indiana T. B. T readway Research Assistant J. C. O ppenlander Research Engineer Joint Highway Research Project Purdue University
Transportation Issues Poll for New York City
 2016-17 Transportation Issues Poll for New York City 82% support Vision Zero and reducing traffic deaths 72% on average, support more street space for children to play, protected bike lanes and other safety
1. Introduction. 2. Survey Method. Volume 6 Issue 5, May Licensed Under Creative Commons Attribution CC BY
 A Study on Performance of an Urban Arterial Corridor Guggilla Raju 1, Rontala Ashwini 2 1 Assistant Professor, Department of Civil Engineering, GCET 2 Assistant Professor, Department of Civil Engineering,
Highway Safety Safety Audit & Safety in Work Zones
 Highway Safety Safety Audit & Safety in Work Zones Geetam Tiwari Transportation Research and Injury Prevention Programme Indian Institute of Technology Road Safety Policy Models Intuitive model (penalties,
Pool A Pool B Pool C Pool D MADHYA PRADESH HOCKEY ACADEMY HOCKEY ANDHRA PRADESH HOCKEY MADHYA PRADESH. Pool E Pool F Pool G Pool H
 HOCKEY 9 th SENIOR NATIONAL HOCKEY CHAMPIONSHIP 09 (MEN) B DIVISION CHENNAI, TAMIL 7 to 0 JANUARY 09 Pool A Pool B Pool C Pool D MADHYA HOCKEY HOCKEY UTTARAKHAND TELANGANA HOCKEY HOCKEY JHARKHAND SASHASTRA
Everett Transit Action Plan. Community Open House November 16, 2015
 Everett Transit Action Plan Community Open House Everett has a great location, but getting around the city and into surrounding communities is a problem for all ages Many Voices, One Future: The Everett
Understanding the Pattern of Work Travel in India using the Census Data
 Understanding the Pattern of Work Travel in India using the Census Data Presented at Urban Mobility India Hyderabad (India), November 5 th 2017 Nishant Singh Research Scholar Department of Civil Engineering
Congestion Evaluation Best Practices
 Congestion Evaluation Best Practices Todd Litman Victoria Transport Policy Institute Presented International Transportation and Economic Development Conference 10 April 2014 Congestion Indicators Indicator
A Review of Roundabout Speeds in north Texas February 28, 2014
 Denholm 1 A Review of Roundabout Speeds in north Texas February 28, 2014 Word Count: 6,118 words (2,618 + 11 figures x 250 + 3 tables x 250) John P. Denholm III Lee Engineering, LLC 3030 LBJ FRWY, Ste.
Measuring and Communicating Mobility:
 Measuring and Communicating Mobility: The District Mobility Project Stephanie Dock, District Department of Transportation TRB Transportation Issues in Major Cities Committee May 2, 2017 Deconstructing
A N E X P L O R AT I O N W I T H N E W Y O R K C I T Y TA X I D ATA S E T
 A N E X P L O R AT I O N W I T H N E W Y O R K C I T Y TA X I D ATA S E T GAO, Zheng 26 May 2016 Abstract The data analysis is two-part: an exploratory data analysis, and an attempt to answer an inferential
Gri d l o c k an d Gr o w t h : Th e Effect
 June 2009 Gri d l o c k an d Gr o w t h : Th e Effect o f Traffic Co n g e s t i o n on Re g i o n a l Economic Performance By David T. Hartgen, Ph.D., P.E. and M. Gregory Fields Project Director: Adrian
Land Use and Cycling. Søren Underlien Jensen, Project Manager, Danish Road Directorate Niels Juels Gade 13, 1020 Copenhagen K, Denmark
 Land Use and Cycling Søren Underlien Jensen, Project Manager, Danish Road Directorate Niels Juels Gade 13, 1020 Copenhagen K, Denmark suj@vd.dk Summary: Research about correlation between land use and
Purpose and Need. Chapter Introduction. 2.2 Project Purpose and Need Project Purpose Project Need
 Chapter 2 Purpose and Need 2.1 Introduction The El Camino Real Bus Rapid Transit (BRT) Project (Project) would make transit and other transportation improvements along a 17.6-mile segment of the El Camino
Neighborhood Influences on Use of Urban Trails
 Neighborhood Influences on Use of Urban Trails Greg Lindsey, Yuling Han, Jeff Wilson Center for Urban Policy and the Environment Indiana University Purdue University Indianapolis Objectives Present new
the 54th Annual Conference of the Association of Collegiate School of Planning (ACSP) in Philadelphia, Pennsylvania November 2 nd, 2014
 in Philadelphia, Pennsylvania November 2 nd, 2014") the 54th Annual Conference of the Association of Collegiate School of Planning (ACSP) in Philadelphia, Pennsylvania November 2 nd, 2014 Hiroyuki Iseki, Ph.D. Assistant Professor Urban Studies and Planning
the 54th Annual Conference of the Association of Collegiate School of Planning (ACSP) in Philadelphia, Pennsylvania November 2 nd, 2014 Hiroyuki Iseki, Ph.D. Assistant Professor Urban Studies and Planning
Answers Written Exam Public Transport
 Faculty of Engineering Technology Answers Written Exam Public Transport Written Exam Public Transport (195421200-1A) Teacher van Zuilekom Course code 195421200 Date and time 6-11-2014, 8:45-11:45 Location
Ridership Demand Analysis for Palestinian Intercity Public Transport
 Ridership Demand Analysis for Palestinian Intercity Public Transport Khaled A. Al-Sahili and Abdelmajid H. Sadeq An-Najah National University Abstract This article presents results of research to study
Birla Sun Life Asset Management Company Limited
 1 Some key changes! 1. Following investor categories will be excluded for all calculation purposes for all branches: a) Banks and FIs b) ETF c) Pension and PF d) Overseas Corp 2. For Locations under Super
VOLLEYBALL FEDERATION OF INDIA
 VOLLEYBALL FEDERATION OF INDIA CALENDAR ` AVC Events 2017-2018 1. 12 th Asian Women s U-17 Volleyball Championship Thailand 20-27 May 2018 2. 19 th Asian Women s U-19 Volleyball Championship Vietnam 10-17
Twitter Analysis of IPL cricket match using GICA method
 Twitter Analysis of IPL cricket match using GICA method Ajay Ramaseshan, Joao Pereira, Santosh Tirunagari July 28, 2012 Abstract Twitter is a powerful medium to express views and opinions, in fields such
1999 On-Board Sacramento Regional Transit District Survey
 SACOG-00-009 1999 On-Board Sacramento Regional Transit District Survey June 2000 Sacramento Area Council of Governments 1999 On-Board Sacramento Regional Transit District Survey June 2000 Table of Contents
 Government of India Earth System Science Organization Ministry of Earth Sciences India Meteorological Department Press Release Dated: 29 September, 2016 Subject: Current status of southwestt monsoonn 2016
Cambridge International Examinations Cambridge International General Certificate of Secondary Education
 Cambridge International Examinations Cambridge International General Certificate of Secondary Education *4574868004* GEOGRAPHY 0460/43 Paper 4 Alternative to Coursework October/November 2017 Candidates
A Study on Weekend Travel Patterns by Individual Characteristics in the Seoul Metropolitan Area
 A Study on Weekend Travel Patterns by Individual Characteristics in the Seoul Metropolitan Area Min-Seung. Song, Sang-Su. Kim and Jin-Hyuk. Chung Abstract Continuous increase of activity on weekends have
The North Shore Transportation Improvement Strategy and Western Richmond Terrace 1 : The Forgotten Corridor
 Elm Park Civic Association Island Voice Do Me A Faber The North Shore Transportation Improvement Strategy and Western Richmond Terrace 1 : The Forgotten Corridor Introduction Richmond Terrace is the northernmost
Municipal Solid Waste to Energy, A Distributed Approach. Ankur Scien+fic Energy Technologies Pvt. Ltd.
 Municipal Solid Waste to Energy, A Distributed Approach Ankur Scien+fic Energy Technologies Pvt. Ltd. 1 MSW Genera;on in India to Increase, No Real Solu;ons in Place Today 2.5 Kg* 365 Mil. Tonnes* 55 Mil.
A Silent Tsunami on Indian Road: A Comprehensive Analysis of Epidemiological Aspects of Road Traffic Accidents
 . British Journal of Medicine & Medical Research British Journal of Medicine & Medical Research 1(1): 14-23, 2011 SCIENCEDOMAIN international www.sciencedomain.org A Silent Tsunami on Indian Road: A Comprehensive
Executive Summary. TUCSON TRANSIT ON BOARD ORIGIN AND DESTINATION SURVEY Conducted October City of Tucson Department of Transportation
 Executive Summary TUCSON TRANSIT ON BOARD ORIGIN AND DESTINATION SURVEY Conducted October 2004 Prepared for: City of Tucson Department of Transportation May 2005 TUCSON TRANSIT ON BOARD ORIGIN AND DESTINATION
Rajast. Earth System. Press Release. Subject: forecast. country as. Normal. Regions Rainfall (mm) LPA -29% -61% -34% -4% -9%
 LPA -29% -61% -34% -4% -9%") Government of India Earth System Science Organization Ministry of Earth Sciences India Meteorological Department Press Release Dated: 15 September, 2016 Subject: Current status of southwestt monsoonn 2016
Government of India Earth System Science Organization Ministry of Earth Sciences India Meteorological Department Press Release Dated: 15 September, 2016 Subject: Current status of southwestt monsoonn 2016
a) List and define all assumptions for multiple OLS regression. These are all listed in section 6.5
 List and define all assumptions for multiple OLS regression. These are all listed in section 6.5") Prof. C. M. Dalton ECN 209A Spring 2015 Practice Problems (After HW1, HW2, before HW3) CORRECTED VERSION Question 1. Draw and describe a relationship with heteroskedastic errors. Support your claim with
Prof. C. M. Dalton ECN 209A Spring 2015 Practice Problems (After HW1, HW2, before HW3) CORRECTED VERSION Question 1. Draw and describe a relationship with heteroskedastic errors. Support your claim with
Report on Severe Weather Events for the Period July-September 2017
 Report on Severe Weather Events for the Period July-September 2017 (Reported by Dr. K. Sathi Devi and Smt. Sunitha Devi, NWFC, IMD, New Delhi) 1. Introduction As per the classification of the year into
Understanding changing travel demand in Greater Manchester
 Understanding changing travel demand in Greater Manchester Which aspects of travel demand have changed in ways which have not been anticipated by traditional forecasting approaches in the past twenty years?
Solutionbank S1 Edexcel AS and A Level Modular Mathematics
 Page 1 of 1 Exercise A, Question 1 A group of thirty college students was asked how many DVDs they had in their collection. The results are as follows. 12 25 34 17 12 18 29 34 45 6 15 9 25 23 29 22 20
Rolling Out Measures of Non-Motorized Accessibility: What Can We Now Say? Kevin J. Krizek University of Colorado
 Rolling Out Measures of Non-Motorized Accessibility: What Can We Now Say? Kevin J. Krizek University of Colorado www.kevinjkrizek.org Acknowledgements Mike Iacono Ahmed El-Geneidy Chen-Fu Liao Outline
National Capital Region Congestion Report
 NATIONAL CAPITAL REGION TRANSPORTATION PLANNING BOARD National Capital Region Congestion Report 4th Quarter 2015 Metropolitan Washington Council of Governments 777 North Capitol Street, N.E., Suite 300,
TRAFFIC CHARACTERISTICS. Unit I
 TRAFFIC CHARACTERISTICS Unit I Traffic stream Characteristics Overview Overview of Traffic Stream Components To begin to understand the functional and operational aspects of traffic on streets and highways
MODELING THE ACTIVITY BASED TRAVEL PATTERN OF WORKERS OF AN INDIAN METROPOLITAN CITY: CASE STUDY OF KOLKATA
 MODELING THE ACTIVITY BASED TRAVEL PATTERN OF WORKERS OF AN INDIAN METROPOLITAN CITY: CASE STUDY OF KOLKATA WORK ARITRA CHATTERJEE HOME SHOPPING PROF. DR. P.K. SARKAR SCHOOL OF PLANNING AND ARCHITECTURE,
June 2015 REGIONAL TRANSPORTATION SNAPSHOT
 June 2015 REGIONAL TRANSPORTATION SNAPSHOT THE REGION Who are we? The Greater Toronto and Hamilton Area (GTHA), consisting of Durham Region, Halton Region, the City of Hamilton, Peel Region, the City of
Research Offices in India. Delhi, Kolkata, Mumbai, Lucknow, Chennai, Bangalore, and. Hyderabad. TNS INDIA Pvt. Ltd
 Research Offices in India Delhi, Kolkata, Mumbai, Lucknow, Chennai, Bangalore, and Hyderabad TNS INDIA Pvt. Ltd 1 ROAD USER SATISFACTION SURVEY OUR EXPERIENCE TNS INDIA Social Research Division Assessment
Evolution of urban transport policies: International comparisons
 Centre for Transport Studies Evolution of urban transport policies: International comparisons Prof Peter Jones Centre for Transport Studies, UCL Presentation to the IATSS GIFTS Workshop, November 2015
Compression Study: City, State. City Convention & Visitors Bureau. Prepared for
 : City, State Prepared for City Convention & Visitors Bureau Table of Contents City Convention & Visitors Bureau... 1 Executive Summary... 3 Introduction... 4 Approach and Methodology... 4 General Characteristics
MEASURING RECURRENT AND NON-RECURRENT TRAFFIC CONGESTION
 MEASURING RECURRENT AND NON-RECURRENT TRAFFIC CONGESTION DRAFT Alexander Skabardonis* Institute of Transportation Studies University of California, Berkeley CA 970-170 Tel: (510) 6-9166, Fax: (510) 6-16
 Siła-Nowicka, K. (2018) Analysis of Actual Versus Permitted Driving Speed: a Case Study from Glasgow, Scotland. In: 26th Annual GIScience Research UK Conference (GISRUK 2018), Leicester, UK, 17-20 Apr
2. Context. Existing framework. The context. The challenge. Transport Strategy
 Transport Strategy Providing quality connections Contents 1. Introduction 2. Context 3. Long-term direction 4. Three-year priorities 5. Strategy tree Wellington City Council July 2006 1. Introduction Wellington
Identification and Improvement of Accidents black Spots for Mixed Traffic Streets in Developed Cities-A Case Study
 Identification and Improvement of Accidents black Spots for Mixed Traffic Streets in Developed Cities-A Case Study M.Subbareddy 1, K.S.B.Prasad 2 Department of Civil Engineering, GMRInstitute of Technology,
CHAPTER 8 APPLICATION AND INTERPRETATION OF CONGESTION MEASURES
 CHAPTER 8 APPLICATION AND INTERPRETATION OF CONGESTION MEASURES Chapter Summary The focus of this chapter is to provide the reader with practical applications and interpretation of the congestion measures
Road Accident Analysis and Identify the black spot location On State Highway-5 (Halol-Godhra Section)
") Road Accident Analysis and Identify the black spot location On State Highway-5 (Halol-Godhra Section) 1 Shah Dhruvit, 2 Shah Pranay M. 1 M.E civil(transportation), 2 M.E civil, P.h.d.(pursuing) 1 Tatva
Road Accident Analysis and Identify the black spot location On State Highway-5 (Halol-Godhra Section) 1 Shah Dhruvit, 2 Shah Pranay M. 1 M.E civil(transportation), 2 M.E civil, P.h.d.(pursuing) 1 Tatva
Roundabouts along Rural Arterials in South Africa
 Krogscheepers & Watters 0 0 Word count: 00 text + figures = 0 equivalent words including Title and Abstract. Roundabouts along Rural Arterials in South Africa Prepared for: rd Annual Meeting of Transportation
COLLECTION 2017 WEST ZONE EAST ZONE SOUTH ZONE NORTH ZONE QUTONE CERAMIC PVT. LTD. (OFFICES & SHOWROOMS) For Sales Enquiry:
 For Sales Enquiry:") QUTONE CERAMIC PVT. LTD. (OFFICES & SHOWROOMS) CORPORATE Ahmedabad 11, Titanium, Corporate Road, Opp. Prahalad Nagar Garden, Satellite, Ahmedabad-380 015, Gujarat, India. Tel.: +91 79 65108800-9900, 40300075
QUTONE CERAMIC PVT. LTD. (OFFICES & SHOWROOMS) CORPORATE Ahmedabad 11, Titanium, Corporate Road, Opp. Prahalad Nagar Garden, Satellite, Ahmedabad-380 015, Gujarat, India. Tel.: +91 79 65108800-9900, 40300075
URBAN TRANSPORT FOR DEVELOPMENT Slobodan Mitric World Bank. CODATU XIII, November 2008 Ho Chi Minh City, Vietnam
 URBAN TRANSPORT FOR DEVELOPMENT Slobodan Mitric World Bank CODATU XIII, November 2008 Ho Chi Minh City, Vietnam Sources of the presentation A Framework for Urban Transport Projects Operational Guidance
Traffic Safety Barriers to Walking and Bicycling Analysis of CA Add-On Responses to the 2009 NHTS
 Traffic Safety Barriers to Walking and Bicycling Analysis of CA Add-On Responses to the 2009 NHTS NHTS Users Conference June 2011 Robert Schneider, Swati Pande, & John Bigham, University of California
Measuring the Distribution and Costs of Congestion. Tim Lomax Texas Transportation Institute
 Measuring the Distribution and Costs of Congestion Tim Lomax Texas Transportation Institute http://mobility.tamu.edu The Congestion Measurement Story Travel time, variations, compare to goals WHAT? WHY?
2011 Origin-Destination Survey Bicycle Profile
 TRANS Committee 2011 Origin-Destination Survey National Capital Region December 2012 TRANS Committee Members: City of Ottawa, including OC Transpo Ville de Gatineau Société de transport de l Outaouais
3 ROADWAYS 3.1 CMS ROADWAY NETWORK 3.2 TRAVEL-TIME-BASED PERFORMANCE MEASURES Roadway Travel Time Measures
 ROADWAYS Approximately 6 million trips are made in the Boston metropolitan region every day. The vast majority of these trips (80 to percent, depending on trip type) involve the use of the roadway network
Update June 2018 OUR 2017 PUBLIC ENGAGEMENT
 Update June 2018 Hi, Let s Get Wellington Moving (LGWM) is developing a Recommended Programme of Investment (RPI) that meets our programme objectives and supports the city s and region s growth. As part
Presentation Summary Why Use GIS for Ped Planning? What Tools are Most Useful? How Can They be Applied? Pedestrian GIS Tools What are they good for?
 1 2 Pedestrian GIS Tools What are they good for? Pro Walk / Pro Bike 2006 Presentation Summary Why Use GIS for Ped Planning? What Tools are Most Useful? How Can They be Applied? Matt Haynes Fehr & Peers