Appendix A: Before-and-After Crash Analysis of a Section of Apalachee Parkway
|
|
|
- Alyson Gibbs
- 5 years ago
- Views:
Transcription
1 Appendix A: Before-and-After Crash Analysis of a Section of Apalachee Parkway 3
 The purpose of this study is to evaluate the safety impacts of median conversion along a 1.")
2 Safety Impacts of Median Conversion: A Case Study on Apalachee Parkway 1. Introduction (Prepared by FIU, 11/10/2011) The purpose of this study is to evaluate the safety impacts of median conversion along a mile section on the Apalachee Parkway on SR 20 in Tallahassee. Specifically, the study section runs between milepost and milepost on the roadway with ID Figure 1 shows the map location of the section. Along this study section, a two-way-left-turn-lane was replaced with a raised median in Figure 2 shows the condition of the roadway prior to the conversion to raised medians. Figure 3 shows the current conditions with the raised medians. The number of lanes before and after the median conversion remains two lanes in each direction. In this study, the safety impacts of the median conversion are evaluated by comparing the crash rates before and after the median conversion. The comparisons were performed for different crash types and crash severity levels. As Highway Safety Manual (HSM) has recommended three to five years for before and after analysis periods, this study includes analysis based on both the minimum (three-year) and the maximum (five-year) periods as recommended by HSM. The historical trend in crash rates over the period is first presented. BMP Apalachee Parkway EMP Figure 1. Study Limits of Apalachee Parkway on SR 20 4


3 Figure 2. Apalachee Parkway before 2002: with Two-Way-Left-Turn Lane Figure 3. Current Apalachee Parkway (2011): with Raised Medians 5
4 2. Crash Rate Trend from 1983 through 2010 Table 1 gives the annual crashes, the annual total MVMT (million vehicle miles traveled), and the annual crash rates from 1983 through Figure 4 plots the annual crash rates over the period. The figure shows three time periods with three different average crash rates, with significant drops in crash rates occurring in the years 1990 and While the reason for the sudden drop in 1990 is unknown, the sudden drop in crash rate in 2003 corresponds to the year right after the medians along the section were converted from two-way-left-turn lanes to raised medians. For the before-and-after analysis that follows, one year before and one year after the median construction year (2002) are excluded from the analysis not only to exclude the construction period, but also the transition periods before and after the median construction. Table 1. Annual Crashes, MVMT, and Crash Rates Year Crashes MVMT Crashes per MVMT (Crash Rate)
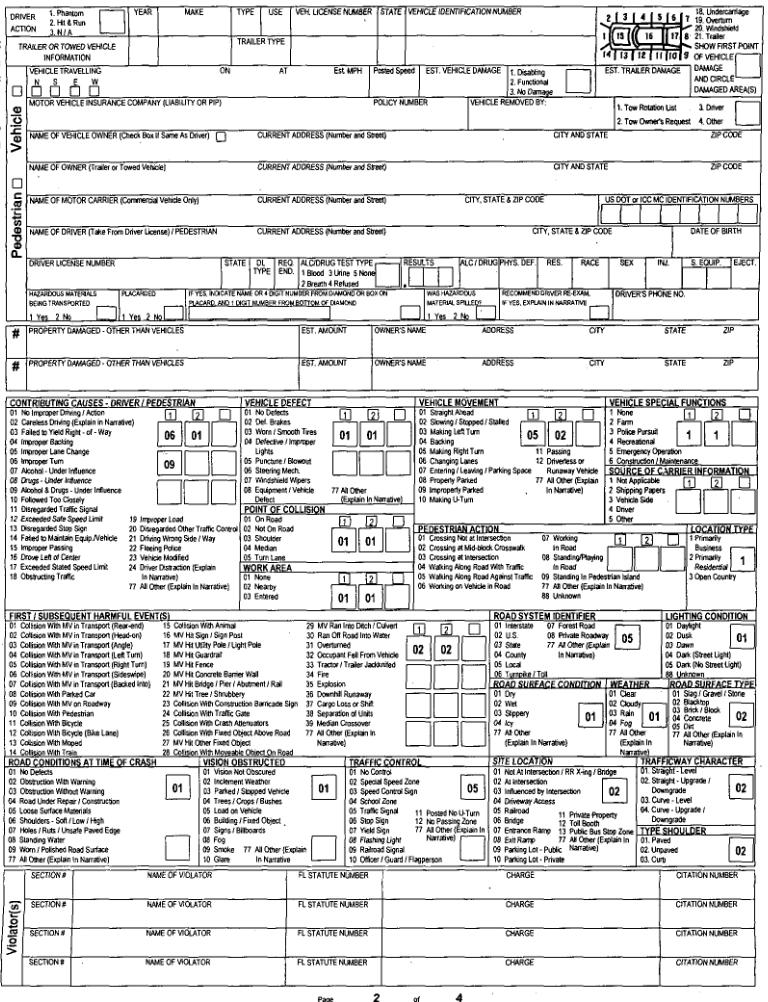
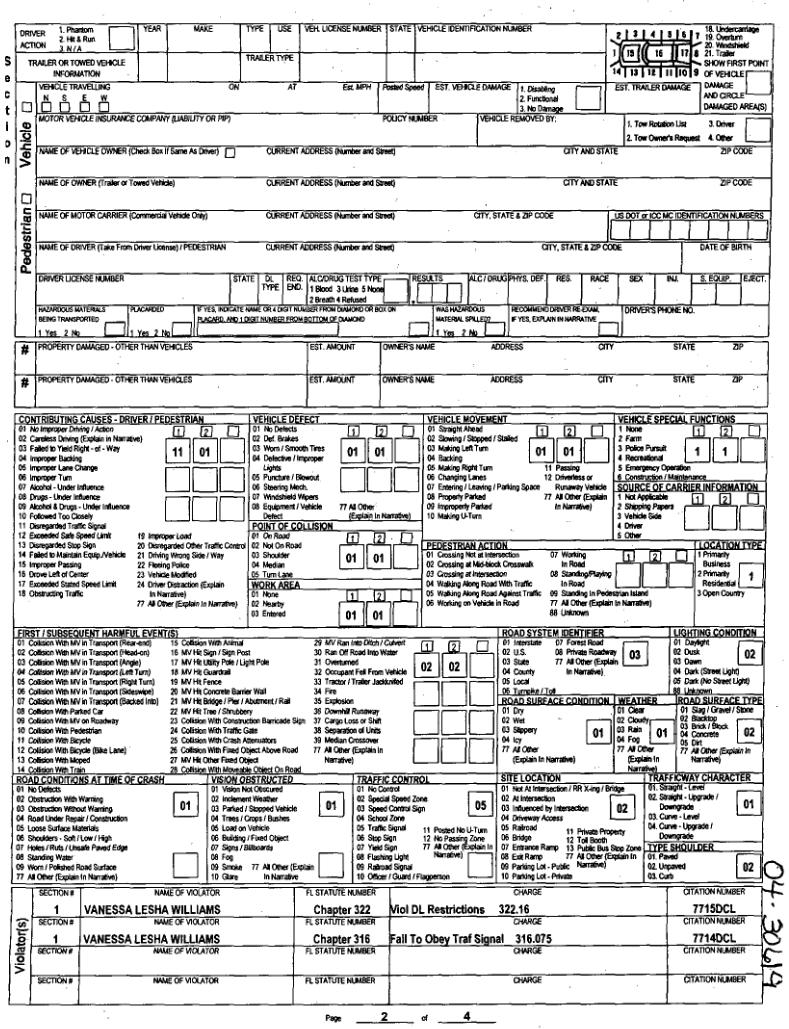
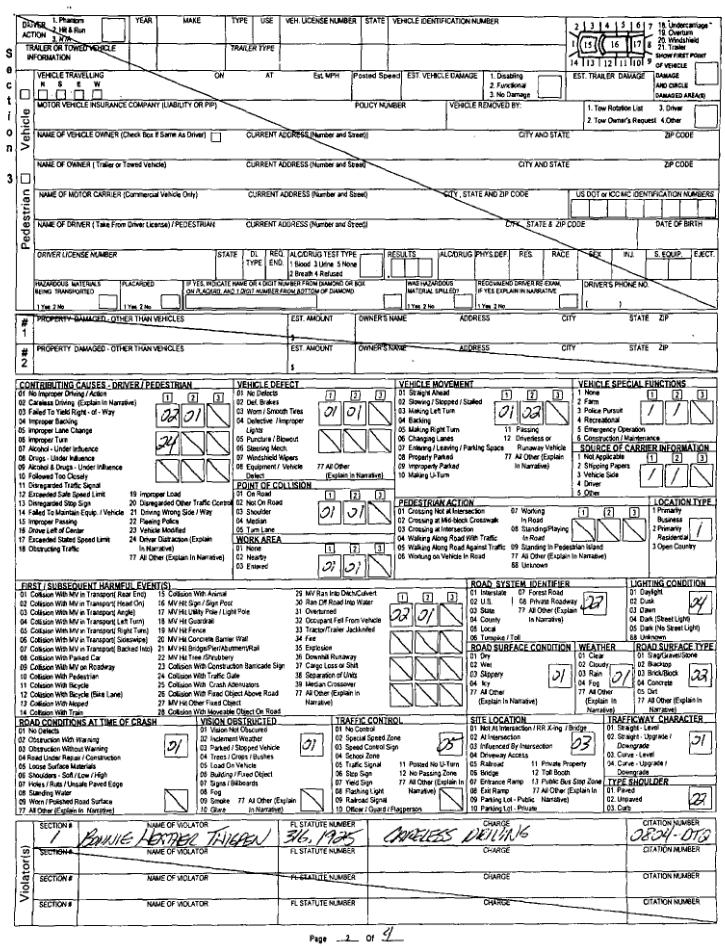
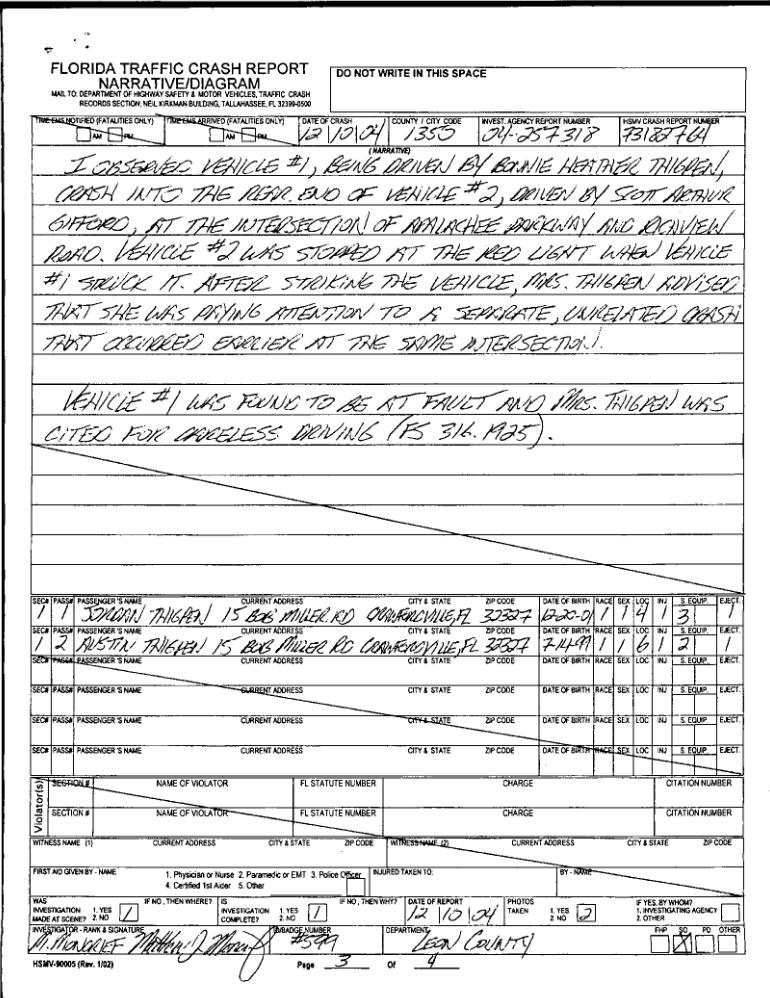
5 15 14 Total Crashes/MVMT Construction year (2002) Excluded from analysis One-year buffer Year 3. Three-Year Before-and-After Analysis 3.1 Analysis of Crash Types Figure 4. Total Crash Rates by Year This section focuses on a three-year before and-after crash analysis (i.e., and ) for different crash types. Table 2 gives the crash rates and crash numbers by crash types along with the percent change in crash rate. The highlighted crash types are those that show a reduction in crash rates in the after period. Figure 5 compares the three-year before and threeyear after crash rates for each crash type. The before-and-after statistics show significant reductions in crash rates for rear-end, angle, leftturn, right-turn, side-swipe, and bicycle crashes, with the left-turn crashes experienced the highest reduction (83.8)%), followed by angle (51.0%), left-turn (50.1%), rear-end (44.3%), and bicycle (27.1%), and side-swipe (14.7%) crashes. Overall, a reduction of 48.1% in total crashes was observed in the three-year after period. The statistics also show a slight increase in head-on crashes. This increase is unexpected as medians help to separate traffic in both directions except at locations with median openings. Specifically, there were four head-on crashes in 2004 (included in the three-year after period) and one in To verify the accuracy of these five head-on crashes, their police reports were examined. It was found that, of the five crashes coded as of the head-on crash type, three were actually rear-end crashes (all in 2004), one was an angle crash (in 2004), and one was somewhere between a right-turn and a head-on crash (in 2004, unrelated to median). The five police reports are attached in Appendix A. 7
6 Table 2. Percent Change in Crash Rates by Crash Types (Three-Year Periods) Crash Type Before ( ) After ( ) % Change in Number Rate Number Rate Crash Rate Rear-end % Angle % Left-turn % Right-turn % Side-swipe % Head-on * % Bicycle % Pedestrian Fixed Object Run-off Road Overturning Median Crossover Others % Total % *at least 3 out of the 4 crashes were incorrectly coded as head-on crashes in the police reports + Crashes are too few to come to reliable conclusions 22 Three-Year Before and After Analysis 20 Crashes/MVMT Before ( ) After ( ) Rear-end Angle Left-turn Right-turn Side-swipe Head-on Pedestrian Bicycle Fixed object Run-off road Overturning Median crossover Others Total Crash Type Figure 5. Three-Year Before-and-After Analysis of Crash Rates by Crash Type It is noted that the crash rates for bicycle crashes were too few to draw any conclusions (2 bicycle crashes in the before period and 2 in the after period). Similarly, pedestrian and fixedobject crashes were also too few to draw any reliable conclusions. 8
7 3.2 Analysis of Crash Severity Table 3 gives the three-year before ( ) and three-year after ( ) crash rates by severity level along with their percent changes in crash rates. The same crash rates are plotted in Figure 6. There were no fatal crashes during the analysis period. The results show that the PDO and injury crash rates were reduced by 62.1% and 29.3%, respectively, after the conversion to raised medians. Table 3. Percent Change in Crash Rates by Crash Severity (Three-Year Periods) Crash Type Before ( ) After ( ) % Change in Number Rate Number Rate Crash Rate PDO % Injury % Fatal Total % Crashes/MVMT Three-Year Before and After Analysis Before ( ) After ( ) 0 PDO Injury Fatal Total Crash Injury Severity Figure 6. Three-Year Before-and-After Analysis of Crash Rates by Severity 4. Five-Year Before-and-After Analysis 4.1 Analysis of Crash Types This section focuses on a five-year before-and-after crash analysis for different crash types. Analysis is based on the five-year before period ( ) and the five-year after period ( ). Table 4 gives the crash rates and crash numbers by crash types along with the percent change in crash rate. The highlighted crash types are those that show a reduction in crash rates in the after period. Error! Reference source not found. plots the five-year before and after crash rates by crash type. The results show that left-turn crashes experienced the highest reduction (86.3%), followed by right-turn (65.2%), angle (56.1%), rear-end (44.3%), bicycle (43.3%) and side-swipe (21.9%) crashes. Overall, a reduction of 52.0% in total crashes was observed in the five-year after period. 9
8 Table 4. Percent Change in Crash Rates by Crash Types (Five-Year Before-After Analysis) Crash Type Before ( ) After ( ) % Change in Number Rate Number Rate Crash Rate Rear-end % Angle % Left-turn % Right-turn % Side-swipe % Bicycle % Head-on * % Pedestrian Fixed Object Run-off Road Overturning Median Crossover Others % Total % *4 out of the 5 crashes were incorrectly coded as head-on crashes in the police reports + Crashes are too few to come to reliable conclusions 35 Five-Year Before and After Analysis Crashes/MVMT Before ( ) After ( ) 5 0 Rear-end Angle Left-turn Right-turn Side-swipe Head-on Pedestrian Bicycle Fixed object Run-off road Overturning Median crossover Others Total Crash Type Figure 7. Five-Year Before-and-After Analysis of Crash Rates by Crash Type As noted in Section 3.1, the increase in head-on crashes was a result of miscoded crash type. Again, similar to those based on three-year periods, pedestrian and fixed-object crashes remain too few to draw conclusions. However, one crash involving vehicle overturning and another involving median crossover are noted for the five-year after period. 10
9 4.2 Analysis of Crash Severity Table 5 gives the five-year before and five-year after crash rates and crash numbers by severity level, along with the percent changes in crash rates. Figure 8 plots the crash rates by crash severity. The results show a significant reduction in the crash rates for both PDO (61.4%, compared to 62.1% based on three years) and injury (41.3%, compared to 29.3% based on three years) crashes after the median conversion. There were no fatal crashes during the analysis period. Table 5. Percent Change in Crash Rates by Crash Severity (Five-Year Periods) Crash Type Before ( ) After ( ) % Change in Number Rate Number Rate Crash Rate PDO % Injury % Fatal Total % Crashes/MVMT Five-Year Before and After Analysis Before ( ) After ( ) PDO Injury Fatal Total Crash Injury Severity Figure 8. Five-Year Before-and-After Analysis of Crash Rates by Severity 5. Summary of Findings A safety evaluation along a mile roadway section on the Apalachee Parkway (roadway ID from mile post to mile post 3.367) was conducted. Along this section, a raised median was constructed in Before-and-after analyses based on both three-year and fiveyear periods were conducted. The findings of the analyses are summarized below: 11
10 1. The yearly crash rates had three visibly distinct trends. There is a significant drop in crash rates in the years 1990 and 2003 (after raised medians were constructed). The reason for the drop in crash rate in 1990 is unknown. The year 2003 corresponds to the year right after the median conversion. 2. A significant reduction in crash rates after the median conversion is observed. 3. Both the three-year and the five-year before-and-after analysis showed a reduction in crash rates of total, rear-end, left-turn, angle, right-turn, side-swipe, and bicycle crashes after the installation of raised medians. 4. The highest reduction in crash rates after the installation of raised medians is observed in left-turn crashes (above 80% reduction). 5. Using a three-year before-and-after analysis, an increase in head-on crash rates is observed after the construction of raised median. As this increase is counterintuitive, the police reports were examined and it was found that all but one of these crashes were incorrectly coded. The one that could possibly be considered as a head-on crash involved a right-turn vehicle that was not related to median design. 6. Some of the crash types were too few to come to reliable conclusions. These crash types include fixed object, run-off-the-road, overturning, and median crossover. 7. There is an overall decreasing trend for both PDO and injury crash rates. 8. Both the three-year and the five-year before-and-after analysis showed a reduction in crashes rates of PDO and injury crashes after the installation of raised medians. There were no fatal crashes during the analysis period. 9. After median installation, a reduction of about 50% in total crash rates is observed in both three-year and five-year before-and-after analyses. 12
11 Appendix A (of Appendix A of Progress Report #2) Police Reports of the Five Head-On Crashes in the After Period ( ) 13
 Crash Miscoded (?")
12 Crash Report Number in Year 2004: Right-Turn (?) Crash Miscoded (?) as Head-On 14
13 15
14 16
15 17
: Angle Crash Miscoded as Head-On")
16 Crash Report Number in Year 2004): Angle Crash Miscoded as Head-On 18
17 19
18 20
19 21

20 Crash Report Number in Year 2004: Rear-End Crash Miscoded as Head-On 22
21 23
22 24
23 25

24 Crash Report Number in Year 2004: Rear-End Crash Miscoded as Head-On 26
25 27
26 28
27 29

28 Crash Report Number in Year 2008: Rear-End Crash Miscoded as Head-On 30
29 31
30 32
31 33
32 Appendix B Draft Survey Questions on the Impact of Raised Median Installation on Businesses 34
Truck Climbing Lane Traffic Justification Report
 ROUTE 7 (HARRY BYRD HIGHWAY) WESTBOUND FROM WEST MARKET STREET TO ROUTE 9 (CHARLES TOWN PIKE) Truck Climbing Lane Traffic Justification Report Project No. 6007-053-133, P 101 Ι UPC No. 58599 Prepared by:
Characteristics of Traffic Accidents in Highway Work Zones
 Characteristics of Traffic Accidents in Highway Work Zones A DETAILED ANALYSIS OF WORK ZONE ACCIDENTS REPORTED ON NEW YORK STATE DEPARTMENT OF TRANSPORTATION CONSTRUCTION PROJECTS ESTABLISHED THE PREDOMINANT
Bicycle Crashes. Number of Bike Crashes. Total Bike Crashes. are down 21% and severe bike crashes down 8% since 2013 (5 years).
.") Bicycle Crashes The City of Fort Collins is well known for its bike culture, and there is a strong focus on encouraging increased riding. Bike safety is an important component of supporting these efforts.
Bicycle Crashes The City of Fort Collins is well known for its bike culture, and there is a strong focus on encouraging increased riding. Bike safety is an important component of supporting these efforts.
MN Green Step Cities December 7, Hannah Pritchard, PE PTOE
 MN Green Step Cities December 7, 2016 Hannah Pritchard, PE PTOE Hannah Pritchard PE PTOE @bicyclehannah hpritchard@tooledesign.com Choose your own adventure How we got here the history of traffic engineering
Phase I-II of the Minnesota Highway Safety Manual Calibration. 1. Scope of Calibration
 TECHNICAL MEMORANDUM Phase I-II of the Minnesota Highway Safety Manual Calibration PREPARED FOR: PREPARED BY: Minnesota Department of Transportation Richard Storm, CH2M HILL Veronica Richfield, CH2M HILL
Final Report. Contract No. BDK Before-and-After Safety Study of Roadways Where New Medians Have Been Added. Prepared by:
 Final Report Contract No. BDK80 977-18 Before-and-After Safety Study of Roadways Where New Medians Have Been Added Prepared by: Priyanka Alluri, Albert Gan, Kirolos Haleem, Stephanie Miranda, Erik Echezabal,
Colorado Department of Transportation Crash Data Program Alisa Babler, PE
 Colorado Department of Transportation Crash Data Program Alisa Babler, PE 2014 Colorado 115,388 Total Crashes 39,353 Injuries 488 Fatalities 489.85 100MVMT 88,258 Roadway Center Line Miles Media Question:
M-58 HIGHWAY ACCESS MANAGEMENT STUDY Mullen Road to Bel-Ray Boulevard. Prepared for CITY OF BELTON. May 2016
 M-58 HIGHWAY ACCESS MANAGEMENT STUDY Prepared for CITY OF BELTON By May 2016 Introduction Missouri State Highway 58 (M-58 Highway) is a major commercial corridor in the City of Belton. As development has
PRELIMINARY DRAFT FIRST AMENDMENT TO VISION 2050: A REGIONAL LAND USE AND TRANSPORTATION PLAN FOR SOUTHEASTERN WISCONSIN
 PRELIMINARY DRAFT FIRST AMENDMENT TO VISION 2050: A REGIONAL LAND USE AND TRANSPORTATION PLAN FOR SOUTHEASTERN WISCONSIN ESTABLISHING TARGETS FOR FEDERAL PERFORMANCE MEASURES: HIGHWAY SAFETY SOUTHEASTERN
Military Road Safety Improvements
 Military Road Safety Improvements 26 th Road North to 31 st Street North SUMMARY OF DATA REVIEW AND PRELIMINARY RECOMMENDATIONS Prepared for: Department of Environmental Services Traffic Engineering and
Iowa DOT FHWA Safety Targets
 Iowa DOT FHWA Safety Targets August 2018 In January 2018, the Iowa DOT began the process of reviewing data to set performance targets for the five safety performance measures required by FHWA in 23 CFR
Geometric Categories as Intersection Safety Evaluation Tools
 Geometric Categories as Intersection Safety Evaluation Tools John R. Campbell Ayres Associates N19 W24075 Riverwood Drive, Suite 300 Waukesha, WI 53188 campbellj@ayresassociates.com Keith K. Knapp Engineering
By Dan Burden, Executive Director Walkable and Livable Communities Institute
 By Dan Burden, Executive Director Walkable and Livable Communities Institute Is this the landscape we want to leave our children? LaJolla Boulevard, Birdrock, San Diego, CA 78 Feet Speeds above
TRAFFIC CRASH FACTS FOR CHAMPAIGN-URBANA SELECTED CRASH INTERSECTION LOCATIONS (SCIL)
") TRAFFIC CRASH FACTS FOR CHAMPAIGN-URBANA SELECTED CRASH INTERSECTION LOCATIONS (SCIL) 2007-2011 February 2014 Prepared by: Champaign Urbana Urbanized Area Transportation Study (CUUATS) TABLE OF CONTENTS
TRAFFIC CRASH FACTS FOR CHAMPAIGN-URBANA SELECTED CRASH INTERSECTION LOCATIONS (SCIL) 2007-2011 February 2014 Prepared by: Champaign Urbana Urbanized Area Transportation Study (CUUATS) TABLE OF CONTENTS
Road Diets: Reconfiguring Streets for Multi-Modal Travel
 Road Diets: Reconfiguring Streets for Multi-Modal Travel Tom Grant, P.E., PTOE What is a Road Diet? Reconfiguration of travel lanes to benefit all roadway users (i.e., Complete Street) Reclaiming the space
New Castle County Intersection Crash Analysis
 New Castle County Crashes February 216 WILMAPCO DATA REPORT #6 UPDATE New Castle County Intersection Crash Analysis 25-214 By examining statistics we catch a glimpse of recent crash trends. This report
DEPARTMENT OF ENVIRONMENTAL SERVICES. North Harrison Street (Lee Highway to Little Falls Road) Comparative Analysis. Prepared for:
 Comparative Analysis. Prepared for:") DEPARTMENT OF ENVIRONMENTAL SERVICES North Harrison Street (Lee Highway to Little Falls Road) Comparative Analysis Prepared for: Arlington County Department of Environmental Services 2100 Clarendon Boulevard,
DEPARTMENT OF ENVIRONMENTAL SERVICES North Harrison Street (Lee Highway to Little Falls Road) Comparative Analysis Prepared for: Arlington County Department of Environmental Services 2100 Clarendon Boulevard,
US 41 (Tamiami Trail) Corridor Study. Roadway Safety Audit
 Corridor Study. Roadway Safety Audit") US 41 (Tamiami Trail) Corridor Study Roadway Safety Audit US 41 RSA June 14/15, 2017 Agenda Project Overview Schedule RSA Process Overview RSA Responsibilities Historical Crash Review 2 PROJECT OVERVIEW
US 41 (Tamiami Trail) Corridor Study Roadway Safety Audit US 41 RSA June 14/15, 2017 Agenda Project Overview Schedule RSA Process Overview RSA Responsibilities Historical Crash Review 2 PROJECT OVERVIEW
RAISED MEDIAN EFFECTIVENESS
 RAISED MEDIAN EFFECTIVENESS William E. Frawley, AICP Texas A&M Transportation Institute Access Management Overview Set of Tools to Help Improve Safety and Protect Public Investments in Roadways Balances
Department of Transportation
 Department of Transportation I. Internal Scan The number of older drivers in the United States will double over the next 30 years. By 2030 one in five Americans will be age 65 or older. On a licensed-driver
APPENDIX D. MTO Warrants for Traffic Signal Control and Left-Turn Storage Lanes
 APPENDIX D MTO Warrants for Traffic Signal Control and Left-Turn Storage Lanes APPENDIX E Collision Data Collision Main Detail Summary OnTRAC Reporting System FROM: 2009/01/01 TO: 2012/01/01 BAYSWATER
Analyses and statistics on the frequency and the incidence of traffic accidents within Dolj County
 UNIVERSITY OF PITESTI SCIENTIFIC BULLETIN Faculty of Mechanics and Technology AUTOMOTIVE series, year XXIV, no. 28 Analyses and statistics on the frequency and the incidence of traffic accidents within
Evaluation of M-99 (Broad Street) Road Diet and Intersection Operational Investigation
 Road Diet and Intersection Operational Investigation") Evaluation of M-99 (Broad Street) Road Diet and Intersection Operational Investigation City of Hillsdale, Hillsdale County, Michigan June 16, 2016 Final Report Prepared for City of Hillsdale 97 North Broad
Evaluation of M-99 (Broad Street) Road Diet and Intersection Operational Investigation City of Hillsdale, Hillsdale County, Michigan June 16, 2016 Final Report Prepared for City of Hillsdale 97 North Broad
Notes to Benefit-Cost Analysis
 Executive Summary Project Matrix Current Status/ Problem to Be Addressed University Avenue not user friendly or safe for cars, pedestrians, bicyclists, or bus riders. Notes to Benefit-Cost Analysis Change
Designing for Pedestrian Safety
 Designing for Pedestrian Safety Road Diets Presented by: Peter Lagerwey Senior Planner, Toole Design Group November 3, 2010 Before After Learning Objectives At the end of this module, you will be able
Safety Impacts: Presentation Overview
 Safety Impacts: Presentation Overview The #1 Theme How Access Management Improves Safety Conflict Points The Science of Access Management By Treatment Studies Themes for Texas Access Management Improve
Appendix A Crash Analysis
 Appendix A Crash Analysis Traffic Crash Data Analysis (February 2014) Project Safety Analysis (January 2018) Federal Highway Administration Alaska Division P.O. Box 21648 Juneau, AK 99802 and Alaska Department
US 20: CHESTER TO MONTANA SAFETY CORRIDOR PLAN
 Idaho Transportation Department US 20: CHESTER TO MONTANA SAFETY CORRIDOR PLAN November 2016 Prepared for: Prepared by: Idaho Transportation Department, District 6 Kittelson & Associates, Inc. 206 N. Yellowstone
COLLISION STATISTICS May Engineering Services Box 5008, th Avenue Red Deer, AB T4N 3T4
 COLLISION STATISTICS 2016 2016 Red Deer Annual Motor Vehicle Collision Report May 2017 Engineering Services Box 5008, 4914 48th Avenue Red Deer, AB T4N 3T4 engineering@reddeer.ca RCMP GRC Red Deer City
Pedestrian and Bicycle Volume Counts Methods and Technologies for Pedestrian and Bicycle Volume Data Collection.
 I will be presenting today, along with Kelly Laustsen, on the topic of Pedestrian and Bicycle Volume Counts. I will first speak to the topic of: why pedestrian and bicycle volume counts. Why pedestrian
VDOT Crash Analysis Procedures for Roadway Safety Assessments
 Crash analysis is a critical component of road safety analysis. The crash analysis procedures defined in this document will help: Identify where to target resources for detailed crash analysis Assess the
LANE ELIMINATION PROJECTS
 PRESENTATION OUTLINE Lane Elimination Considerations Districts 4 & 7 Draft Lane Elimination Processes FDOT Lane Elimination Guidelines Example Projects D4 Case Study: SR A1A (Ft. Lauderdale) D7 Case Study:
Road Diets and Roundabouts
 Road Diets and Roundabouts Paul Zykofsky, AICP Local Government Commission Sacramento, CA Classic Road Diet 4 to 3 lanes San Antonio TX On-street parking Median Bike Lanes Center Turn-Lane Seattle WA Road
Project Development & Environment (PD&E) Study Public Hearing January 12 th, 2006
 Study Public Hearing January 12 th, 2006") Project Development & Environment (PD&E) Study Public Hearing January 12 th, 2006 Public Hearing Regulations Chapter 23 of United States Code 128 Title 40 of the Code of Federal Regulations Parts 1500
Project Development & Environment (PD&E) Study Public Hearing January 12 th, 2006 Public Hearing Regulations Chapter 23 of United States Code 128 Title 40 of the Code of Federal Regulations Parts 1500
Pinellas County Metropolitan Planning Organization (MPO) 2014 Crash Data Report
 2014 Crash Data Report") Pinellas County Metropolitan Planning Organization (MPO) 2014 Crash Data Report MPO Board July 8, 2015 2 Crash Data Collection Motorcycle drove between stopped cars, ran a red light and collided with a
Pinellas County Metropolitan Planning Organization (MPO) 2014 Crash Data Report MPO Board July 8, 2015 2 Crash Data Collection Motorcycle drove between stopped cars, ran a red light and collided with a
NMSU Red Light Camera Study Update
 NMSU Red Light Camera Study Update Assessment of Impact of City of Las Cruces Safe Traffic Operations Program on Intersection Traffic Safety Before-and-After Analysis of Crash Data Preliminary Report
Characteristics of Fatal Pedestrian Crashes on Freeways. Kay Fitzpatrick Texas A&M Transportation Institute
 Characteristics of Fatal Pedestrian Crashes on Freeways Kay Fitzpatrick Texas A&M Transportation Institute Transportation Short Course Design Session October 15, 2013 Project Background (0-6702) Motivation:
Effects of Traffic Signal Retiming on Safety. Peter J. Yauch, P.E., PTOE Program Manager, TSM&O Albeck Gerken, Inc.
 Effects of Traffic Signal Retiming on Safety Peter J. Yauch, P.E., PTOE Program Manager, TSM&O Albeck Gerken, Inc. Introduction It has long been recognized that traffic signal timing can have an impact
Performance-Based Planning for Safety in a Vision Zero World. AMPO September 27, 2018
 Performance-Based Planning for Safety in a Vision Zero World AMPO September 27, 2018 AAMPO study area today Kendall Comal 2 million residents 10,000 lane miles Bexar Guadalupe 50 million miles traveled
Engineering Countermeasures for Transportation Safety. Adam Larsen Safety Engineer Federal Highway Administration
 Engineering Countermeasures for Transportation Safety Adam Larsen Safety Engineer Federal Highway Administration 360-619-7751 Adam.Larsen@DOT.GOV Countermeasure Selection Resources Manual for Selecting
Topic No January 2000 Manual on Uniform Traffic Studies Revised July Chapter 8 GAP STUDY
 Chapter 8 8.1 PURPOSE GAP STUDY (1) The Gap Study is used to determine the size and the number of gaps in the vehicular traffic stream for unsignalized intersections and access points, pedestrian studies,
Crash Patterns in Western Australia. Kidd B., Main Roads Western Australia Willett P., Traffic Research Services
 Crash Patterns in Western Australia Kidd B., Main Roads Western Australia Willett P., Traffic Research Services Abstract Examination of crash patterns is one way of identifying key factors on which focus
Welcome! Urban Work Zone Design. Training Course 0-1
 Welcome! Urban Work Zone Design Training Course 0-1 Instructor Instructor s Name Here 0-2 About This Course This material is based upon work supported by the Federal Highway Administration (FHWA) under
Kentucky s Surface Transportation System
 Kentucky s Surface Transportation System ROAD AND BRIDGE CONDITIONS, TRAFFIC SAFETY, TRAVEL TRENDS, AND NEEDS MARCH 2018 PREPARED BY WWW.TRIPNET.ORG Founded in 1971, TRIP of Washington, DC, is a nonprofit
After. Before ROAD DIETS MODULE of 9 Safety Proven Countermeasures.
 Before After ROAD DIETS MODULE 10 1 of 9 Safety Proven Countermeasures http://safety.fhwa.dot.gov/provencountermeasures/fhwa_sa_12_013.htm Learning Objectives At the end of this module, you will be able
How Much Do You Lose When Your Road Goes on a Diet?
 Huang, Stewart, Zegeer, and Tan Esse 1 How Much Do You Lose When Your Road Goes on a Diet? *Herman F. Huang, *J. Richard Stewart, *Charles V. Zegeer, and **Carol H. Tan Esse herman_huang@unc.edu jstewart@claire.hsrc.unc.edu
Safety Impacts of Converting Two-Way Left-Turn Lanes to Raised Medians and Associated Design Concerns
 JTRF Volume 55 No. 2, Summer 2016 Safety Impacts of Converting Two-Way Left-Turn Lanes to Raised Medians and Associated Design Concerns by Priyanka Alluri, Albert Gan, and Kirolos Haleem Raised medians
J Street and Folsom Boulevard Lane Conversion Project (T ) Before and After Traffic Evaluation
 Before and After Traffic Evaluation") J Street and Folsom Boulevard Lane Conversion Project (T15125400) Before and After Traffic Evaluation Prepared by Transportation Division June 2014 Executive Summary On February 12, 2013, the City of Sacramento
J Street and Folsom Boulevard Lane Conversion Project (T15125400) Before and After Traffic Evaluation Prepared by Transportation Division June 2014 Executive Summary On February 12, 2013, the City of Sacramento
Benefits of Center Line Rumble Strips on Rural 2-Lane Highways in Louisiana
 Benefits of Center Line Rumble Strips on Rural 2-Lane Highways in Louisiana Xiaoduan Sun, Ph.D., P.E. University of Louisiana at Lafayette 2018 Louisiana Transportation Conference Baton Rouge, February
Desktop Reference for Crash Reduction Factors
 Page 68 Desktop Reference for Crash Reduction Factors Report No. FHWA-SA-07-015 U.S. Department of Transportation Federal Highway Administration September 2007 Page 69 THIS PAGE LEFT INTENTIONALLY BLANK
Study Area and Location District PSA Ward ANC Phase Description B Existing 2500 Block Naylor Road Southeast Northbound
 Speed Limit and Safety Nexus Studies for Automated Enforcement Locations in the District of Columbia 25 Block Naylor Road SE Study Area and Location District PSA Ward ANC Phase Description 7 71 7 7B Existing
Road design and Safety philosophy, 1 st Draft
 Head Office SWEDEN www.vv.se Textphone: +46 243-750 90 Roger Johansson International Secretariat roger.johansson@vv.se Direct: +46 243 75880 Mobile: +46 70 6327373 Date: 2006-08-17 Reference: Road design
Executive Summary June 2015
 Executive Summary June 2015 Highway 112 Corridor Study Benton and Washington Counties Executive Summary June 2015 Prepared by Transportation Planning and Policy Division Arkansas State Highway and Transportation
444 North Capitol Street NW, Suite 249, Washington, DC (202) Fax: (202) ERRATA
 Fax: (202) ERRATA") Larry L. Butch Brown, Sr., President Executive Director, Mississippi Department of Transportation John Horsley, Executive Director 444 North Capitol Street NW, Suite 249, Washington, DC 20001 (202) 624-5800
Larry L. Butch Brown, Sr., President Executive Director, Mississippi Department of Transportation John Horsley, Executive Director 444 North Capitol Street NW, Suite 249, Washington, DC 20001 (202) 624-5800
KANSAS STRATEGIC HIGHWAY SAFETY PLAN
 KANSAS STRATEGIC HIGHWAY SAFETY PLAN 214 Annual Dashboard Report Preliminary Statewide Fatality Analysis The accident data herein, as of February 19, 215, reflect the reporting officer s observations and
Chapter 5 DATA COLLECTION FOR TRANSPORTATION SAFETY STUDIES
 Chapter 5 DATA COLLECTION FOR TRANSPORTATION SAFETY STUDIES 5.1 PURPOSE (1) The purpose of the Traffic Safety Studies chapter is to provide guidance on the data collection requirements for conducting a
2013 Traffic Safety Report
 Traffic Safety Report Introduction Every year on the more than 1, miles of unincorporated Larimer County roadways, about 375 vehicular traffic crashes occur. Those crashes include about 75 severe crashes
HSM Tables, Case Studies, and Sample Problems Table of Contents
 HSM Tables, Case Studies, and Sample Problems Table of Contents Chapter 10 Tables: HSM Default Tables Local Values (Michigan)... 1 Chapter 11 Tables: HSM Default Tables Local Values (Michigan)... 5 Chapter
METHODOLOGY. Signalized Intersection Average Control Delay (sec/veh)
") Chapter 5 Traffic Analysis 5.1 SUMMARY US /West 6 th Street assumes a unique role in the Lawrence Douglas County transportation system. This principal arterial street currently conveys commuter traffic
Chapter 5 Traffic Analysis 5.1 SUMMARY US /West 6 th Street assumes a unique role in the Lawrence Douglas County transportation system. This principal arterial street currently conveys commuter traffic
What Engineering Can Do for You! Low Cost Countermeasures for Transportation Safety
 What Engineering Can Do for You! Low Cost Countermeasures for Transportation Safety Adam Larsen Safety Engineer Federal Highway Administration 360-619-7751 Adam.Larsen@DOT.GOV Adam Larsen TTP Safety Engineer
Safety and Design Alternatives for Two-Way Stop-Controlled Expressway Intersections
 Safety and Design Alternatives for Two-Way Stop-Controlled Expressway Intersections Thomas H. Maze Center for Transportation Research and Education Iowa State University 2901 South Loop Drive, Suite 3100
CHAPTER 9: SAFETY 9.1 TRAFFIC SAFETY INTERSECTION COLLISIONS
 CHAPTER 9: SAFETY 9.1 TRAFFIC SAFETY Creating a transportation network that is not only efficient but also safe is a key objective of the General Plan and the WBCMP. To assess the current safety conditions
A Review of Roundabout Safety Performance in the United States
 A Review of Roundabout Safety Performance in the United States 1.0 Introduction Aimee Flannery, Ph.D. Lily Elefteriadou, Ph.D. Roundabouts are a new form of at-grade intersection design that have been
Transportation and Public Works Annual Motor Vehicle Collision Report
 Transportation and Public Works 22 Annual Motor Vehicle Collision Report Table of Contents Table of Contents.. 2 Introduction.. 3 22 Collision Summary. 4 Demographics 5 Collisions by Severity.. 5 Personal
Speed Management Action Plan
 Speed Management Action Plan National Selection Criteria Criteria Description Fatalities The number of fatalities resulting from speeding-related crashes. Percentage Compares total fatalities in each State
KIETZKE LANE SAFETY MANAGEMENT PLAN FINAL REPORT August, 2013 Submitted By: Parsons. Submitted to:
 KIETZKE LANE SAFETY MANAGEMENT PLAN FINAL REPORT August, 2013 Submitted By: Parsons Submitted to: KIETZKE LANE SAFETY MANAGEMENT PLAN EXECUTIVE SUMMARY The Nevada Department of Transportation (NDOT) has
2016 Annual Report. Work Zone Traffic Control. Bureau of Maintenance and Operations Highway Safety and Traffic Operations Division
 2016 Annual Report Work Zone Traffic Control Bureau of Maintenance and Operations Highway Safety and Traffic Operations Division Table of Contents Introduction... 3 Executive Summary... 4 Work Zone QA
Analysis of Run-Off-Road Crashes in Relation to Roadway Features and Driver Behavior
 Analysis of Run-Off-Road Crashes in Relation to Roadway Features and Driver Behavior Ertan Örnek University of Wisconsin, Madison Traffic Operations Lab 141 NW Barstow Street Waukesha, WI 53187 ornek@wisc.edu
Traffic Accident Data Processing
 Traffic Accident Data Processing D o n a l d F. P e t t y Engineer of Traffic Research and Surveys Indiana State Highway Commission The following is a portion of the Highway Safety Program Standards developed
National Performance Management Measures. April 20, 2016 Webinar
 Safety Performance Measures September 26, 2016 National Performance Management Measures April 20, 2016 Webinar Highway Safety Improvement Program Performance Measures 1 2 3 4 5 Number of fatalities Rate
and Rural Multimodal Networks 2017 ALTA PLANNING + DESIGN
 Small Town and Rural Multimodal Networks 2017 ALTA PLANNING + DESIGN SMALL TOWN AND RURAL MULTIMODAL NETWORKS GUIDE Why a Rural and Small Town Focused Guide? ONE SIZE DOES NOT FIT ALL. The new FHWA-endorsed
Safety Evaluation at Innovative Geometric Designs Gilbert Chlewicki, PE Advanced Transportation Solutions
 2016 ITE Mid-Colonial District Annual Conference Wilmington, Delaware Safety Evaluation at Innovative Geometric Designs Gilbert Chlewicki, PE Advanced Transportation Solutions April 18, 2016 WHY INNOVATIVE
Safety Effectiveness of Pedestrian Crossing Treatments
 Portland State University PDXScholar TREC Friday Seminar Series Transportation Research and Education Center (TREC) 10-13-2017 Safety Effectiveness of Pedestrian Crossing Treatments Christopher Monsere
EXISTING (2006) CONDITIONS
 CONDITIONS") Section 2 EXISTING (2006) CONDITIONS This section provides a description of the existing transportation system in the study area and a comprehensive analysis of existing traffic operations and crash history.
Section 2 EXISTING (2006) CONDITIONS This section provides a description of the existing transportation system in the study area and a comprehensive analysis of existing traffic operations and crash history.
Chapter 4 Traffic Analysis
 Chapter 4 Traffic Analysis PURPOSE The traffic analysis component of the K-68 Corridor Management Plan incorporates information on the existing transportation network, such as traffic volumes and intersection
Road Conversion Study Plumas Street
 Plumas Street Phase I Submitted to The Regional Transportation Commission of Washoe County Submitted by Zong Tian, Ph.D., P.E. Saeedeh Farivar Haiyuan Li, Ph.D. Center for Advanced Transportation Education
ROAD TRAFFIC INJURY DATA SYSTEMS IN GHANA: The key to safety improvement and control
 ROAD TRAFFIC INJURY DATA SYSTEMS IN GHANA: The key to safety improvement and control A paper presented at the African Road Safety Conference held at the Kwame Nkrumah Conference Centre, Accra, Ghana from
Space Coast Transportation Planning Organization. Agenda
 2014 Countywide Safety Report Space Coast Transportation Planning Organization 1 Agenda Goals and Objectives Project Methodology Crash Data and Trends Intersection Analysis Corridor Analysis Strategic
Moving Towards Zero Deaths on Region 2 Local Roads
 Moving Towards Zero Deaths on Region 2 Local Roads 2017 Regional Transportation Safety Plan August 2017 www.opusinternational.com Regional Transportation Safety Plan Prepared By Joyce Yassin, P.E., PTOE
Safety Emphasis Areas & Safety Project Development Florida Department of Transportation District Seven Tampa Bay
 Safety Emphasis Areas & Safety Project Development Florida Department of Transportation District Seven Tampa Bay Stephen L. Benson, AICP, CNU-A FDOT District Seven Safety Office Presentation Overview Safety
New York City School Safety Engineering Program. Jackson Wandres The RBA Group June 09, 2005
 8,008,271 858,661 New York City School Safety Engineering Program Jackson Wandres The RBA Group June 09, 2005 Office of School Safety Engineering Project Goals 1) Improve traffic and pedestrian safety.
Chapter 8 Chapter 8 VEHICLE GAP STUDY PURPOSE VEHICLE GAP STUDY (FIGURE 8-1)
") Chapter 8 Chapter 8 Formatted: Heading 1 VEHICLE GAP STUDY 5.48.18.1 PURPOSE (1) The Vehicle Gap Study (Form No. 750-020-08) is used to determine the size and the number of gaps in the vehicular traffic
Chapter 8 Chapter 8 Formatted: Heading 1 VEHICLE GAP STUDY 5.48.18.1 PURPOSE (1) The Vehicle Gap Study (Form No. 750-020-08) is used to determine the size and the number of gaps in the vehicular traffic
FINAL DESIGN TRAFFIC TECHNICAL MEMORANDUM
 FINAL DESIGN TRAFFIC TECHNICAL MEMORANDUM July 2014 FINAL (SR 43) Project Development and Environment Study From State Road 60 (Adamo Drive) to I-4 (SR 400) Hillsborough County, Florida Work Program Item
TRAFFIC IMPACT ANALYSIS
 TRAFFIC IMPACT ANALYSIS FOR THE CHAMPAIGN UNIT#4 SCHOOL DISTRICT PROPOSED HIGH SCHOOL (SPALDING PARK SITE) IN THE CITY OF CHAMPAIGN Final Report Champaign Urbana Urbanized Area Transportation Study 6/24/2014
2012 TOWN OF CASTLE ROCK MOTOR VEHICLE ACCIDENT FACTS PREPARED BY THE PUBLIC WORKS DEPARTMENT
 ATTACHMENT A 2012 TOWN OF CASTLE ROCK MOTOR VEHICLE ACCIDENT FACTS PREPARED BY THE PUBLIC WORKS DEPARTMENT ACKNOWLEDGEMENTS This report was assembled from data provided by the Castle Rock Police Department
Cambridgeshire and Peterborough Road Safety Partnership Handbook
 and Peterborough Road Safety Partnership Handbook ANNUAL STATISTICS SUMMARY 2015 3941 CCC_Road Safety HBook.indd 1 19/08/2016 14:59 Contents Introduction 2 Key points 3 Summary table 4 Overall trends 4
Glenn Avenue Corridor Traffic Operational Evaluation
 Glenn Avenue Corridor Traffic Operational Evaluation PREPARED FOR: THE CITY OF AUBURN PREPARED BY: DECEMBER 2007 Glenn Avenue Corridor Study--Auburn, Alabama TABLE OF CONTENTS Introduction... 1 Background
BENNING ROAD & BRIDGES TRANSPORTATION IMPROVEMENTS CRASH DATA AND SAFETY ANALYSIS TECHNICAL MEMORANDUM DRAFT MAY 2016
 BENNING ROAD & BRIDGES TRANSPORTATION IMPROVEMENTS CRASH DATA AND SAFETY ANALYSIS TECHNICAL MEMORANDUM DRAFT MAY 2016 This page left intentionally blank. Table of Contents 1.0 Introduction... 1 1.1 Crash
Roundabouts. By: Nezamuddin, Valparaiso University. February 19, 2015
 Roundabouts By: Nezamuddin, Valparaiso University February 19, 2015 Outline 1. Background on Roundabouts 2. Silhavy Rd. Corridor Improvement Project in Valparaiso, IN 3. 5-points Roundabout in Valparaiso,
Introduction to Highway Safety Course
 Introduction to Highway Safety Course Introduction to Crash Analysis Prepared by Robert K. Seyfried, PE, PTOE Northwestern University Center for Public Safety Introduction to Highway Safety Series Course
Memorandum. TO: Town of Lysander Comprehensive Plan Update Committee
 Memorandum TO: Town of Lysander Comprehensive Plan Update Committee FROM: Meghan Vitale, SMTC DATE: January 7, 2015 RE: Accident data analysis () ~~~~~~~~~~~~~~~~~~~~~~~~~~~~~~~~~~~~~~~~~~~~~~~~~~~~~~~~~~~~~~~~~~
WELCOME Public Information Centre
 WELCOME Public Information Centre Fernforest Drive Brampton Soccer Centre Community Room #2 Tuesday January 19, 2016 6:30 p.m.to 9:00 p.m. Please sign in Neighbourhood Traffic Calming Guide Background
Study on fatal accidents in Toyota city aimed at zero traffic fatality
 Study on fatal accidents in Toyota city aimed at zero traffic fatality Toru Kiuchi, Yoshihisa Kanno, Makoto Shiota Toyota Motor Corporation, 1 Toyota-cho, Toyota-shi, Aichi 471-8571, Japan Abstract - Since
Safety Assessment of Installing Traffic Signals at High-Speed Expressway Intersections
 Safety Assessment of Installing Traffic Signals at High-Speed Expressway Intersections Todd Knox Center for Transportation Research and Education Iowa State University 2901 South Loop Drive, Suite 3100
Public Opinion, Traffic Performance, the Environment, and Safety After Construction of Double-Lane Roundabouts
 Public Opinion, Traffic Performance, the Environment, and Safety After Construction of Double-Lane Roundabouts TRB 93 rd Annual Meeting Washington, D.C. January 15, 2014 Wen Hu, Ph.D. Intersection crashes
Proposed Action, Purpose and Need Technical Memorandum
 Proposed Action, Purpose and Need Technical Memorandum MoPac (State Loop 1) Intersections, Austin District From North of Slaughter Lane to South of La Crosse Avenue CSJ: 3136-01-015 Travis County, Texas
SNCC Demographic Trends
 Employment Population SNCC Demographic Trends In 1970 the SNCC population was 10,040, accounting for roughly 3% of the County population In 2015, SNCC grew to 60,567 people, roughly 11% of the County population
National Network Safety Analysis (6/4/2015 Revision) FRA and FRA PID 86661
 FRA and FRA PID 86661") Existing Roadway National Network Safety Analysis (6/4/2015 Revision) FRA-23-10.83 and FRA-23-12.24 PID 86661 This 8.82 miles project is on United States Route 23 (US-23) and United States Route 23 Directional
Existing Roadway National Network Safety Analysis (6/4/2015 Revision) FRA-23-10.83 and FRA-23-12.24 PID 86661 This 8.82 miles project is on United States Route 23 (US-23) and United States Route 23 Directional
WELCOME. FM 2818 (Harvey Mitchell Parkway) Open House. Tuesday, Nov. 14, 2017
 Open House. Tuesday, Nov. 14, 2017") WELCOME FM 2818 (Harvey Mitchell Parkway) Open House Tuesday, Nov. 14, 2017 Why am I here? Review the planned improvements Provide comments on the proposed project The environmental review, consultation,
WELCOME FM 2818 (Harvey Mitchell Parkway) Open House Tuesday, Nov. 14, 2017 Why am I here? Review the planned improvements Provide comments on the proposed project The environmental review, consultation,
Cyclist Safety in Australia
 Cyclist Safety in Australia From BITRE Trauma Statistical Summary, August 218 http://www.bitre.gov.au/publications/ongoing/road_deaths_australia_annual_summaries.aspx Trends in cyclist trauma numbers These