REGIONAL MULTIMODAL TRANSIT ACCESS
|
|
|
- Polly Bond
- 5 years ago
- Views:
Transcription


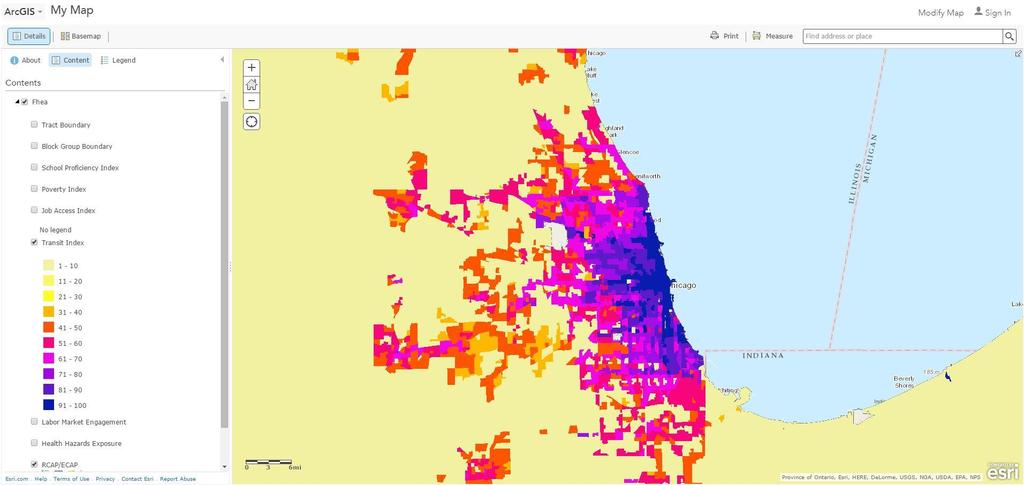
1 REGIONAL MULTIMODAL TRANSIT ACCESS GIS in Transit Conference September 3, 2015 Will Gillespie Principal Analyst, Strategic Planning
2 THE RTA Regional financial & budgetary oversight, funding, and transit planning 3 operating agencies CTA (City of Chicago rapid transit, bus) Metra (commuter rail) Pace (suburban bus & ADA paratransit) 630 million trips annually 8.4 million residents 3,700 square miles in 6 counties 2
3 MOBILITY? OR ACCESSIBILITY? Mobility is how far you can go in a given time Jarret Walker, Human Transit Accessibility is the ease of reaching valued destinations Owen & Levinson, Access Across America 3

4
5

6

7
8 SO, WHY MAKE ANOTHER? Because this level of analysis is POWERFULL at the agency level Project performance measurement With this rail extension, daily ridership is expected to be 2,000 people, eliminating 100,000 daily vehicle miles on local highways, and providing every rider access to an additional 50,000 jobs within 60 minutes by transit Service adjustment analysis Eliminating this critical bus route would make it take 50% longer for local residents dependent on transit to reach the same number of jobs Access to places analysis On average, area residents are within 30 minutes by transit of a grocery store, but in these low-income areas it can take up to an hour to access fresh food Multi-modal network performance When including walk to transit access alongside driving to park-n-ride access, an average of 1.3 million jobs are within a 90 minute commute of every resident in the region 8
9 ACCESS MEASUREMENT IS A TOOL ALL PLANNERS SHOULD HAVE And, such a tool should give us the ability to: 1. Choose case-specific origins and destinations 2. Adjust the network & service 3. Analyze multi-modal access 4. Report relevant statistics and measures 5. Create engaging and persuasive visuals 9


10 Access Across America ½-mile radius
11 MULTIMODAL ACCESS IS IMPORTANT About 135,000 people make a round-trip on Metra (commuter rail) every day Other Bike Bus & Other Transit To get to their origin station: 2,000 bike (or other) 5,000 ride a bus Walk 39,000 walk 89,000 drive* Drive 11 *Includes driving alone, carpool, drop-off, and taxi

")
 Origins &")
")
12 Resources 1) Scheduled Transit Service (GTFS) 2) Street Map 3) Origins & Destinations (shapes/data) 4) Analysis Tool 12

13 ADD GTFS TO A NETWORK DATASET 1. Adds a point for every stop in the system from GTFS stops.txt 2. Connects points based on trip patterns in GTFS stop_times.txt 3. Attaches stops to street network 4. Organizes stop arrival/departure times by route and trip for network analyst to incorporate 13
 subzones Subzones = ½ mile squares.")
14 CHICAGO ANALYSIS GEOGRAPHY Chicago Origins and Destinations Census Blocks Best scale for measuring walk-level travel 105,000 = 11 billion O-D combinations Chicago Metropolitan Agency for Planning (CMAP) subzones Subzones = ½ mile squares. Reasonable scale for assessing walk-level travel 16,500 = 272 million O-D combinations CMAP subzones within transit walk distance: 5,000 = 25 million O-D combinations 14
 Destinations to find (1-all) Can t (easily) constrain: Require transit trip Ratio of transit/walk/drive trip time Number of transfers")
15 NETWORK ANALYST OD-COST MATRIX Finds lowest cost (min) route between O & D Can constrain: Travel route by segment attribute Cutoff value (90 min) Destinations to find (1-all) Can t (easily) constrain: Require transit trip Ratio of transit/walk/drive trip time Number of transfers 15
16 RUNNING THE ANALYSIS In ArcMap, about 1 hour 5,000 O s and 5,000 D s Finding all destinations with 90 minute cutoff Not bad! But What about a 3-hour rush period? A little over a week ugh But wait! With a little Python programming you can reduce this by a factor of the # of cores 8 virtual cores and we re down to 1 day 16
 TravelTime: Trip total (seconds) up to 4.5 billion rows! 17")
17 SOLVE RESULTS RUN #1 WALK-TO-TRANSIT ACCESS Origin: Subzone ID Destin: Subzone ID OD_Pair: Origin SZ Destin SZ TimeOfDay: Departure time (seconds after 00:00:00) TravelTime: Trip total (seconds) up to 4.5 billion rows! 17


18 POST-PROCESSING IN SQL Average over the AM Rush Destination Jobs Jobs from Origin, in 10 minutes or less 20 minutes 30 minutes 18
")
19 WALK + TRANSIT AM RUSH (6-9A) WALK + TRANSIT MIDDAY (11A-2P) 19
20 TIME OF DAY JOB ACCESS 74% of the region s population is within walking distance of transit 31% of the geographic area is within walking distance of transit On average, 960,000 jobs (26% of all jobs), are accessible within 90 minutes by walking+transit in the Midday During the AM Rush, this rises to 1.15 million jobs (30% of all jobs), due to greater peak service levels 20
21 ADAPTING THE TOOL FOR DRIVE-TO ACCESS Calculate drive times to transit Set some assumptions/rules: 1. Not driving to local bus stops 2. Not driving to just any rail station Land/parking/traffic constraints Use officially designated PNR/KNRs 3. Only drive to nearest PNR (or 2 nd nearest on different line/service) 4. Driving gets an additional penalty (time) 5. Destination side remains a walk-connection 21
22 RUNNING THE ANALYSIS A SECOND.AND THIRD TIME Run #1 Walk-Access: 5,000 subzones to 5,000 subzones Drive to PNR Access: Run #2: Driving from 16,500 subzones to 1 PNR on every line/service Run #3: Transit/Walk from 222 PNRs to 5,000 subzones Join run 2 & 3 by PNR and sum travel time That s up to 200 trillion combinations over the rush period! 22
 TravelTime: Trip total")
23 SOLVE RESULTS RUN #2 ORIGIN TO PNR Origin: Subzone ID Destin: PNR ID OD_Pair: Origin SZ Destin PNR TimeOfDay: Departure time (seconds after 00:00:00) TravelTime: Trip total (seconds) 23
 TravelTime: Trip total")
24 SOLVE RESULTS RUN #3 PNR TO DESTINATION Origin: PNR ID Destin: Subzone ID OD_Pair: Origin PNR Destin Subzone TimeOfDay: Departure time (seconds after 00:00:00) TravelTime: Trip total (seconds) 24

 Walk+transit 2)")
25 POST-PROCESSING IN SQL PNR access point +5 min. drive buffer Duplicates = 1) Walk+transit 2) PNR+transit 25


26 WALK + TRANSIT W + T + PARK-N-RIDE AM Rush (6a-9a)
 30 MIN 60 MIN 90 MIN")
27 W + T + PARK-N-RIDE WALK + TRANSIT AM Rush (6a-9a) 30 MIN 60 MIN 90 MIN 27

28 MAP OF RED LINE PROJECT PERFORMANCE MEASUREMENT This tool gives us the ability to add GTFS scheduled service for projects that don t yet exist and test the regional and local impact of a project on accessibility 28

29 WITH RED LINE WITHOUT RED LINE

30 Red Line Walk Access RED LINE INCREMENTAL JOB ACCESS Within 50 minutes, the Red Line connects, on average: Every resident in region to to 17,640 additional jobs Every resident in walk distance to transit to 23,516 additional jobs Every resident in walk distance to Red Line 30 to 107,726 additional jobs

31 POPULATION, ACCESS, DENSITY 10,000 residents per sq. mile 31
32 WHAT S NEXT? 32
Arnold Hinojosa
 Policy Analysis of the Mass Transit Challenges Facing Rapidly Growing Southern and Western Cities and How These Challenges Can Be Addressed Using the Model Set by Chicago Arnold Hinojosa ahinojosa@kentlaw.edu
Introduction to Sugar Access. Sugar Access - Measuring Accessibility (Robert Kohler, Citilabs) Slide 1 of 21
 Slide 1 of 21") Introduction to Sugar Access Sugar Access - Measuring Accessibility (Robert Kohler, Citilabs) Slide 1 of 21 Walkability, Livability, Accessibility http://www.citilabs.com/sugaraccess Sugar Access - Measuring
Introduction to Sugar Access Sugar Access - Measuring Accessibility (Robert Kohler, Citilabs) Slide 1 of 21 Walkability, Livability, Accessibility http://www.citilabs.com/sugaraccess Sugar Access - Measuring
Riding More. Frequently:
 Riding More Frequently: Disaggregate Rid dership Elasticity Estimation for Chicago s Bus Network Charlott te Frei Hani S. Mahmassani Northwestern t University it Transportation ti Center Transport Chicago
Typical Rush Hour Commute. PennyforTransportation.com
 Typical Rush Hour Commute In the News Overview of the Plan Collaborative plan with projects in every community Prioritizing connectivity and congestion relief Dedicated transportation-specific funding;
Welcome. Wilmington Transit Moving Forward Workshop Presentation. October 16, 2013
 Welcome Wilmington Transit Moving Forward Workshop Presentation October 16, 2013 Project Purpose Evaluate recommendations from previous studies Wilmington Downtown Circulation Study (WDCS) 2012 State Smart
Midtown Corridor Alternatives Analysis
 Midtown Corridor Alternatives Analysis Ridership Forecast Methodology and Results December 2013 Prepared by the SRF Consulting Group Team for Table of Contents Introduction... 1 Methodology... 1 Assumptions...
Appendix A-1: Purpose and Need Statement
 Appendix A-1: Purpose and Need Statement PURPOSE AND NEED STATEMENT Western & Ashland Corridors Bus Rapid Transit (BRT) Project Prepared for Chicago Transit Authority 567 West Lake Street Chicago, IL 60661
Beyond First First Last Last Mile Strategies. APA National Conference April 3, 2016 Chelsea Richer, AICP Fehr & Peers
 Beyond First First Last Last Mile Strategies APA National Conference April 3, 2016 Chelsea Richer, AICP Fehr & Peers 1 Beyond First Last Mile Strategies APA National Conference Jeremy Klop, AICP, Fehr
I-105 Corridor Sustainability Study (CSS)
") I-105 Corridor Sustainability Study (CSS) Metro Streets and Freeways Subcommittee March 21, 2019 Gary Hamrick Cambridge Systematics, Inc. I-105 CSS Project History & Background Funded by Caltrans Sustainable
I-105 Corridor Sustainability Study (CSS) Metro Streets and Freeways Subcommittee March 21, 2019 Gary Hamrick Cambridge Systematics, Inc. I-105 CSS Project History & Background Funded by Caltrans Sustainable
Corridor Advisory Group and Task Force Meeting #10. July 27, 2011
 Corridor Advisory Group and Task Force Meeting #10 July 27, 2011 1 Agenda Recap CAG/TF #9 Public Meeting #2 Summary Single Mode Alternatives Evaluation Results Next Steps 2 3 CAG/TF #9 Recap CAG /TF #9
TRANSIT RIDERSHIP IMPROVEMENT PROGRAM CAPITAL PROJECTS OPERATING PLANS - NEXT NETWORK TRANSIT INFORMATION TECHNOLOGY
 TRANSIT RIDERSHIP IMPROVEMENT PROGRAM CAPITAL PROJECTS OPERATING PLANS - NEXT NETWORK TRANSIT INFORMATION TECHNOLOGY VTA S NEXT NETWORK CONNECT TO BART STATIONS INCREASE RIDERSHIP IMPROVE FAREBOX RECOVERY
North Coast Corridor:
 North Coast Corridor: Connecting People, Transportation & Environment Legislative Hearing: 11.8.10 1 North Coast Corridor Region s Lifeline A Regional Strategy Mobility, Economy & Environment North Coast
REGIONAL HOUSEHOLD TRAVEL SURVEY:
 Defining the Vision. Shaping the Future. REGIONAL HOUSEHOLD TRAVEL SURVEY: Profile Why we travel How we travel Who we are and how often we travel When we travel Where we travel How far and how long we travel
TRANSPORTATION & ACCESS
 STATE OF CENTER CITY PHILADELPHIA TRANSPORTATION & ACCESS Matt Stanley Center City is well-positioned at the center of an extensive, multi-modal transportation system. It is located just seven miles from
Strategic Plan for Active Mobility Phase I: Bicycle Mobility
 Strategic Plan for Active Mobility Phase I: Bicycle Mobility City of Corpus Christi February 9, 2016 Jeff Pollack, AICP Transportation Planning Director Vision Active Mobility Plan Vision The metropolitan
Rail Station Fact Sheet University of Dallas Station
 Rail Station Fact Sheet University of Dallas Station Station Overview University of Dallas Station is located on John Carpenter Freeway and west of Loop 12 across from the University of Dallas in Irving.
Transit Ridership - Why the Decline and How to Increase. Hosted by the. Virginia Transit Association
 Transit Ridership - Why the Decline and How to Increase Hosted by the Virginia Transit Association Virginia Transit Association 1108 East Main Street, Suite 1108 Richmond, VA 23219 804.643.1166 www.vatransit.com
Webinar- Importance of Multi- Modal Transit Connections and Fare Policy for Regional Transit Mobility & Equity
 Webinar- Importance of Multi- Modal Transit Connections and Fare Policy for Regional Transit Mobility & Equity Thomas Marchwinski Metro North RR (Previously with NJ Transit) Importance of Multi-Modal Transit
Corridor Advisory Group Meeting #1 June 7, 2018
 Corridor Advisory Group Meeting #1 June 7, 2018 Agenda Introductions Project Overview CAG Role and Goals for Today Existing Conditions Review Discussion and Next Steps CTA bus at Halsted and 87 th Streets
SANTA CLARA COUNTYWIDE BICYCLE PLAN August 2008
 SANTA CLARA COUNTYWIDE BICYCLE PLAN August 2008 To assist VTA and Member Agencies in the planning, development and programming of bicycle improvements in Santa Clara County. Vision Statement To establish,
About the Active Transportation Alliance
 About the Active Transportation Alliance Chicagoland s voice for better biking, walking and transit Founded 1985 7,000 members, ~33 full time staff Serve Chicago metro region 1 More Cars, More Driving
Rail Station Fact Sheet Downtown Carrollton Station
 Rail Station Fact Sheet Downtown Carrollton Station Station Overview Downtown Carrollton Station is located at East Belt Line Road and Broadway Street near the historic Downtown Carrollton Square. The
Philadelphia Bus Network Choices Report
 Philadelphia Bus Network Choices Report JUNE 2018 SEPTA Table of Contents Executive Summary...7 What if transit gave us more freedom?... 8 What is this report?... 8 The main conclusions... 9 What is happening
Kevin Proft NRS 509 Final Project: Written Overview & Annotated Bibliography GIS Applications in Active Transportation Planning
 Kevin Proft NRS 509 Final Project: Written Overview & Annotated Bibliography 12.13.16 GIS Applications in Active Transportation Planning Geographic Information Systems (GIS) play an important role in developing
Measuring and Communicating Mobility:
 Measuring and Communicating Mobility: The District Mobility Project Stephanie Dock, District Department of Transportation TRB Transportation Issues in Major Cities Committee May 2, 2017 Deconstructing
CITY OF COCOA BEACH 2025 COMPREHENSIVE PLAN. Section VIII Mobility Element Goals, Objectives, and Policies
 CITY OF COCOA BEACH 2025 COMPREHENSIVE PLAN Section VIII Mobility Element Goals, Objectives, and Policies Adopted August 6, 2015 by Ordinance No. 1591 VIII MOBILITY ELEMENT Table of Contents Page Number
1999 On-Board Sacramento Regional Transit District Survey
 SACOG-00-009 1999 On-Board Sacramento Regional Transit District Survey June 2000 Sacramento Area Council of Governments 1999 On-Board Sacramento Regional Transit District Survey June 2000 Table of Contents
Rail Station Fact Sheet CentrePort/DFW Airport Station
 Rail Station Fact Sheet CentrePort/DFW Airport Station Station Overview CentrePort/DFW Airport Station is located by Statler Boulevard at Breezewood Drive in Fort Worth. Free shuttles connect the station
Rehabilitating First- and Last- Mile Connections
 Rehabilitating First- and Last- Mile Connections Sept 18, 2017 Rail~ Volution Jeff Owen Senior Planner Active Transportation TriMet, Planning & Policy Portland, Oregon owenj@trimet.org 503-962-5854 Outline
Scheduling 101 Calculating Running Time Metropolitan Atlanta Rapid Transit Authority Multimodal Operations Workshop Houston, TX
 Calculating Running Time Metropolitan Atlanta Rapid Transit Authority 2015 Multimodal Operations Workshop Houston, TX MARTA FACTS MARTA is the ninth largest transit system in the U.S. that provides bus
95 th Street Corridor Transportation Plan. Steering Committee Meeting #2
 95 th Street Corridor Transportation Plan Steering Committee Meeting #2 February 18, 2015 PURPOSE OF THE MEETING Update Steering Committee Present Community/Stakeholder Survey Results Present Transportation
WALKNBIKE DRAFT PLAN NASHVILLE, TENNESSEE EXECUTIVE SUMMARY NASHVILLE, TENNESSEE
 NASHVILLE, TENNESSEE EXECUTIVE SUMMARY Executive Summary A world-class multi-modal transportation system is essential to a vibrant city and better quality of life. -Mayor Barry The WalknBike plan aims
July 23, Transit Workshop
 Agenda 1. Introductions 2. Presentation: Public Transit in Regina Review of Practices Elsewhere 3. Discussion #1: Transit Today 4. Break 5. Discussion #2: Transit Tomorrow Corridors, Service, and Amenities
95 th Street Corridor Transportation Plan. Steering Committee Meeting
 95 th Street Corridor Transportation Plan Steering Committee Meeting August 11, 2014 PROJECT OBJECTIVES Develop a Transportation and Economic Plan for the 95 th Street Corridor Improve public transit efficiency
Estimating Paratransit Demand Forecasting Models Using ACS Disability and Income Data
 Estimating Paratransit Demand Forecasting Models Using ACS Disability and Income Data Presenter: Daniel Rodríguez Román University of Puerto Rico, Mayagüez Co-author: Sarah V. Hernandez University of Arkansas,
RIDERSHIP PREDICTION
 RIDERSHIP PREDICTION Outline 1. Introduction: route ridership prediction needs and issues. 2. Alternative approaches to route ridership prediction. Professional judgement Survey-based methods Cross-sectional
Guidelines for Providing Access to Public Transportation Stations APPENDIX C TRANSIT STATION ACCESS PLANNING TOOL INSTRUCTIONS
 APPENDIX C TRANSIT STATION ACCESS PLANNING TOOL INSTRUCTIONS Transit Station Access Planning Tool Instructions Page C-1 Revised Final Report September 2011 TRANSIT STATION ACCESS PLANNING TOOL INSTRUCTIONS
Improving Mobility Without Building More Lanes
 Improving Mobility Without Building More Lanes By Mike Salisbury and Will Toor July 2017 Copyright 2017 by Southwest Energy Efficiency Project. All rights reserved. Photo: Courtesy of the Denver Post Anyone
 Time of Change We Are Growing We Are An Attractive Place To Live We Are Age Diverse + Living Longer 50000 40000 30000 20000 10000 0 2010 Census Job Density Housing Sheds Transit Sheds The Project FUNDING
2045 Long Range Transportation Plan. Summary of Draft
 2045 Long Range Transportation Plan Summary of Draft Fredericksburg Area Metropolitan Planning Organization The George Washington Region includes the City of Fredericksburg and the counties of Caroline,
Rail Station Fact Sheet DFW Airport North Station* (*station under construction with anticipated start of service in late 2018)
") Rail Station Fact Sheet DFW Airport North Station* (*station under construction with anticipated start of service in late 018) Station Overview DFW Airport North Station will be located on DFW nternational
Rail Station Fact Sheet DFW Airport North Station* (*station under construction with anticipated start of service in late 018) Station Overview DFW Airport North Station will be located on DFW nternational
City of Davenport CitiBus Public Transportation Study. April 2015
 City of Davenport CitiBus Public Transportation Study April 2015 Overview Project Background Key Findings CitiBus Service Allocation Policy Discussion 2 Project Background 3 About CitiBus Operates 17 routes
CITY OF ELK GROVE CITY COUNCIL STAFF REPORT
 CITY OF ELK GROVE CITY COUNCIL STAFF REPORT AGENDA ITEM NO. 10.1 AGENDA TITLE: Provide Guidance on Proposed e-tran Service Modifications MEETING DATE: PREPARED BY: DEPARTMENT HEAD: Jean Foletta, Transit
Bus Rapid Transit Plans
 Twin Cities Region Bus Rapid Transit Plans ULI Minnesota Workshop Connecting Bus Rapid Transit to the Community December 15, 2009 John Levin Director of Service Development Metro Transit Metropolitan Area
First and Last Mile Strategic Plan. CASTA Annual Meeting 2018
 First and Last Mile Strategic Plan CASTA Annual Meeting 2018 Agenda Study Status Purpose and goals Project update Project timeline Recap: 15 stations and typologies Existing conditions analysis process
Rail Station Fact Sheet CityLine/Bush Station
 Rail Station Fact Sheet CityLine/Bush Station Station Overview CityLine/Bush Station is located just south of the President George Bush Turnpike and east of US 75 in Richardson. The station opened in 00
I-35 Corridor Segment Committee NW Loop 410 San Antonio, Texas. February 11, :00 AM to Noon
 I-35 Corridor Segment Committee 4 3500 NW Loop 410 San Antonio, Texas February 11, 2010 9:00 AM to Noon Welcome Nancy Parker Facilitator Committee Work Session Nancy Parker Facilitator Discussion of Proposed
METRO Light Rail: Changing Transit Markets in the Phoenix Metropolitan Area
 METRO Light Rail: Changing Transit Markets in the Phoenix Metropolitan Area Abhishek Dayal, AICP Planner III, METRO Light Rail Phoenix, AZ BACKGROUND Transit in the Phoenix Region Transit services in the
EXECUTIVE SUMMARY... vii 1 STUDY OVERVIEW Study Scope Study Area Study Objectives
 Contents EXECUTIVE SUMMARY... vii 1 STUDY OVERVIEW... 1-1 1.1 Study Scope... 1-1 1.2 Study Area... 1-1 1.3 Study Objectives... 1-3 2 EXISTING CONDITIONS... 2-1 2.1 Existing Freeway Conditions... 2-4 2.1.1
1.221J/11.527J/ESD.201J TRANSPORTATION SYSTEMS FALL 2003 FINAL EXAMINATION. 1. Open-book and open-notes, calculators are fine -- no laptops.
 1.221J/11.527J/ESD.201J TRANSPORTATION SYSTEMS FALL 2003 FINAL EXAMINATION Instructions: PROFESSOR JOSEPH M. SUSSMAN (LECTURER) 1. Open-book and open-notes, calculators are fine -- no laptops. 2. The exam
Appendix A-2: Screen 1 Alternatives Report
 Appendix A-2: Screen 1 Alternatives Report SCREEN 1 ALTERNATIVES REPORT Western & Ashland Corridors Bus Rapid Transit (BRT) Project Prepared for Chicago Transit Authority 567 West Lake Street Chicago,
2010 Pedestrian and Bicyclist Special Districts Study Update
 2010 Pedestrian and Bicyclist Special Districts Study Update Pedestrian and Bicyclist Special Districts Program Overview H-GAC s Special Districts Program aims to provide strategic investments in pedestrian
METRO Now. Transit Leader. One of only four urban. gain bus ridership in Purple and Green Lines. Red Line is one
 Transit Leader Our commuter buses provide 8 million trips each year third most trips of any U.S. transit agency. 1 One of only four urban transit agencies in the country to gain bus ridership in 2016 2
BID Strategy Group and Stakeholders Meeting. April 17, 2018
 BID Strategy Group and Stakeholders Meeting April 17, 2018 Agenda Meeting Objectives Background Short-Term Improvements Long-Term Study Goals Data Review Schedule & Next Steps Open House April 17, 2018
. ' motion. APPLtlDK.L - L"iLC_t1GLR 201b APPENDIX 7 TECHNICAL MEMOS
 . ' motion APPLtlDK.L - L"iLC_t1GLR 201b APPENDIX 7 TECHNICAL MEMOS The nmotion program will provide a large number of benefits for Middle Tennessee. This document presents selected benefits and other
MONTGOMERY COUNTY PLANNING DEPARTMENT THE MARYLAND-NATIONAL CAPITAL PARK AND PLANNING COMMISSION
 MONTGOMERY COUNTY PLANNING DEPARTMENT THE MARYLAND-NATIONAL CAPITAL PARK AND PLANNING COMMISSION MCPB Item No. 4 Date: 04-17-14 2014 Mobility Assessment Report José Dory, Senior Planner, Functional Planning
Westside Transportation Access Needs Assessment - Short and Long Term Improvements
 ABSTRACT The Los Angeles County Metropolitan Transportation Authority (MTA) adopted the 2001 Long Range Transportation Plan (LRTP), which sets out the County s transportation investments for the next 20-25
Understanding Transit Demand. E. Beimborn, University of Wisconsin-Milwaukee
 Understanding Transit Demand E. Beimborn, University of Wisconsin-Milwaukee 1 Purpose To provide a basic understanding of transit ridership and some common misunderstandings. To explain concepts of choice
Tulsa Metropolitan Area LONG RANGE TRANSPORTATION PLAN
 Tulsa Metropolitan Area LONG RANGE TRANSPORTATION PLAN Indian Nations Council of Governments August 2005 CONTACTING INCOG In developing the Destination 2030 Long Range Transportation Plan, INCOG s Transportation
Highway Transitway Corridor Study
 Highway Transitway Corridor Study CTS Research Conference May 21, 2014 1 2030 Transportation Policy Plan Transitway modes on highways: Highway bus rapid transit (BRT), plan identified 6 total Highway BRT
PURPOSE AND NEED SUMMARY 54% Corridor Need 1. Corridor Need 2. Corridor Need 3. Corridor Need 4. Corridor Need 5
 SUMMARY PURPOSE AND NEED Chapel Hill Transit ridership has increased Buses operate every 4 minutes and have standing room only Exceeding seated capacity by 12% Corridor Need 1 by more than 20 percent between
Central Oregon Intergovernmental Council
 Central Oregon Intergovernmental Council Regional Transit Master Plan (RTMP) Technical Advisory Committee Kick-Off Meeting May 16, 2012 Meeting Agenda Project Orientation Presentation of Survey Results
Rail Station Fact Sheet UNT Dallas Station
 Rail Station Fact Sheet UNT Dallas Station Station Overview UNT Dallas Station is located on the east side of University Hills Boulevard in Dallas. t is connected by a walking path to the University of
ADOT Statewide Bicycle and Pedestrian Program Summary of Phase IV Activities APPENDIX B PEDESTRIAN DEMAND INDEX
 ADOT Statewide Bicycle and Pedestrian Program Summary of Activities APPENDIX B PEDESTRIAN DEMAND INDEX May 24, 2009 Pedestrian Demand Index for State Highway Facilities Revised: May 29, 2007 Introduction
Goodlettsville Bicycle and Pedestrian Plan Executive Summary
 Goodlettsville Bicycle and Pedestrian Plan July 2010 In Cooperation with the Nashville Area Metropolitan Planning Executive Organization Summary Introduction Progressive and forward thinking communities
Characteristics from these programs were used to compare to and evaluate existing conditions in Howard County.
 EXECUTIVE SUMMARY Bike share is a mobility option that allows users to access a fleet of public bicycles throughout a community. Bike share systems have successfully been implemented in communities throughout
MTA Surveys: Facts and Findings. NYMTC Brown Bag March 12, 2014 Julia Seltzer, MTA Planning
 MTA Surveys: Facts and Findings NYMTC Brown Bag March 12, 2014 Julia Seltzer, MTA Planning MTA Planning Survey Program Why survey? Who was surveyed? Challenges Methodologies Findings Uses for data 1 Why
NEWMARKET CENTRE Mobility Hub Profile
 Mobility Hub Profile Dundas Newmarket West-Bloor Centre Anchor Hub Gateway Hub N MOBILITY HUBS: Places of connectivity between regional and rapid transit services, where different modes of transportation
SoundCast Design Intro
 SoundCast Design Intro Basic Design SoundCast and Daysim 3 Land use attributes Households & Individuals SoundCast DaySim Travel demand simulator Trips and Households, Excel Summary Sheets, EMME network
A Matter of Fairness: ROCOG s Environmental Justice Protocol. What is Mobility Limitation?
 No Person Left Behind What is Mobility Limitation? What is the Access Limitation? Environmental Justice population should be provided adequate mobility & access to meet their needs; Identify acceptable
Chapter 5 Future Transportation
 Chapter 5 Future Transportation The Future Land Use Plan identifies the desired land use designations. The land uses desired for Crozet depend, in large part, on the success of the transportation system,
Pedestrian Activity Criteria. PSAC March 8, 2011
 Pedestrian Activity Criteria PSAC March 8, 2011 Contents 1. Project Overview a) Revised schedule of PSAC hearings 2. Pedestrian Activity: Where walking is important a) Existing conditions (revisions based
Plant City Walk-Bike Plan
 Plant City Walk-Bike Plan Plant City Commute Mode Share 2.2% 1.4% 2.9% Drove alone 10.2% Carpooled Public transportation (0.1%) Walked Used a Bike (0.4%) 82.9% Taxicab, motorcycle, or other means Worked
Appendix T-2: Transportation Facilities Inventory
 Appendix T-2: Transportation Facilities Inventory Roads, Highways and Bridges The Georgia Department of Transportation (GDOT) maintains centerline mile measures for all counties in Georgia based on functional
Community Transit Solutions for the Suburbs APTA Annual Meeting Steve Fittante, New Jersey Transit Corporation September 30, 2013
 Community Transit Solutions for the Suburbs APTA Annual Meeting Steve Fittante, New Jersey Transit Corporation September 30, 2013 New Suburban Challenges Lower density development patterns Where is the
Operationalizing Accessibility
 Operationalizing Accessibility March 30, 2017 Chris McCahill State Smart Transportation Initiative Matt Pettit Citilabs State Smart Transportation Initiative A network of reform-oriented state DOTs, founded
Preliminary Transportation Analysis
 Preliminary Transportation Analysis Goals of a Robust, Multimodal Transportation Network Safe Accessible/Connected Efficient Comfortable Context-Sensitive Motor Vehicle: Continue to analyze the data to
Exceeding expectations: The growth of walking in Vancouver and creating a more walkable city in the future through EcoDensity
 Exceeding expectations: The growth of walking in Vancouver and creating a more walkable city in the future through EcoDensity Melina Scholefield, P. Eng. Manager, Sustainability Group, City of Vancouver
Fitting Light Rail through Well-established Communities
 Fitting Light Rail through Well-established Communities San Francisco 2008 Michael D. Madden Chief, Project Development, Maryland Transit Administration Project Setting Located inside the Capital Beltway
How Policy Drives Mode Choice in Children s Transportation to School
 How Policy Drives Mode Choice in Children s Transportation to School Physical Activity through Active Transportation Ruth L. Steiner 2011 Technical Conference and Exhibit Lake Buena Vista, FL April 3-6,
Complete Streets implementation in Chicagoland
 Complete Streets implementation in Chicagoland presented by Active Transportation Alliance Chicago Metropolitan Agency for Planning National Complete Streets Coalition 1 Speakers: Paul Lippens, AICP Senior
4 Ridership Growth Study
 Clause 4 in Report No. 15 of Committee of the Whole was adopted, without amendment, by the Council of The Regional Municipality of York at its meeting held on November 16, 2017. 4 Ridership Growth Study
Anniedale- Tynehead NCP Best Practices in Transportation Planning Summary
 Anniedale- Tynehead NCP Best Practices in Transportation Planning Summary The City of Surrey Anniedale-Tynehead NCP Best Practices Transportation Summary This document provides a summary of the Bunt &
Using GPS Data for Arterial Mobility Performance Measures
 Using GPS Data for Arterial Mobility Performance Measures Paul Czech, MnDOT Shawn Turner, TTI CTS Research Conference May 22, 2014 ~ St. Paul, MN Methodology & Results INRIX GPS Data + = Road Inventory
APPENDIX A LITERATURE REVIEW AND SUMMARY OF STAKEHOLDER INTERVIEWS
 APPENDIX A LITERATURE REVIEW AND SUMMARY OF STAKEHOLDER INTERVIEWS Page A-1 Revised Final Report September 2011 INTRODUCTION A literature review was conducted to identify the current body of knowledge
Arterial Transitway Corridors Study. Ave
 Arterial Transitway Corridors Study Ave January 2012 Arterial Transitway Corridors Study Overview Corridor Features and Demographics 11 study corridors, 95 route miles 86,000 daily rides and half of existing
Two Capitals: 1 w/lrt, 1 w/out How Has Transit Fared in Each?
 Two Capitals: 1 w/lrt, 1 w/out How Has Transit Fared in Each? Columbus, Ohio Sacramento, CA Photo courtesy of the Ohio Statehouse Photo Archive John Schumann Senior Transportation Consultant http://en.wikipedia.org/wiki/file:california_state_capitol.jpg
Community Engagement Process
 Community Engagement Process PHASE ONE PURPOSE + NEED STATEMENT IDEAS DESTINATIONS TRAVEL PATTERNS PHASE TWO MODE SELECTION INPUT PHASE THREE LOCALLY PREFERRED ALTERNATIVE SELECTION OF PREFERRED ALTERNATIVE
Planning Transit Operations and Bike Sharing Denver RTD. Bill Van Meter, Assistant General Manager, Planning March 23, 2012
 Planning Transit Operations and Bike Sharing Denver RTD Bill Van Meter, Assistant General Manager, Planning March 23, 2012 1 Overview RTD Background RTD Bike-n-Ride Program RTD - Bike Share Coordination:
Rail Station Fact Sheet Buckner Station
 Rail Station Fact Sheet Buckner Station Station Overview Buckner Station is located at the intersection of Buckner Boulevard and Elam Road in Dallas. The station opened in 2010 and currently serves as
 MEMORANDUM - CITY OF PASADENA Department Of Transportation DATE: OCTOBER 21, 2008 TO: ENVIRONMENTAL ADVISORY COMMISSION FROM: ~ FRED C. DOCK, DIRECTOR OF TRANSPORTATION SUBJECT: UPDATE ON DEPT. OF TRANSPORTATION
SR 693 (Pasadena Avenue) Corridor Study from Shore Drive South to 66 th Street
 Corridor Study from Shore Drive South to 66 th Street") Welcome and Introduction Sign-in and comment sheets Restrooms and exits Meeting agenda and timeline Meeting goals / expectations Provide input to guide study recommendations Actively participate throughout
Welcome and Introduction Sign-in and comment sheets Restrooms and exits Meeting agenda and timeline Meeting goals / expectations Provide input to guide study recommendations Actively participate throughout
DON MILLS-EGLINTON Mobility Hub Profile
 Mobility Hub Profile Dundas Don Mills-Eglinton West-Bloor Anchor Hub Gateway Hub N MOBILITY HUBS: Places of connectivity between regional and rapid transit services, where different modes of transportation
Purpose and Need. Chapter Introduction. 2.2 Project Purpose and Need Project Purpose Project Need
 Chapter 2 Purpose and Need 2.1 Introduction The El Camino Real Bus Rapid Transit (BRT) Project (Project) would make transit and other transportation improvements along a 17.6-mile segment of the El Camino
A Selection Approach for BRT Parking Lots Nicolls Road Corridor Parking Study
 A Selection Approach for BRT Parking Lots Nicolls Road Corridor Parking Study Chirantan Kansara, P.E. Engineering Construction Design Planning 2018 ITE Northeastern District Annual Meeting Lake George,
Access BART: TOD and Improved Connections. October 29, 2008
 Access BART: TOD and Improved Connections October 29, 2008 1 Access BART Study Goals Evaluate at the system-level land use and access scenarios to optimize ridership Identify station clusters that provide
Performance Criteria for 2035 Long Range Transportation Plan
 Minimizing Impacts on Natural, Historic, Cultural or Archeological Resources 2035 LRTP Weighting Factor: 7% Objective 1.1: Use appropriate planning and design criteria to protect and enhance the built
2016 REGIONAL ORIGIN AND DESTINATION STUDY TDCHR WORKSHOP APRIL 27, 2017
 2016 REGIONAL ORIGIN AND DESTINATION STUDY TDCHR WORKSHOP APRIL 27, 2017 WORKSHOP AGENDA 2016 Regional Origin & Destination (O&D) Study Purpose Methodology How our Riders use the HRT System? Who Are Our
Presentation to the City of Ottawa Transit Commission. February 20, 2013
 Presentation to the City of Ottawa Transit Commission February 20, 2013 Background 1994: Comprehensive development plan for road networks and public transit(sto, MTQ,NCCandCUO) 1994: Commuter train study
Market Factors and Demand Analysis. World Bank
 Market Factors and Demand Analysis Bank Workshop and Training on Urban Transport Planning and Reform. Baku, April 14-16, 2009 Market Factors The market for Public Transport is affected by a variety of