Useful Tools in Mosquito Surveillance
|
|
|
- Berniece Elisabeth Snow
- 5 years ago
- Views:
Transcription

1 Useful Tools in Mosquito Surveillance
2 Denominators Infection Rates (MIR and MLE s) Data Smoothing Vector Index
3 Denominator The denominator is the lower portion of a fraction used to calculate a rate or ratio.
4 Human Bait Collection of Lutzomyia Sand Flies in Amazonas State, Brazil, January 3 to 7, 975 Date 2/0 # Sand Flies Collected 5
5 Human Bait Collection of Lutzomyia Sand Flies in Amazonas State, Brazil, January 3 to 7, 975 Date 2/0 3/0 # Sand Flies Collected 5 35
6 Human Bait Collection of Lutzomyia Sand Flies in Amazonas State, Brazil, January 3 to 7, 975 Date 2/0 3/0 4/0 # Sand Flies Collected
7 Human Bait Collection of Lutzomyia Sand Flies in Amazonas State, Brazil, January 3 to 7, 975 Date 2/0 3/0 4/0 5/0 # Sand Flies Collected
8 Human Bait Collection of Lutzomyia Sand Flies in Amazonas State, Brazil, January 3 to 7, 975 Date 2/0 3/0 4/0 5/0 6/0 # Sand Flies Collected
9 Human Bait Collection of Lutzomyia Sand Flies in Amazonas State, Brazil, January 3 to 7, 975 Date 2/0 3/0 4/0 5/0 6/0 7/0 # Sand Flies Collected
10 20 Human Bait Collection of Lutzomyia Sand Flies in Amazonas State, Brazil, January 3 to 7, Sand Flies # flies collected Jan 3-Jan 4-Jan 5-Jan 6-Jan 7-Jan Date
11 Human Bait Collection of Lutzomyia Sand Flies in Amazonas State, Brazil, January 3 to 7, 975 Date 3/0 3/0 4/0 5/0 6/0 7/0 # collected
12 Human Bait Collection of Lutzomyia Sand Flies in Amazonas State, Brazil, January 3 to 7, 975 Date 3/0 3/0 4/0 5/0 6/0 7/0 # collected Persons 2 3 3
13 Human Bait Collection of Lutzomyia Sand Flies in Amazonas State, Brazil, January 3 to 7, 975 Date # collected Persons Hours 3/0 5 3/ / / / /
14 Human Bait Collection of Lutzomyia Sand Flies in Amazonas State, Brazil, January 3 to 7, 975 Date # collected Persons Hours 3/0 5 X = 3/0 35 X 2 = 4/0 45 X 3 = 5/ X 2 = 6/ X = 7/ X 2 =
15 Human Bait Collection of Lutzomyia Sand Flies in Amazonas State, Brazil, January 3 to 7, 975 Date # collected Persons Hours Man hrs. 3/0 5 X = 3/0 35 X 2 = 2 4/0 45 X 3 = 3 5/ X 2 = 4 6/ X = 3 7/ X 2 = 6
16 Human Bait Collection of Lutzomyia Sand Flies in Amazonas State, Brazil, January 3 to 7, 975 Date # collected Man hrs. 3/0 5 = 3/ = 4/ = 5/ = 6/ = 7/ =
17 Human Bait Collection of Lutzomyia Sand Flies in Amazonas State, Brazil, January 3 to 7, 975 Date # collected Persons Hours Man Hrs Flies/Man Hr 3/0 5 = 5.0 3/ = 7.5 4/ = 5.0 5/ = 2.5 6/ = / = 6.7
18 20 Human Bait Collection of Lutzomyia Sand Flies in Amazonas State, Brazil, January 3 to 7, Sand Flies # flies collected # flies collected / man hr. 3-Jan 4-Jan 5-Jan 6-Jan 7-Jan 8-Jan Date
19 Trapping Effort, Fairfax County, Year # Mosquitoes # Pools # (+) Pools # Trap Nights ,492,885 5, ,4 2, ,828 2, , ,277 3, , ,402 4, ,280
20 Conclusions Numbers can be impressive Numbers can be misleading Denominators put numbers into perspective
21 MIR MIR MIR MIR MLE MLE MIR MIR MLE MLE MLE MLE MLE MIR MIR MIR MLE MLE MIR Infection Rate MIR or MLE? That is the Question
22 Mosquito Infection Rate MLE MIR MIR MLE MLE MIR MIR MLE MLE MLE MIR MIR MIR MIR Minimum Infection Rate MLE MLE MLE MIR MLE Maximum Likelihood Estimation MIR MIR
23 MIR MLE Mosquito Infection Rate MIR MIR MLE MLE MIR MIR MIR Minimum Infection Rate Assumes infected mosquito per pool (sample) MLE MIR = # positive samples total # of mosquitoes tested MLE MLE MIR MIR MIR X,000 MLE MLE
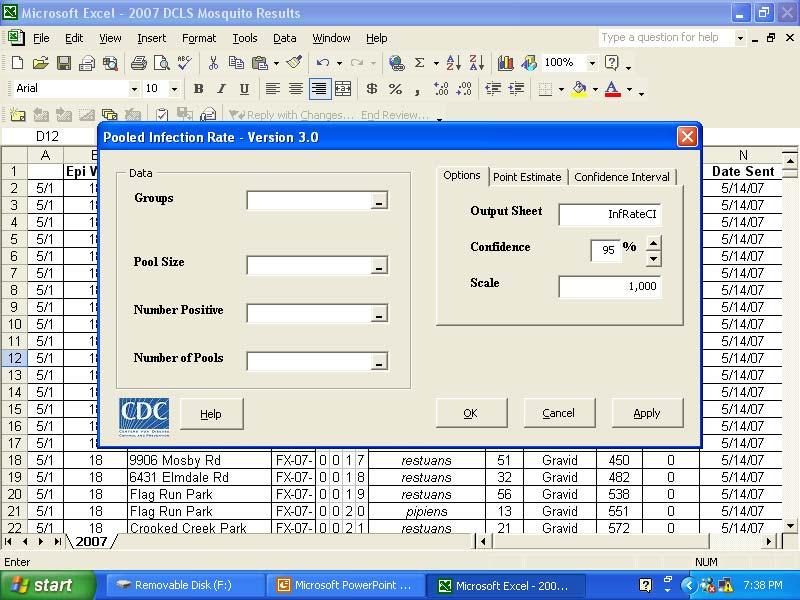
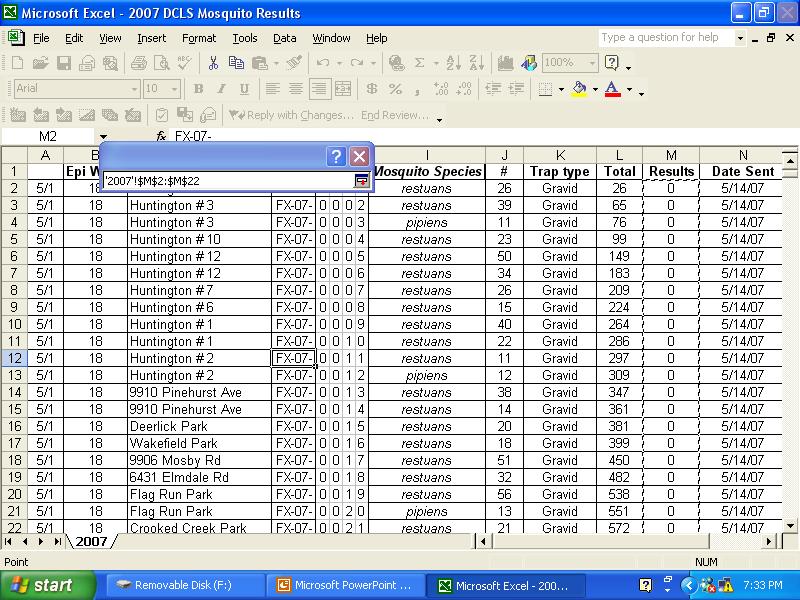
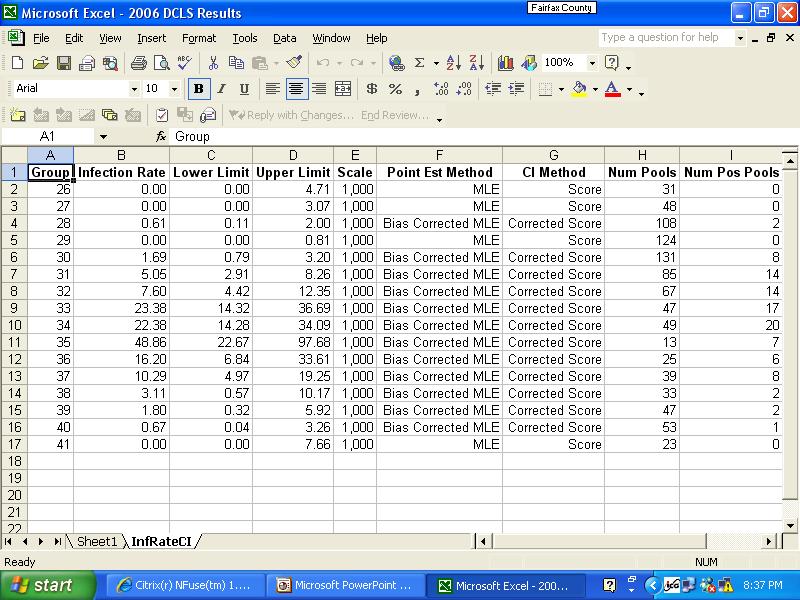
24 MIR MLE Mosquito Infection Rate positive mosquito per MLE pool and MLE MIR MIR MLE Maximum Likelihood Estimation Considers the possibility of more than MIR MLE MLE MLE MIR MIR compensates for different sized samples Calculated with an Excel Add-In MIR MIR MLE MLE Brad Biggerstaff, CDC
25

26
27
28
29
30
31
32
33
34
35 40 35 Maximum Likelyhood Estimation of WNV in Culex Mosquitoes Collected in gravid Traps, by Week, Fairfax, Va, 2006 MLE Upper Limitr Lower Limit In fectio n rate p er, EPI Week
36 Difference Between MIR and MLE 25 WNV Infection Rates in Culex Mosquitoes Collected in Gravid Traps, per Week, Fairfax, Va, 2006 MLE MIR Infection rate per, EPI Week
37 Difference Between MIR and MLE WNV Infection Rates in Culex Mosquitoes Collected in Gravid Traps, Fairfax, Va, 2003 MLE MIR Infection rate per EPI Week
38 Conclusions MIR does not stand for Mosquito Infection Rate You can use either MIR or MLE when IR is < 20, but you should use the MLE when IR is > 20 Use either MIR of MLE but not both MIR s and MLE s have to be calculated weekly Seasonal MIR s and MLE s don t mean anything, these shouldn t be used
39 Data Smoothing 25, 35, 44, 24, 36, 34, 42, 52, 44, 34, 34, 25, 44, 36, 24, 35, 52, 42, 34, 44, 34, 22, 34, 25, 44, 36, 24, 35, 52, 42, 34, 44, 34, 22, 35,
40 Data Smoothing Data Smoothing is a form of low pass filtering = 25, 35, 44, 24, 36, 34, 42, 52, 44, 34, 34, 25, 44, 36, 24, 35, 52, 42, 34, 44, 34, 22, 35, It blocks out the high frequency components in order to emphasize the low frequency ones (longer trends)
41 Data Smoothing 25, 35, 44, 24, 36, 34, 42, 52, 44, 34, 34, 25, 52, 44, 42, 44, 36, 24, 34, The running mean or 35, moving average 34, 22, 35, The exponential weighted average
42 Data Smoothing The running mean () or moving average y k = y k (x k x k-n ) n 25, 35, 44, 24, 36, 34, 42, 52, 44, 34, y k = new set of smoothed data x k = original set of data 34, 25, 52, 44, 42, 44, 36, 24, 34, 35, 34, n = the size of the set of number 22, 35,
43

44 y k = y k (x k x k-n ) n y k = new set of smoothed data x k = original set of data n = the size of the set of number
45 Data Smoothing The running mean (2) or moving average SUM(x k : x k-n ) y k = n 25, 35, 44, 24, 36, 34, 42, 52, 44, 34, y k = new set of smoothed data x k = original set of data 34, 25, 52, 44, 42, 44, 36, 24, 34, 35, 34, n = the size of the set of number 22, 35,
46 SUM(x k : x k-n ) y k = n y k = new set of smoothed data x k = original set of data n = the size of the set of number
47 Data Smoothing The exponential weighted average y k = (-b)x k + by k- 25, 35, 44, 24, 36, 34, 42, 52, 44, 34, 34, 25, 52, 44, 42, 44, 36, 24, 34, 34, 22, 35, y k = new set of smoothed data x k = original set of data 35, b = the fraction of the number that is used
48 y k = (-b)x k + by k- y k = new set of smoothed data x k = original set of data b = the fraction of the number that is used

49
50 25, 35, 44, 24, 36, 34, 42, 52, 44, 34, O F Jan Feb Mar Fairfax Temperature, 2007 Data Smoothing Apr 34, 25, May Jun 44, 36, 24, 35, Jul 52, 42, 34, 44, Block out high frequency components in order to emphasize longer trends Month 34, Aug Sep Oct Nov Dec 22, 35,
51 25, 35, 44, 24, 36, 34, 42, 52, 44, 34, o F Fairfax Tempreature, , 25, 44, 36, 24, 35, Jan F eb Mar Apr May J unjul Month 52, 42, 34, 44, 34, 22, 35, Aug SepO ct Nov D ec
52 00 Fairfax Temperature, , 35, 44, 24, 36, 34, 42, 52, 44, 34, O F , 25, 44, 36, 24, 35, 52, 42, 34, 44, 34, 22, 35, Jan Feb Mar Apr It blocks out the high frequency components emphasize low frequency components (TRENDS) May Jun Jul Month Aug Sep Oct Nov Dec
53 00 90 Different Data Smoothing Strategies Data Smoothing Ex. Weight Run. mean () Run. mean (2) o F , 35, 44, 24, 36, 34, 42, 52, 44, 34, 50 34, 25, 44, 36, 24, 35, 52, 42, 34, 44, 34, 22, 35, Jan Feb Mar Apr May Jun Jul Month Aug Sep Oct Nov Dec
54 0 Lutzomyia shannoni collected in light traps, Fairfax, VA, 2005 Data 8 Smoothing Flies per trap 25, 35, 44, 24, 36, 34, 42, 52, 44, 34, , 25, 44, 36, 24, 35, , 42, 34, , 32 EPI Week 34, 33 22, 35, The running mean (2) or moving average 5 Lutzomyia shannoni collected in light traps, Fairfax, VA, 2005 SUM(x k : x k-n ) y k = n n = Flies per trap EPI Week
55 Conclusions It blocks out the high frequency components It emphasizes the low frequency components emphasizing longer trends Shows trends more clearly Use carefully


56 Vector Index (VI) Indice Vector Vectorial Index i species NiPˆ i Roger Nasci, CDC
57 Vector Index (VI) Estimate of the number of infected mosquitoes collected per trap night In a meaningful spatial and temporal sampling unit Summed for key mosquito species Quantitatively related to human risk (cases)
58 VI uses data from existing mosquito-based surveillance Vector Index i species Ni Pˆ i Parameter Information provided Units Population Density N i Infection Rate Pˆ Species i Relative abundance of species in terms of trapping effort Incidence of the disease agent in the vector population Key vector or indicator species Number collected per trap night Proportion infected
59 VECTOR INDEX (VI). Calculate mosquito density Trap Site Total Average per trap night SD Ae. albopictus Ni Cx. pipiens
60 VECTOR INDEX (VI) 2. Calculate infection rate as proportion (Ae. albopictus) Pools tested for virus Pool Number Species # in pool Positives Ae. albopictus Ae. albopictus Ae. albopictus 50 4 Ae. albopictus Ae. albopictus Ae. albopictus 50 0 Proportion Infected Infection Rate Pˆ i Lower Limit Upper Limit Confidence
61 VECTOR INDEX (VI) 2. Calculate infection rate as proportion (Cx pipiens) Pools tested for virus Pool Number Proportion Infected Infection Rate Pˆ i Species Cx pipiens Cx pipiens Cx pipiens Cx pipiens Cx pipiens Lower Limit Number in pool Upper Limit Positives Confidence 0.95
62 VECTOR INDEX (VI) 3. Calculate individual and combined VI Vector Index Calculation Ae. albopictus Cx. pipiens Avg/trap night i species N ipˆ i Proportion Infected Ni VI (individual species) VI= (Ae. albopictus & Cx. pipiens) 0.40
63 VECTOR INDEX (VI) 3. Calculate individual and combined VI Vector Index Calculation Ae. albopictus Cx. pipiens Avg/trap night i species N ipˆ i Proportion Infected Pˆ i VI (individual species) VI= (Ae. albopictus & Cx. pipiens) 0.40
64 VECTOR INDEX (VI) 3. Calculate individual and combined VI Vector Index Calculation Ae. albopictus Cx. pipiens Avg/trap night i species N ipˆ i Proportion Infected VI (individual species) N ipˆ i VI= (Ae. albopictus & Cx. pipiens) 0.40
65 VECTOR INDEX (VI) 3. Calculate individual and combined VI Vector Index Calculation Ae. albopictus Cx. pipiens Avg/trap night i species N ipˆ i Proportion Infected VI (individual species) VI= (Ae. albopictus & Cx. pipiens) i species N ipˆ i 0.40
66 Vector Density Cases Cx. pipiens+sp Ae. albopictus No./ Trap Night Cases EPI Week 0
67 Infection Rate (Proportion) Cases Cx. pipiens+sp Ae. albopictus Proportion Infected Cases EPI Week 0
68 Vector Index Cases Cx. pipiens+sp Ae. albopictus Combined Vector Index EPI Week Cases
69 VECTOR INDEX (VI) Combine data from epidemic and non-epidemic years, look for significant correlation. Determine if it can predict cases 2, 3, and 4 weeks later.
70 Conclusions Quantifiable association between VI and cases with onset two weeks later VI can be used as a threshold for launching epidemic response (adulticide applications) to stem epidemic transmission. VI can be used as a method to determine maximum tolerable adult densities, as a guide for larval management programs Has to be calculated weekly, seasonal VI is worthless
71 Acknowledgements Dr. Roger Nasci & Dr. Brad Biggerstaff CDC for sharing slides on Vector Index and for the MLE Add-In.
72 25 WNV Infection Rates in Culex Mosquitoes Collected in Gravid Traps, per Week, Fairfax, Va, 2006 Thank You Infection rate per.000 Vector Index MLE MIR MIR - MLE EPI Week Cases Cx. pipiens+sp Ae. albopictus Combined Vector Index EPI Week Cases Flies per trap Lutzomyia shannoni collected in light traps, Fairfax, VA, Sand Flies Data Smoothing EPI Week Human Bait Collection of Lutzomyia Sand Flies in Amazonas State, Brazil, January 3 to 7, 975 Denominator 3-Jan 4-Jan 5-Jan 6-Jan 7-Jan 8-Jan Date
COMPARISON OF FIXED & VARIABLE RATES (25 YEARS) CHARTERED BANK ADMINISTERED INTEREST RATES - PRIME BUSINESS*
 CHARTERED BANK ADMINISTERED INTEREST RATES - PRIME BUSINESS*") COMPARISON OF FIXED & VARIABLE RATES (25 YEARS) Fixed Rates Variable Rates FIXED RATES OF THE PAST 25 YEARS AVERAGE RESIDENTIAL MORTGAGE LENDING RATE - 5 YEAR* (Per cent) Year Jan Feb Mar Apr May Jun Jul
COMPARISON OF FIXED & VARIABLE RATES (25 YEARS) Fixed Rates Variable Rates FIXED RATES OF THE PAST 25 YEARS AVERAGE RESIDENTIAL MORTGAGE LENDING RATE - 5 YEAR* (Per cent) Year Jan Feb Mar Apr May Jun Jul
2018 HR & PAYROLL Deadlines
 th (by payment date) EPAF 3rd PARTY FEEDS WTE Approval 2018 HR & PAYROLL s Normal Payroll day s 2017 B1-26 3 * 13-Dec-17 15-Dec-17 n/a n/a n/a 28-Dec-17 29-Dec-17 11:00 AM 16-Dec-2017 29-Dec-2017 JAN 2018
Utility Debt Securitization Authority 2013 T/TE Billed Revenues Tracking Report
 Utility Debt Securitization Authority 2013 T/TE Billed Revenues Tracking Report Billing Budgeted Billed Dollar Percent Month Revenues Revenues Variance Variance Jan 2018 11,943,180.68 12,697,662.47 754,481.79
3. EXCEL FORMULAS & TABLES
 Fall 2017 CS130 - Excel Formulas & Tables 1 3. EXCEL FORMULAS & TABLES Fall 2017 Fall 2017 CS130 - Excel Formulas & Tables 2 Cell References Absolute reference - refer to cells by their fixed position.
Bluetongue Disease (BT)
") Bluetongue Disease (BT) Analysis of ADNS data since 01/2018 Reporting period: 2018-01-01 2018-12-09 Data query: 2018-12-10 AGES DSR Austrian Agency for Health and Food Safety www.ages.at Parameters Data
Bluetongue Disease (BT) Analysis of ADNS data since 01/2018 Reporting period: 2018-01-01 2018-12-09 Data query: 2018-12-10 AGES DSR Austrian Agency for Health and Food Safety www.ages.at Parameters Data
Wisconsin 511 Traveler Information Annual Usage Summary January 3, Wisconsin 511 Phone Usage ( )
") Wisconsin 511 Traveler Information 211 Annual Usage Summary January 3, 212 Overall to-date Summary 36 months of operation 1,16,63 total calls the 1 Million mark was passed on December 3, 212 3,627,527
Wisconsin 511 Traveler Information 211 Annual Usage Summary January 3, 212 Overall to-date Summary 36 months of operation 1,16,63 total calls the 1 Million mark was passed on December 3, 212 3,627,527
MAR DASHBOARD MAR. Compliant % Breakdown Mar % Late % On-time MAR APR MAY JUN JUL AUG SEP OCT NOV DEC
 Positive Response Compliance 215 Compliant 215 Non-Compliant 216 Compliant 216 Non-Compliant 1% 87% 96% 86% 96% 88% 97% 89% 89% 88% 86% 92% 93% 94% 96% 94% 8% 6% 4% 2% 13% JAN 4% 14% FEB 4% 12% 3% 11%
Presented to the ASMFC Horseshoe Crab Management Board October 17, 2017
 Horseshoe Crab Technical Committee Report Bait Use Surveys of the American Eel and Channeled Whelk Fisheries Presented to the ASMFC Horseshoe Crab Management Board October 17, 2017 Survey Goals Discover
SWISS Traffic Figures May 2004
 SWISS Traffic Figures May 2004 SWISS continues seat load factor improvement in May SWISS s load factor for May was 4.8 percentage points better than for the same period last year. Seat load factor for
3. EXCEL FORMULAS & TABLES
 Winter 2017 CS130 - Excel Formulas & Tables 1 3. EXCEL FORMULAS & TABLES Winter 2017 Winter 2017 CS130 - Excel Formulas & Tables 2 Cell References Absolute reference - refer to cells by their fixed position.
Bird strikes Swedish Airspace
 Bird strikes Swedish Airspace 1998-2005 Nordic Birdstrike Committee Arlanda 2006-09-21 Jörgen Andersson Jörgen Andersson, Swedish CAA 1 Objective Occurrence reports Bird population Birdstrikes between
System Flexibility Indicators
 System Flexibility Indicators Place your chosen image here. The four corners must just cover the arrow tips. For covers, the three pictures should be the same size and in a straight line. Operational Forum
Example Report. EXAMPLE How to perform. infrared trending of Electric Motors. Plant Air Wash Supply Fan. Temperature Rise = High Temp = Ambient =
 Plant Air Wash Supply Fan How to perform in-house infrared trending of Electric Motors High Temp = Ambient = Temperature Rise = Example Report Plant Air Wash Supply Fan Procedure for trending temperatures
STAPLETON MCA MOSQUITO CONTROL PROGRAM
 STAPLETON MCA MOSQUITO CONTROL PROGRAM MONTHLY REPORT: JULY 2017 VECTOR DISEASE CONTROL INTL. Contact VDCI: Rob Kozar Front Range Regional Manager 303-428-5908 E-Mail: rkozar@vdci.net Website: www.vdci.net/colorado
Warmer temperatures, molt timing and lobster seasons in the Canadian Maritimes
 Warmer temperatures, molt timing and lobster seasons in the Canadian Maritimes John Tremblay 1, Jean Lavallee 2 and Ross Claytor 1 1 Population Ecology Division, Fisheries and Oceans, Bedford Institute
GALLUP NEWS SERVICE GALLUP POLL SOCIAL SERIES: WORLD AFFAIRS
 GALLUP NEWS SERVICE GALLUP POLL SOCIAL SERIES: WORLD AFFAIRS -- FINAL TOPLINE -- Timberline: 937008 IS: 954 Princeton Job #: 17-02-002 Jeff Jones, Lydia Saad February 1-5, 2017 Results are based on telephone
A pheasant researcher notebook:
 A pheasant researcher notebook: what we are learning about pheasants and pheasant hunters in Nebraska TJ Fontaine Nebraska Cooperative Fish and Wildlife Research Unit Managing pheasants is challenging
GALLUP NEWS SERVICE GALLUP POLL SOCIAL SERIES: WORLD AFFAIRS
 GALLUP NEWS SERVICE GALLUP POLL SOCIAL SERIES: WORLD AFFAIRS -- FINAL TOPLINE -- Timberline: 937008 JT: 165 Princeton Job #: 18-02-002 Jeff Jones, Lydia Saad February 1-10, 2018 Results are based on telephone
GALLUP NEWS SERVICE GALLUP POLL SOCIAL SERIES: WORK AND EDUCATION
 GALLUP NEWS SERVICE GALLUP POLL SOCIAL SERIES: WORK AND EDUCATION -- FINAL TOPLINE -- Timberline: 937008 IS: 786 Princeton Job #: 16-08-012 Jeff Jones, Lydia Saad August 3-7, 2016 Results are based on
STAPLETON MCA MOSQUITO CONTROL PROGRAM
 STAPLETON MCA MOSQUITO CONTROL PROGRAM MONTHLY REPORT: AUGUST 2018 VECTOR DISEASE CONTROL INTL. Contact VDCI: Rob Kozar Front Range Regional Manager 303-428-5908 E-Mail: rkozar@vdci.net Website: www.vdci.net/colorado
Invasive Bacterial Disease Surveillance Report Emerging Infections Program Minnesota Department of Health
 Invasive Bacterial Disease Surveillance Report 2009 Emerging Infections Program Minnesota Department of Health Surveillance Methods Cases include Minnesota residents with invasive infections due to Group
NEVADA SLOT MACHINES: HISTORICAL HOLD PERCENTAGE VARIATIONS ANNUAL AND MONTHLY HOLD PERCENTAGES, CENTER FOR GAMING RESEARCH, NOVEMBER 2017
 NEVADA SLOT MACHINES: HISTORICAL HOLD PERCENTAGE VARIATIONS ANNUAL AND MONTHLY HOLD PERCENTAGES, 2004-2017 CENTER FOR GAMING RESEARCH, NOVEMBER 2017 Executive Summary Hold percentage the portion of money
Bird Hunting along the Mediterranean Coast of Egypt Socioeconomic study. Nature Conservation Egypt Salwa Elhalawani
 Bird Hunting along the Mediterranean Coast of Egypt Socioeconomic study Nature Conservation Egypt Salwa Elhalawani Presentation Outline Context Objectives Methodology Findings Recommendations/Next Steps
Nasdaq Dubai AED TRADING HOLIDAYS AND SETTLEMENT CALENDAR 2018 For Equities Outsourced to the DFM (T+2)
") NasdaqDubai Circular No: 14 /2018 Date of Issue: 13 March 2018 Date of Expiry : Upon issue of replacement Circular Nasdaq Dubai AED TRADING HOLIDAYS AND SETTLEMENT CALENDAR 2018 For Equities Outsourced
NasdaqDubai Circular No: 14 /2018 Date of Issue: 13 March 2018 Date of Expiry : Upon issue of replacement Circular Nasdaq Dubai AED TRADING HOLIDAYS AND SETTLEMENT CALENDAR 2018 For Equities Outsourced
1 PEW RESEARCH CENTER
 1 SEPTEMBER 2018 POLITICAL SURVEY FINAL TOPLINE SEPTEMBER 18-24, 2018 N=1,754 QUESTIONS 1-2, 7-8, 11-13, 28 PREVIOUSLY RELEASED NO QUESTIONS 3-6, 9-10, 14-27, 29-32, 34-43, 47-49 QUESTION 33 HELD FOR FUTURE
African swine fever in domestic pigs and wild boar (ASF)
") African swine fever in domestic pigs and wild boar (ASF) Analysis of ADNS data since 01/2018 Reporting period: 2018-01-01 2018-12-09 Data query: 2018-12-10 AGES DSR Austrian Agency for Health and Food
African swine fever in domestic pigs and wild boar (ASF) Analysis of ADNS data since 01/2018 Reporting period: 2018-01-01 2018-12-09 Data query: 2018-12-10 AGES DSR Austrian Agency for Health and Food
Economic Overview. Melissa K. Peralta Senior Economist April 27, 2017
 Economic Overview Melissa K. Peralta Senior Economist April 27, 2017 TTX Overview TTX functions as the industry s railcar cooperative, operating under pooling authority granted by the Surface Transportation
Greater Manchester Police Hate Crime and Hate Incident Data 01/04/14 to 31/03/15
 Greater Manchester Police Hate Crime and Hate Incident Data 01/04/14 to 31/03/15 The data within this document is taken from a live database, and there is the potential that the information contained within
FREEDOM OF INFORMATION REQUEST
 FREEDOM OF INFORMATION REQUEST REQUEST NUMBER: FOI Request 003905-16 REQUEST DETAILS: As part of my research I am requesting information on the numbers of 'strip searches' that have taken place within
SEASONAL PRICES for TENNESSEE FEEDER CATTLE and COWS
 SEASONAL PRICES for TENNESSEE FEEDER CATTLE and COWS Tammy L. McKinley Extension Specialist Agricultural & Resource Economics economics.ag.utk.edu AE16-06 July 2016 TABLE OF CONTENTS Seasonal : Introduction...
DEC DASHBOARD. Positive Response Compliance DEC. Compliant Tickets : On-Time Performance Analysis. December % Late.
 Positive Response Compliance 215 Compliant 215 Non-Compliant 216 Compliant 216 Non-Compliant 1% 87% 96% 86% 96% 88% 97% 89% 97% 89% 98% 88% 97% 86% 96% 92% 97% 93% 97% 94% 97% 96% 97% 94% 97% 8% 6% 4%
Abel Tasman Birdsong Trust Trapping Report March 2017
 Abel Tasman Birdsong Trust Trapping Report March 2017 Introduction Traps are checked and baited by Abel Tasman Birdsong Trust volunteers approximately twice per month. The results for trap checking are
NCC Cable System Order
 Order # 62508883 Flight s 03/13/18-04/01/18 Syscode 2107 Agency Canal Partners Media System Name Spectrum/DISH- I+ Tampa-St. Pete, FL Advertiser Levine For Governor Phone (301) 951-2620 Credit Update 03/13/18
President and Chief Executive Officer Federal Reserve Bank of New York Washington and Lee University H. Parker Willis Lecture in Political Economics
 The U.S. Economic Outlook Chartspresented by WilliamC Dudley Charts presented by William C. Dudley President and Chief Executive Officer Federal Reserve Bank of New York Washington and Lee University H.
JAN DASHBOARD. Positive Response Compliance JAN. Compliant Tickets : On-Time Performance Analysis. January % Late.
 Positive Response Compliance 216 Compliant 216 Non-Compliant 217 Compliant 217 Non-Compliant 1% 96% 97% 8% 6% 4% 2% 4% 3% FEB MAR APR MAY JUN JUL AUG SEP OCT NOV DEC 8% Late Compliant Tickets : On-Time
LIFE HISTORY DIVERSITY AND RESILIENCE
 LIFE HISTORY DIVERSITY AND RESILIENCE SPRING CHINOOK IN THE WILLAMETTE RIVER BASIN Kirk Schroeder Brian Cannon Luke Whitman Paul Olmsted Oregon Department of Fish and Wildlife Corvallis Research Lab Thanks
Forecasting and Visualisation. Time series in R
 Time Series in R: Forecasting and Visualisation Time series in R 29 May 2017 1 Outline 1 ts objects 2 Time plots 3 Lab session 1 4 Seasonal plots 5 Seasonal or cyclic? 6 Lag plots and autocorrelation 7
PUBLIC MEETINGS. Please see the City of Geneva Public Meeting Guide for more information regarding City Council and Committee of the Whole meetings.
 PUBLIC MEETINGS Citizens are welcome and encouraged to attend all City of Geneva public meetings. Public meeting guests are also urged to participate in any of the City s many public meetings that take
GLMM standardisation of the commercial abalone CPUE for Zones A-D over the period
 GLMM standardisation of the commercial abalone for Zones A-D over the period 1980 2015 Anabela Brandão and Doug S. Butterworth Marine Resource Assessment & Management Group (MARAM) Department of Mathematics
UNIVERSITY OF CALIFORNIA Economics 134 DEPARTMENT OF ECONOMICS Spring 2018 Professor David Romer
 UNIVERSITY OF CALIFORNIA Economics 134 DEPARTMENT OF ECONOMICS Spring 2018 Professor David Romer LECTURE 2 OVERVIEW OF THE GREAT DEPRESSION January 22, 2018 I. THE 1920S A. GDP growth and inflation B.
Properties. terc.ucdavis.edu 8
 Physical Properties 8 Lake surface level Daily since 1900 The lowest lake level on record was 6,220.26 feet on Nov. 30, 1992. Since 1900, lake level has varied by more than 10 feet. Lake level typically
Greater Las Vegas Snapshot by Sale Type Last Month's Sold
 Available Units Pending Units Las Vegas Market Update - February 2018 Greater Las Vegas Snapshot by Sale Type Last Month's Sold Units Median List Price Average List Price Median Sold Price Average Sold
Nolan Doesken Colorado Climate Center
 Nolan Doesken Colorado Climate Center Presented to: Colorado Cattleman s s Association, Pueblo, CO, June 19, 2006 http://ccc.atmos.colostate.edu Prepared by Odie Bliss 1 Let s s Talk About Precipitation
Mogden Sewage Treatment Works
 Mogden Sewage Treatment Works Residents Liaison Meeting 7 December 2011 Thames Water Agenda Review of previous minutes Operations and communications Mosquito talk and survey results Sewage Treatment Work
LOWER YUBA RIVER ACCORD MONITORING ANNUAL ROTARY SCREW TRAPPING REPORT AND EVALUATION PLAN OCTOBER 1, 2008 AUGUST 31, 2009
 LOWER YUBA RIVER ACCORD MONITORING AND EVALUATION PLAN ANNUAL ROTARY SCREW TRAPPING REPORT OCTOBER 1, 28 AUGUST 31, 29 Prepared for: The Lower Yuba River Accord Planning Team by Casey Campos and Duane
Dear Volunteer: Sincerely, Anne Coles. President, Alberta Trappers Association. RFMA Log Book- Trapping Season 2017/18 Page 1
 Dear Volunteer: As part of our deliverables to the Government of Alberta under our Memorandum of Understanding (MOU) we are required to design and test a log book for use amongst our trappers working on
Fossil Creek Native Fish Repatriation 2009 Implementation Plan Arizona Game and Fish Department
 Fossil Creek Native Fish Repatriation 2009 Implementation Plan Arizona Game and Fish Department MONITORING: Annual monitoring is conducted for each species stocked, typically during late summer or early
Foreign overnights in the Nordic countries 2015
 Foreign overnights in the Nordic countries 2015 Sources: Statistics Statistics Statistics Statistics July 2016 VISIT FINLAND STATISTICS Contents Foreign overnights in the Nordic countries.4 Overnights
Appendix ELP El Paso, Texas 2003 Annual Report on Freeway Mobility and Reliability
 (http://mobility.tamu.edu/mmp) Office of Operations, Federal Highway Administration Appendix ELP El Paso, Texas 2003 Annual Report on Freeway Mobility and Reliability This report is a supplement to: Monitoring
SARASOTA BAY ESTUARY PROGRAM OYSTER HABITAT MONITORING RESULTS: YEAR 1. Jay R. Leverone
 SARASOTA BAY ESTUARY PROGRAM OYSTER HABITAT MONITORING RESULTS: YEAR 1 by Jay R. Leverone Mote Marine Laboratory 1600 Ken Thompson Parkway Sarasota, Fl 34236 to Gary Raulerson Sarasota Bay Estuary Program
Disease mapping in Public Health: from theory to practice?
 Disease mapping in Public Health: from theory to practice? David Rogers Oxford University, Department of Zoology, South Parks Rd., Oxford OX1 3PS, UK david.rogers@zoo.ox.ac.uk How to use risk maps What
2018 Annual Economic Forecast Dragas Center for Economic Analysis and Policy
 2018 Annual Economic Forecast Dragas Center for Economic Analysis and Policy PRESENTING SPONSOR EVENT PARTNERS 2 The forecasts and commentary do not constitute an official viewpoint of Old Dominion University,
Lake Taneycomo Fisheries Management. Shane Bush : Fisheries Management Biologist
 Lake Taneycomo Fisheries Management Shane Bush : Fisheries Management Biologist Lake Taneycomo Empire District Electric Company Impoundment Completed in 1913 2,8 acres 22 miles long Lake Taneycomo Table
Greater Las Vegas Snapshot by Sale Type Last Month's Sold
 Available Units Pending Units Las Vegas Market Update - April 2018 Greater Las Vegas Snapshot by Sale Type Last Month's Sold Units Median List Price Average List Price Median Sold Price Average Sold Price
Danish gambling market statistics First quarter 2017
 Danish gambling market statistics First quarter 2017 6. juni 2017 Danish gambling market statistics 1 Introduction The Danish gambling market underwent a partial liberalisation in 2012, with the markets
Lamb Market Outlook. ASI New Orleans, TX January 25, David P. Anderson Professor and Extension Economist
 Lamb Market Outlook ASI New Orleans, TX January 25, 2019 David P. Anderson Professor and Extension Economist Overview Usual Suspects Production Demand Prices The Usual Suspects Stocks Imports Weights Mil.
SWISS reports stable load factors
 SWISS Corporate Communications Phone: +41 (0)848 773 773 Fax: +41 (0)44 564 2127 communications@swiss.com SWISS.COM Media release Zurich Airport, October 10, 2008 SWISS reports stable load factors SWISS
Greater Las Vegas Snapshot by Sale Type Last Month's Sold
 Available Units Pending Units Las Vegas Market Update - July 2018 Greater Las Vegas Snapshot by Sale Type Last Month's Sold Units Median List Price Average List Price Median Sold Price Average Sold Price
Greater Las Vegas Snapshot by Sale Type Last Month's Sold
 Available Units Pending Units Las Vegas Market Update - June 2018 Greater Las Vegas Snapshot by Sale Type Last Month's Sold Units Median List Price Average List Price Median Sold Price Average Sold Price
Wind Regimes 1. 1 Wind Regimes
 Wind Regimes 1 1 Wind Regimes The proper design of a wind turbine for a site requires an accurate characterization of the wind at the site where it will operate. This requires an understanding of the sources
Greater Las Vegas Snapshot by Sale Type Last Month's Sold
 Available Units Pending Units Las Vegas Market Update - December 2018 Greater Las Vegas Snapshot by Sale Type Last Month's Sold Units Median List Price Average List Price Median Sold Price Average Sold
VEHICLE / PEDESTRIAN COLLISIONS
 VEHICLE / PEDESTRIAN COLLISIONS HRM: April 018 DISCLAIMER: All figures presented in this report reflect the information held on HRP systems at the time of data extraction and are subject to change without
MBA Economic and Mortgage Finance Outlook
 MBA Economic and Mortgage Finance Outlook MBA of Alabama Annual Conference June 7, 2017 Presented by Lynn Fisher Mortgage Bankers Association 1 Summary of the MBA Outlook 2016 2017 2018 2019 GDP Growth
September 2018 FY Key Performance Report
 September 20 FY 2019 - Key Performance Report Management Notes: The information in this report is based on the FY 2019 Operating Budget, adopted by the Board on June 11, 20. RT s farebox recovery ratio
2014 House Fly Densities around Dairies in Central Texas
 2014 House Fly Densities around Dairies in Central Texas Justin Gilliam and Sonja Swiger May 2014 October 2014 House flies pose a serious pest for barn/stable operators and dairy operators throughout the
INVASIVE BACTERIAL DISEASE SURVEILLANCE REPORT, 2010
 INVASIVE BACTERIAL DISEASE SURVEILLANCE REPORT, Emerging Infections Program Active Bacterial Core Surveillance (ABCs) Minnesota Department of Health Diseases included Group A Streptococcus page 5 Group
July 2015 Sept Cork City Pedestrian Counter Report
 July 2015 Sept 2015 Cork City Pedestrian Counter Report Disclaimer Cork City Council has produced this report based on information extracted from our Pedestrian Counter Monitoring System. Although care
CARTA East Cooper Transit Service Transportation Committee Town of Mount Pleasant. February 5, 2013
 CARTA East Cooper Transit Service Transportation Committee Town of Mount Pleasant February 5, 2013 Service Overview Study Overview East Cooper Service Analysis Provide additional analysis as a follow up
Clubhouse Reservations Calendar
 January 2018 1 New Year's Day 2 3 4 5 6 7:00 8:00 PM Bible Study Feb 2018 7 8 9 10 11 12 10:00 AM 12:00 PM Annual Meeting 13 14 15 Martin Luther King 16 21 22 23 7:00 8:00 PM Bible Study 10:00 AM 12:00
Coventry and Warwickshire Labour Market Summary
 Coventry and Warwickshire Labour Market Summary April 2013 research@warwickshire.gov.uk Introduction The Observatory has been commissioned to produce a quarterly labour market summary for the Coventry
May 2018 MLS Statistical Report
 Jan Feb Mar Apr May Jun Jul Aug Sep Oct Nov Dec January February March April May June July August Septem October Novem Decemb Days on Market The graph on the right illustrates the drastic decline in the
Tautog PID for Amendment 1. Presented to the Tautog Board August 5, 2015
 Tautog PID for Amendment 1 Presented to the Tautog Board August 5, 2015 February 2015 August 2015 Commission s Process & Timeline September-October 2015 November 2015 February 2016 March-April 2016 May
Drought and the Climate of the Ogallala Aquifer
 Drought and the Climate of the Ogallala Aquifer Nolan J. Doesken Colorado Climate Center Colorado State University Presented at Ogallala Symposium, Wray, Colorado February 20, 2006 Prepared by Odie Bliss
Adaptation to climate variation in a diversified fishery:
 Adaptation to climate variation in a diversified fishery: The West Coast groundfish trawl fishery Lisa Pfeiffer Northwest Fisheries Science Center, NOAA Fisheries Seattle, Washington USA The West Coast
Inlet Specific and Seasonal Variation in Vessel Use Patterns: The case of the Northeast Florida Region
 Inlet Specific and Seasonal Variation in Vessel Use Patterns: The case of the Northeast Florida Region Nancy Montes Robert Swett University of Florida Automatic Identification System (AIS) Ships 300 or
CUPSIM Water Supply Variability Study All information subject to change.
 . 1 IN A NUTSHELL The CUP Water Supply Variability Study is an opportunistic, proactive example of responsible water system management The CUP is very complex and approaching full demand The study capitalizes
Replenishment of corals and fish through recruitment
 Replenishment of corals and fish through recruitment KIMBERLEY MARINE RESEARCH PROGRAM WAMSI PROJECT 1.1.2 MARTIAL DEPCZYNSKI - AIMS Importance of recruitment process - corals Underlies the replenishment
May 2018 FY Key Performance Report
 May 20 FY 20 - Key Performance Report Management Notes: The information in this report is based on the FY 20 Operating Budget, Amendment 2, adopted by the Board on January 22, 20. RT s farebox recovery
Global Climate Change: Just the Facts
 Global Climate Change: Just the Facts Nolan Doesken State Climatologist, Colorado Climate Center Atmospheric Science Department Colorado State University Presented at Club 20 Fall Meeting, Grand Junction,
2014 Annual Report Town of Windsor Mosquito Control Program
 2014 Annual Report Town of Windsor Mosquito Control Program Colorado Mosquito Control 7000 North Broadway Suite 108 Denver, CO 80221 Tel (303) 428-5908 Fax 866-929-1204 Website: www.comosquitocontrol.com
Brian Cheuvront, Ph.D. SAFMC Deputy Executive Director for Management
 Brian Cheuvront, Ph.D. SAFMC Deputy Executive Director for Management
JULY 2013 RIDERSHIP REPORT MTA METRO-NORTH RAILROAD EXECUTIVE SUMMARY
 Ridership Report JULY 2013 RIDERSHIP REPORT MTA METRO-NORTH RAILROAD EXECUTIVE SUMMARY July July 2013 Total MNR System Ridership was 7.346 million vs. 7.439 million in July 2012, a decrease of 92,959 passengers
January 2017 Calendar MAJORS FIELD LITTLE LEAGUE
 January 2017 Calendar Dec 2016 January 2017 1 2 3 4 5 6 7 NEW YEARS DAY HOLIDAY CLOSED Feb 2017 8 9 10 11 12 13 14 15 16 17 18 19 20 21 MARTIN LUTHER KING CLOSED 22 23 24 25 26 27 28 29 30 31 Notes: February
INVASIVE BACTERIAL DISEASE SURVEILLANCE REPORT, 2016
 INVASIVE BACTERIAL DISEASE SURVEILLANCE REPORT, 26 Emerging Infections Program Active Bacterial Core Surveillance (ABCs) Minnesota Department of Health Diseases Included Group A Streptococcus page 5 Group
Recent Events in the Market for Canadian Snow Crab
 Recent Events in the Market for Canadian Snow Crab Overview The quantity of snow crab produced and exported by Canada increased dramatically through the late 1990s, but has levelled off and remained quite
Comprehensive Incentives for Reducing Chinook Salmon Bycatch in the Bering Sea Pollock Fleet: Individual Tradable Encounter Credits
 Comprehensive Incentives for Reducing Chinook Salmon Bycatch in the Bering Sea Pollock Fleet: Individual Tradable Encounter Credits Hao Ye, Keith Criddle, George Sugihara RMA 2010 Helsinki, Finland BSAI
Western University Unsealed Nuclear Substance Contamination Monitoring Record
 Western University Unsealed Contamination Monitoring Record Permit Holder: Room number: A. Indirect Monitoring (Wipe test using liquid scintillation counter or NaI counter) Counter Type: Make Model Contamination
SEMDAC MSC support and surveillance in Chile s EEZ, Desventuradas Islands and Easter Island. Laura Fontan Bouzas Fisheries Analyst, OceanMind
 SEMDAC MSC support and surveillance in Chile s EEZ, Desventuradas Islands and Easter Island Laura Fontan Bouzas Fisheries Analyst, OceanMind INTRODUCTION Established in 2015 Supports fisheries Monitoring,
Bicycle Crashes. Number of Bike Crashes. Total Bike Crashes. are down 21% and severe bike crashes down 8% since 2013 (5 years).
.") Bicycle Crashes The City of Fort Collins is well known for its bike culture, and there is a strong focus on encouraging increased riding. Bike safety is an important component of supporting these efforts.
Bicycle Crashes The City of Fort Collins is well known for its bike culture, and there is a strong focus on encouraging increased riding. Bike safety is an important component of supporting these efforts.
Bayesian workflow. Andrew Gelman Dept of Statistics and Dept of Political Science Columbia University, New York
 Bayesian workflow Andrew Gelman Dept of Statistics and Dept of Political Science Columbia University, New York Department of Biostatistics University of Washington, Seattle 26 Oct 2017 The (abridged)
January 2019 FY Key Performance Report
 January 2019 FY 2019 - Key Performance Report Management Notes: The information in this report is based on the FY 2019 Operating Budget, adopted by the Board on June 11, 20. RT s farebox recovery ratio
WATER WELL DRILLER AND PUMP INSTALLER LICENSING REPORT ADVISORY BOARD MEETING January 5, 2018
 WATER WELL DRILLER AND PUMP INSTALLER LICENSING REPORT ADVISORY BOARD MEETING January 5, 2018 Water Well Driller and Pump Installer FY 14 FY 15 FY 16 FY 17 1 st Quarter FY 18 New Licenses Issued 92 73
FOR RELEASE: TUESDAY, DECEMBER 11 AT 4 PM
 Interviews with 1,002 adult Americans conducted by telephone by Opinion Research Corporation on December 6-9, 2007. The margin of sampling error for results based on the total sample is plus or minus 3
ECRR and ARRN Technical Exchange Meeting / ARRN forum 2014 (29 Oct in Vienna, Austria)
") Study on ecological flow of Nanxi River (China) based on ecological conservation objective China Institute of Water Resources and Hydropower Research Beijing Runheng EEI CO., LTD October 29, 214 Overview
Study on ecological flow of Nanxi River (China) based on ecological conservation objective China Institute of Water Resources and Hydropower Research Beijing Runheng EEI CO., LTD October 29, 214 Overview
September 2017 MLS Statistical Report. Residential Inventory
 September 217 MLS Statistical Report Residential Inventory 2 2 1 1 21 216 217 Summary Inventories: Residential inventory is down 1%, Lots / Land inventory is down 13% and commercial inventory was down
The vertical and horizontal distribution of bigeye tuna (Thunnus( albacares) ) related to ocean structure
 ) related to ocean structure") 14 th PICES The vertical and horizontal distribution of bigeye tuna (Thunnus( obesus) ) and yellowfin tuna (Thunnus( albacares) ) related to ocean structure Eun Jung Kim 1,2, Suam Kim 1, Dae-Yeon Moon
14 th PICES The vertical and horizontal distribution of bigeye tuna (Thunnus( obesus) ) and yellowfin tuna (Thunnus( albacares) ) related to ocean structure Eun Jung Kim 1,2, Suam Kim 1, Dae-Yeon Moon
KC Scout Kansas City s Bi-State Transportation Management Center
 KC Scout Kansas City s Bi-State Transportation Management Center Operations Report May 216 This report contains statistical and operational data of activities at the Scout TMC for the period Sunday, May
NASDAQ DUBAI TRADING HOLIDAYS AND SETTLEMENT CALENDAR 2018 For Equities Outsourced to the DFM (T+2)
") Nasdaq Dubai Circular No : 71/17 Date of Issue : 24 December 2017 Date of Expiry : Upon issue of replacement Circular NASDAQ DUBAI TRADING HOLIDAYS AND SETTLEMENT CALENDAR 2018 For Equities Outsourced
Nasdaq Dubai Circular No : 71/17 Date of Issue : 24 December 2017 Date of Expiry : Upon issue of replacement Circular NASDAQ DUBAI TRADING HOLIDAYS AND SETTLEMENT CALENDAR 2018 For Equities Outsourced
Normet 1610B CT0032. This unit was not running and may need to be lifted on to transport.
 Normet 1610B CT0032 Make Normet Model 1610B Year 2007 Hours 9989 As at 14/07/2015 Mileage km As at Serial/VIN 602 Engine Serial Normet 1610B Charmec asset # CT0032 has a damaged man cage & will require
MALL CROSSING STUDY. Testing the Effectiveness Of the 4th Street East Crossing. For: City of Charlottesville Neighborhood Development Services
 MALL CROSSING STUDY One-Year Evaluation Final Report Testing the Effectiveness Of the 4th Street East Crossing For: City of Charlottesville Neighborhood Development Services May 2007 By: CHARLOTTESVILLE