Surfline s Long Beach Breakwater Surf Report
|
|
|
- Prudence Pope
- 5 years ago
- Views:
Transcription
1 Surfline s Long Beach Breakwater Surf Report Surf and Surfer Visit Analysis and Forecasts After Removal of Long Beach Breakwater By Sean Collins / Surfline June 23, 2009 This report has been requested by the Surfrider Foundation as per a feasibility study ordered by the City of Long Beach studying the possible removal of the Long Beach Breakwater, and the associated effects of the increased surf and resulting surfer visits to Long Beach. To understand the full impact of the many associated variables to this breakwater project, this report will cover the following topics: PART 1 The wave and surf climate of the Long Beach/North Orange County area including where these waves will originate, how these waves will be affected by local conditions such as offshore island wave shadowing and refraction over underwater bathymetry. PART 2 Analysis of the nearshore wave climate without the Long Beach Breakwater. Surfline s nearshore wave modeling will compare the wave action before and after the breakwater removal, potential nearshore currents and coastal erosion issues, and the estimation of the resulting surfing conditions throughout Long Beach. PART 3 A statistical analysis of Long Beach s potential annual surfing conditions after removal of the Long Beach Breakwater. More than five (5) years of Surfline daily observed surf reports were analyzed for nearby popular surfing areas in Seal Beach and South Bolsa Chica Beach to develop a comparative baseline. This detailed surf data included visually observed surf heights, overall surfing conditions, and other comments from specially trained surf reporters. A Surfability Index was developed to rate the daily quality of the surf for these adjacent areas to Long Beach. Additionally, detailed spectral wave model data from Surfline s wave models were compared and matched with the observed surf report data for further analysis. The Surfability Index and a Surfers Analysis was used to calculate the future annual expected surf conditions in Long Beach including numbers of surfable days and expected number of surfer visits for poor, medium, and good surfability years.

2 PART 1 NORTH ORANGE COUNTY, SEAL BEACH, LONG BEACH WAVE CLIMATE - The wave climate for the Long Beach/North Orange County area is extremely complicated as there are numerous variables and obstacles that need to be considered. Due to our ever present marine layer and haze, we often forget that there are a number of very large islands within miles offshore that typically do a very good job of blocking % of the swell and wave action headed to the Long Beach/North Orange County area. Additionally, Point Conception and the Palos Verdes peninsula to the northwest also block a great amount of swell. But there are swell windows where significant swell can pass through and reach our local beaches depending on the swell direction. SWELL WINDOWS The Surfline North Orange County/Long Beach swell window chart below displays open swell windows to the straight west ( degrees) and from the south ( degrees). All swells that arrive in Long Beach will pass through these windows, unless there happens to be a local storm just a few miles offshore inside of the islands.

3 After identifying the local swell windows and shadows caused by the offshore islands that limit the swell directions that can actually arrive in Long Beach, we can identify the specific regions throughout the Pacific Ocean from where storms can send swells to Long Beach. The sources of swell for Long Beach will be from: 1) The North Pacific when storms drop very far down to the south to obtain the straight westerly swell direction needed to pass through the west swell window. 2) Local wind-swell from strong winds inside of the offshore islands approaching from the west through the east/southeast. 3) South swells from hurricanes off Baja California, and strong long period south swells from intense storms down in the Southern Hemisphere 3,000 to 7,000 miles away. Offshore Islands Shadow regions in the chart below identifies areas from where all swell will be blocked by Point Conception and the offshore islands off the California coast. Special note: Swell Period is a term that will be used throughout this report, and is defined as the time in seconds between successive waves as they pass a stationary point. Swell periods of waves may vary greatly, but stronger wind speeds in a storm, blowing for longer durations, and blowing over greater distances of ocean, will transfer more and more energy into the ocean, resulting in greater wave heights and longer swell periods. Longer period swells extend wave energy deeper below the ocean surface. A long period swell of 20 seconds has energy extending 1,000 feet deep; while a shorter period swell of 12 seconds has energy extending only about 300 feet deep. As such, longer period swells can be greatly magnified and enhanced by the ocean floor, often resulting in much greater surf heights in some areas compared to others depending on the offshore bathymetry. This is a very important factor in determining the surf for Long Beach.


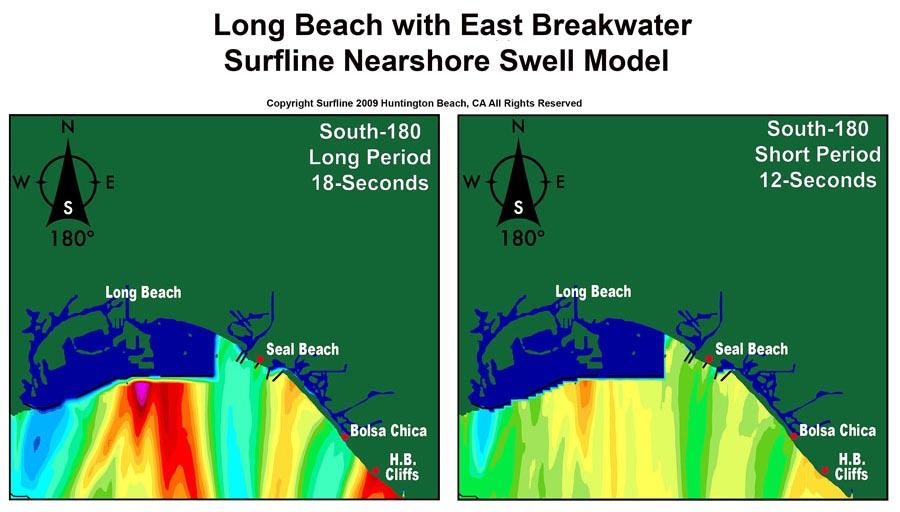
4 The Surfline Wave Model graphic below displays the Southern California swell windows and blocked island shadows. Wave sizes along the coast will change depending on the swell direction. Also notice how the swell energy along the coast focuses differently between the 18 second period and the 12 second period even though the swell direction is exactly the same. The longer 18 second period swell energy extends deeper below the ocean surface so it is more greatly focused by the underwater bathymetry contours of the ocean floor. The color legend indicates how much the swell height has changed from the original offshore swell height yellow. Notice the RED wave heights near Seal Beach for South-180, 18-Seconds.

5 LOCAL BATHYMETRY - In the Southern California swell model charts above, you may have noticed the extra red color at Long Beach on the South-180 Long Period 18-seconds chart indicating much larger waves. A huge variable we need to understand for the Long Beach/North Orange County region is the how the local bathymetry (the shape and topography of the ocean floor) in the San Pedro Channel can greatly enhance the wave heights nearshore. Geologically, millions and millions of years of sediment flowing out of the Los Angeles and San Gabriel rivers have built up and created the shallow water San Pedro Shelf that extends 10 miles offshore from Long Beach. The San Pedro Shelf acts like a magnifying lens that grabs the deep long period swell energy and compresses/compounds it into much larger, increased wave height nearshore. This process is called refraction, where waves will naturally turn and focus toward shallower water. The San Pedro Shelf extends 10 miles offshore, and the unique bathymetry at the foot depth 5-10 miles offshore greatly affects the longer period swell periods over 16 seconds. Additionally, longer period south swells approach the shelf at a perfect angle so they are magnified the most. West swells with longer periods are also magnified by the shelf but to a lesser extent, and most of that extra west swell wave energy is focused farther south in Surfside and Huntington. Another side effect of the San Pedro Shelf refracting long period south swells from the Southern Hemisphere was intermittent harbor seiching around the Pier J area in the Port of Long Beach and the US Navy Shipyard. Very long period, surging tidal pushes inside the harbor would slowly slosh around like in a bathtub, which would damage the ships tied up to the piers and stall the loading and unloading of containers. During the mid 80 s we participated with the US Navy in a study to research this problem, and we clearly concluded that the San Pedro Shelf sent refracted long period southerly swells right through the entrance of the Long Beach Breakwater toward the Pier J area. Afterward this discovery, a number of shipping companies subscribed to Surfline s surf forecasts to anticipate and plan around these long period south swell events. More recently, modifications have been built near the Pier J area to control this situation.

6 LONG BEACH SURF - We know that there is a considerable amount of wave energy offshore that can be focused to create very strong surf in the Long Beach area. Before the breakwater was built in the 1940 s, Long Beach was an internationally recognized good surfing beach that hosted numerous competitions. There was surf along the entire beach and the best waves were found at the flood control channel and at the southern end near the Alamitos Bay entrance. Currently with the breakwater in place, there is very little if any surf throughout the entire Long Beach area. There are very rare occasions when there will be some surf found at the eastern portion of the beach on the peninsula between Claremont and 72 nd Place. These waves occur primarily during very large south swell or west swell events, when a fraction of the original swell energy will refract and pass around the far eastern end of the breakwater. Additionally, during the wintertime we may occasionally experience strong, local pre-frontal winds out of the southeast, which create large, short period waves very close together that pass through the eastern breakwater gap. Coastal beach erosion is currently a significant problem in the peninsula area of Long Beach as all of the wave energy in the area approaches the beach from only one direction - the south/southeast. The breakwater blocks any other wave direction that might help to counteract and/or balance the erosion. The wave events that are the most damaging with coastal erosion in Long Beach are large, short period southeasterly swells that are generated by local pre-frontal southeasterly winds especially when they happen to coincide during a very high tide.

7 During the 60 s, there was a very popular surfing spot at 72 nd Place at the eastern end of the peninsula where I personally learned how to surf along with many other kids, including Jericho Poppler, a future 1970 World Champion. At that time there was a dredging operation every few years that took sand from the San Gabriel River in Seal Beach, and pumped it over to 72 nd Place on the Long Beach side. More sand in the 72 nd Place area created much better surf as the waves broke further offshore. Since that sand replenishment operation ceased the sand erosion problem throughout the entire peninsula area appears to have worsened as well as the quality of the surf in that area. Seal Beach is immediately adjacent to Long Beach and experiences much of the same bathymetry and offshore island shadowing variables that would affect Long Beach. As a result, Seal Beach is a great comparison of what the waves would be like should the breakwater be removed. South swells often create great surfing waves from the Seal Beach Pier to the San Gabriel River, and west swells also produce great surf throughout the entire stretch of Seal Beach down to the Anaheim Jetties. The largest waves in the Long Beach area will be generated by swells from the west, much the same as Seal Beach. The North Pacific storms that generate these swells are much closer to us so the waves will be larger, and the San Pedro shelf will also do a good job of focusing significant wave energy from the west swells into the Long Beach area.


8 During the El Nino, a series of massive storms created 25 foot breaking surf off the deep east end of the Long Beach breakwater. These waves also destroyed oil island Esther and the Seal Beach Pier. This photo at right shows one of the waves that broke over the top of Esther Island on March 1, After this large swell event Esther Island was converted to an oil platform 50 feet above the ocean surface, but there was some underwater rubble that remained to create an occasional good surfing wave on very large west swells. Below are examples of very large surf in Seal Beach on January 30, 1998, and also on December 21, Both of these large swell events were created by large storms that dropped very far to the south to create a long period second west swells that were able to pass through gaps in the offshore islands. There have been many additional days of strong swells in the Seal Beach area, but these days were exceptional because local weather conditions were very calm under a ridge of high pressure so surfing conditions were excellent for experienced surfers.


9 On this same day, December 21, 2005, Long Beach also had 3-5 foot surf near Claremont Ave where a fraction of the swell energy had wrapped around the southeast end of the breakwater.
10 PART 2 WAVE CLIMATE WITHOUT THE LONG BEACH BREAKWATER We know that the wave climate in Long Beach would change significantly without the Long Beach Breakwater. While the above photos of huge waves in Seal Beach are very impactful, we also need to realize that these big wave events are very rare occurrences that may only happen every few years. Seal Beach and Surfside manage these events very easily between November and March by building small temporary sand berms on the beach to control occasional overflow of water over the berm during the extreme high tide periods. During the usual medium to low tides these large waves have very little impact on the beach erosion or shoreline structures. To fully understand the impact on the local wave climate after the possible removal of the Long Beach Breakwater, we have included two Surfline Nearshore Model simulations of the before and the after effects of the removal. The modeling includes the two primary swell events that would pass through the offshore islands and greatly affect the Long Beach area; a south swell from 180 degrees, and a west swell from 270 degrees. Additionally, we have modeled both south and west swell directions for two different swell periods - longer period swells at 18 seconds, and shorter period swells at 12 seconds - to compare the significant different results of wave energy on the beach. As we can see from Surfline s nearshore model graphics below, the comparative change in the Long Beach wave climate during these types of swell events would be significant if the breakwater were removed. In the model we can clearly observe how the San Pedro shelf will greatly focus and magnify the South swell 18-second long period energy into much larger waves than what would be normally expected. The increased surf in both of these simulated wave events would certainly help local surfing and water circulation in the area. There would also need to be significant research toward the strengthening of shoreline structures, possible beach erosion, and modification of the offshore oil islands that would be most affected during high tide periods. In these Nearshore Model graphics, the colors represent the percentage (%) of nearshore swell energy AFTER the effects of offshore island wave shadowing, diffraction of energy around the islands, and most importantly after the refraction of the swell energy over the shallow water bathymetry offshore including the San Pedro Shelf. The yellow color represents 100% of the original offshore swell energy in deep water, the greens and blues represent much less swell energy, and the reds and purples represent much more swell energy than the original offshore swell height.
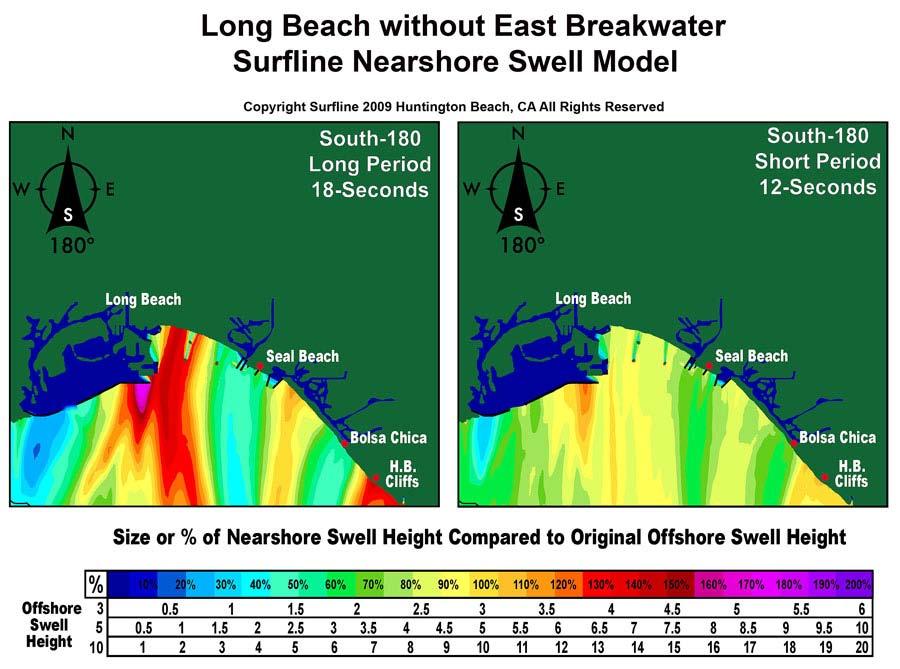
11
12
13 COASTAL EROSION - Erosion of the beach is also a major concern, and an imbalance of wave energy along the beach is almost always a significant factor, as is currently the case with Long Beach. The only wave action that can arrive in Long Beach is from the southeast, through the gap between the Alamitos Bay jetty and the Long Beach Breakwater. As a result, 100% of the annual wave action scours the beach from east to west creating severe beach erosion along the peninsula, and sand accretion or buildup from that erosion near Claremont Ave. Most normal beaches have an equal balance of wave action with a natural ebb and flow of sand transport up and down the beach as per the seasonal southerly and westerly swell directions. The Long Beach Breakwater prevents that natural ebb and flow of wave action to balance the sand transport along the beach, which significantly contributes to the erosion along the peninsula. A phenomenon named SURF BEAT is an oscillation of water levels piled up along the beach due to the variance of increased or decreased wave action. Continuous wave action pushes more water up against the beach so water is trapped and the level will rise closer to the beach. The increased water level along the beach will try to balance itself by flowing to the area of least resistance. Rip tides are naturally formed along a beach with equally balanced wave action as the trapped water finds an escape back through the waves and out to sea. But at a beach with unequal, imbalanced wave action, where the waves are much larger at one end of the beach than the other, the water will always escape toward the area of beach with smaller wave action because it is the path of least resistance. As a result, a beach with imbalanced wave action like Long Beach will always have erosion issues. There is strong evidence that removal of the Long Beach Breakwater would improve long term erosion by allowing more equally balanced wave action along the beach. Obviously there would need to be more complete and detailed studies to accurately model long shore sand transport and erosion should the Long Beach Breakwater be removed. But the current beach erosion problem is certainly at its worst case scenario with the only wave action possible from the southeast, which will always scour the beach along the peninsula from east to west. SURF AND CURRENTS - Assuming the Long Beach Breakwater was not in place, the map below indicates where the strongest surf would be on a long period west swell along with the general current flow. The remaining middle breakwater and Port of Long Beach structure would continue to protect the Downtown Marina area from the bulk of a west swell, but the surf size and west swell energy would increase quickly moving eastward down the beach toward 72 nd Place and the Alamitos Bay jetties. The yellow X s indicate where we would expect the best quality surf to be with the most size, while also offering the best shaped waves for surfing. The overall wave action would be much more balanced along the beach than currently, and the blue arrows indicate the there would be some accretion of sand building up near the peninsula during these swells.

14 South swells will typically come from storms much farther away in the Southern Hemisphere or from hurricanes off Mexico, so south swells will be smaller than the more closely generated west swells. Nevertheless, the Long Beach coastline faces directly south toward the bulk of the south swell energy, and the San Pedro Shelf offshore will also greatly magnify and focus the south swell energy directly into Long Beach. The map below indicates where the strongest surf would be and the general current flow, and the yellow X s indicate where the best quality surf spots would be located. *** Of special note is the area closest to the Downtown Marina where an excellent quality surf spot could be located during a strong south swell.
15 When we do get larger swells throughout Southern California, the surf in many areas like Huntington and the LA South Bay will be too big and unmanageable for most surfers. As such, the quality of the surf suffers with poor shape, bad currents, or increased exposure to the wind. During these large swell events many surfers flock to Seal Beach (as they would also to Long Beach) so they can enjoy more manageable surfing conditions with cleaner conditions. Long Beach would offer even better surfing conditions than Seal Beach on occasion due to greater protection from southeast winds near the Alamitos Bay jetty, and protection from west winds near the Downtown Marina. Seal Beach and Long Beach (without the breakwater) would be very similar in wave climates. Contrary to the examples of occasional huge surf included earlier in this analysis that can definitely happen here, the surf is typically small most of the year due to the protection from the offshore islands and the Palos Verdes headland. The surf within the Seal Beach area is usually gentle due to a very gradual slope of the ocean floor within a few hundred yards off the beach. As a result, Seal Beach is a very popular beginning and intermediate surfing area due to the smaller and gentler surf most of the time. Long Beach would be very much the same, and would also be an excellent location for many of the surf school businesses popping up everywhere these days that are teaching people how to surf.
16 PART 3 SURFLINE OBSERVATIONS OF SEAL BEACH AND BOLSA CHICA TO DETERMINE THE POTENTIAL OF LONG BEACH SURF CONDITIONS AND SURFER VISITS WITHOUT THE BREAKWATER Surfline has been in the business of surf reporting current conditions and forecasting future swells since We have a team of specially trained surf reporters who accurately and consistently observe and report on surf heights, swell info, winds, related wave descriptions, additional comments, and overall surfing conditions rated with on a poor to excellent scale. Our surf reporting team gathers this information 365 days per year - for over 150 surf locations throughout the United States. For this project, we have accessed more than five (5) years of Surfline s surf report observations for the Seal Beach Pier and the South Bolsa Chica locations for the entire period between January 1, 2004 and May 15, The primary surf locations at both of these spots have approximately 1,000 feet of beach and surfing area. Seal Beach is located immediately adjacent to Long Beach and it offers the most direct comparison to the potential local surf climate of Long Beach without the breakwater. The Southern Bolsa Chica surf spot we monitored is about six miles southeast of Long Beach, which offers improved exposure to all swells from the south and west so the waves there are typically larger on average than Seal Beach, or potentially Long Beach. Farther south, Huntington Beach has even more exposure to all swells and has consistently larger surf. Our goal in analyzing the Surfline observational surf data is to be able use it to estimate the potential overall surfing quality in Long Beach without the breakwater, how many days per year would have certain quality surfing conditions, and how many people per year would arrive to surf these waves. To accomplish this we developed a SURFABILITY INDEX to rate overall surfing conditions, and a SURFERS ANALYSIS to estimate the number of visiting surfers. The Surfability Index uses a 1-5 scale to rate the overall surfing quality and conditions: 1 - BAD ~ Either flat and/or no surf at all (currently at Long Beach) or adverse and stormy conditions when very few people would be in the water at all. 2 - POOR ~ Rideable surf but either small, bumpy from the wind, poor wave shape, or a combination of all. Not good surf for advanced surfers but often very good for beginners. 3 Fair ~ Very rideable surf with lots of waves. May be small and very clean or larger and not very clean, but most everyone will catch many waves. 4 Good ~ Very good surf with many consistent sizable waves and good shape. Water surface conditions would also be clean with very little wind. 5 Excellent ~ Exceptional surfing conditions with perfect wave shape, sizable surf, lots of waves, and extremely clean water surface conditions. Maybe 1-2 days a year.


17 The SURFERS ANALYSIS estimates the number of surfers in the water at a specific 1000 foot wide surf area between Sunrise and Noon, and is directly affected by the Surfability Index, but there are also many other variables that are considered in the Surfers Analysis formula: Overall popularity and general surf quality of surf spot location High density very popular and crowded with lots of surfers Medium density somewhat popular with a medium crowd Low density not very popular so the surfers are more spread apart Weekday, weekend/holiday (more surfers on weekends and holidays) Vacation time where a certain additional number of under-18 students would be surfing Diurnal shifts in the water as additional surfers may come and go throughout the morning. Typically there might be just as many surfers on the beach or in the parking lot coming and/or going as the number of surfers in the water. Access nearby parking availability, limitations, and/or cost of parking. SEAL BEACH - After we analyzed the Surfline report data (1961 days between ) we were able to develop the below chart showing the surf heights for Seal Beach at the 1000 foot primary High Density surfing area just north of the pier. The colors represent the percentage of all days with surf heights less than or equal to 2 feet; all days greater than 3 feet; all days greater than 4 feet; and all days greater than 5 feet. Special note: This chart shows we had smaller surf during , and larger surf during , a very good five year average in the data.
18 After analyzing the details of the daily Surfline observational reports, in which we compared the daily surf heights, surf conditions, comments, and reporter surf ratings for that day, a Surfability Index was developed for this Seal Beach 1000 foot wide surfing area. Finally, using the Surfability Index we were able to develop the Surfers Analysis for Seal Beach during the 1961 day period between January 2004 and May We backtracked and considered all of the multiple variables listed above in the Surfers Analysis explanation (total weekdays, weekends, holidays, vacation time, etc.) to calculate the total number of surfers for a 1000 foot multi density surfing area in Seal Beach. 250, , , ,000 50,000 0 SEAL BEACH SURFERS ANALYSIS Total Surfers: January 1, May 15, 2009 HD - 39,701 Avg/Year 109 Avg/Day MD - 23,821 Avg/Year 65 Avg/Day LD - 11,910 Avg/Year 33 Avg/Day 5.5 Year Total Per Each High, Medium, Low Density 1000' Surf Area


19 BOLSA CHICA - To analyze the South Bolsa Chica 1000 foot surfing area we used the same process as Seal Beach. The data in the chart below shows that there were many more days of surfable 3- foot or greater surf due to the better swell exposure of Bolsa Chica compared to Seal Beach. Once again, this chart also displays the trend of larger surf during versus , exactly the same as the trend experienced in Seal Beach. As we would typically expect with average larger surf at Bolsa Chica compared to Seal Beach, our Surfability Index was greater with more days of better surf.


20 Once again we used the Surfability index to adjust the many multiple variables to create the Surfers Analysis. The Bolsa Chica 1000 foot wide surfing area we observed is also a high density surf area like the Seal Beach area we analyzed. In Bolsa Chica there were more surfers on an average annual and daily basis due to the more consistent and larger surf. We also wanted to use an independent method to validate our Surfers Analysis formula and numbers so we spent extra time over the last couple of weeks specifically monitoring these areas to compare with our calculations. We actually counted the number of surfers in the water on multiple occasions during various types of Surfability Index conditions ranging from Poor to Fair. The calculations appeared to be very consistent with our direct observations. For example, the photo at right is at our Bolsa Chica analyzed area and the Surfability Index for this day is Poor to Fair with small 1-3 foot surf, but it is on a Memorial Day holiday. As such, our Surfers Analysis formula calculated 165 surfers in the 1000 foot wide area for these conditions. The area in photo to the right of the lifeguard tower is about 200 feet, and there are about 25 surfers in water in this area. The crowd density was about the same through the entire 1000 foot wide area, so there would be about 125 surfers in the water at this time. Considering there were at least an additional surfers lounging around in the parking lot, and additional surfers would come and go during this 4-5 hour morning surf period, our Surfers Analysis calculations appear to be very accurate. We completed this same validation exercise on multiple days in both of the analyzed Seal Beach and Bolsa Chica areas.

21 As evidenced by the numbers of surfers in the Seal Beach and Bolsa Chica areas, it s important to note that not all surfers are looking for perfect surfing conditions - especially with so many people recently taking up and learning the sport over the last 10 years. There are many new surf schools up and down the coast teaching the young and old how to surf. Good surfing waves are very hard to learn in, so beginners, many intermediates, and older surfers riding longboards prefer smaller waves when the Surfability Index may be overall poor to fair conditions like our Bolsa Chica example above. Seal Beach and San Onofre near San Clemente are more examples where the surf is usually small and poor for many surfers, but actually very good for beginners, some intermediates, and older surfers on longboards. Long Beach without the breakwater would offer a very similar scenario. LONG BEACH SURF - Once again, we believe the most accurate comparison for potential Long Beach surf without the breakwater is to use the Seal Beach Surfability Index. There would be days when Long Beach might actually be better than Seal Beach, and vice versa, but over the course of time the days will average out to be very close. The chart below shows our Long Beach Surfability Index calculation for the average number of surfable days per year, assuming there would not have been a breakwater to block the surf over the last 5.5 years. Most days would have been in the poor to fair range but still very surfable especially for beginning and intermediate surfers.

22 Using the Long Beach/Seal Beach Surfability Index data, we can now back into our Surfer Analysis formula to calculate the number of annual surfer visits to Long Beach during a medium year of surf. The Long Beach shoreline between the Downtown Marina and the Alamitos Bay jetty at 72 nd Place is about 3.8 miles or a little over 20,000 feet. We estimate there would be three (3) 1000 wide high density surfing areas, six (6) 1000 medium density surfing areas, and eleven (11) 1000 low density surfing areas. After we adjust for the number of weekdays, weekends, holidays, vacations, etc. we estimate an average of 394,200 annual surfer visits to Long Beach if the breakwater was not there to block the surf. For context, the California State Parks in San Clemente estimated about 330,000 annual surf visits along the 7000 stretch of surfing beach from Church to Cottons for The surf quality in this area is arguably much better than Seal Beach or Long Beach, but surfers also need to walk nearly a mile from the closest parking lot to reach the surf. Additionally, there are many more surfers in the immediate LA, Long Beach, Seal Beach, and Huntington areas than San Clemente. And the available surfing area at Long Beach would be nearly three (3) times larger than the Church to Cottons area. It is also important to note that the focus of this report is specifically on surfers, and the number of surfers that would be in the water during the 4-5 hour period between sunrise and Noon. In this analysis we have completely ignored how many other people may enjoy the surf through body surfing, body boarding, wave mats, kayaking, surf skis, kite surfing, wind surfing, or other surf related activities. During the summer the Blackball Flag goes up around Noon prohibiting surfing at spots like Seal Beach, Newport, and other surf beaches due to the increased number of swimmers in the water. During the Blackball period, there are just as many - if not more - non surfers in the water enjoying the surf through various means.

23 We also know we have good years for surf and bad years for surf. From the Surfline data we know the last couple of years have been somewhat poor compared to the previous few years. The chart below displays the Average, Bad, and Good outlooks for various years of surf and related surfer visits. As a baseline, we used the last 5.5 year average as an average year of medium surf and surfer related visits to develop our Surfability Index outlook. As surfers, most of us would love to see the surf come back to Long Beach. But in a practical and logical analysis, there would be numerous variables that need to be considered, significant adjustments that would need to be made to existing structures for protection against the increased surf, and in depth research concerning public safety. It appears very clear however, that removal of the breakwater would bring many surfers and beachgoers to Long Beach to enjoy the surf.


24 There was a very clear observation that became prevalent over a few weeks of travel between Seal Beach, Bolsa Chica, and Long Beach to gather research for this project, and that was the number of people who were on the beach or in the water depending on the surf. On Saturday, May 23 rd, 2009, the photos below were taken at Bolsa Chica and Seal Beach around Noon, and as normal there were lots of people in the water enjoying the surf. Yet within the exact same hour after traveling to Long Beach where there was absolutely no surf, hardly anyone was in the water, and there were very few people on the beach along the entire 3.8 mile beach coastline of Long Beach. Bolsa Chica Seal Beach Long Beach Long Beach Long Beach Long Beach


25 Long Beach Long Beach Long Beach Long Beach Surf in the ocean can be a double edged sword. When the ocean is angry, it is a huge force to be reckoned with and we don t dare turn our back on it. But on most days, surf can be similar to an amusement park or a snow resort in the mountains, where people will play and enjoy one of the world s most fascinating natural wonders. Thank you, Sean Collins President, Surfline scollins@surfline.com This report has been exclusively prepared for the Surfrider Foundation to provide to the City of Long Beach for the feasibility study of the removal of the Long Beach Breakwater. The material included is Copyright Sean Collins / Surfline 2009 with all rights reserved, or by the actual owners of the included photographs including Sean Collins, Tim Dorsey, Chris Sardellis, and Dave Stansfield. Any and all use of the content material within this report is intended to be used in the entire scope and context of this report. Any reference to any of the material included in this report should credit this report as the source of that information.
SURFLINE TEAHUPOO, TAHITI SURF REPORT
 SURFLINE TEAHUPOO, TAHITI SURF REPORT Historical Analysis of Swell Patterns in April & May, 1997 2009 Prepared for Billabong ~ by Sean Collins, July 2009 Billabong has requested assistance to choose improved
LAB: WHERE S THE BEACH
 Name: LAB: WHERE S THE BEACH Introduction When you build a sandcastle on the beach, you don't expect it to last forever. You spread out your towel to sunbathe, but you know you can't stay in the same spot
page - Laboratory Exercise #5 Shoreline Processes
 page - Laboratory Exercise #5 Shoreline Processes Section A Shoreline Processes: Overview of Waves The ocean s surface is influenced by three types of motion (waves, tides and surface currents). Shorelines
Delaware Chapter Surfrider Foundation - Indian River Inlet Monitoring
 Delaware Chapter Surfrider Foundation - Indian River Inlet Monitoring In 2012, the Delaware Surfrider Foundation Chapter formed the Surf Quality and Access Committee to focus on issues such as surf spot
Chapter 10 Lecture Outline. The Restless Oceans
 Chapter 10 Lecture Outline The Restless Oceans Focus Question 10.1 How does the Coriolis effect influence ocean currents? The Ocean s Surface Circulation Ocean currents Masses of water that flow from one
Shorelines Earth - Chapter 20 Stan Hatfield Southwestern Illinois College
 Shorelines Earth - Chapter 20 Stan Hatfield Southwestern Illinois College The Shoreline A Dynamic Interface The shoreline is a dynamic interface (common boundary) among air, land, and the ocean. The shoreline
OECS Regional Engineering Workshop September 29 October 3, 2014
 B E A C H E S. M A R I N A S. D E S I G N. C O N S T R U C T I O N. OECS Regional Engineering Workshop September 29 October 3, 2014 Coastal Erosion and Sea Defense: Introduction to Coastal Dynamics David
Chapter 22, Section 1 - Ocean Currents. Section Objectives
 Chapter 22, Section 1 - Ocean Currents Section Objectives Intro Surface Currents Factors Affecting Ocean Currents Global Wind Belts (you should draw and label a diagram of the global wind belts) The Coriolis
Lecture Outlines PowerPoint. Chapter 15 Earth Science, 12e Tarbuck/Lutgens
 Lecture Outlines PowerPoint Chapter 15 Earth Science, 12e Tarbuck/Lutgens 2009 Pearson Prentice Hall This work is protected by United States copyright laws and is provided solely for the use of instructors
Deep-water orbital waves
 What happens when waves approach shore? Deep-water orbital waves Fig. 9.16, p. 211 Wave motion is influenced by water depth and shape of the shoreline wave buildup zone surf zone beach Wave base deepwater
Beach Nourishment Impact on Beach Safety and Surfing in the North Reach of Brevard County, Florida
 Beach Nourishment Impact on Beach Safety and Surfing in the North Reach of Brevard County, Florida Prepared by John Hearin, Ph.D. Coastal Engineering Vice Chairman Cocoa Beach Chapter Port Canaveral Patrick
Oceans and Coasts. Chapter 18
 Oceans and Coasts Chapter 18 Exploring the oceans The ocean floor Sediments thicken and the age of the seafloor increases from ridge to shore The continental shelf off the northeast United States Constituent
Beaches Unit (4.5 pts)
") T. James Noyes, El Camino College Beaches Unit (Topic 6A) page 1 Name: Section: Beaches Unit (4.5 pts) Beaches and Shorelines Are Always Changing Waves are slowly and inexorably altering the shoreline,
T. James Noyes, El Camino College Beaches Unit (Topic 6A) page 1 Name: Section: Beaches Unit (4.5 pts) Beaches and Shorelines Are Always Changing Waves are slowly and inexorably altering the shoreline,
Earth Science Chapter 16 Section 3 Review
 Name: Class: Date: Earth Science Chapter 16 Section 3 Review Multiple Choice Identify the choice that best completes the statement or answers the question. 1. The movement of water that parallels the shore
Texas passes, longshore transport, hurricanes, beach erosion and sea level
 Texas passes, longshore transport, hurricanes, beach erosion and sea level Richard L. Watson, Ph.D. (361) 749-4152 Field work can be strange! 120,000 years of sea level Years each zone exposed above S/L
Unit 11 Lesson 2 How Does Ocean Water Move? Copyright Houghton Mifflin Harcourt Publishing Company
 Unit 11 Lesson 2 How Does Ocean Water Move? Catch a Wave A wave is the up-and-down movement of surface water. Catch a Wave Catch a Wave (wave effects) Surface waves are caused by wind pushing against
Ocean Currents Unit (4 pts)
") Name: Section: Ocean Currents Unit (Topic 9A-1) page 1 Ocean Currents Unit (4 pts) Ocean Currents An ocean current is like a river in the ocean: water is flowing traveling from place to place. Historically,
Name: Section: Ocean Currents Unit (Topic 9A-1) page 1 Ocean Currents Unit (4 pts) Ocean Currents An ocean current is like a river in the ocean: water is flowing traveling from place to place. Historically,
Reading Material. Inshore oceanography, Anikouchine and Sternberg The World Ocean, Prentice-Hall
 Reading Material Inshore oceanography, Anikouchine and Sternberg The World Ocean, Prentice-Hall BEACH PROCESSES AND COASTAL ENVIRONMENTS COASTAL FEATURES Cross section Map view Terminology for Coastal
IMPACTS OF COASTAL PROTECTION STRATEGIES ON THE COASTS OF CRETE: NUMERICAL EXPERIMENTS
 IMPACTS OF COASTAL PROTECTION STRATEGIES ON THE COASTS OF CRETE: NUMERICAL EXPERIMENTS Tsanis, I.K., Saied, U.M., Valavanis V. Department of Environmental Engineering, Technical University of Crete, Chania,
Comparison of Predicted and Measured Shoaling at Morro Bay Harbor Entrance, California
 Comparison of Predicted and Measured Shoaling at Morro Bay Harbor Entrance, California by Edward F. Thompson, Inocencio P. DiRamos, and Robert R. Bottin, Jr. PURPOSE: This Coastal and Hydraulics Engineering
The Impact on Great South Bay of the Breach at Old Inlet Charles N. Flagg School of Marine and Atmospheric Sciences, Stony Brook University
 The Impact on Great South Bay of the Breach at Old Inlet Charles N. Flagg School of Marine and Atmospheric Sciences, Stony Brook University The previous report provided a detailed look at the conditions
Shoreline Response to an Offshore Wave Screen, Blairgowrie Safe Boat Harbour, Victoria, Australia
 Shoreline Response to an Offshore Wave Screen, Blairgowrie Safe Boat Harbour, Victoria, Australia T.R. Atkins and R. Mocke Maritime Group, Sinclair Knight Merz, P.O. Box H615, Perth 6001, Australia ABSTRACT
Ocean Waves. Capillary. Gravity. Wind generated. Tides Tsunamis Seiches
 Ocean Waves Capillary Wind generated Gravity Tides Tsunamis Seiches Capillary waves are driven by the surface tension produced by electrically polarized water molecule San Pedro Lighthouse Waves are alternate
Ventura County. Open Pacific Coast Study. California Coastal Analysis and Mapping Project
 Ventura County Open Pacific Coast Study California Coastal Analysis and Mapping Project December 2011 Project Name: Meeting: Date and Time: Location: California Coastal Analysis and Mapping Project (CCAMP)/Open
WIND SPEED LENGTH OF TIME WIND BLOWS (Duration) DISTANCE OVER WHICH IT BLOWS (Fetch)
 DISTANCE OVER WHICH IT BLOWS (Fetch)") WAVES Up and down movement of ocean surface Transportation of energy across the water over vast distances If not stopped by anything, waves can travel entire oceans Size and speed depend upon: WIND SPEED
WAVES Up and down movement of ocean surface Transportation of energy across the water over vast distances If not stopped by anything, waves can travel entire oceans Size and speed depend upon: WIND SPEED
/50. Physical Geology Shorelines
 Physical Geology Shorelines Multiple Guess: (You know the drill 2 points each) 1. The path of movement of a water particle in a wave at sea is 1. circular 2. horizontal 3. vertical 4. elliptical 5. none
CHAPTER 8 ASSESSMENT OF COASTAL VULNERABILITY INDEX
 124 CHAPTER 8 ASSESSMENT OF COASTAL VULNERABILITY INDEX 8.1 INTRODUCTION In order to assess the vulnerability of the shoreline considered under this study against the changing environmental conditions,
CHAPTER 134 INTRODUCTION
 CHAPTER 134 NEW JETTIES FOR TUNG-KANG FISHING HARBOR, TAIWAN Chi-Fu Su Manager Engineering Department Taiwan Fisheries Consultants, Inc. Taipei, Taiwan INTRODUCTION Tung-Kang Fishing Harbor, which is about
Chapter - Oceans and Coasts
 Chapter - Oceans and Coasts Discussion: What do oceans contribute to the environment of Earth? How do Earth s major systems relate to the oceans? Oceans and Coasts Oceans are important - Thermal regulation
Imagine that you can see a side view of a wave as it approaches a beach. Describe how the wave changes as the wave approaches the beach.
 Geology 101 Name Reading Guide for Ch. 19: Shores and Coastal Processes (p. 612) Waves, Currents, and Tides (p. 614) Waves and Currents (p. 614) Imagine that you can see a side view of a wave as it approaches
Nearshore Sediment Transport What influences the loss of sediment on Beaches? - Waves - Winds - Tidal Currents - River discharge - Runoff
 Tides & Beaches Nearshore Sediment Transport What influences the loss of sediment on Beaches? - Waves - Winds - Tidal Currents - River discharge - Runoff Oceans Ocean Topography Physical Structure of the
OCEAN WAVES NAME. I. Introduction
 NAME OCEAN WAVES I. Introduction The physical definition of a wave is a disturbance that transmits energy from one place to another. In the open ocean waves are formed when wis blowing across the water
Name Class Date. Use the terms from the following list to complete the sentences below. Each term may be used only once. Some terms may not be used.
 Assessment Chapter Test B The Movement of Ocean Water USING KEY TERMS Use the terms from the following list to complete the sentences below. Each term may be used only once. Some terms may not be used.
Oceans in Motion: Waves and Tides
 Oceans in Motion: Waves and Tides Waves Waves are among the most familiar features in the ocean. All waves work similarly, so although we are talking about ocean waves here, the same information would
3.3 OCEANOGRAPHY/COASTAL PROCESSES
 3.3 OCEANOGRAPHY/COASTAL PROCESSES Beaches are dynamic and conditions vary based on the onshore/offshore movement of sand both seasonally and annually. Sand also moves alongshore within a generally defined
Directed Reading. Section: Ocean Currents. a(n). FACTORS THAT AFFECT SURFACE CURRENTS
. FACTORS THAT AFFECT SURFACE CURRENTS") Skills Worksheet Directed Reading Section: Ocean Currents 1. A horizontal movement of water in a well-defined pattern is called a(n). 2. What are two ways that oceanographers identify ocean currents? 3.
Skills Worksheet Directed Reading Section: Ocean Currents 1. A horizontal movement of water in a well-defined pattern is called a(n). 2. What are two ways that oceanographers identify ocean currents? 3.
Class Notes: Week 10. April 9 th,2019. Topics: Front and Mid-Latitude Wave Cyclones El Niño / La Niña Mid-term 2 review
 Class Notes: Week 10 April 9 th,2019 Topics: Front and Mid-Latitude Wave Cyclones El Niño / La Niña Mid-term 2 review Front- is a boundary between 2 different types of air masses Air masses with different
OCEANS. Main Ideas. Lesson 2: Ocean Currents Ocean Currents help distribute heat around Earth.
 Oceans Chapter 10 OCEANS Main Ideas Lesson 2: Ocean Currents Ocean Currents help distribute heat around Earth. Lesson 3: The Ocean Shore The shore is shaped by the movement of water and sand. OCEANS SO
Chapter. The Dynamic Ocean
 Chapter The Dynamic Ocean An ocean current is the mass of ocean water that flows from one place to another. 16.1 The Composition of Seawater Surface Circulation Surface Currents Surface currents are movements
Figure 4, Photo mosaic taken on February 14 about an hour before sunset near low tide.
 The Impact on Great South Bay of the Breach at Old Inlet Charles N. Flagg and Roger Flood School of Marine and Atmospheric Sciences, Stony Brook University Since the last report was issued on January 31
Coastal Environments Oceanographic and Engineering Expertise
 Coastal Environments Oceanographic and Engineering Expertise Coastal Environments La Jolla, CA www.coastalenvironments.com 14 May 2004 CE Ref. No. 04-05 EcoSystems Management Associates, Inc. Carlsbad,
Volume and Shoreline Changes along Pinellas County Beaches during Tropical Storm Debby
 Volume and Shoreline Changes along Pinellas County Beaches during Tropical Storm Debby Ping Wang and Tiffany M. Roberts Coastal Research Laboratory University of South Florida July 24, 2012 Introduction
Natural Bridges Field Trip Activity
 Natural Bridges Field Trip Activity This is due in class on MONDAY- March 1 - not in sections! Name TA: NOTE ON THE GRADING OF THIS ASSIGNMENT: Many of the questions below (especially in the tidepool part)
Nearshore Dredged Material Placement Pilot Study at Noyo Harbor, CA
 1 Nearshore Dredged Material Placement Pilot Study at Noyo Harbor, CA Noyo Cove N 2011 National Conference on Beach Preservation Technology 9-11, February 2011 Lihwa Lin, Honghai Li, Mitchell Brown US
Overview. Beach Features. Coastal Regions. Other Beach Profile Features. CHAPTER 10 The Coast: Beaches and Shoreline Processes.
 Overview CHAPTER 10 The Coast: Beaches and Shoreline Processes Coastal regions constantly change. The beach is a dominant coastal feature. Wave activity continually modifies the beach and coastal areas.
Exemplar for Internal Assessment Resource Geography Level 3. Resource title: The Coastal Environment Kaikoura
 Exemplar for internal assessment resource Geography 3.5A for Achievement Standard 91430 Exemplar for Internal Assessment Resource Geography Level 3 Resource title: The Coastal Environment Kaikoura This
Waves Part II. non-dispersive (C g =C)
") Waves Part II Previously we discussed Surface Gravity Waves Deep Water Waves Shallow Water Waves C g T 2 C g h dispersive (C g =C/2) Definitions: phase speed C= /T= /k non-dispersive (C g =C) group speed
Waves Part II Previously we discussed Surface Gravity Waves Deep Water Waves Shallow Water Waves C g T 2 C g h dispersive (C g =C/2) Definitions: phase speed C= /T= /k non-dispersive (C g =C) group speed
3/9/2013. Build house on cliff for a view of the ocean - be one with said view Pearson Education, Inc. Shorelines: summary in haiku form
 Introduction to Environmental Geology, 5e Edward A. Keller Shorelines: summary in haiku form Chapter 11 Coastal Processes Lecture Presentation prepared by X. Mara Chen, Salisbury University Build house
Risk Assessment. Compiled by: Lawrence Smith Date Compiled: 1 February 2009
 Risk Assessment Compiled by: Lawrence Smith Date Compiled: 1 February 2009 Location: Gwithian Date of Activity: Ongoing Activity: Kitesurfing on the sea and launching and landing of LEI kites on land.
UPPER BEACH REPLENISHMENT PROJECT RELATED
 ASSESSMENT OF SAND VOLUME LOSS at the TOWNSHIP of UPPER BEACH REPLENISHMENT PROJECT RELATED to the LANDFALL OF HURRICANE SANDY - PURSUANT TO NJ-DR 4086 This assessment is in response to Hurricane Sandy
VENICE LOCAL COASTAL PROGRAM UPDATE: COASTAL HAZARDS WELCOME
 VENICE LOCAL COASTAL PROGRAM UPDATE: COASTAL HAZARDS WELCOME 1 Introducing the Team Hosted by the Department of City Planning and grant funded in part by the California Coastal Commission 2 Workshop Purpose
OCEANOGRAPHY STUDY GUIDE
 OCEANOGRAPHY STUDY GUIDE Chapter 2 Section 1 1. Most abundant salt in ocean. Sodium chloride; NaCl 2. Amount of Earth covered by Water 71% 3. Four oceans: What are they? Atlantic, Pacific, Arctic, Indian
G. Meadows, H. Purcell and L. Meadows University of Michigan
 www.coj.net/departments/fire+and+rescue/emergency+preparedness/rip+current.htm G. Meadows, H. Purcell and L. Meadows Over 80% of all surf related rescues are attributable to Rip Currents According to the
New Jersey Coastal Zone Overview. The New Jersey Beach Profile Network (NJBPN) 3 Dimensional Assessments. Quantifying Shoreline Migration
 3 Dimensional Assessments. Quantifying Shoreline Migration") New Jersey Coastal Zone Overview The New Jersey Beach Profile Network (NJBPN) Objectives Profile Locations Data Collection Analyzing NJBPN Data Examples 3 Dimensional Assessments Methodology Examples Quantifying
New Jersey Coastal Zone Overview The New Jersey Beach Profile Network (NJBPN) Objectives Profile Locations Data Collection Analyzing NJBPN Data Examples 3 Dimensional Assessments Methodology Examples Quantifying
Baird. Innovation, Excellence & Service Oceans, Lakes & Rivers
 Profile Capabilities Innovation, Excellence & Service Oceans, Lakes & Rivers Baird provides professional engineering and technical services related to the design of coastal structures and facilities that
Chapter 10 Waves. wave energy NOT the water particles moves across the surface of the sea. wave form moves and with it, energy is transmitted
 Capillary Waves, Wind Waves, Chapter 10 Waves Anatomy of a Wave more like a real wave Tsunamis, Internal waves big waves huge waves rogue waves small waves more like a sine wave Wave direction Wave wave
Beach profile surveys and morphological change, Otago Harbour entrance to Karitane May 2014 to June 2015
 Beach profile surveys and morphological change, Otago Harbour entrance to Karitane May 2014 to June 2015 Prepared for Port Otago Ltd Martin Single September 2015 Shore Processes and Management Ltd Contact
General Coastal Notes + Landforms! 1
 General Coastal Notes + Landforms! 1 Types of Coastlines: Type Description Primary Coast which is essentially in the same condition when sea level stabilized Coastline after the last ice age, younger.
PROPERTIES OF NEARSHORE CURRENTS
 Terry Hendricks PROPERTIES OF NEARSHORE CURRENTS During this past year, we have initiated a program to obtain a better understanding of the properties of the currents flowing over the nearshore shelf area
Redondo Beach Boat Launch Ramp Facility
 Redondo Beach Boat Launch Ramp Facility Feasibility Report for the California Department of Boating and Waterways 2015 Grant Cycle For the City of Redondo Beach Submitted by March 13, 2014 Table of Contents
Orange County MPA Watch A n n u a l R e p o r t
 Orange County MPA Watch 2 0 1 4 A n n u a l R e p o r t WHAT IS AN MPA? Marine Protected Areas (MPAs) are discrete geographic marine or estuarine areas designed to protect or conserve marine life and habitat.
STATUS REPORT FOR THE SUBMERGED REEF BALL TM ARTIFICIAL REEF SUBMERGED BREAKWATER BEACH STABILIZATION PROJECT FOR THE GRAND CAYMAN MARRIOTT HOTEL
 August 23 STATUS REPORT FOR THE SUBMERGED REEF BALL TM ARTIFICIAL REEF SUBMERGED BREAKWATER BEACH STABILIZATION PROJECT FOR THE GRAND CAYMAN MARRIOTT HOTEL performed by Lee E. Harris, Ph.D., P.E. Consulting
2018 Beach Preservation Project Information
 QUICK FACTS Beach Renourishment to begin late April 2018 o U.S. Army Corps of Engineers project o Project Area: 8 th St. E. to end of E. Ashley Ave. o Project Length: 2 miles o Cost: $10,900,000 o Funding:
4/20/17. #31 - Coastal Erosion. Coastal Erosion - Overview
 Writing Assignment Due Monday by 11:59 pm #31 - Coastal Erosion Beach front property! Great View! Buy now at a great price! See main class web pages for detailed instructions Essays will be submitted in
Chapter 15 SEASONAL CHANGES IN BEACHES OP THE NORTH ATLANTIC COAST OF THE UNITED STATES
 Chapter 15 SEASONAL CHANGES IN BEACHES OP THE NORTH ATLANTIC COAST OF THE UNITED STATES By John M. Darling Hydraulic Engineer, Research Division U. S. Army Coastal Engineering Research Center Corps of
The Case of the Disappearing Shoreline
 Name The Case of the Disappearing Shoreline Humans change the earth's climate in many ways. One change is the increase of carbon dioxide in the atmosphere. As we burn more fossil fuels, we release more
NORTH HAVEN NORTH HAVEN SLSC
 NORTH HAVEN NORTH HAVEN SLSC Patrols: November to March, weekends and public holidays North Haven beach is the product of a major redevelopment of the northern part of the Adelaide coast. In the 1980s,
Cross-shore sediment transports on a cut profile for large scale land reclamations
 Cross-shore sediment transports on a cut profile for large scale land reclamations Martijn Onderwater 1 Dano Roelvink Jan van de Graaff 3 Abstract When building a large scale land reclamation, the safest
Preliminary analysis of wind data from South Channel Island
 Preliminary analysis of wind data from South Channel Island Introduction Many people expressed concern that deepening the shipping channel a further 5 metres at the Entrance to Port Phillip Bay would permanently
INTRODUCTION TO COASTAL ENGINEERING
 The University of the West Indies Organization of American States PROFESSIONAL DEVELOPMENT PROGRAMME: COASTAL INFRASTRUCTURE DESIGN, CONSTRUCTION AND MAINTENANCE A COURSE IN COASTAL DEFENSE SYSTEMS I CHAPTER
Chapter 20 Lecture. Earth: An Introduction to Physical Geology. Eleventh Edition. Shorelines. Tarbuck and Lutgens Pearson Education, Inc.
 Chapter 20 Lecture Earth: An Introduction to Physical Geology Eleventh Edition Shorelines Tarbuck and Lutgens The Shoreline: A Dynamic Interface The Coastal Zone The shoreline is constantly modified by
MAR 110 LECTURE #15 Wave Hazards
 1 MAR 110 LECTURE #15 Wave Hazards Rogue Wave Hazard Rogue waves are very large open ocean waves of sometimes can range in height from 60 ft (20m) to120 feet (40m) and thus a significant hazard to large
Anatomy of Coastal Regions
 The Coast I. BEACH ANATOMY Anatomy of Coastal Regions Terms for different parts of beaches and coastal regions Are all about ENERGY- ie, where the ocean s energy Mostly through tides and waves, and shape
Open Pacific Coast Study. California Coastal Analysis and Mapping Project
 Open Pacific Coast Study California Coastal Analysis and Mapping Project September 2012 California Open Coast Counties California Coastal Analysis and Mapping Project This publication is an initiative
4/20/17. #30 - Coastlines - General Principles Coastlines - Overview
 Writing Assignment Due one week from today by 11:59 pm See main class web pages for detailed instructions Essays will be submitted in Illinois Compass (instructions later) Pick one: Earthquakes, tsunamis,
Figure 1, Chart showing the location of the Breach at Old Inlet and sensors deployed in Great South Bay.
 The Impact on Great South Bay of the Breach at Old Inlet Charles N. Flagg and Roger Flood School of Marine and Atmospheric Sciences, Stony Brook University The Great South Bay project (http://po.msrc.sunysb.edu/gsb/)
HARBOUR SEDIMENTATION - COMPARISON WITH MODEL
 HARBOUR SEDIMENTATION - COMPARISON WITH MODEL ABSTRACT A mobile-bed model study of Pointe Sapin Harbour, in the Gulf of St. Lawrence, resulted in construction of a detached breakwater and sand trap to
USE OF SEGMENTED OFFSHORE BREAKWATERS FOR BEACH EROSION CONTROL
 .. CETN-III-22 4/84 PURPOSE: USE OF SEGMENTED OFFSHORE BREAKWATERS FOR BEACH EROSION CONTROL To provide information on the functional application of and general design considerations for using offshore
Inlet Management Study for Pass-A-Grille and Bunces Pass, Pinellas County, Florida
 Inlet Management Study for Pass-A-Grille and Bunces Pass, Pinellas County, Florida Final Report Submitted By Ping Wang, Ph.D., Jun Cheng Ph.D., Zachary Westfall, and Mathieu Vallee Coastal Research Laboratory
4/20/17. #32 - Coastal Erosion Case Histories - Lake Michigan
 Writing Assignment Due Monday by 11:59 pm #32 - Coastal Erosion Case Histories - Lake Michigan See main class web pages for detailed instructions Submit papers Illinois Compass No copying: Compass will
Technical Brief - Wave Uprush Analysis 129 South Street, Gananoque
 Technical Brief - Wave Uprush Analysis 129 South Street, Gananoque RIGGS ENGINEERING LTD. 1240 Commissioners Road West Suite 205 London, Ontario N6K 1C7 June 12, 2013 Table of Contents Section Page Table
El Niño Southern Oscillation. Pressure systems over Darwin Australia and Tahiti Oscillate Typically occurs every 4-7 years
 El Niño Southern Oscillation Pressure systems over Darwin Australia and Tahiti Oscillate Typically occurs every 4-7 years 1 2 What is it? Normal Conditions... What is it? During El Niño. 3 Local Effects
Australian Coastal Councils Conference
 Australian Coastal Councils Conference Kiama March 2019 Where Has My Beach Gone? (and what can I do about it?) Dr Andrew McCowan Water Technology Where Has My Beach Gone? Where Has My Beach Gone? Where
An Update of Coastal Erosion in Puerto Rico
 Jack Morelock and Maritza Barreto An Update of Coastal Erosion in Puerto Rico Department of Marine Sciences, University of Puerto Rico at Mayagüez and Geography Department, University of Puerto Rico at
2014 ANNUAL REPORT - TO THE CITY OF NORTH WILDWOOD ON THE CONDITION OF THE CITY BEACHES
 2014 ANNUAL REPORT - TO THE CITY OF NORTH WILDWOOD ON THE CONDITION OF THE CITY BEACHES View on September 25, 2014 looking northwest into Hereford Inlet. Considerable southerly expansion of the tip of
Name Date L.O: SWBAT explain what breezes, planetary winds, ocean currents & monsoons are.
 Name Date L.O: SWBAT explain what breezes, planetary winds, ocean currents & monsoons are. 1. A cool breeze is blowing toward the land from the ocean on a warm, cloudless summer day. This condition is
US Beach Nourishment Experience:
 Beach Nourishment: Introduction of new sand to the beach by truck or dredge Large beach >1 million cubic yards (100,000 dump truck loads) Funding is a combination of federal, state, local & private Also
Table 4. Volumetric Change Rates Pre-Project and Post-Project for the Town of Duck
 V. VOLUMETRIC CHANGES General Volumetric changes measured over the entire monitoring area for various time periods are provided in Table 4. The volume changes are given in terms of cubic yards/foot of
BEACH PROCESSES AND COASTAL ENVIRONMENTS
 BEACH PROCESSES AND COASTAL ENVIRONMENTS COASTAL FEATURES Cross section Map view TOPICS: Terminology Waves Beach Morphology Barriers Coastal Migration Tides Tidal Flats and Marshes Sediment Budgets Human
Advanced Series on Ocean Engineering - Volume 14 COASTAL STABILIZATION. Richard Silvester John R C Hsu. \v? World Scientific
 Advanced Series on Ocean Engineering - Volume 14 COASTAL STABILIZATION Richard Silvester John R C Hsu \v? World Scientific Contents PREFACE xv 1 INTRODUCTION 1 /. / Coastal Environment 2 J.2 State of Beach
COASTAL ENVIRONMENTS. 454 lecture 12
 COASTAL ENVIRONMENTS Repeated movement of sediment & water constructs a beach profile reflecting the balance between average daily or seasonal wave forces and resistance of landmass to wave action Coasts
El Niño Unit (2.5 pts)
") T. James Noyes, El Camino College El Niño Unit (Topic 9B) page 1 Name: Section: El Niño Unit (2.5 pts) El Niño is a warm ocean current that flows along the Equator and towards the west coast of South America
T. James Noyes, El Camino College El Niño Unit (Topic 9B) page 1 Name: Section: El Niño Unit (2.5 pts) El Niño is a warm ocean current that flows along the Equator and towards the west coast of South America
Surf Survey Summary Report
 Port Otago Limited 15 Beach Street Port Chalmers Surf Survey Summary Report August 13-September 1 Leigh McKenzie Summary of Surf Locations of Interest Port Otago Ltd is undertaking monitoring of changes
Ocean Waves and Surf Forecasting: Wave Climate and Forecasting
 Overview Ocean Waves and Surf Forecasting: Wave Climate and Forecasting Ocean regions Characterizing and describing ocean waves Wave theory, propagation, and dispersion Refraction, shadowing, and bathymetry
Wave-dominated embayed beaches. Andrew D Short School of Geosciences University of Sydney
 Wave-dominated embayed beaches Andrew D Short School of Geosciences University of Sydney Wave-dominated embayed beaches wave-dominated beaches embayed beaches morphodynamics of W-D embayed beaches circulation,
Coastal management has lagged behind the growth in population leading to problems with pollution
 Fifty percent of the population of the industrialized world lives within 100 km of a coast. Coastal management has lagged behind the growth in population leading to problems with pollution and natural
HARBOR INFRASTRUCTURE INVENTORIES Marquette Harbor, Michigan
 HARBOR INFRASTRUCTURE INVENTORIES Marquette Harbor, Michigan Harbor Location: Marquette Harbor is located in Marquette Bay on the south shore of Lake Superior, 160 miles west of Sault Ste. Marie, MI and
Low-crested offshore breakwaters: a functional tool for beach management
 Environmental Problems in Coastal Regions VI 237 Low-crested offshore breakwaters: a functional tool for beach management K. Spyropoulos & E. Andrianis TRITON Consulting Engineers, Greece Abstract Beach
Implications of changes to El Niño Southern Oscillation for coastal vulnerability in NSW
 Implications of changes to El Niño Southern Oscillation for coastal vulnerability in NSW By Thomas Mortlock (Thomas.mortlock@mq.edu.au) El Niño Southern Oscillation (ENSO) has a strong impact on weather
UNDERSTANDING STORM SURGE
 The Education Program at the New Jersey Sea Grant Consortium 22 Magruder Road, Fort Hancock, NJ 07732 (732) 872-1300 www.njseagrant.org UNDERSTANDING STORM SURGE ACTIVITY 6 SURGE OF THE STORM http://secoora.org/classroom/virtual_hurricane/surge_of_the_storm>