Sediment Dynamics of Warnbro Sound, Western Australia
|
|
|
- Marshall Young
- 5 years ago
- Views:
Transcription

1 Sediment Dynamics of Warnbro Sound, Western Australia Ben Hollings The University of Western Australia Centre for Water Research
2 Cover Photo: Warnbro Sound from the south, September 2004 (courtesy of Stuart Barr)
3 27 Timewell Street DIANELLA WA 6059 November 1, 2004 The Dean, Faculty of Engineering The University of Western Australia, NEDLANDS, WA 6009 Dear Sir, I have pleasure in submitting this thesis entitled SEDIMENT DYNAMICS OF WARNBRO SOUND, WESTERN AUSTRALIA as partial fulfilment for the combined degree Bachelor of Commerce (Investment Finance) / Bachelor of Engineering (Applied Ocean Science) with Honours. Yours Sincerely, Ben Hollings
4
5 i CONTENTS CONTENTS...i FIGURES...iv TABLES...vi TABLES...vi ABSTRACT...vii ACKNOWLEDGMENTS...ix 1 INTRODUCTION MOTIVATION AIM OBJECTIVES BACKGROUND (PREVIOUS STUDIES IN WARNBRO SOUND) Historical Surveys Sediment dynamics of Warnbro Sound (Pitchen, 1993) ENVIRONMENTAL SETTING LOCATION GEOMORPHOLOGY Formation of Warnbro Sound Geomorphic Setting METEOROLOGICAL CONDITIONS Anticyclonic high pressure systems Mid latitude depressions Tropical cyclones Sea breeze Extreme wind conditions...21
6 ii 2.4 WAVE CLIMATE Offshore Wave Climate Inshore Wave Climate LONG PERIOD WATER LEVEL FLUCTUATIONS Storm Surges Seiches Continental shelf waves MORPHODYNAMICS RELEVANT TO WARNBRO SOUND TRANSVERSE SAND BAR DYNAMICS LONGSHORE TRANSPORT SPIT DEVELOPMENT DUNES TOMBOLOS, SALIENTS & CUSPATE FORELANDS METHODS QUALITATIVE ESTIMATION OF NET SEDIMENT TRANSPORT Aerial Photographs NUMERICAL ESTIMATION OF LONGSHORE SEDIMENT TRANSPORT Numerical modelling of wind wave generation MODELLING THE EFFECT OF THE GARDEN ISLAND RIDGE ON SWELL REF/DIF1 Background REF/DIF1 Inputs APPLICATION OF THE PARABOLIC BAY SHAPE EQUATION TO TERN ISLAND Parabolic bay shape equation RESULTS & DISCUSSION QUALITATIVE ESTIMATION OF SEDIMENT TRANSPORT...49
7 iii Coastline movement plots Aerial Photographs - indicators of sediment dynamics NUMERICAL ESTIMATION OF SEDIMENT TRANSPORT Annual transport volumes Monthly Transport Volumes Limitations of the numerical modelling study NET SEDIMENT TRANSPORT PATHWAYS Transport into the Sound Transport within the Sound TERN ISLAND SAND BAR Formation, Migration & Maintenance Future of Tern Island FUTURE SHORELINE CHANGE Predicted future shoreline changes Effect of predicted changes on existing coastal infrastructure CONCLUSIONS RECOMMENDATIONS REFERENCES...79 APPENDICES...83 APPENDIX A APPENDIX A APPENDIX A APPENDIX B...90 APPENDIX C...94 APPENDIX D...100
8 iv FIGURES Figure 1.1: 1839 Survey of Warnbro Sound by J. S. Roe Figure 1.2: 1839 Survey of Peel Harbour by J. S. Roe Figure 1.3: 1859 Survey of Warnbro Sound (Historical Plan No. 302) Figure 2.1: Location map of Warnbro Sound (adapted from Searle & Seminuik, 1988) Figure 2.2: Bathymetry of Warnbro Sound (exaggerated vertical scale) Figure 2.3: 2004 Aerial photograph of Warnbro Sound Figure 2.4: Swell wave roses for the summer months (November - April) and winter months (May - October) (from Lemm, 1996) Figure 2.5: Seas wave roses for the summer months (November - April) and winter months (May - October) (from Lemm, 1996) Figure 3.1: Landward formation and propagation of a transverse bar (adapted from Carter, 1988) Figure 3.2: Linear spit development (from Silvester, 1987) Figure 3.3: Progressive development of a linear spit (from Silvester, 1987) Figure 3.4: Parabolic Dunes (adapted from Bird, 1972) Figure 3.5: Tombolos, salients & cuspate forelands (adapted from Masselink, 2003) Figure 4.1: SWAN wave modelling design Figure 4.2: Map of beach profile sites Figure 4.3: Map of sounding profile locations used Figure 4.4: Wave headland beach relationship for a bayed beach in static equilibrium (from Klein, 2003) Figure 5.1: Areas of coastline movement plots... 49
9 v Figure 5.2: Photo showing relevant indicators of sediment dynamics Figure 5.3: Sand shoal meeting the shore near Becher Point (2000) Figure 5.4: Shore normal groyne in the south of Warnbro Sound (02/1987) Figure 5.5: Shore normal groyne in the south of Warnbro Sound (11/1990) Figure 5.6: Warnbro Beach Dunes (high resolution aerial photographs not available) Figure 5.7: Penguin Island Tombolo (2000) Figure 5.8: Estimated annual longshore transport volumes at each of the profile sites (m 3 yr -1 ).. 56 Figure 5.9: Estimated annual longshore transport volumes at each of the sounding sites (m 3 yr -1 ) Figure 5.10: Estimated 2003 monthly longshore transport volumes (Profiles) Figure 5.11: Estimated 2003 monthly longshore transport volumes (Soundings) Figure 5.12: Conceptual model of net sediment transport Figure 5.13: Safety Bay Figure 5.14: Safety Bay Figure 5.15: REF/DIF1 Output for prevailing swell Figure 5.16: Predicted equilibrium bay shape of the western side of Tern Island (1) Figure 5.17: Predicted equilibrium bay shape of the western side of Tern Island (2) Figure 5.18: Predicted equilibrium bay shape of the western side of Tern Island (3) Figure 5.19: Predicted equilibrium bay shape of the eastern side of Tern Island Figure 5.20: Current Safety Bay infrastructure Figure 5.21: Waimea Street Boat Ramp Figure 5.22: Safety Bay Yacht Club Jetty... 75
10 vi TABLES Table 2.1: Principal storm (extreme wind) types in Cockburn Sound (from Steedman, 1982) Table 2.2: Estimated extreme wave heights for various return periods, offshore from Perth in 48m of water (from Lemm, 1999)... 25
11 vii ABSTRACT Development of coastal infrastructure requires a detailed understanding of the coastal system. This understanding must incorporate knowledge of historical behaviour as well as some predictions of future shoreline change. Equipped with this information, coastal managers are able to mitigate problems associated with erosion and accretion of the coastal zone. In this context, the current study investigates past change and large scale sediment dynamics of Warnbro Sound, a micro tidal coastal basin in south-western Australia with a view to making predictions of future change. Qualitative and quantitative methods were used to establish areas of change and the sediment dynamics of the Sound. Three key areas of shoreline movement were identified within the Sound: Safety Bay, Becher Point and Mersey Point. It was found that shoreline change in the vicinity of Becher Point and Mersey Point, both cuspate forelands, is likely to be due to changes in the direction of incident wave energy through either breakdown of the Garden Island Ridge or altered weather patterns. The shoreline change in Safety Bay is likely to be entirely due to the effect of the Tern Island sand bar. Its presence has both altered the wave field of the area and provided a significant sediment source. It is also important that there has been little change to the east of the sand bar while extensive accretion has occurred to its west. Sediment dynamics of the Sound were investigated and it was found that the large scale sediment dynamics are the result of a combination of transport processes and can not simply be considered in terms of wind wave driven longshore transport. The contributions of cross shore transports along sand shoals on the north and south sand platforms as well as aeolian transport to the dunes in the central section of the Sound are both believed to be important in the consideration of sediment sources and sinks of the beach system. The effect of diffracted swell in causing an alongshore redistribution of sediment may also be important with the sediment dynamics of the region. The formation and evolution of the Tern Island sand bar was also investigated. It had been previously proposed that the Tern Island sand bar formed in a low energy zone created by the diffraction of swell waves passing through entrances in the Garden Island Ridge. This theory was tested using the combined refraction diffraction model REF/DIF1. It was found that under the prevailing swell regime of SW waves with a period of 9 seconds and significant wave height of 2 m, a zone of relatively low energy occurred in the area that the sandbar appeared to initially
12 viii form. It was determined that the sand bar would remain a feature of Safety Bay into the foreseeable future with possible spit formation from the tail of the bar suggesting a return to a situation similar to that in 1839 where a partially vegetated sand spit enclosed a body of water termed Peel Harbour. In order to gain a full insight into sediment dynamics of the Sound regular monitoring is necessary at a range of scales.
13 ix ACKNOWLEDGMENTS I would like to thank my supervisors Dr Chari Pattiaratchi from the Department of Environmental Engineering (Centre for Water Research) and Dr Ian Eliot from the Department of Geography for their support and guidance. Huge thanks must go to Ailbhe Travers for her continual support, encouragement and assistance with field work. Rod Hoath, Steve Hearne and Stuart Barr from the Department of Planning and Infrastructure (DPI) are greatly acknowledged for supplying aerial photograph data. And finally to my family and friends, Thankyou
14 1. Introduction 10 1 INTRODUCTION 1.1 Motivation During the past few decades significant change has occurred in the shoreline planform of Safety Bay, in the north of Warnbro Sound. These changes include a shift from erosion problems to those associated with accretion. In 1964 a rock wall was constructed to protect Arcadia Drive from the retreating shoreline, now due to the effects of the Tern Island sand bar some jetties and boat ramps in Safety bay are unusable due to sedimentation. An understanding of the large scale sediment dynamics of Warnbro Sound is necessary to enable predictions of future changes to the shoreline planform. This includes understanding the processes controlling the key sediment movement pathways within the Sound as well as the reasons behind the formation of the Tern Island sand bar. This will allow existing and proposed coastal infrastructure to be planned sufficiently to minimise continued problems associated with the dynamic coastline of the region. 1.2 Aim The aim of this project is to investigate the large scale sediment dynamics of Warnbro Sound and to predict future shoreline change. An additional aim of the study is to build on the work done by Pitchen (1993) investigating the formation and maintenance of the Tern Island sand bar. 1.3 Objectives The following objectives will be carried out to achieve these aims. Evaluation of historical coastline change using aerial photograph records. Qualitative estimation of net sediment transport pathways. Estimation of longshore sediment transport volumes through the use of numerical modelling techniques.
15 1. Introduction 11 Development of a conceptual model of net sediment movement in Warnbro Sound based upon past changes, qualitative observations and numerically estimated longshore transport rates. Investigation of the formation, maintenance and migration of the Tern Island sand bar. Prediction of future coastline change, particularly in the Safety Bay area. 1.4 Background (Previous studies in Warnbro Sound) Minimal work has been carried out on the wave climate and sediment dynamics of Warnbro Sound. While historical surveys were carried out in the 1800 s demonstrating the dynamic nature of the Safety Bay region, the only recent accounts are those given by Silvester (1987) in a review of the proposed Westport Canal Development, and Pascal Pitchen (1993) in an engineering honours thesis on the dynamics of the Tern Island sand bar. No studies have been undertaken to characterize the main sediment transport pathways within the Sound. This is an important focus for coastal managers interested in establishing the long-term utility of coastal infrastructure in the study area Historical Surveys Historical surveys of the Warnbro region are valuable in relation to the current study as they can be used as a baseline for the coastline to be compared against, particularly the Safety Bay region. The survey carried out by John Septimus Roe in 1839 (Figure 1.1 and Figure 1.2) shows the existence of a partially vegetated sand spit in the Safety Bay region, enclosing a body of water termed Peel Harbour. The same survey also shows a large accumulation of sand to the west of this spit. In the following survey carried out in 1859 (Figure 1.3), it is evident that the sand spit has prograded to join the shoreline, forming an enclosed water body. According to Carrigy (1956) in the hydrographic chart based upon an 1878 survey of the area by Commander Archdeacon (figure not available for this study) there is no trace of the sand spit or Peel Harbour (Carrigy, 1956). This sequence of changes shows that a significant sand movement occurred in the Safety Bay region between 1859 and This change is particularly relevant to the current situation of the Tern Island sand bar as it is believed to represent the initial stages of the spit enclosing Peel

16 1. Introduction Harbour. It may represent a long term cycle of sand movement, this will be discussed in further detail later (section 5.4, p66). Figure 1.1: 1839 Survey of Warnbro Sound by J. S. Roe 12


17 1. Introduction 13 Figure 1.2: 1839 Survey of Peel Harbour by J. S. Roe Figure 1.3: 1859 Survey of Warnbro Sound (Historical Plan No. 302)
18 1. Introduction Sediment dynamics of Warnbro Sound (Pitchen, 1993) The major outcome from Pitchen s study was the suggestion of a likely reason for the Tern Island sand bar s initial formation. He proposed that the sand bar formed as a result of dominant south-westerly swell waves entering Warnbro Sound through selective reef entrances and diffracting and refracting, resulting, resulting in low energy zones in which sediment deposition occurs. Another significant finding was the relationship between the shape and size of the bar and the occurrence of storm events. It was concluded that the time history of the sand bar can be related to the presence or absence of recent storm events suggesting that a dramatic increase in the size of the sand bank would indicate that a SW storm had recently occurred and that a reduction in the sand bank s size would indicate that south-westerly storms were less frequent and/or that recent NW storms had damaged the structure of the sand bank. This was suggested based upon sand bank changes and the theory of formation and maintenance; however the relationship is not backed up with any data. (ie: storm occurrences). While this theory hold some merit, it is unlikely that a reduction in size will occur due to less frequent SW storms, based upon the swell driven maintenance mechanism (see section 3.1, p30). He also found that Following periods of increased NW swell incidence, the sand bank attains a crescentic or S-shaped form these shapes are likely to be related to not only the occurrence of NW storms but also the sequence of wave directions due to storm events and calm periods. Pitchen (1993) examined the possible sediment sources for the sand bar and initially identified six possible sources: sands eroded from the Penguin Island tombolo; sands released from the depletion of seagrass beds; bare sands of the north and south sand platforms; sediments transported from regions south of Warnbro Sound; and sediments originating from within, and seaward of the Garden Island Ridge. He discounted sands eroded from the tombolo and sands released from the depletion of seagrass beds as major sources. He also discarded the possibility that the sand came from bare sand patches of sand on the north and south sands platforms on the grounds that the 1839 survey shows the north and south sands to be significantly smaller in 1837 than is currently the case. However this is inaccurate due to misinterpretation of the sand shoals shown on the survey as the sand platforms when in actual fact the sand platforms have been near to their current size and have not changed much over the past thousand years (Searle et al., 1988). It is likely that sands redistributed from these platforms can be a viable source to the sand bar. Upon considering the sediment supply possibilities the conclusion was reached that
19 1. Introduction 15 In terms of sediment supplies, the majority can be expected to originate from the south of Warnbro Sound and from the direction of the reef system, no consideration was given to how the sand reaches the region of sand bar formation, which is as important as the source. The current study aims to verify Pitchen s (1993) proposed method of initial sand bar formation as well as give further consideration to the sediment sources and maintenances mechanisms of the sand bar.

20 2. Environmental Setting 16 2 ENVIRONMENTAL SETTING 2.1 Location Warnbro Sound is a coastal basin located between S and S, approximately 30km south of Fremantle in south-western Australia. Figure 2.1: Location map of Warnbro Sound (adapted from Searle & Seminuik, 1988)

21 2. Environmental Setting 2.2 Geomorphology Formation of Warnbro Sound The Holocene evolution of the Sound is important in the consideration of the present sediment dynamics. While the dynamics of the system have changed as it has evolved, the main controls of the large scale sediment dynamics have consistently been the interaction of offshore wave energy with the eroding ridge systems, the abundant supply of sediments and the evolving bank structures (Searle et al., 1988). The incremental development pattern of Warnbro Sound over the Holocene established by Searle et al. (1988) gives an indication that the major sediment source to the Sound has been and is still likely to be from south of the Sound (Searle et al., 1988) Geomorphic Setting The geomorphology of the Warnbro region is primarily controlled by a series of shore parallel Pleistocene aeolianite ridges and the associated depressions; Five Fathom Bank Ridge; Sepia Depression; Garden Island Ridge; Cockburn Warnbro Depression; and Spearwood Ridge from west to east (Figure 2.1 and Figure 2.2) (Searle et al., 1988). The ridges in the area almost completely protect the Sound from offshore swell (Carrigy, 1956). Figure 2.2: Bathymetry of Warnbro Sound (exaggerated vertical scale) 17

22 2. Environmental Setting 18 Warnbro Sound is approximately 7 km long and 4 km wide consisting of three main sectors: the central deep basin and two extensive banks, the north and south sands platforms. The central basin has a relatively flat bottom with an average depth of approximately 17 m while the depth of the north sands platform ranges from 1 4 m and the south sands platform from 1 9 m. The shallow sections (north and south platforms) contain deposits of clean sands colonised by seagrasses while fine organic muds are deposited within the central basin (Carrigy, 1956). Figure 2.3: 2004 Aerial photograph of Warnbro Sound
23 2. Environmental Setting 19 Fronting the cental basin is Warnbro Beach, a narrow beach with a small offshore platform. It is characterised by a single high foredune in the central part of the beach, interrupted by blowouts and parabolic dunes. The planform of the Warnbro Beach coastline has remained static for a long period of time due to controls exerted by the Garden Island Ridge resulting in the normal approach of the incident swell waves (Silvester, 1987). Silvester (1987) suggested that Warnbro Beach is in a state of static equilibrium. This is questionable since, while there is a zero net sediment balance, significant sediment movement does occur, suggesting that dynamic equilibrium is more likely. A tombolo extends from Penguin Island to Mersey Point. It is formed by the diffraction of swell waves around Penguin Island. Carrigy (1956) drew attention to the seasonal changes experienced by the Penguin Island tombolo, generally being hooked to the north during the summer and to the south during the winter, possibly demonstrating a seasonal change to the longshore transport direction (Carrigy, 1956). In the northern section of the Sound (Safety Bay) a significant feature is the Tern Island sand bar, a transverse sand bar, which has developed over the past 60+ years. This sandbar has moved shoreward and joined the Safety Bay coastline, becoming a dominant feature of the area, considerably affecting the shoreline movement in its vicinity. The formation and maintenance of the Tern Island sand bar will be considered in more detail in 5.4, page 66. Another older sand bar exists to the east of the Tern Island sand bar. This has remained unchanged over the past few decades and has been partially stabilised by seagrasses. This will henceforth be termed the Berry Street sand bar. Becher Point in the south and Mersey Point in the north are two entirely sedimentary cuspate forelands which are maintained by the interaction of swell waves with the Garden island Ridge. Two prominent salients exist at the northern and southern ends of Warnbro Beach; these too are a result of swell interaction with the Garden Island Ridge (Silvester, 1987).
24 2. Environmental Setting Meteorological Conditions The prevailing wind climate of the Perth region is governed by an eastward moving subtropical belt of high pressure systems throughout the year. Winter conditions are characterised by periodic storm events associated with mid latitude depressions and summer conditions by the highly energetic sea breeze system (Masselink & Pattiaratchi, 2001) Anticyclonic high pressure systems The natural breakdown of the high pressure belt into eastward moving anticyclonic cells, results in a prevailing anticlockwise air circulation in this region. These systems pass the coast with a period of 3 10 days (Gentilli, 1972). During summer the high pressure belt is located between latitudes of S, it moves northward during autumn such that during winter it is located between S, it then returns southward during the spring. This seasonal movement of the high pressure belt results in summer westerlies (onshore) and winter easterlies (offshore) due to the anticyclonic circulation of the high pressure cells (Masselink & Pattiaratchi 2001). Another result of the prevailing circulation is the existence of calms or light winds for considerable periods, these occur throughout the year (Gentilli, 1972) Mid latitude depressions During summer mid latitude depressions, also termed extra tropical cyclones, are located too far south to directly affect the climatic conditions of the Perth region. However, during the winter months, the mid latitude depressions and the storms associated with them have a direct impact upon the region due to the northward displacement of the subtropical high pressure belt. These storms are most frequent during the month of July in which, on average, 3 occur per year (Gentilli, 1971). Winds experienced during the advance of a mid latitude depression are firstly from the north then shift to the northwest while increasing in intensity. These north-westerly winds are usually accompanied by strong gusts (Lemm et al., 1999). The winds then shift rapidly to westerly then south westerly as the depression passes the coast. These conditions then may continue for up to 36 hours before slowly moderating (Masselink & Pattiaratchi, 2001). Typical average wind speeds experienced during mid latitude depressions range from ms -1 with durations of between 10 and 40 hours (Steedman, 1982). While the strongest winds are from the NW, winds from the W and SW may be of greater duration (Silvester, 1987).
25 2. Environmental Setting Tropical cyclones Tropical cyclones are intense low pressure systems which form off the coast of northern Western Australia during the summer. Based on mean 10 year frequencies, Gentilli (1971) showed there to be a likelihood of one tropical cyclone every 10 years directly affecting the Perth region, occurring during the month of February (Gentilli, 1971). Although much of their energy has been dissipated before reaching the Perth region, tropical cyclones can still have a significant effect on the beach morphology. For example in 1978 Perth beaches were subject to extensive erosion due to the passing of tropical cyclone Alby (Lemm, 1996) Sea breeze The south-west Australian coast has one of the strongest sea breeze systems in the world with winds frequently exceeding 15 ms -1 with maximums of up to 20 ms -1 and a mean velocity of 8 ms -1 at the coastline (Pattiaratchi et al., 1997; Masselink & Pattiaratchi, 2000). Wind speeds due to the sea breeze along the south-western Australian coastline often approach storm wind intensities (Gentilli, 1971). And the sea breeze has been shown to be present more than 60% of the time during the summer months (Masselink & Pattiaratchi, 2001). The sea breeze system in this region is somewhat different to the classical system in that it blows in a predominately alongshore direction (from the south southwest) as opposed to onshore. Since the winds blow obliquely to the coastline, rather than normal to it, the wind waves generated by the breeze can generate a significant longshore current and the resultant littoral drift (Masselink & Pattiaratchi, 2001). In late summer autumn the energy of sea breeze generated wind waves may exceed that of the prevailing swell (Hegge et al., 1996). A study by Pattiaratchi et al. (1997) showed that in coastal regions sheltered from the direct impact of storm and swell wave activity, such as Warnbro Sound, locally generated wind waves, in particular those associated with strong sea breeze activity, play a dominant role in controlling nearshore and foreshore processes (Pattiaratchi et al., 1997) Extreme wind conditions Extreme wind conditions are of paramount importance to nearshore processes. They impart increased energy to the coastal zone and as such are the dominant control in sediment transport within the littoral zone. Extreme wind conditions in the study area include storm winds,
26 2. Environmental Setting 22 generated primarily by mid latitude depressions and sea breezes which often approach storm wind intensities (Gentilli, 1971). An account of the principal storm winds experienced in Cockburn Sound, located directly to the north of Warnbro Sound is given by Steedman (1982). This is outlined in Table 2.1, below, which shows that storms due to extra tropical cyclones (mid latitude depressions) generally have the longest duration and highest average wind speeds, hence the greatest effect on coastal processes (Steedman, 1982). Table 2.1: Principal storm (extreme wind) types in Cockburn Sound (from Steedman, 1982) Storm type Principle months of occurrence Typical storm average wind speed & duration Typical extreme 30 min average wind speeds Typical wind direction ms -1 All Directions Dissipating tropical December - April ms cyclone -1 (dependant on eye 5-15 hours location) ms -1 Squalls December - April 25 ms -1 All Directions 2-4 hours Extra tropical cyclones ("Gales") Tornadoes ("Cock- Eye-Bobs") ms -1 May - October ms -1 South south-west to hours north (?) ms -1 December - April 30 (?) ms -1 All Directions < 1 hour ms -1 Thunderstorms December - April 15 ms -1 All Directions 1-2 hours no measurements (estimated) A record of the number of storms occurring in the region over an unspecified 15 year period was compiled by Silvester (1987) showing an annual average of 8 storms per year. However over the period the frequency varied from 4 to 12 storms per year, demonstrating a considerable interannual variation. From this it follows that there will be the equivalent inter-annual variation in the effect of storms on coastal processes (Silvester, 1987). Long term variations in patterns of storminess and climatic changes in general may have a profound effect on coastal stability. These changes may involve a change in storm direction, storm frequency or storm intensity (Carter, 1988).
27 2. Environmental Setting Wave Climate Offshore Wave Climate The offshore wave conditions off Perth can be considered representative of offshore wave conditions for up to 200 km both north and south of Perth, which includes those off Warnbro Sound. This is due to generation of deep ware waves by large scale weather systems over the Indian and Southern Oceans resulting in little spatial variation in the deep water wave climate (Lemm et al., 1999). The offshore wave climate of the Perth region is characterised by moderate energy swell from the south to southwest and was described by Masselink & Pattiaratchi (2001) using four years ( ) of hourly, non-directional, sea surface elevation data, measured using the wave rider buoy located to the south-west of Rottnest Island in a water depth of 48 m. From this study, offshore waves were found to be characterised by an annual mean significant wave height of 2.2 m and period of 8.8 s (Masselink & Pattiaratchi, 2001). A similar outcome was obtained in a study by Lemm et al. (1999) which used 2.5 years (from March 1994 August 1996) of 20 min, non-directional, sea surface elevation data which was measured using the same wave rider buoy and found an annual mean significant wave height of 2.0 m and annual mean period of 8.8s (Lemm et al., 1999). The offshore wave climate of the Perth region is characterised by extreme seasonality. The mean significant wave conditions experienced during the summer period (December February) were found to be a wave height of 1.8 m and a period of 7.6 s, differing noticeably to those of the winter period (June August) where a mean wave height of 2.8 m and mean period of 9.7 s was found (Masselink & Pattiaratchi, 2001). This intra-annual variation was also observed by Lemm et al. (1999) who found that wave heights were lower, and varied over a lesser range in summer than in winter. It was also concluded that there is a seasonal change from moderate locally generated seas in summer, to larger swell and locally generated storm waves in winter, coinciding with the seasonal wind pattern of the summer sea breeze and the passing of mid latitude depressions during the winter (Lemm et al., 1999). Since swell waves are generated in the distant Indian and Southern oceans by mid latitude depression systems, the seasonal north and south movement of these systems due to the seasonal migration of the subtropical high pressure belt alters the swell approach direction. During the summer months, swell waves arrive primarily from the south southwest, while during the winter
28 2. Environmental Setting 24 months they arrive from the west southwest (Lemm et al., 1999). This is also demonstrated in the wave roses shown in Figure 2.4. The only available long term account of offshore wave direction for south-western Australia is provided by Scott (1980) who tabulated 18 years of sea and swell observations obtained from ship sea state observations carried out in the ocean approaches to Fremantle from the period This data was used by Lemm (1996) to create wave roses which show relative frequencies of sea and swell directions (Lemm, 1996). Figure 2.4: Swell wave roses for the summer months (November - April) and winter months (May - October) (from Lemm, 1996) Seas or locally generated wind waves generally retain similar direction to that of the winds which generated them. Therefore seasonal changes to the seas will correspond to seasonal changes in the wind field. In Figure 2.5 this is evident as summer seas have a consistent southerly direction and are clearly dominated by the southerly sea breeze, while the winter seas directions show more variability due to being generated primarily by the passage of storms, the wind direction s of which vary, primarily between SW and NW. Figure 2.5: Seas wave roses for the summer months (November - April) and winter months (May - October) (from Lemm, 1996)
29 2. Environmental Setting Extreme offshore wave conditions An extreme wave analysis of the offshore Perth wave climate was conducted by Lemm et al. (1999) based on 12 years of storm wave data (including 112 storms) using the conditional Weibull method. From this analysis extreme offshore wave heights for various return periods could be estimated and the findings are given in Table 2.2, below (Lemm et al., 1999). Table 2.2: Estimated extreme wave heights for various return periods, offshore from Perth in 48m of water (from Lemm, 1999) Return period (years) Estimated offshore Hs (m) Inshore Wave Climate The inshore region of Warnbro Sound is almost completely protected from offshore wave energy by the shore parallel offshore limestone reef systems discussed earlier (Five Fathom Bank & Garden Island Ridge) (Carrigy, 1956). Due to the effects of refraction and dissipation at the reef, no energy will be transmitted past it. Thus, the only energy which can enter the Sound is through the major gaps in the reef, where even if the opening does not extend down to the sea floor the majority of the wave energy passes through. The transmission of wave energy through the gaps will also be strongly dependent upon the angle of wave approach which determines the effective gap width. Silvester (1987) found that the total gap width available to SW waves is 450 m while that available to NW waves is 625 m (Silvester, 1987). While Silvester proposes that no energy will pass over the reef, it is likely that this will depend upon the period of the waves as well as the depth of water over the reef. Longer period swell waves will be attenuated considerably more than shorter period wind waves (Lemm et al., 1999). Higher water levels will allow the passage of more wave energy into the Sound by allowing higher period waves to be transmitted over the reef. This is particularly relevant during storms where relatively low barometric pressure in combination with strong onshore winds can generate significant storm surge, increasing the water level and allowing more of the highly energetic storm wave energy into the Sound.
30 2. Environmental Setting 26 It has been demonstrated that in coastal regions sheltered from the direct impact of storm and swell wave activity, such as the case in Warnbro Sound, locally generated wind waves may play a dominant role in controlling nearshore and foreshore processes (Pattiaratchi et al., 1997). The heights of these locally generated wind waves will depend upon wind conditions including speed, direction and duration as well as basin dimensions including: width, length and depth (Jackson, 2002). Due to the limited fetch of Warnbro Sound, locally generated wind waves will have short periods and therefore not be affected by refraction until reaching the nearshore. Consequently they will generally retain the direction of the wind by which they were generated and be able to break obliquely to the coastline (Silvester, 1987). The strongest winds from mid latitude depressions are generally from the NW however their duration is small compared to those from the W and SW. This, in combination with the prevailing SW swell direction, means it is likely that higher storm waves will arrive from the SW and will have a longer duration to those from the NW. Analysis of 5 years of wind data from by Silvester indicated that the wave energy generated from the SW is 3 times greater than that from the NW (Silvester, 1987). It was proposed by Silvester (1987) that width of sub tidal terrace fronting Warnbro Sound beaches can be used as an indicator of the intensity of storm waves and thus wave climate at a given site. Here, Silvester suggests that sub tidal terrace width is positively correlated with storm wave energy. However, this is doubtful as beaches with widest sub tidal terraces are located in the most sheltered sections of the Sound, with minimal exposure to dominant waves. Recent research conducted in Cockburn Sound supports this view, whereby exponential shaped beach profiles, which have a wide sub tidal terrace, are associated with the highest levels of protection (Travers, 2004). Separate from the inshore wave climate of the entire Sound, the Safety Bay area can be strongly affected by storm waves from the NW which are diffracted through the Mersey Point Penguin Island gap. These waves can generate significant eastward longshore transport (Silvester, 1987). This process is also strongly influenced by the water level and size of the Mersey Point Penguin Island which influence its effectiveness as a barrier. While the offshore wave climate will have a inter-annual variation, the most likely cause of changes to the inshore wave climate of Warnbro Sound is the breakdown of the Garden Island Ridge, which will have the effect of letting higher levels of offshore wave energy into the Sound (Silvester, 1987).
31 2. Environmental Setting Long period water level fluctuations South-western Australia experiences primarily diurnal micro-tidal conditions with the mean spring tidal range (MLLW MHHW) along the coast from Geraldton to Albany being less than 0.5 m (Sanderson et al., 2000). The Warnbro region has a maximum spring tidal range of 0.6 m (Department of defence tide tables, 1998). Since Warnbro Sound is relatively low energy, micro-tidal region, non-tidal sea level fluctuations frequently exceed the tidal range and are thus an important mechanism of morphological change. These include storm surge; seiches; and continental shelf waves which are discussed in further detail below. In a relatively low energy environment such as Warnbro Sound, long period fluctuations in water level are important in controlling nearshore processes and beach characteristics through two main actions. Firstly, the changing water level can have the effect of varying the level of offshore wave energy which passes into the inshore region. This is due to a varying depth of water over the offshore reef system which subsequently changes the degree of wave attenuation that occurs, hence changing the wave energy propagating through to the nearshore zone (Hegge, 1994). Secondly, variations in water level alter the position on the beach profile where wave processes may act in reworking the beachface. The effects of this also vary for the different types of water level variation, whether periodic (eg: Tides, Seiches) or non-periodic (eg: Storm surge). Periodic variations such as tides allow a frequent reworking of the whole beach (within the tidal range) and therefore result in a more homogeneous beach face. Non-periodic variations such as storm surge events lead to an infrequent reworking, which means that artefacts of previous events may persist in the beach form for extended periods of time (Jackson et al., 2002) Storm Surges Storm surge is defined as the water level rise due to the combined effects of wind induced shear stress (wind set up) and barometric pressure variation (barometric set up). Storm induced surges can produce short term water level increases considerably above mean water levels, with the magnitude and duration dependant upon the type and strength of weather system responsible (CERC, 2002). The timing of surge events is important. If it occurs in conjunction with a spring high tide and high energy wave condition, the effect on beaches can be substantial. The effects
32 2. Environmental Setting 28 may remain for a long period of time as no reworking will be possible under normal water levels. The importance of storm surge on beach processes and morphology of low energy beaches is most significant when surge levels exceed the tidal range, as is the case in south-western Australia (Jackson et al., 2002). Due to seasonal variations in ambient barometric pressure and prevailing wind direction, caused by the seasonal migration of the subtropical high pressure belt, water levels are higher in winter than in summer by an average of about 0.25 m (Masselink & Pattiaratchi, 2001) Seiches Seiches are long period standing waves or oscillations of the water surface in an enclosed or semi-enclosed basin. They are initiated by an external forcing on the water body such as changes in atmospheric pressure or winds over the basin, and in some cases due to the action of waves and wave groups at the basin entrance (CERC, 2002). The existence of a seiche within the Warnbro Sound basin is likely, but since no water level measurement data is available this can not be verified nor the magnitude of water level oscillation known. Warnbro Sound can be defined as an open system with respect to seiching, and the period of such a seiche can be estimated using Merian s formula, where the oscillation period for a seiche in a open system is given by the expression: 4L T n = (1 + 2n) g. h (2.1) Where L is the length of the basin, g is the acceleration due to gravity, h is the average depth of the basin and n represents the mode of oscillation. (For fundamental period n = 0) Assuming a mean water depth of 15 m and basin lengths of 4000m and 6500m the estimated first harmonic oscillation period of a seiche between the shoreline and the Garden Island Ridge, is 22 min while along the length of the Sound is 35.7 min. A documented seiche exists between the coast and the edge of the continental shelf, observations from Fremantle and Cockburn Sound put the period of this seiche at hours with a magnitude of the order m. Persistent seiching has also been documented between the coast and the parallel offshore reefs with periods of up to 30 minutes and amplitudes at the
33 2. Environmental Setting 29 shoreline greater than 0.1 m (Hegge et al., 1996). It is expected that similar water level effects would experienced from these seiches within Warnbro Sound. It was proposed by Hegge (1994), that the water level variation due to the continental shelf seiche and its effect of causing a periodic change in water depth over the offshore reefs results in a periodic change in the level of wave attenuation by the reefs. It is likely that this would cause a periodic modulation of the wave energy reaching the shoreline (Hegge, 1994) Continental shelf waves Continental shelf waves are formed by the passage weather systems such as tropical cyclones and mid latitude depressions across the coast propagating southward (land to the left) along the Western Australian continental shelf with maximum amplitude at the coast. Typically continental shelf waves in this region have amplitudes ranging from m, periods of 5 20 days and wavelengths of a few thousand kilometres (Hegge et al., 1996).
34 3. Morphodynamics Relevant to Warnbro Sound 30 3 MORPHODYNAMICS RELEVANT TO WARNBRO SOUND In order to attempt an understanding of the sediment dynamics of Warnbro Sound, it is first necessary to consider key features and processes relating to the functioning of the complex coastal system. While the geomorphic setting of the Sound has been mentioned previously, this section will consider the formation and maintenance of these features with particular reference to their role in determining the sediment dynamics and future shoreline change of Warnbro Sound. Important processes include transverse sand bar dynamics, longshore sediment transport and spit formation, while important sedimentary forms include dunes and tombolos, salients and cuspate forelands. 3.1 Transverse sand bar dynamics Transverse sand bar dynamics are important in the investigation of the formation, maintenance and migration of the Tern Island sand bar and due to its significance in regard to coastline change in Safety Bay. Sand bars orientated normal (or steeply oblique) to the shoreline are termed transverse bars. Typically transverse bars occur on wide, gently sloping foreshores under conditions of low to moderate wave energy and large sediment supply. It is likely that there is no unique set of conditions and processes that result in their formation, with transverse bars in different environments resulting from different formation, maintenance and migration mechanisms (Gelfenbaum & Brooks, 2003). The formation, maintenance and migration process of transverse sand bars described by Carter (1988) presents the most likely evolution for the Tern Island sand bar. This mechanism is shown in Figure 3.1. The initial formation of a transverse sandbar requires both a sufficient sediment supply as well as hydrodynamic conditions which allow the accumulation of sediment. For the case of a non-tidal sand bar, the required hydrodynamic conditions occur primarily due to the effect of bathymetric features in altering the wave field through the processes of refraction and diffraction or a combination of the two, resulting in a region of low wave heights, analogous to an area of low
35 3. Morphodynamics Relevant to Warnbro Sound 31 wave energy. This region will be conducive to sediment deposition, resulting in an accumulation of sediments (Gelfenbaum & Brooks, 2003). Once deposition forming the initial shoal has occurred the refraction of waves by the shoal results in sediment transport around the shoal from the tail to the head (Figure 3.1 part i), the deposit becomes elongated and a linear caustic is formed which maintains the linear shape of the bar, its alignment in the direction of the prevailing swell, and causes it to migrate in the same direction (Figure 3.1 part ii). This process continues until the bar reaches the coastline (Carter, 1988). Diffraction by the reef and refraction by the north sands platform of swell waves results in the prevailing swell wave direction becoming more northward as it nears the shore. This is illustrated by the almost E W orientation of the Safety Bay shoreline. The sand bar has followed this same pathway, supporting Carter s (1988) description as the relevant maintenance and migration mechanism of the Tern Island sand bar. Upon reaching the shore the fate of the bar depends upon the local hydrodynamic conditions and may remain a feature for longer than suggested in Figure 3.1, part iii. Figure 3.1: Landward formation and propagation of a transverse bar (adapted from Carter, 1988) Caston (1981) demonstrated that the plan view of a sand bar can be used as an indicator of the approximate direction of net sand transport as the net transport occurs from tail to head. The
36 3. Morphodynamics Relevant to Warnbro Sound 32 transverse sand bars he studied had rounded heads in the approximate upstream direction and tapered tails in the approximate downstream direction of net regional sand transport (Caston, 1981). The Tern Island sand bar is likely to contribute to the nearshore sediment budget as, while transverse sand bars formed by tidal currents are essentially closed systems with no sediment transfer to the beach, shore attached sand bars contribute significantly to the nearshore budget and consequently to the long-term shoreline movement (Pattiaratchi & Eliot, 1993). 3.2 Longshore transport The mechanism of longshore transport, particularly of the estimation method, is important to both the sediment transport into and within the Sound. Longshore sediment transport or littoral drift is a shore parallel sediment transport caused by longshore currents, generated by waves breaking obliquely incident to the shoreline (Silvester, 1987; Komar, 1998; Masselink & Hughes, 2003). It is the combined effect of waves and currents which produce the longshore transport; sediment particles are suspended (entrained) by wave action allowing wave generated longshore currents, with velocities far below sediment threshold velocities, to move the sediment (Komar, 1998). Since swell waves will be normally incident to the Warnbro shorelines they will generate a negligible littoral drift. The major forcing behind longshore transport within the Sound will be from locally generated wind waves, particularly those due to sea breeze and storm winds, which due to their short period will not be refracted until reaching the nearshore, retaining the direction of the wind by which they were generated. This means that they will be able to break obliquely incident to the shoreline, hence generating a longshore transport (Silvester, 1987). Due to the effect of the sea breeze and higher levels of energy from SW storm winds than NW storm winds a net northward longshore transport will exist within the Sound, particularly on Warnbro Beach due to its orientation and exposure (Silvester, 1987). Empirical relationships have been formed to predict longshore transport rates. The most well recognised is the CERC formula which predicts longshore sediment transport rates based upon wave energy. In this method the potential longshore sediment transport rate is correlated to the longshore component of wave energy flux which is given by the expression:
37 3. Morphodynamics Relevant to Warnbro Sound 33 P l = E. C b gb sinα. cosα b b (3.1) Where H b is the significant breaking wave height, h b is the breaking depth, α b is the wave breaking angle and κ is the wave breaking parameter and E b is the wave energy, evaluated at the breaker line: E 1 = ρ. g. 8 2 b H b (3.2) And C gb is the wave group velocity at the breaker line: C gb = Hb g. hb = g. κ 1 2 (3.3) Combining the above equations gives the expression: P l = H b ρ. g. H b. g. 2 κ.sinα cosα b b (3.4) The longshore component of wave energy flux (P l ) can then be used to calculate the immersed sediment weight (I l ) using the following empirical formula widely known as the CERC formula, where K is the dimensionless empirical proportionality coefficient, obtained from field data. I = K. l P l (3.5) The immersed sediment rate I l is related to the volume transport rate Q l by the expression: l ( ρ s ). g. ( 1 n) Ql I = ρ. (3.6) The relationship between I l and Q l can be used to obtain an expression of the longshore transport rate as a function of the longshore component of wave energy flux. Q l = l ( ρ ρ )..( 1 n) s K g P (3.7)
38 3. Morphodynamics Relevant to Warnbro Sound 34 Where ρ s is the sediment density; ρ is the water density; g is acceleration due to gravity and n is the in place sediment porosity. Komar (1998) proposed that when using RMS wave heights the value KRMS = 0.70 be used, this was based upon a compilation of field data for longshore transport rates (Ql & Il) as a function of longshore power (Pl) which gave a linear relationship with gradient of 0.7 this is equivalent to using a value of Ksig = 0.30 when significant wave heights are used (CERC, 2002; Komar, 1998). 3.3 Spit Development Since the spit enclosing Peel Harbour in the 1839 survey strongly resembled a linear spit and subsequently extended to join the shoreline, the process of linear spit development may be important in the future development of the Tern Island sand bar due to the apparent similarities of the situation. A spit is a narrow sand accumulation with one end, the proximal end, attached to the mainland shore and the other end, the distal end, extending seaward. Spits develop across the mouths of estuaries or bays or where a sharp change in direction of the shoreline exists, growing in the direction of the predominant littoral drift (Silvester, 1987; Masselink & Hughes, 2003). Linear spits are the simplest form of spit and are generally straight features however they often have a curved sand deposit at the distal end due to the interaction of waves from different directions with the spit. The process of spit formation is shown in Figure 3.2 and is as follows. Sediment is transported along the coast (then the spit) due to longshore currents, once these currents enter deep water near the tip of the spit they disperse (spread out), loosing the capacity to transport sediment, this results in deposition occurring in this region, extending the spit (Masselink & Hughes, 2003).
 Spits are very dynamic features which will rapidly respond to changes in the longshore sediment supply.")
39 3. Morphodynamics Relevant to Warnbro Sound 35 Figure 3.2: Linear spit development (from Silvester, 1987) Spits are very dynamic features which will rapidly respond to changes in the longshore sediment supply. The development of a linear spit can be controlled by pulses of longshore sediment transport due to storm waves. This results in an incremental growth pattern where spit is lengthened during the storm event (causing the formative longshore transport) then is shaped by the prevailing swell conditions, which act to curve the distal end, this process is shown in Figure 3.3 (Silvester, 1987). Figure 3.3: Progressive development of a linear spit (from Silvester, 1987) Assuming this mode of formation and observing the 1839 survey (Figure 1.2), it is likely that the formation of the Peel Harbour spit occurred under forcing from storm waves incident from the NW (passing between Mersey point and Penguin Island) producing pulses of longshore transport eastward from Mersey point, with deposition occurring at the tip. Following these events the
40 3. Morphodynamics Relevant to Warnbro Sound 36 prevailing SW swell waves acting to curve the spit towards the coastline (towards the north) during calm periods, eventually reaching the shoreline, completely enclosing the water body. 3.4 Dunes A well developed dune system exists within Warnbro Sound, particularly in the central section. The relationship between the dune and beach systems is likely to be important in the large scale sediment dynamics of the Sound. Coastal dunes can be classified into two types: Primary dunes (foredunes) which occur closest to the shoreline and dynamically interact with the beach system; and secondary dunes (blowouts, parabolic dunes, transgressive dunes) which are located further inland and are cut off from the beach system, sand reaching the secondary dunes is effectively lost from the beach system (Masselink & Hughes, 2003). Foredune heights depend upon a range of factors, the most important of which being the sediment supply to the dune system and the rate of shoreline progradation. The maximum level of foredune development is achieved when the sediment budget of the beach is neutral and that of the dune system is positive, this results in sand accumulating at the same position for an extended period of time, forming a single well developed foredune. The heights of foredunes can vary markedly depending upon the conditions and can be reach heights of several tens of metres (Masselink & Hughes, 2003). Foredune processes are linked to nearshore processes with foredunes providing a sediment store for the beach. Sediment is eroded from the foredune and transported in to the nearshore zone during storm events (Woodroffe, 2003). Well developed foredunes limit the sediment supply to secondary dunes by providing a physical barrier to further landward aeolian transport. Where foredunes have been cut back by wave action leaving an unvegetated scarp of loose sand, strong onshore winds can initiate blowout formation by eroding a gap in the foredune. Blowouts can also be initiated by human interference with the dune vegetation, due to path construction or vegetation removal. If the gap is not repaired by an accumulation of sand stabilised by vegetation the blowout will increase in size, migrating inland in the direction of the prevailing winds, forming a parabolic dune. The form of such a dune is a blunt nose of loose sand with trailing arms partially stabilised by vegetation. Sand is blown from the beach and the foredune into the blowout or parabolic dune, and is effectively lost from the beach system, meaning they act as a significant sediment sink for
41 3. Morphodynamics Relevant to Warnbro Sound 37 the beach system. Parabolic dunes which continue their landward migration are termed transgressive dunes (Bird, 1972). Figure 3.4: Parabolic Dunes (adapted from Bird, 1972) 3.5 Tombolos, salients & cuspate forelands Since Becher Point and Mersey Point are examples of cuspate forelands the formation and maintenance of this suite of features is important in the understanding and prediction of coastline changes in the northern and southern sections of Warnbro Sound. Tombolos, cuspate forelands and salients are a series of landforms whose development is controlled by the interaction of the prevailing swell waves with offshore structures (reefs or islands). They develop in the lee of the offshore structure due to diffraction of waves creating a locus for sediment deposition, forming a promontory extending out from the shore (Masselink & Hughes, 2003; Silvester, 1987).
42 3. Morphodynamics Relevant to Warnbro Sound 38 Figure 3.5: Tombolos, salients & cuspate forelands (adapted from Masselink, 2003) Tombolos and salients are formed by a similar process due to the waves diffracted around an offshore obstacle forming a locus of sediment deposition in the shadow zone of the structure. Where the promontory is linked to the offshore structure it is termed a tombolo, while a salient is simply a modest protrusion of the shoreline (Masselink & Hughes, 2003). Formation of a tombolo or salient is dependant upon the ratio of the alongshore length of the structure (I) and its distance from the mainland (J). It was found by Sunamura and Mizuno (1987) that if J/I < 1.5 a tombolo will develop, J/I = a salient will develop and J/I > 1.5 the structure will have not have a considerable effect on the coastline (Sunamura & Mizuno, 1987). Cuspate forelands are larger features which form due to the diffraction by the offshore structure causing two dominant swell directions (either side of the foreland). The balance of the energy from the two directions will result in the formation and maintenance of a cuspate foreland. Mersey Point and Becher Point are examples of cuspate forelands in the Warnbro region. Mersey point is maintained by swell interactions with Penguin Island while Becher point is maintained by the balance of wave energy, created by swell wave interactions with the offshore reefs, from the north and south. Therefore the form of these cuspate forelands is subject to changes to the balance of wave energy due to changes in the reef or changes to the predominant wave direction of wave energy (Silvester, 1987).
43 4. Methods 39 4 METHODS The research design was broken up into four key sections to best achieve the objectives of the study. Firstly qualitative analysis of aerial photographs was carried out to examine past shoreline change and to estimate sediment transport pathways, following this numerical modelling of longshore sediment transport rates was carried out to estimate annual transport volumes at 18 sites within the Sound. The results of the numerical modelling were combined with those of the qualitative analysis to construct a conceptual model of sediment movement within the Sound. Numerical methods were also used to model the effect the Garden Island Ridge has on the transmission of swell energy into the Sound. This was carried out as part of the investigation into the formation of the Tern Island sand bar. Finally, the equilibrium shoreline planform in the vicinity of the Tern Island sand bar was calculated to assess shoreline stability in the area and to aid in predicting future shoreline changes in the Safety Bay region. 4.1 Qualitative Estimation of Net Sediment Transport Aerial Photographs Aerial photography of the Warnbro region was obtained from the Department of Planning and Infrastructure (DPI). The photographs used were part of the Department of Land and Administration (DOLA) coastal photography runs and were available over various time spacings from 1942 to Current aerial photographs were also available for observation on SKYVIEW (DOLA, 2004) but these were not available for reproduction in this study. Aerial photographs were used to analyse shoreline advance and retreat over the time period using Geographical Information System (GIS) techniques. They were also used to observe the shapes and positions of geomorphic features as well as temporal changes to allow an insight into the sediment dynamics of the region Rectifying photographs and constructing coastline movement plots The scale and orientation of the digitised aerial photographs was corrected against a road line coverage, obtained from DPI, using the geo-reference and rectify commands in ArcMap. The exact process and commands used are listed in Appendix D.
44 4. Methods 40 Once the photograph scale and orientation were corrected (rectified) the shoreline position was recorded. This was achieved by making line coverages of the shoreline in ArcView on each of the rectified images. The shoreline was taken as the observed water line. While vegetation lines are typically used in shoreline analysis for the purposes of this study it was believed that the water line would give a better indication of the changes. Following their delineation shoreline coverages were collated to create a coastline movement plot. For the purposes of this study the analysis of coastline movement plots was strictly qualitative, and involved identifying the areas and periods of time in which significant erosion and accretion occurred. The time series of aerial photographs was observed to identify geomorphic features which could be used to indicate sediment movement. Where such features were identified their change over time was monitored to obtain further insight into the suggested sediment transport directions. 4.2 Numerical Estimation of Longshore Sediment Transport Longshore sediment transport for the Sound was estimated using numerical modelling techniques. Tonk et al. (2002) investigated the accuracy of various sediment transport estimation methods at City Beach. This was done by comparing transport volumes predicted using the estimation methods to the volume of sediment trapped by a shore normal groyne. They found that the best agreement between estimated and measured transport volumes was obtained using the CERC equation evaluated only for wind waves (Tonk et al., 2002). The background of the CERC equation is discussed in 3.2, on page 32. The CERC equation is also both widely used and is recommended in the Shore Protection Manual (2002) as a means for estimating longshore sediment transport rates. Therefore it was decided to use the CERC equation, evaluated only for locally generated wind waves to estimate the longshore sediment transport within Warnbro Sound. For each of the 18 selected sites, calculation of longshore transport volumes was carried out with the MATLAB program transport.m (listed in Appendix C). This involved firstly calculating the wave breaking angle (α b ) from the site orientation angle (which was estimated from the most recent coastline plot) and breaking wave direction. Then the CERC equation (3.4, page33) was used to calculate the longshore component of wave energy flux followed by equation (3.7, page33) to calculate the 3 hourly longshore transport rate. Three hourly transport volumes were then estimated (by multiplying rate by time) and were summed to obtain net monthly and annual
45 4. Methods 41 transport volumes. The input requirements of the transport calculation included 3 hourly breaking wave height and direction. These were estimated using numerical wave modelling techniques Numerical modelling of wind wave generation The numerical wave model SWAN (Simulating WAves Nearshore) was used to model the wind wave generation within Warnbro Sound to obtain the inputs required for the CERC equation SWAN Background SWAN is a third generation numerical wave model, developed for obtaining realistic estimates of wave parameters in coastal areas, lakes and estuaries. The wave propagation processes it accounts for include: propagation through geographical space; refraction due to spatial variations in bathymetry and current; shoaling due to spatial variations in bathymetry and current; transmission through, blockage by or reflection by obstacles. The wave generation and dissipation processes accounted for include: refraction; shoaling; wind wave generation; dissipation by white capping; dissipation by wave induced breaking; dissipation by bottom friction; and wave wave interactions. It does not account for the effects of diffraction (Booij et al., 1999). The evolution of the wave spectrum used in SWAN is described by the spectral wave action balance equation which, for cartesian coordinates is defined as: N + t C x y N + C σ N + C θ x N + C y σ θ N = S σ where is the relative frequency (the wave frequency measured from a frame of reference moving with a current, if a current exists); N is wave action density, equal to energy density divided by relative frequency (N = E/σ); θ is wave direction; Cg is the wave action propagation speed in (x, y, σ or θ) space; and S is the total of source/sink terms expressed as wave energy density (Booij, et al. 1999). The SWAN output has been validated in a number of studies both in field and laboratory tests and has been found to give a good approximation of the wave field in situations were the effects of diffraction are small (Booij, et al. 1999).

46 4. Methods SWAN modelling method The objective of the SWAN wave modelling process was to use 3 hourly wind data input to obtain 3 hourly estimates of breaking wave height and direction. Since the output of the 100 m resolution coarse run was not sufficient to evaluate the wave breaking parameters, a two part modelling methodology was designed. This included the initial two dimensional 100 m resolution coarse run followed by a 5 m resolution one dimensional profile simulation. The profile simulations were carried out using data from the output of the coarse run, extracted using the MATLAB program tpar_make.m (listed in Appendix C). Following the one dimensional profile run breaking wave parameters had to be extracted from the output, a description of how this was done is given in Default SWAN command options were used. While this design had limitations it was deemed the most appropriate option for the purposes of the current study. Briefly, the two major drawbacks of this method were that a continuous estimation of transport rates could not be made around the entire shoreline and the fact that wind generation was not included in the one dimensional profile runs, meaning that the fetch was effectively shortened by the length of the profile. However this was determined to be acceptable as it allowed accurate calculation of wave breaking parameters without the need of prohibitive computational resources and time and it could be carried out with already available or easily obtainable data. Figure 4.1: SWAN wave modelling design Input Data Input data had to be converted to a specific format (see DELFT, 2004) so it could be read by the SWAN program, this was carried out using MATLAB.
47 4. Methods 43 Wind Three hourly wind data (speed and direction) measured at Rottnest Island for 2003 by the Bureau of Meteorology (BOM) was used for the simulation. The data was processed using the MATLAB to convert it from knots with a meteorological direction to x and y components in metres per second with a cartesian direction and to account for missing values. Missing values made up ~ 3% of the total record and were filled with the mean wind speed and direction. Coarse Bathymetry Bathymetry data with 100 m resolution was obtained, originally from the Perth Coastal Waters Study Beach Profiles A series of beach profiles were surveyed on the 11 th of September, 2004 at 9 sites around the Sound to obtain high resolution profile for the areas not covered by the DPI sounding data. Beach profiles were carried out according to the standard beach profile surveying methods of Howd & Birkemeier (1987) using a Geodimeter 440. Standard Survey Marks (SSM) used as start points in the beach profile surveying were Peron 8; Warnbro 2; and Kennedy 65 (Figure 4.2). Profile Sites were chosen such that a complete picture of the sediment transport of the Sound could be obtained with closer spacing to get adequate coverage of areas where high levels of change was expected to be occurring based on a visual inspection of aerial photographs (Figure 4.2). The raw survey data was converted to distance and elevation along the profile. This was then interpolated to 5 m resolution using MATLAB. Sounding Lines High resolution sounding data obtained from DPI for the Safety Bay area (2002) was used to create a series of 9 sounding profile lines by extracting sections of the raw sounding data. The locations of the profile lines extracted from the sounding data are shown in Figure 4.3. These were then processed in the same way as the beach profile data.


48 4. Methods 44 Figure 4.2: Map of beach profile sites Figure 4.3: Map of sounding profile locations used
49 4. Methods Post-processing The output of the SWAN modelling consisted of wave of parameters at 5 m intervals along each profile, including significant wave height (HSIG), direction (DIR) and the percentage of waves breaking due to depth induced breaking (QB). The breaking wave height and direction were extracted from this using the MATLAB program breaking.m (listed in Appendix C). This program located the breaking position at each site, for each time-step, by finding the maximum value of QB. It then extracted the corresponding wave height and direction for that position. 4.3 Modelling the effect of the Garden Island Ridge on swell Pitchen (1993) proposed that the initial formation of the Tern Island sand bar was due to a region of low energy. This was created along the axis of the sand bar by the diffraction and refraction of the prevailing SW swell which passes through the Garden Island Ridge and over the north sands platform. It is proposed in this research that the low energy zone is required only for the initial formation of the shoal. The maintenance of the bar is then governed by the interaction of swell waves with the bar itself. Since SWAN does not calculate the effects of wave diffraction the numerical wave model REF/DIF1 was used to test this hypothesis REF/DIF1 Background The REF/DIF1 model is a phase-resolving, weakly non-linear, combined refraction-diffraction model developed by Kirby & Dalrymple which incorporates the effects of shoaling, refraction, energy dissipation and diffraction (Kirby & Dalrymple, 1994). It has been designed to predict the propagation of a monochromatic wave in intermediate water depths using second order Stokes wave theory including the third order correction to the wave phase speed (CERC, 2002). The model is based on the parabolic estimation of the mild-slope, wave-current model equation developed by Kirby (1984), which may be written as: 2 2 ( CC ϕ) + ( σ k ) = 0 2 D ϕ Dϕ + U ϕ 2 g CC g Dt Dt (4.1) Where φ is the velocity potential at the free surface and:
50 4. Methods 46 D Dt = + U t (4.2) = x, y (4.3) ( U ( x, y), V ( x, y)) U = (4.4) σ = ω k U (4.5) C = σ (4.6) k C g = σ (4.7) k 2 σ = gk tanh( kh) (4.8) REF/DIF1 has been shown to be capable of providing a detailed picture of the water surface, including the geometry of crests and troughs as well as the location of regions of high or low wave heights. The results of laboratory verification tests demonstrate the higher-order parabolic approximation, together with nonlinear correction to the wave phase speed, can correctly predict the distribution of wave heights and nodal points in the evolving wave field (CERC, 2002) REF/DIF1 Inputs The REF/DIF1 simulation was carried out using the default command options and required the input of bathymetry data and incoming wave conditions. The bathymetry data was obtained from the Perth Coastal Waters Study, which provided 100 m resolution data relative to mean sea level. For use in the REF/DIF1 simulation a section comprising the whole of Warnbro Sound extending westward to just past the Garden Island Ridge was extracted from the original data. This was then interpolated using MATLAB to obtain a 50 m resolution grid. The wave input parameters used were those identified by Lemm et al. (1999) to be the annual mean prevailing offshore wave conditions, with wave height 2.0 m; period 9 sec; and direction from the SW used.. Default command options were used.
51 4. Methods Application of the parabolic bay shape equation to Tern Island In an effort to predict the future shoreline changes in the vicinity of the Tern Island sandbar equilibrium beach planform shapes were estimated based upon the parabolic bay shape model. This was carried out using the software package MEPBay. From observation of aerial photographs, the shape of the shoreline in the vicinity of the Tern Island sand bar suggests that since it has become a major presence the sandbar is exerting headland control upon the beaches, which appear to have the shape of embayed beaches. Due to their morphological importance, several empirical models have been proposed to fit curves to the shorelines of curved beaches including the logarithmic spiral, hyperbolic tangent; and parabolic bay shape models. The most well received being the parabolic bay shape equation, proposed by Hsu and Evans (1989) which is recognised in the current (2002) Coastal Engineering Manual as being of use in coastal sediment processes and shore protection projects. (Klein et al., 2003) Parabolic bay shape equation Proposed by Evans and Hsu (1989) the parabolic bay shape for a headland bay beach in static equilibrium is described by the following equation: R R n β = C β + C + C β θ n θ n 2 (4.9) Where: β is the reference wave angle and R β the control line length (representing the distance between the up-coast and down-coast control points). R n is the distance to any point around the bay periphery angled at θ n from the wave crest line.
 The constants C 0, C 1 and C 2 are dependant upon the reference angle (β) and were generated by")
52 4. Methods 48 Figure 4.4: Wave headland beach relationship for a bayed beach in static equilibrium (from Klein, 2003) The constants C 0, C 1 and C 2 are dependant upon the reference angle (β) and were generated by regression analysis to fit the peripheries of 27 prototype and model bays and are given by: C = β β β β (4.10) C = β β β β (4.11) C = β β β β (4.12) The parabolic bay shape equation has been verified by Silvester and Hsu (1993, 1997) for various situations. MEPBay is a software package developed by Klein et al. (2003) for the application of the parabolic bay shape equation. Using this software, up-coast control point, down-coast control point and wave direction are defined on a digitised aerial photograph then the equilibrium bay shape is calculated and plotted over the photograph (Klein et al., 2003). In applying this to Tern Island, the equilibrium bay shapes were calculated for the western and eastern sides of the sand bar based upon control points estimated from the aerial photographs.

53 5. Results and Discussion 49 5 RESULTS & DISCUSSION A number of methods were used, both qualitative and quantitative, to examine the large scale sediment dynamics of the Sound. Each will be considered in turn before being combined to create an overall picture of the net sediment movements occurring in the Sound. The Tern Island sand bar has been identified as particularly important to future dynamics of the area and as such will be considered in detail. Following this, predictions of future coastline change will be made based upon a combination of all the prior analysis. 5.1 Qualitative estimation of sediment transport The qualitative estimation of sediment transport involved analysis of coastline plots to evaluate past changes and observation of aerial photographs to determine likely sediment transport directions Coastline movement plots From the preliminary analysis of coastline movement plots three areas of significant change were identified: Mersey Point, Safety Bay; and Becher Point. The extent of these regions is shown in Figure 5.1. Coastline movement plots were analysed for each area to examine the change to the shoreline planform, these are given in Appendices A1, A2 and A3. The major changes in each area will be discussed, including the possible reasons behind the changes. There was no significant coastline movement observed on Warnbro Beach in the central section of the Sound (fronting the central basin), furthering the notion that it is in equilibrium. This indicates a neutral sediment balance when considering all possible fluxes. Figure 5.1: Areas of coastline movement plots
54 5. Results and Discussion Mersey Point Between 1942 and 1973 significant accretion occurred on the western flank of Mersey Point and in Shoalwater Bay. Between 1976 and 1991 Mersey Point accreted, with its alignment shifting towards the SW. Since the Point is maintained by the convergence of waves passing around Penguin Island this indicates a higher level of wave energy from the SW. The southern margin of the point has accreted since 1976; it is possible that this indicates a reduced level of NW storm energy. Under increased NW storm energy waves diffracted through the Mersey Point Penguin Island opening will move sand from Mersey point eastward along the along the Safety Bay shore. This will result in the erosion of the southern margin of the Point. Mersey point is entirely sedimentary and its position is controlled by the effect of Penguin Island on incoming waves. Therefore changes to the point are likely to be due to the predominant direction of wave energy as well as the sediment supply Safety Bay Prior to 1964 erosion occurred in the eastern section of Safety Bay. This resulted in the construction of the protective rock wall and is likely to be due to higher levels of NW storm activity increasing the movement of sand eastward in Safety Bay. This is supported by the relatively high frequency of NW storm activity during the 1940s 1950s (Personal Communication: Ian Eliot). This region has slowly accreted since 1982 indicating that these sand movements have been less frequent or less intense, corresponding to the reduced frequency of NW storms. The rate of accretion has increased since Tern Island joined the shoreline, likely to be due to the accumulation of sediment to the west of the sand bar. The Safety Bay shoreline has advanced since 1959, in the lee of the Tern Island sand bar. This suggests the formation of a salient caused by the alteration of the wave field by the sand bar, creating a wave convergence zone in its lee. The sand bar also appears to have contributed to the sediment budget of the region, increasing availability of sand. Since the sand bar joined the coast the Safety bay shoreline to the east of it has rapidly accreted, adopting a shape similar to that of an embayed beach. Over the same period there has been no observable change to the shoreline directly to the east of the bar Becher Point Over the past 40 years Becher Point has experienced much change in both its length and alignment. Extensive erosion was experienced by the coastline directly to the south of Becher
55 5. Results and Discussion 51 Point between 1967 and Between 1967 and 1987 the point was diverted a considerable distance northward. From 1987 to 2000 the length of the point was reduced due to erosion. According to Silvester (1987) in the late 1960 s a large collapse occurred in the reef just south of Becher Point. Such a collapse would have altered the wave energy reaching the Point and the area directly to the south and is likely to be the reason behind the extensive erosion experienced between 1967 and 1976 by the shoreline to the south of Becher Point (Silvester, 1987). Since Becher Point is entirely sedimentary, its position and maintenance is controlled by the balance of energy from the north and south. This balance is controlled by both the wave transmission through the Garden Island Ridge as well as the relative frequencies of NW and SW storm events as well as the contributions of swell and sea breeze. Changes to this energy ratio due to reef collapse or altered storm frequency will alter the alignment of the Point. For example if a strong, long duration storm from the NW occurred, or NW storms were more frequent, the Point could be diverted southward. If energy from the SW increased due to more frequent SW storms or reef collapse occurred to the south of the Point its alignment could be diverted northward with material being deposited on the coast to the west of Bridport Point (Silvester, 1987). Therefore the northward diversion of the Point occurring between 1967 and 1987 could be due to either the reef collapse discussed earlier or a reduced level of energy from the NW associated with NW storms being less frequent over this period. The later is the more likely since the effects of the reef collapse would not have continued for years, as it is expected that equilibrium would have been established far earlier and it has been identified that the frequency of NW storms has decreased over this time period. The extensive erosion experienced to the south of Becher Point as a result of reef collapse in the 1960 s demonstrates the possible effects that further reef collapse can have on the shoreline position of the Sound Aerial Photographs - indicators of sediment dynamics Geomorphic features for use as indicators of the direction of net sand movement and temporal geomorphic changes which may also indicate possible transport directions were observed form aerial photographs.

56 5. Results and Discussion 52 Figure 5.2: Photo showing relevant indicators of sediment dynamics South sands platform A sand shoal extends from a sand deposit, in the lee of the Garden Island Ridge, to the coast between Becher and Bridport Points (Figure 5.3). This shoal appears to follow the path of swell diffracted through the openings in the ridge, arriving normal to the shoreline. A small salient has formed where this shoal meets the shore and in the current high resolution SKVIEW image (DOLA, 2004) wave convergence over the shoal is evident. This suggests that sand is being
. It is believed that this is a similar situation to that of the Tern Island sand bar but with a smaller initial deposit of sand. Figure 5.")
57 5. Results and Discussion 53 transported shoreward along the shoal due to the convergence of swell waves over it, similar to the mechanism described by Carter (1988) for the shoreward migration of a transverse sand bar (see 3.1, p30). It is believed that this is a similar situation to that of the Tern Island sand bar but with a smaller initial deposit of sand. Figure 5.3: Sand shoal meeting the shore near Becher Point (2000) The shape of the south sands platform is also believed to be significant. There are two lobes on the edge of the platform adjoining the central basin. It is believed that these lobes are the result of diffraction of swell waves through the openings on the Garden Island Ridge forming wave convergence zones centred on sections of the reef. This is supported by both the lobes being directly to the NE of sections of unbroken reef. In addition to this, the growth of the lobes requires an input of sediment. This is believed to originate from south of the Sound and migrate northward over the sand platform. Sediment trapping groyne A sediment trapping groyne was installed in the south of Warnbro Beach in 1986 to measure longshore sediment transport rates. A photograph of the groyne taken in February 1987, Figure 5.4, clearly shows an accumulation of sediment on the southern side as well as some erosion on the northern side. Since this is at the end of the summer period it may simply represent the northward longshore transport due to the sea breeze. However, Figure 5.5, taken in November 1990 before the summer period, shows a similar but increased accumulation, suggesting that it is not just a seasonal effect rather it is a net northward transport in the centre of the Sound.
 Warnbro Beach dunes High well developed foredunes exist around Warnbro Beach")
. Figure 5.")
.")
58 5. Results and Discussion 54 Figure 5.4: Shore normal groyne in the south of Warnbro Sound (02/1987) Figure 5.5: Shore normal groyne in the south of Warnbro Sound (11/1990) Warnbro Beach dunes High well developed foredunes exist around Warnbro Beach in the central section of the Sound. These suggest a positive sand supply to the dune system from the beach as well as little shoreline movement (see 3.4, p36). Figure 5.6: Warnbro Beach Dunes (high resolution aerial photographs not available) Large parabolic dunes exist in the southern two thirds of Warnbro Beach, particularly in the central section (DOLA, 2004). Parabolic dunes require strong onshore winds and a large amount of sediment from the beach for the dune to form and be maintained and therefore are likely to represent a large sediment sink for the Warnbro Beach system.
. The existence of these sand deposits reef strongly suggests a transport across the Garden Island Ridge.")
59 5. Results and Discussion 55 Garden Island Ridge Large sand deposits exist in the lee of the unbroken sections of the reef (Figure 5.2). There also appears to be deposits of sand extending through openings in the reef (Figure 5.2). The existence of these sand deposits reef strongly suggests a transport across the Garden Island Ridge. The generally SW NE orientation of the deposits suggests that the transport is due to the prevailing SW swell. Tern Island sand bar A well defined sand shoal extends from a sand deposit in the lee of the Garden Island Ridge to the tail of the tern island sand bar (Figure 5.2). Wave convergence along the shoal is expected to drive a sediment transport down the shoal towards the sand bar. The time series of photos of the Safety Bay area (Appendix B) indicate that there has been little change to the eastern side of the sand bar since 1996, while the western side has developed significantly extending to join the coast. A submerged platform has developed on the sand bar s western flank, the size of which appears to be increasing. There is no such feature on the eastern side. This suggests that sand transported along the bar moves along the western flank but not along the eastern flank. Since joining the shore there has been an accumulation of sand on the western side of the bar with the coastline advancing considerably. Over the same period there has been no change to the shoreline immediately to the sand bar s east indicating there is no net sediment supply to this area. Penguin Island Tombolo The size and continuity of the Penguin Island Tombolo has changed periodically and is expected to be due to recent events. In recent aerial photographs the landward end of the tombolo has been consistently hooked towards the south (Figure 5.7). This is observed in photographs from both the beginning and end of the summer period. This suggests a possible south east net sediment transport around Mersey Point. Figure 5.7: Penguin Island Tombolo (2000)
60 5. Results and Discussion Numerical estimation of sediment transport The results presented are the estimated net transport volumes for wind wave driven longshore transport for 2003, over both annual and monthly time periods at each site. They are given in two parts, the first containing transport volumes for the beach profile sites around the Sound and the second focusing on the sounding sites in the Safety Bay area. Profile 1 was not used as it was decided that the profile length was too short to take into account the effects the Tern Island and the Berry Street sand bars have in sheltering the site from wave energy. The analysis of this data was restricted due to limitations associated with the results discussed below Annual transport volumes Figure 5.8: Estimated annual longshore transport volumes at each of the profile sites (m 3 yr -1 ) The results for the profile sites show a clear net northward transport around the southern and central sections of the Sound. The magnitudes vary due to the exposure or orientation of the sites, particularly in relation to the sea breeze. The most noticeable feature is the significant amount of sand which appears to be lost between sites P3 and P2 where the annual transport volume decreases by a factor of 4. Since there as been no change to this coastline over a long
61 5. Results and Discussion 57 period of time this may indicate the existence of a large sediment sink. The discontinuities around Warnbro Beach suggest that the longshore transport of this area can not be accurately estimated using only locally generated wind waves. It may also represent an error associated with the profile angles but this is believed to be unlikely as the variation is roughly uniform around Warnbro Beach. The large change between P9 and P7, where the transport volume increases by a factor of 3, may suggest that there is a significant cross-shore sediment input in the Becher Point Bridport Point region. It is also apparent that the longshore transport within the Sound is much less than that of the open coast. The estimated transport volumes within the Sound are of the order of only a few thousand cubic meters per year, much less than the 60,000 m 3.yr -1 estimated for Madora Bay by Searle and Logan (1979). This large difference is partly due to the limited fetch within the Sound. Figure 5.9: Estimated annual longshore transport volumes at each of the sounding sites (m 3 yr -1 ) The results from the sounding sites indicate a clear net eastward transport in Safety Bay. Transport volumes in this region are small which is likely to be due to the sheltering effect of the north sands platform and the sand bars and sand shoals in the area. Also the orientation of the sites, almost normal, to the sea breeze will limit its effect on the longshore transport. A minimal, almost zero, net transport was calculated directly to the east of the Tern Island sand bar. This is due to extensive sheltering from the Tern Island and Berry Street sand bars.
62 5. Results and Discussion 58 The accuracy of the increasing transport in S8 and S9 is questionable when compared to the northward transport estimated for P2. A possible explanation is that it is due to error associated with the modelling procedure (see 5.2.3, p59) Monthly Transport Volumes Monthly transport volumes were included to demonstrate the seasonality of the longshore transport and to illustrate how this seasonal variation varies with the orientation and exposure of the sites. Figure 5.10 and Figure 5.11 show the net monthly transport volumes for A positive value indicates an up-coast (northward) transport, while a negative value represents a down-coast (southward) transport January February March April May June July August September October November December (m 3 /month) Profile 2 Profile 3 Profile 4 Profile 5 Profile 6 Profile 7 Profile 8 Profile 9 Figure 5.10: Estimated 2003 monthly longshore transport volumes (Profiles) Profiles 2 to 6 inclusive all show a clear seasonal variation in the transport direction. This appears to follow the seasonal variation in the wind field which is expected as these sites are located in the central, most exposed, section of the Sound. Sites 7, 8 and 9 do not show this seasonality. This is probably due to the almost E W orientation of the section of coastline they lie on which has limited fetch for winds from the S-SW. The transport volumes during the winter months have a much smaller variance between sites than those during the summer months. It is likely that this is a result of summer transport being dominated by the sea breeze and the sites having the greatest fetch variation for S SW winds.
63 5. Results and Discussion January February March April May June July August September October November December (m 3 /month) Sound 1 Sound 2 Sound 3 Sound 4 Sound 5 Sound 6 Sound 7 Sound 8 Sound 9 Figure 5.11: Estimated 2003 monthly longshore transport volumes (Soundings) The monthly transport volume for all sounding sites follows the same general seasonal trend. This is due to the close proximity and similar orientation of theses sites. During the winter months the transport volumes are generally more negative or up-coast while in summer they are more positive and around zero. The variations in the magnitudes are likely to be due to sheltering provided by the Tern Island and Berry Street sand bars Limitations of the numerical modelling study Caution must be employed when analysing the data from this numerical modelling. The output is subject to a number of important limitations which significantly reduce the level of confidence and have limited the extent of analysis possible. It was found that the output of the CERC equation was very sensitive to the breaker angle, which was calculated using the estimated profile angle and wave direction. A one degree adjustment to the profile angle results in a change of up to 25% in the calculated annual transport volume. This problematic due to the fact that profile angles were estimated from coastline plots and are not exact. As such, they have an associated error of the order of about 5 degrees. On a straight stretch of coastline the orientation could be estimated to a much higher accuracy. The sensitivity of the results to changes in the profile angle means that they can not be used with any confidence in volumetric analysis or sediment budget calculations.
64 5. Results and Discussion 60 Consideration of the modelling output suggested that wind waves and swell can not be considered as separate, with the effects of each being mutually exclusive. Swell, local winds and locally generated wind waves interact with each other to form the nearshore wave climate. The resulting longshore transport depends upon both the individual components and the effect of this interaction. It is expected that if both were considered a greater level of continuity in the transport rates between the sites may have been obtained. The value of the numerical modelling is also reduced as a result of the major contributions made by aeolian transport and locally significant cross-shore transports within the Sound. While discontinuities in the predicted longshore transport volumes can be used to infer other fluxes, both sources and sinks, it becomes difficult to estimate the relative importance of these when they make up a significant portion of the total transport. This is also limited by the confidence in the output. Furthermore, to make these conclusions other methods must be used to identify the other possible fluxes. Therefore, due to the uncertainty associated with it, the importance of other transport processes and inter-annual variation, numerical modelling using the CERC method considering only wind wave driven longshore transport is of limited use. However, when combined with the qualitative aspect of this study, a conceptual overview of sediment dynamics can be attempted.
65 5. Results and Discussion Net sediment transport pathways Based upon the qualitative observations and numerically estimated transport volumes previously discussed, an account of the major sediment transport pathways both into and within the Sound was developed. Since the weather events which drive a part of the sediment transport into and within the Sound have an episodic nature, the sediment transport will not be constant. It too will have an episodic nature and will be strongly dependant upon the weather patterns. While there are many instances where the transport direction will change seasonally, the transport pathways discussed in this study are longer term net pathways and generally do not take the seasonal variation into account Transport into the Sound There is much disagreement on the major sources of sediment input to the Sound, particularly to whether sand transported from the Sepia Depression directly through openings in the Garden Island Ridge can be a significant source. It is accepted that a significant supply of sediment is transported northwards around Becher Point from Comet bay. This route was described by Searle and Logan (1979) who estimated a net northward transport of 60,000m 3.yr -1 for Madora Bay, while a portion of this will be lost to the parabolic dunes to the south of Becher Point a considerable proportion will enter the Sound (Searle & Logan, 1979). Also, the incremental pattern of the proposed formation of the Sound over the Holocene indicates that over the Sound s history the major sediment source has been from the south (Searle et al., 1988). The major question which remains is whether sand from the Sepia Depression can be a significant source to the Sound. An examination of hydrographic charts from 1985 shows a very steep, almost vertical, seaward slope of the reef. There is also a large variation between the depths seaward and landward of the reef. Depths in the northern section of the Sound seaward of the reef are approximately 10 m while on the landward side they are around 3 m. In the southern section seaward depths are around 5 m while landward depths are around 2.5 m (Silvester, 1987). This depth variation is due to accumulation within the Sound that has occurred due to the sheltering effect of the reef and the creation of wave convergence zones where sediment is deposited. While a large northward longshore transport exists on the seaward side of the reef due to the oblique reflection of the prevailing SW swell by the almost vertical reef wall, Silvester (1987)
66 5. Results and Discussion 62 proposed that it is unlikely that much of this will pass through the gaps into the Sound as waves can not transport sand over vertical faces of the order of a few meters. Since further breakages in the reef are likely to occur at some height above the sea floor this barrier to sediment transport will be maintained (Silvester, 1987). Aerial photographs (DOLA, 2004; Figure 5.2) show clear sand deposits which extend through the reef and strongly suggest that sand from the Sepia Depression can be a source to the Sound. In light of the height which the sand would have to rise, the mechanics of this transport are difficult to envisage. Accordingly, this has been the major argument against sand being transported from the Sepia Depression into the Sound. One possible explanation is that the sand is suspended by storm wave induced turbulence which may be able to raise the sediment to a height such that it could enter the openings, being depositing within the reef. This sand could then be moved into the Sound under the influence of the prevailing SW swell. This is supported by the sand deposits in question being orientated in a generally SW NW direction. This poses the question can wave induced turbulence transport sediment up heights of the order a few metres. Another possible explanation is related to the possible existence of large sand waves within the Sepia Depression. Due to the abundant sediment supply and restricted currents within the Sepia Depression, large sand waves are believed to exist and migrate along the depression. Bathymetric surveys of the Sepia Depression suggest the possible existence of such waves (Figure 2.2, p17). It is possible that these sand waves extend up high enough to reach the openings in the Garden Island Ridge, allowing sediment transport into the Sound or allowing transport by reducing the height that sand would need to rise to enter the openings. A sediment supply of this form will be pulsational with inputs corresponding to the passing of the sand wave peaks past the openings in the reef. Since there are no significant transport pathways out of the Sound, once sediment enters it is effectively trapped and remains within the system, until lost to the dunes Transport within the Sound A conceptual model of net sediment transport pathways within the Sound (Figure 5.12) was established from the combination of all the methods previously discussed.
. Another likely sediment source to this area is sand transported onshore along the sand shoal due to swell convergence along its crest (Figure 5.12, B). Figure 5.")
67 5. Results and Discussion 63 A northward longshore transport is expected to exist around Becher Point as a continuation of the northward net longshore transport which exists in Comet Bay (Figure 5.12, A). Another likely sediment source to this area is sand transported onshore along the sand shoal due to swell convergence along its crest (Figure 5.12, B). Figure 5.12: Conceptual model of net sediment transport
68 5. Results and Discussion 64 A wind wave driven northward longshore transport has been shown to exist on Warnbro Beach in the central section of the Sound, illustrated by the numerically estimated longshore transport and supported by the accumulation of sediment on the southern side of the previously mentioned shore normal groyne (Figure 5.12, C). This longshore transport can not continue northward to Safety Bay due to negligible accumulation or movement on the eastern side of Tern Island since it joined the shoreline. This is also indicated by the numerical modelling results which show a large amount of sediment lost from the transport path in the northern section of Warnbro Beach. It is believed that this sink is accounted for by the large parabolic dunes and blowouts in the central and southern sections of the Sound. It is likely that a large portion of the sand transported by longshore processes northward from the Becher Bridport Point area is ultimately transported through aeolian processes into the dunes. Onshore sediment transport is expected to occur along the Tern Island sand bar and the adjoining sand shoal due to the convergence of swell over the shoal (Figure 5.12, D). This follows from the findings of Caston (1981) who suggested that the planform of a sand bar may be used to estimate the direction of net sediment movement. Upon reaching the sand bar this transport is expected to progress down the western flank of the bar (Figure 5.12, E). This is due to the existence and growth of a large submerged platform since the sand bar neared the shore. Over the same period there has been negligible sediment accumulation or change on the bar s eastern flank. Observations of the Penguin Island Tombolo have shown it to be consistently hooked to the south. This may indicate that there is a south eastward transport around Mersey Point (Figure 5.12, F). This argument may also be supported by the accumulation of sand against the western side of the Tern Island sand bar since it joined the shore, possibly interrupting an eastward littoral drift. Another explanation for the source for this accumulation is sand transported shoreward along the western flank of the sand bar. If a significant amount of sand can not be transported from through the Garden Island ridge an explanation is required of where the sand making up the accumulations on the north sands platform originated from. One possibility is that sand is redistributed within the Sound and may be transported from the south sands platform under extreme conditions, either SW storm or sea breeze (Figure 5.12, G).
69 5. Results and Discussion 65 It is also believed that sediment redistribution due to longshore transport driven by diffracted swell waves is an important factor in sediment movement within the Sound and is responsible form maintaining the shape of the Sound, particularly the central section.

.")
70 5. Results and Discussion Tern Island sand bar Since the first available aerial photographs from 1942, the Tern Island sand bar has gone from being entirely submerged to emergent and has grown and migrated shoreward at an average rate of m.yr -1. The photographic time history of the development and movement of the sand bar is shown in Appendix B. In the first available photograph from 1942 the submerged form of the sand bar can be observed approximately 700 m from the shoreline (Figure 5.13). The most recent aerial photograph taken in April 2004 shows the sandbar connected to the shore with a well defined sand shoal extending from the Garden Island Ridge to the tail of the bar (Figure 5.14). Figure 5.13: Safety Bay 1942 Figure 5.14: Safety Bay 2004

71 5. Results and Discussion Formation, Migration & Maintenance As discussed earlier, it is believed that the formation of the Tern Island sand bar was due to the existence of a low energy zone created by the diffraction of prevailing swell waves passing through openings in the Garden Island Ridge. The results of the REF/DIF1 simulation for the mean prevailing swell conditions, presented in Figure 5.15, show an area of low wave heights, analogous to low energy, in the region where the initial formation of the sand bar occurred. This finding supports the formation hypothesis proposed by Pitchen (1993). Aerial photographs of this region also support this argument. An accumulation of bare sands can be seen on the shoreward side of the Garden Island Ridge with a sand shoal extending from this area to the sand bar along the path followed by the sand bar during its shoreward migration (Figure 5.14). Figure 5.15: REF/DIF1 Output for prevailing swell Once the accumulation of sand became large enough it is likely that the maintenance and shoreward movement of the bar was governed by the interaction of the prevailing swell with the
72 5. Results and Discussion 68 bar according to the process described by Carter (1988) (see 3.1, p30). Waves refracted around the bar transport sediment from the tail to the head forming and maintaining the bar s linear shape and moving it in the direction of the prevailing swell. During the shoreward migration of the bar its alignment changed both in the shorter term and longer term. It is likely that the long term change from a SW NE to S N alignment has been due to the refraction of swell waves by the north sands platform. Initially having a SW direction upon entering the Sound the prevailing swell wave direction changes to an almost S direction upon reaching the shoreline. This is indicated by the roughly W E orientation of the Safety Bay shoreline, before Tern Island became a significant presence. As the bar moved shoreward it too followed this path, due to the likely migration mechanism of the bar (see 3.1, p30). In the shorter term the alignment of the bar as well as its shape has also changed. As Pitchen (1993) noted, these changes are due to the effect of storms. The direction of the storm is particularly important as it will determine its effect on the sand bar. SW storm waves are unlikely to affect the shape or alignment of the sand bar as they have the same direction as the swell and will act similarly in maintaining the bar. Conversely, NW storm waves will affect the shape and alignment of the bar as they provide wave energy from a direction different to that which maintains the bar. The observed S-shape of the bar is likely to be a result of a sequence of NW then SW wave energy. NW waves are expected to deflect the head of the bar towards the SE, creating a crescentic shape. During the following period of SW wave energy the usual maintenance is expected to resume with the head being deflected back towards the NE, causing the S-shape. The sand supply for the formation of Tern Island is likely to be from the redistribution of sands within the Sound, originally transported into the Sound from the south. However, there still remains the possibility that it has entered the Sound through openings in the Garden Island Ridge from the Sepia Depression. There are large volumes of bare sands within the Sound however there is no clear transport mechanism by which these sands could get to the zone of the Tern Island source. The first of the two most likely scenarios is sand transported northward from Comet Bay proceeds over the south sands, and under sea breeze and SW storm conditions is transported into the area of sandbar formation where it is deposited in the low energy zone. The other possibility being NW storm waves, diffracted upon passing through the Penguin Island Mersey Point Gap entrain and transport sand from the north sands platform towards the low energy zone where it accumulates.
73 5. Results and Discussion 69 The later possibility is unlikely to contribute significantly to the total sediment supply due to simultaneous increases in size of the sand bar and the tombolo noted by Pitchen (1993). This theory of sand redistribution within the Sound is supported by the depth difference between the seaward and landward sides of the reef, the shallower landward side suggests that sand, redistributed within the Sound, has accumulated building up the sea floor within the Sound up to its present level. Also the lesser depth of the south sands platform indicates a greater supply of sand from the south, some of which is then moved northward within the Sound. Extending upon the possibility that a major supply to the sand bar occurs through the Garden Island Ridge, sand transported through the Garden Island Ridge is likely to be pulsational for reasons previously discussed. It is possible that these pulses of sediment are transported through the opening directly to the south of the formation zone, moved northward, and deposited in the low energy zone. There is also the likelihood that the initial sand bar forming deposit was a single large pulse of sediment transported through the opening. However, this theory can not be verified due to the lack of pre 1942 aerial photographs Future of Tern Island Accretion on the western flank Sand transport along the bar from offshore appears to be predominately along its western flank. This, in combination with the previously mentioned possible net eastward longshore transport between Mersey Point and the east of the bar, is likely to result in the continued accretion of the shoreline directly to the bar s west until the shoreline reaches an equilibrium state Spit formation It is possible that the effect of NW storm waves will result in the formation of a linear (or recurved) spit extending eastward from the tail end of the sand bar (spit formation process described in 3.3, p34). Storm waves passing through the Penguin Island Mersey Point gap will cause a strong eastward longshore transport, possibly breaking through the sand bar. If this occurred a large amount of sand could be transported through the break and deposited on the eastern side. Following this, it is possible that the prevailing SW swell will act to curve the end of the spit to the north (shoreward).
74 5. Results and Discussion 70 Field observations of the bar ( ) at low tide following a NW storm event showed a channel cut through the bar just seaward of the emergent tail. This in combination with the observed eastward deflection of the bar s tail between 2000 and 2004 suggest that the formation of a linear spit extending eastward may be occurring, the growth of which would be largely controlled by the frequency, strength and duration of NW storms. If this spit were to develop it will result in a situation similar to that of Peel Harbour. With continued progradation the spit would eventually reach the shoreline. Based upon the records of the development of the spit enclosing Peel Harbour the timescale of this process is estimated to be between 30 and 40 years but is highly reliant upon the weather conditions, particularly storm frequency and direction. The formation of such as spit has implications to shoreline change in the area Destruction of the bar In the event of a prolonged period of increased NW storm activity large volumes of sand could be transported southward from Safety Bay due to the effect of storm waves passing through the Penguin Island tombolo, possibly resulting in the destruction of the bar. It is likely that this is the reason behind the disappearance of the Peel Harbour spit between 1859 and 1878 however this can not be verified due to the unavailability of storm records over this period. Since this series of events has occurred previously in the areas recent history it is a probable future scenario in accordance with the cyclic pattern, suggested by Pitchen (1993). It is likely that this cyclic pattern is driven by patterns of storminess. This is suggested by the different stages in the development being driven by differing ratios of NW to SW storm energy. Sandbar formation and migration appears to require a greater level of SW wave energy while spit formation and the eventual destruction of the bar appear to be driven by a greater level of NW wave energy.
75 5. Results and Discussion Future shoreline change Predicted future shoreline changes Predicted future shoreline changes were established based upon past changes which have been observed, the proposed sediment transport pathways and the results of applying the parabolic bay shape to the Safety Bay area Parabolic bay shape The parabolic bay shape equation was applied to the shorelines in the vicinity of the Tern Island sand bar in an attempt to predict future shoreline change due to the effect of the sand bar. This was done by evaluating the equilibrium shoreline position. It is difficult to define the position of the up coast control point for the western side of the bar since there is no definite cut-off; rather there is a long gradual slope. It is likely that the control point will be defined by a certain depth at which waves will break, preventing the passing of the bulk of wave energy. Such a position will change with variations in the wave height, water depth level with the migration of the bar. Since the actual control point will vary and it cannot be confidently defined, a number of control points were used at varying depths (lengths along the bar) to demonstrate that the shape of the shoreline fits to the equilibrium parabolic bay shape as well as to show the effect that changing the control point has on the predicted equilibrium shoreline shape. (In the figures the up-coast control point is indicated by the red point) Figure 5.16: Predicted equilibrium bay shape of the western side of Tern Island (1)
 From Figure 5.16 it is clear that the shape of the western shoreline closely fits the equilibrium parabolic bay shape.")
76 5. Results and Discussion 72 Figure 5.17: Predicted equilibrium bay shape of the western side of Tern Island (2) Figure 5.18: Predicted equilibrium bay shape of the western side of Tern Island (3) From Figure 5.16 it is clear that the shape of the western shoreline closely fits the equilibrium parabolic bay shape. However due to the difficulties in defining the exact up-coast control point the shoreline change can not be accurately estimated. Figure 5.17 and Figure 5.18 show the effect of changing the control point to a greater depth (as is likely to occur with larger waves or lower water levels). If either of these points act as the up-coast control point they indicate that shoreline advance will occur, as opposed to the static shoreline suggested by Figure On the eastern side of the bar due to the steep depth gradient the up coast control point could be accurately estimated.

77 5. Results and Discussion 73 Figure 5.19: Predicted equilibrium bay shape of the eastern side of Tern Island The shape of the shoreline represents that of the equilibrium parabolic bay shape but does not follow the shoreline; this is likely to be due to the sheltering given to the area by the two sand bars, not allowing enough swell energy to reach the shoreline to rework it into equilibrium bay shape. It is likely that the shoreline will slowly prograde to reach the equilibrium state Future shoreline change Changes to Becher Point are reliant upon changes to the wave energy balance from the north and south which will change with altered patterns of storminess and breakdown of the reef. Therefore it is not possible to predict future shoreline changes without predicting these controlling factors. Warnbro Beach in the centre of the Sound has remained static for a long period of time. This is indicated by the well developed nature of the single foredune. It is likely that it will not experience significant change in the foreseeable future. Changes to the Safety Bay region will be dominated by the Tern Island sand bar. Based upon the established sediment transport paths and the results of applying the parabolic bay shape there is likely to be continued accretion and shoreline advance to the west of the sand bar while there will be little change to the shoreline east of the bar. However the possible growth of a spit from the sand bar, which is expected to eventually join the shore, will result in offshore accretion, reducing water depths in its vicinity, effectively forming an offshore barrier to the east of the bar. Anthropogenic changes made to the coast, should also be considered, namely the influence stabilising the parabolic dunes around Warnbro Beach for housing developments will have on the Safety Bay sediment budget. These dunes are likely to provide a major sediment sink for the
78 5. Results and Discussion 74 beach system, consuming the entire northward longshore sediment transport. Therefore it is possible that by stabilising them they will no longer act as a sediment sink. It is probable that, without this sink, sediment would continue north to Safety Bay, increasing the sediment supply and further exacerbating the accretion problems of the area Effect of predicted changes on existing coastal infrastructure Currently all coastal infrastructure (boat ramps, jetties, etc) in Warnbro Sound is concentrated in the Safety Bay region. This has been and continues to be one of the most dynamic areas of the Sound with respect to coastline moment. The locations of this infrastructure are shown in Figure Figure 5.20: Current Safety Bay infrastructure The effects of the coastline change caused by the Tern Island sand bar have already resulted in the Waimea Street Boat ramp (Figure 5.21) and the SBYC jetty (Figure 5.22) becoming unusable due to sedimentation. The jetty now does not reach the shoreline while the Waimea Street Boat ramp has been out of use for several years and is currently situated a few hundred meters from the shoreline.


79 5. Results and Discussion 75 Figure 5.21: Waimea Street Boat Ramp Figure 5.22: Safety Bay Yacht Club Jetty If the current pattern continues it is likely that sediment accumulation on the western side of the sand bank will result in the Carlisle Street boat also becoming unusable in the foreseeable future. The Bent Street boat ramp may become cut of from the Sound by the developing sand spit, once this reaches the Berry Street sand bar depths will be too small for boats to get out into the Sound. Of all the existing ramps in the area it is apparent that the June Road boat ramp has the most favourable future outlook. It is located on the northern most region of Warnbro Beach adjacent to the central basin. The coastline of this area has remained static and is not expected to change considerably in the foreseeable future.
80 6. Conclusions 76 6 CONCLUSIONS Significant shoreline change has occurred in the Becher Point, Safety Bay and Mersey Point regions. Conversely, the Warnbro Beach shoreline has remained static. It is believed that changes to the shorelines in the vicinity of Becher and Mersey Points have been caused by changes to the incident wave energy, due to reef collapse or variations in long term weather patterns. Shoreline advance in the Safety Bay region has been due to the presence of the Tern Island sand bar which has affected both the wave energy reaching the shoreline and the sediment supply to the region. It was determined that the large scale sediment dynamics of the Sound are the result of a combination of transport processes and can not simply be considered in terms of wind wave driven longshore transport. The contributions of cross shore transports along the shoals in the north and south sand platforms as well as aeolian transport into the dunes in the central section of the Sound are both believed to be important in the identification of the sediment sources and sinks of the beach system. The effect of diffracted swell in causing an alongshore redistribution of sediment may also be important and is likely to be one of the reasons why the shoreline of Warnbro Beach has remained static. It was concluded that the main source of sediment to the Safety Bay region is the Tern Island sand bar and sand transported shoreward along its length. Northward longshore transport from Warnbro Beach is not expected to be a source to the area. Modelling of the sediment transport at discrete locations considering only locally generated wind waves was identified to be of limited value in investigating the large scale sediment dynamics and coastline change of Warnbro Sound. This is due to the significant contributions of other transport processes as well as limited confidence in the modelling result. A zone of low wave energy was identified in the region in which the Tern Island sand bar formed, verifying the initial formation mechanism proposed by Pitchen (1993). It was also concluded that the most likely sediment supply for the sand bar is sand redistributed from within the Sound, with the possibility that the main source is from seaward of the Garden Island Ridge also acknowledged. It is expected that shoreline change in the Safety Bay region will continue. Little shoreline advance is expected to the east of the Tern Island sand bar but shoreline advance is expected to
81 6. Conclusions 77 continue on the western side of the sand bar until an equilibrium state is reached. There is a high possibility of the development of a spit from the end of the sand bar. This would result in a shoreline configuration similar to that in 1839 and strongly suggest the possibility of a long term cycle of sediment movement within the Sound. Future shoreline change in the Becher Point and Mersey Point regions is likely to be due to variations in the incident wave energy caused by changes in weather pattens or breakdown of sections of the Garden Island Ridge. It is therefore not possible to predict the future changes of these areas without further investigation into both these scenarios. Finally based upon the fate of infrastructure in Safety Bay, particularly the Waimea street boat ramp and the Safety Bay Yacht Club Jetty, it is clear that where possible, future coastal infrastructure should be built in the areas identified to have little likelihood of change rather than in the most dynamic regions.
82 7. Recommendations 78 7 RECOMMENDATIONS Redesign of the longshore transport modelling methodology is recommended. This would include the consideration of waves generated outside the study area and would also obtain continuous data for the entire shoreline such that a continuous longshore sediment transport rate could be calculated for the entire Sound. This would require directional offshore wave data and high resolution bathymetry for the whole Sound, which are not currently available. It would also require that a different wave model be used since SWAN does not account for diffraction, the effects of which would be important. This would give a far greater level of confidence in the output and allow a greater level of analysis. From this sediment budgets could be calculated. Upon comparing these to coastline change estimations could be made of the cross shore and aeolian transport volumes. Transport within the Sound could be further investigated by carrying out a field study using sand tracers. This could be used to verify the transport directions proposed in the current study, particularly the relationship between longshore and aeolian transport on Warnbro Beach. Therefore, confirming the importance of transport into the dunes. Verification should be made of the relationship between long term weather patterns and coastline change by correlating long term storm and synoptic records with historical coastline changes in Warnbro Sound. Observation of the Sepia Depression should be carried out to investigate the existence and the size of the proposed sand waves. This would allow further investigation of the suggested sand wave mechanism of sediment transport into the Sound. Also, field observations, using diving or underwater camera techniques, of the openings within the Garden Island Ridge to further investigate the observed deposits of sand which appear to extend through the reef. An investigation of beach process response mechanisms should be carried out within the Sound. This could be done by regularly monitoring beaches through surveying or measuring beach width and correlating the measured data with synoptic records.
83 8. References 79 8 REFERENCES Bird, E. C. F. 1972, Coasts: An introduction to systematic geomorphology, Australian National University Press, Canberra. Booij, N., Ris, R. C. & Holthuijsen, L. H. 1999, 'A third-generation wave model for coastal regions, Part 1. Model description and validation', Journal of Geophysical Research, vol. 104, no. C4, pp Carrigy, M. A. 1956, 'Organic sedimentation in Warnbro Sound, Western Australia', Journal of Sedimentary Petrology, vol. 26, no. 3, pp Carter, R. W. G. 1988, Coastal environments : an introduction to the physical, ecological, and cultural systems of coastlines, Academic Press, London, New York. Caston, G. F. 1981, 'Potential gain and loss of sand by some sand banks in the Southern Bight of the Northern Sea', Marine Geology, vol. 41, pp CERC 2002, Shore Protection Manual,, Vicksburg, Mississippi. DELFT 2004, SWAN User manual: SWAN Cycle III version 40.31, Delft University of Technology. DOLA. 2004, Skyview WA, [Online], Department of Land Administration, Available from: < [22/10/04]. Gelfenbaum, G. & Brooks, G. R. 2003, 'The morphology and migration of transverse bars on the west-central Florida coast', Marine Geology, vol. 200, pp Gentilli, J. 1971, Climates of Australia and New Zealand. (World Survey of Climatology, Volume 13), Elsevier, Amsterdam.
84 8. References 80 Gentilli, J. 1972, Australian Climate Patterns, Nelson's Australasian Paperbacks. Hegge, B., Eliot, I. & Hsu, J. 1996, 'Sheltered sand beaches of south-western Australia', Journal of Coastal Research, vol. 12, no. 3, pp Hegge, B. J. 1994, Low - energy sandy beaches of south-western Australia: Two - dimensional morphology, sediment dynamics, PhD Thesis, The University of Western Australia. Howd, P. A. & Birkemeier, W. A. 1987, Nearshore survey data: CERC Field Research Facility, TR-87-9, CERC. Jackson, N. L., Nordstrom, K. F., Eliot, I. & Masselink, G. 2002, ''Low energy' sandy beaches in marine and estuarine environments: a review', Geomorphology, vol. 48, pp Kirby, J. T. & Dalrymple, R. A. 1994, Combined Refraction/Diffraction Model - REF/DIF version 2.5, Documentation and User's Manual, Centre for Applied Coastal Research. Klein, A. H. d. F., Vargus, A., Raabe, A. L. A. & Hsu, J. R. C. 2003, 'Visual assessment of bayed beach stability with computer software', Computers & geosciences, vol. 29, pp Komar, P. D. 1998, Beach processes and sedimentation, 2nd edn, Prentice Hall, Upper Saddle River, N.J. Lemm, A. J. 1996, Offshore Wave Climate: Perth, Western Australia, Honours Thesis, University of Western Australia. Lemm, A. J., Hegge, B. J. & Masselink, G. 1999, 'Offshore wave climate, Perth (Western Australia), ', Marine and Freshwater Research, vol. 50, pp Masselink, G. & Hughes, M. G. 2003, Introduction to coastal processes and geomorphology, Arnold, London.
85 8. References 81 Masselink, G. & Pattiaratchi, C. B. 2000, 'Characteristics of the sea breeze system in Perth, Western Australia, and its effect on the nearshore wave climate', Journal of Coastal Research. Masselink, G. & Pattiaratchi, C. B. 2001, 'Seasonal changes in beach morphology along the sheltered coastline of Perth, Western Australia', Marine Geology, vol. 172, pp Pattiaratchi, C. B. & Eliot, I. 1993, Formation and maintenance of shoreline attached sand bars in low energy environments and their relationship to shoreline movements, University of Western Australia. Pattiaratchi, C. B., Hegge, B., Gould, J. & Eliot, I. 1997, 'Impact of sea-breeze activity on nearshore and foreshore processes in south-western Australia', Continental Shelf Research, vol. 17, no. 13, pp Pitchen, P. 1993, Sand Bank Dynamics in Warnbro Sound, Honours Thesis, University of Western Australia. Sanderson, P. B., Eliot, I., Hegge, B. & Maxwell, S. 2000, 'Regional variation of coastal morphology in south-western Australia: a synthesis', Geomorphology, vol. 34, pp Searle, D. J. & Logan, B. W. 1979, Sedimentation at Mandurah: A report to The Public Works Department of Western Australia, Department of Geology, University of Western Australia. Searle, D. J., Semeniuk, V. & Woods, P. J. 1988, 'Geomorphology, stratigraphy and Holocene history of the Rockingham - Becher Plain, South-western Australia', Journal of the Royal Society of Western Australia, vol. 70, no. 4, pp Silvester, R. 1987, Review of findings, Evaluation of the Westport environmental review and management program, Environmental Protection Authority.
86 8. References 82 Steedman, R. K. 1982, Record of storms, Port of Fremantle , R112, Steedman and Associates, Perth. Sunamura, T. & Mizuno, O. 1987, A study on depositional shoreline forms behind an island, No. 13, University of Tsukuba, Tsukuba. Tonk, A., Masselink, G. & Pattiaratchi, C. B. 2002, 'Longshore sediment transport due to sea breezes: An impoundment study'. Travers, A. 2004, 'Low energy beach morphology with respect to physical setting', (In Press). Woodroffe, C. D. 2003, Coasts: form, process and evolution, Cambridge University Press, New York.
87 Appendices 83 APPENDICES Appendix A1 Mersey Point Coastline Movement Plots This appendix contains the coastline movement plots for Mersey Point
88 Appendices 84
89 Appendices 85
90 Appendices 86 Appendix A2 Safety Bay Coastline Movement Plots This appendix contains the coastline movement plots for Safety Bay
91 Appendices 87
92 Appendices 88 Appendix A3 Becher Point Coastline Movement Plot This appendix contains the coastline movement plots for Becher Point
93 Appendices 89
94 Appendices 90 Appendix B Tern Island Aerial Photographs This appendix contains a time series of aerial photographs of the Tern Island sand bar


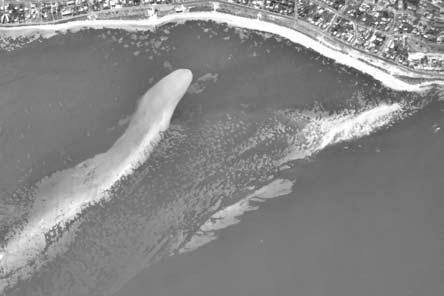
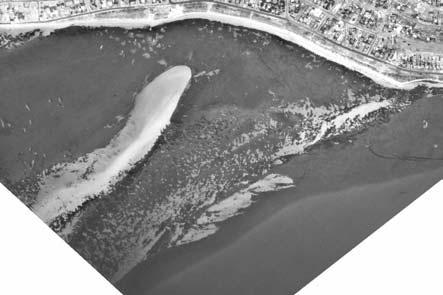
95 Appendices 91 Tern Island sand bar 1942 Tern Island sand bar 1954 Tern Island sand bar 1959 Tern Island sand bar 1967 Tern Island sand bar 1973 Tern Island sand bar 1976


 sand")
")
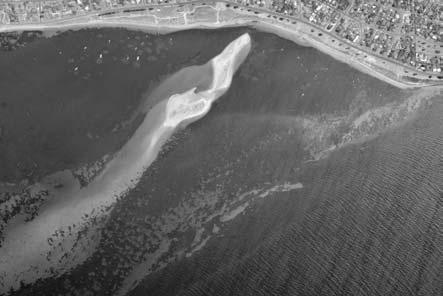
96 Appendices 92 Tern Island sand bar 1982 Tern Island sand bar 1988 Tern Island sand bar 1989 Tern Island sand bar 1993 Tern Island sand bar 1994 (12/94) Tern Island sand bar 1996A (01/96)

 Tern")
")
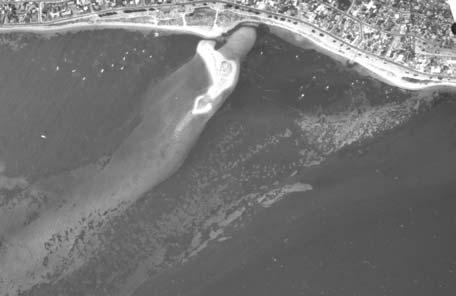
97 Appendices 93 Tern Island sand bar 1996 (12/96) Tern Island sand bar 1998A (02/98) Tern Island sand bar 1998 (12/98) Tern Island sand bar 2000 (12/00)
Australian Coastal Councils Conference
 Australian Coastal Councils Conference Kiama March 2019 Where Has My Beach Gone? (and what can I do about it?) Dr Andrew McCowan Water Technology Where Has My Beach Gone? Where Has My Beach Gone? Where
IMPACTS OF COASTAL PROTECTION STRATEGIES ON THE COASTS OF CRETE: NUMERICAL EXPERIMENTS
 IMPACTS OF COASTAL PROTECTION STRATEGIES ON THE COASTS OF CRETE: NUMERICAL EXPERIMENTS Tsanis, I.K., Saied, U.M., Valavanis V. Department of Environmental Engineering, Technical University of Crete, Chania,
DUXBURY WAVE MODELING STUDY
 DUXBURY WAVE MODELING STUDY 2008 Status Report Duncan M. FitzGerald Peter S. Rosen Boston University Northeaster University Boston, MA 02215 Boston, MA 02115 Submitted to: DUXBURY BEACH RESERVATION November
Volume and Shoreline Changes along Pinellas County Beaches during Tropical Storm Debby
 Volume and Shoreline Changes along Pinellas County Beaches during Tropical Storm Debby Ping Wang and Tiffany M. Roberts Coastal Research Laboratory University of South Florida July 24, 2012 Introduction
Shorelines Earth - Chapter 20 Stan Hatfield Southwestern Illinois College
 Shorelines Earth - Chapter 20 Stan Hatfield Southwestern Illinois College The Shoreline A Dynamic Interface The shoreline is a dynamic interface (common boundary) among air, land, and the ocean. The shoreline
OECS Regional Engineering Workshop September 29 October 3, 2014
 B E A C H E S. M A R I N A S. D E S I G N. C O N S T R U C T I O N. OECS Regional Engineering Workshop September 29 October 3, 2014 Coastal Erosion and Sea Defense: Introduction to Coastal Dynamics David
SELECTION OF THE PREFERRED MANAGEMENT OPTION FOR STOCKTON BEACH APPLICATION OF 2D COASTAL PROCESSES MODELLING
 SELECTION OF THE PREFERRED MANAGEMENT OPTION FOR STOCKTON BEACH APPLICATION OF 2D COASTAL PROCESSES MODELLING C Allery 1 1 DHI Water and Environment, Sydney, NSW Abstract This paper presents an approach
Inlet Management Study for Pass-A-Grille and Bunces Pass, Pinellas County, Florida
 Inlet Management Study for Pass-A-Grille and Bunces Pass, Pinellas County, Florida Final Report Submitted By Ping Wang, Ph.D., Jun Cheng Ph.D., Zachary Westfall, and Mathieu Vallee Coastal Research Laboratory
CROSS-SHORE SEDIMENT PROCESSES
 The University of the West Indies Organization of American States PROFESSIONAL DEVELOPMENT PROGRAMME: COASTAL INFRASTRUCTURE DESIGN, CONSTRUCTION AND MAINTENANCE A COURSE IN COASTAL DEFENSE SYSTEMS I CHAPTER
Chapter 10 Lecture Outline. The Restless Oceans
 Chapter 10 Lecture Outline The Restless Oceans Focus Question 10.1 How does the Coriolis effect influence ocean currents? The Ocean s Surface Circulation Ocean currents Masses of water that flow from one
Chapter. The Dynamic Ocean
 Chapter The Dynamic Ocean An ocean current is the mass of ocean water that flows from one place to another. 16.1 The Composition of Seawater Surface Circulation Surface Currents Surface currents are movements
Shoreline Response to an Offshore Wave Screen, Blairgowrie Safe Boat Harbour, Victoria, Australia
 Shoreline Response to an Offshore Wave Screen, Blairgowrie Safe Boat Harbour, Victoria, Australia T.R. Atkins and R. Mocke Maritime Group, Sinclair Knight Merz, P.O. Box H615, Perth 6001, Australia ABSTRACT
Lecture Outlines PowerPoint. Chapter 15 Earth Science, 12e Tarbuck/Lutgens
 Lecture Outlines PowerPoint Chapter 15 Earth Science, 12e Tarbuck/Lutgens 2009 Pearson Prentice Hall This work is protected by United States copyright laws and is provided solely for the use of instructors
Currents measurements in the coast of Montevideo, Uruguay
 Currents measurements in the coast of Montevideo, Uruguay M. Fossati, D. Bellón, E. Lorenzo & I. Piedra-Cueva Fluid Mechanics and Environmental Engineering Institute (IMFIA), School of Engineering, Research
To: William Woods, Jenni Austin Job No: CentrePort Harbour Deepening Project - Comments on community queries
 Memo To: William Woods, Jenni Austin From: Richard Reinen-Hamill Date: Subject: cc: 1 Purpose This memo sets out our response to issues raised at and after Seatoun community consultation sessions held
OCEAN WAVES NAME. I. Introduction
 NAME OCEAN WAVES I. Introduction The physical definition of a wave is a disturbance that transmits energy from one place to another. In the open ocean waves are formed when wis blowing across the water
Long Beach Island Holgate Spit Little Egg Inlet Historical Evolution Introduction Longshore Transport Map, Survey and Photo Historic Sequence
 Appendix B Long Beach Island Holgate Spit Little Egg Inlet Historical Evolution Introduction The undeveloped southern end of Long Beach Island (LBI) is referred to as the Holgate spit as it adjoins the
BYPASS HARBOURS AT LITTORAL TRANSPORT COASTS
 BYPASS HARBOURS AT LITTORAL TRANSPORT COASTS by K. Mangor 1, I. Brøker 2, R. Deigaard 3 and N. Grunnet 4 ABSTRACT Maintaining sufficient navigation depth in front of the entrance at harbours on littoral
Reading Material. Inshore oceanography, Anikouchine and Sternberg The World Ocean, Prentice-Hall
 Reading Material Inshore oceanography, Anikouchine and Sternberg The World Ocean, Prentice-Hall BEACH PROCESSES AND COASTAL ENVIRONMENTS COASTAL FEATURES Cross section Map view Terminology for Coastal
Wave-dominated embayed beaches. Andrew D Short School of Geosciences University of Sydney
 Wave-dominated embayed beaches Andrew D Short School of Geosciences University of Sydney Wave-dominated embayed beaches wave-dominated beaches embayed beaches morphodynamics of W-D embayed beaches circulation,
Low-crested offshore breakwaters: a functional tool for beach management
 Environmental Problems in Coastal Regions VI 237 Low-crested offshore breakwaters: a functional tool for beach management K. Spyropoulos & E. Andrianis TRITON Consulting Engineers, Greece Abstract Beach
Beach profile surveys and morphological change, Otago Harbour entrance to Karitane May 2014 to June 2015
 Beach profile surveys and morphological change, Otago Harbour entrance to Karitane May 2014 to June 2015 Prepared for Port Otago Ltd Martin Single September 2015 Shore Processes and Management Ltd Contact
Improving predictions of nearshore processes and shoreline dynamics for beaches along Australia s rocky and coral reef coasts
 Improving predictions of nearshore processes and shoreline dynamics for beaches along Australia s rocky and coral reef coasts Ryan Lowe Jeff Hansen, Graham Symonds, Mark Buckley, Andrew Pomeroy, Gundula
COFFS HARBOUR SEDIMENT MODELLING AND INVESTIGATION
 COFFS HARBOUR SEDIMENT MODELLING AND INVESTIGATION Luke McAvoy Undergraduate Engineer (Civil) Griffith School of Engineering, Griffith University, Gold Coast, Australia Daniel Rodger Senior Engineer Water
/50. Physical Geology Shorelines
 Physical Geology Shorelines Multiple Guess: (You know the drill 2 points each) 1. The path of movement of a water particle in a wave at sea is 1. circular 2. horizontal 3. vertical 4. elliptical 5. none
BEACH PROCESSES AND COASTAL ENVIRONMENTS
 BEACH PROCESSES AND COASTAL ENVIRONMENTS COASTAL FEATURES Cross section Map view TOPICS: Terminology Waves Beach Morphology Barriers Coastal Migration Tides Tidal Flats and Marshes Sediment Budgets Human
Figure 4, Photo mosaic taken on February 14 about an hour before sunset near low tide.
 The Impact on Great South Bay of the Breach at Old Inlet Charles N. Flagg and Roger Flood School of Marine and Atmospheric Sciences, Stony Brook University Since the last report was issued on January 31
page - Laboratory Exercise #5 Shoreline Processes
 page - Laboratory Exercise #5 Shoreline Processes Section A Shoreline Processes: Overview of Waves The ocean s surface is influenced by three types of motion (waves, tides and surface currents). Shorelines
MIAMI BEACH 32ND STREET HOT SPOT: NUMERICAL MODELING AND DESIGN OPTIMIZATION. Adam Shah - Coastal Engineer Harvey Sasso P.E.
 ABSTRACT MIAMI BEACH 32ND STREET HOT SPOT: NUMERICAL MODELING AND DESIGN OPTIMIZATION Adam Shah - Coastal Engineer Harvey Sasso P.E. - Principal Coastal Systems International, Inc. 464 South Dixie Highway
LAB: WHERE S THE BEACH
 Name: LAB: WHERE S THE BEACH Introduction When you build a sandcastle on the beach, you don't expect it to last forever. You spread out your towel to sunbathe, but you know you can't stay in the same spot
Chapter - Oceans and Coasts
 Chapter - Oceans and Coasts Discussion: What do oceans contribute to the environment of Earth? How do Earth s major systems relate to the oceans? Oceans and Coasts Oceans are important - Thermal regulation
Q1. What are the primary causes/contributors to coastal erosion at Westshore and the concept of longshore / littoral drift.
 Q1. What are the primary causes/contributors to coastal erosion at Westshore and the concept of longshore / littoral drift. In order of (timing related) contribution to present problem 1. Beach is too
Chapter 22, Section 1 - Ocean Currents. Section Objectives
 Chapter 22, Section 1 - Ocean Currents Section Objectives Intro Surface Currents Factors Affecting Ocean Currents Global Wind Belts (you should draw and label a diagram of the global wind belts) The Coriolis
Nearshore Morphodynamics. Bars and Nearshore Bathymetry. Sediment packages parallel to shore, that store beach sediment
 Nearshore Morphodynamics http://coastal.er.usgs.gov/bier/images/chandeleur-xbeach-lg.jpg Bars and Nearshore Bathymetry Sediment packages parallel to shore, that store beach sediment Can be up to 50 km
Advanced Series on Ocean Engineering - Volume 14 COASTAL STABILIZATION. Richard Silvester John R C Hsu. \v? World Scientific
 Advanced Series on Ocean Engineering - Volume 14 COASTAL STABILIZATION Richard Silvester John R C Hsu \v? World Scientific Contents PREFACE xv 1 INTRODUCTION 1 /. / Coastal Environment 2 J.2 State of Beach
Among the numerous reasons to develop an understanding of LST are:
 Longshore Sediment Transport Among the numerous reasons to develop an understanding of LST are: Process by which the products of terrestrial erosion (riverine sediments, sea cliff failures, etc.) are removed
General Coastal Notes + Landforms! 1
 General Coastal Notes + Landforms! 1 Types of Coastlines: Type Description Primary Coast which is essentially in the same condition when sea level stabilized Coastline after the last ice age, younger.
Sandy Beach Morphodynamics. Relationship between sediment size and beach slope
 Sandy Beach Morphodynamics Relationship between sediment size and beach slope 1 Longshore Sorting - Willard Bascom Beach Slope, Grain Size, and Wave Energy Beach at Sandwich Bay, Kent, UK near the Straights
CHAPTER 134 INTRODUCTION
 CHAPTER 134 NEW JETTIES FOR TUNG-KANG FISHING HARBOR, TAIWAN Chi-Fu Su Manager Engineering Department Taiwan Fisheries Consultants, Inc. Taipei, Taiwan INTRODUCTION Tung-Kang Fishing Harbor, which is about
Appendix E Cat Island Borrow Area Analysis
 Appendix E Cat Island Borrow Area Analysis ERDC/CHL Letter Report 1 Cat Island Borrow Area Analysis Multiple borrow area configurations were considered for Cat Island restoration. Borrow area CI1 is located
The ocean water is dynamic. Its physical
 CHAPTER MOVEMENTS OF OCEAN WATER The ocean water is dynamic. Its physical characteristics like temperature, salinity, density and the external forces like of the sun, moon and the winds influence the movement
Oceans and Coasts. Chapter 18
 Oceans and Coasts Chapter 18 Exploring the oceans The ocean floor Sediments thicken and the age of the seafloor increases from ridge to shore The continental shelf off the northeast United States Constituent
Available online at ScienceDirect. Procedia Engineering 116 (2015 )
") Available online at www.sciencedirect.com ScienceDirect Procedia Engineering 116 (2015 ) 320 325 8th International Conference on Asian and Pacific Coasts (APAC 2015) Department of Ocean Engineering, IIT
Available online at www.sciencedirect.com ScienceDirect Procedia Engineering 116 (2015 ) 320 325 8th International Conference on Asian and Pacific Coasts (APAC 2015) Department of Ocean Engineering, IIT
Julebæk Strand. Effect full beach nourishment
 Julebæk Strand Effect full beach nourishment Aim of Study This study is a part of the COADAPT funding and the aim of the study is to analyze the effect of beach nourishment. In order to investigate the
Marginal Marine Environments
 Marginal Marine Environments Delta: discrete shoreline protuberances formed where rivers enter oceans, semi-enclosed seas, lakes or lagoons and supply sediment more rapidly than it can be redistributed
Influence of oceanographic processes on coastal erosion, morphology and inundation
 FACULTY OF ENGINEERING, COMPUTING AND MATHEMATICS Influence of oceanographic processes on coastal erosion, morphology and inundation Charitha Pattiaratchi School of Civil, Environmental and Mining Engineering
Inspection of Clarence City Beaches following Winter 2011 Storm Events
 18 July 2011 WRL Ref: WRL10086TDS L20110718 Messrs P Watson & I Preece Clarence City Council PO Box 96 Rosny Park TAS 7018 By email: pwatson@ccc.tas.gov.au ipreece@ccc.tas.gov.au Dear Phil/Ian, Inspection
Exemplar for Internal Assessment Resource Geography Level 3. Resource title: The Coastal Environment Kaikoura
 Exemplar for internal assessment resource Geography 3.5A for Achievement Standard 91430 Exemplar for Internal Assessment Resource Geography Level 3 Resource title: The Coastal Environment Kaikoura This
Longshore sediment transport
 and Orson P. Smith, PE, Ph.D., Professor Emeritus Longshore transport Waves breaking at an angle to shore Sediment under breakers lifted by saltation Drops back to sea bed a little down drift Swash (runup)
There are many different kinds of beaches which are generally characterized by the dominance of waves, tides, rivers and currents, and in particular
 Fig. 11-11, p. 253 There are many different kinds of beaches which are generally characterized by the dominance of waves, tides, rivers and currents, and in particular differ by the amount of energy, which
Concepts & Phenomena
 Concepts & Phenomena in coastal and port sedimentation R. Kamalian Ports and Maritime Organization of Iran and PIANC-Iran 7 9 December 2015 What is the problem? Many harbours have sedimentation problems
MESSOLOGI LAGOON AREA (GREECE)
") MESSOLOGI LAGOON AREA (GREECE) 20 Contact: Kyriakos SPYROPOULOS TRITON Consulting Engineers 90 Pratinou Str. 11634 Athens (GREECE) Tel: +32 10 729 57 61 Fax: +32 10 724 33 58 e-mail: kspyropoulos@tritonsa.gr
MESSOLOGI LAGOON AREA (GREECE) 20 Contact: Kyriakos SPYROPOULOS TRITON Consulting Engineers 90 Pratinou Str. 11634 Athens (GREECE) Tel: +32 10 729 57 61 Fax: +32 10 724 33 58 e-mail: kspyropoulos@tritonsa.gr
The evolution of beachrock morphology and its influence on beach morphodynamics
 The evolution of beachrock morphology and its influence on beach morphodynamics Robert J. Turner Division of Natural Sciences, Southampton College, 239 Montauk Highway, Southampton, NY 11968, U.S.A. email:
HURRICANE SANDY LIMITED REEVALUATION REPORT UNION BEACH, NEW JERSEY DRAFT ENGINEERING APPENDIX SUB APPENDIX D SBEACH MODELING
 HURRICANE SANDY LIMITED REEVALUATION REPORT UNION BEACH, NEW JERSEY DRAFT ENGINEERING APPENDIX SUB APPENDIX D SBEACH MODELING Rev. 18 Feb 2015 1 SBEACH Modeling 1.0 Introduction Following the methodology
USE OF SEGMENTED OFFSHORE BREAKWATERS FOR BEACH EROSION CONTROL
 .. CETN-III-22 4/84 PURPOSE: USE OF SEGMENTED OFFSHORE BREAKWATERS FOR BEACH EROSION CONTROL To provide information on the functional application of and general design considerations for using offshore
MODELING OF CLIMATE CHANGE IMPACTS ON COASTAL STRUCTURES - CONTRIBUTION TO THEIR RE-DESIGN
 Proceedings of the 14 th International Conference on Environmental Science and Technology Rhodes, Greece, 3-5 September 2015 MODELING OF CLIMATE CHANGE IMPACTS ON COASTAL STRUCTURES - CONTRIBUTION TO THEIR
EVALUATION OF BEACH EROSION UP-DRIFT OF TIDAL INLETS IN SOUTHWEST AND CENTRAL FLORIDA, USA. Mohamed A. Dabees 1 and Brett D.
 EVALUATION OF BEACH EROSION UP-DRIFT OF TIDAL INLETS IN SOUTHWEST AND CENTRAL FLORIDA, USA Mohamed A. Dabees 1 and Brett D. Moore 1 The paper discusses the analysis of up-drift beach erosion near selected
SEDIMENT BUDGET OF LIDO OF PELLESTRINA (VENICE) Written by Marcello Di Risio Under the supervision of Giorgio Bellotti and Leopoldo Franco
 Written by Marcello Di Risio Under the supervision of Giorgio Bellotti and Leopoldo Franco") SEDIMENT BUDGET OF LIDO OF PELLESTRINA (VENICE) Written by Marcello Di Risio Under the supervision of Giorgio Bellotti and Leopoldo Franco Table of contents: 1. Introduction...3 2. Protection structures
SEDIMENT BUDGET OF LIDO OF PELLESTRINA (VENICE) Written by Marcello Di Risio Under the supervision of Giorgio Bellotti and Leopoldo Franco Table of contents: 1. Introduction...3 2. Protection structures
Jimmy s beach preliminary results
 Jimmy s beach preliminary results LP 668979 Jimmy s Beach Restoration Society 1 Outline 1. Long term: GIS analyses. Aerial photos, charts Shoreline analyses Storm data from MHL/DECC 2. Medium term: morphologic
Chesil Beach, Dorset UK High energy, shingle coastline. Brighton Beach, Sussex UK Pebble beach
 Beaches: Depositional landform Extends from the highest high tide to the lowest low tide. Very important temporary store in coastal system. Accretion: sediment returning to the visible portion of a beach
CMS Modeling of the North Coast of Puerto Rico
 CMS Modeling of the North Coast of Puerto Rico PRESENTED BY: Dr. Kelly Rankin Legault, Ph.D., P.E. 1 Dr. Alfredo Torruella, Ph.D. 2 1 USACE Jacksonville District 2 University of Puerto Rico October 2016
INTRODUCTION TO COASTAL ENGINEERING AND MANAGEMENT
 Advanced Series on Ocean Engineering Volume 16 INTRODUCTION TO COASTAL ENGINEERING AND MANAGEMENT J. William Kamphuis Queen's University, Canada World Scientific Singapore New Jersey London Hong Kong Contents
SHORE PROTECTION AND HABITAT CREATION AT SHAMROCK ISLAND, TEXAS ABSTRACT
 SHORE PROTECTION AND HABITAT CREATION AT SHAMROCK ISLAND, TEXAS M. Cameron Perry, P.E., and Daniel J. Heilman, P.E. Coastal Engineer Shiner Moseley & Associates., Inc. 555 N. Carancahua Corpus Christi,
The Impact on Great South Bay of the Breach at Old Inlet Charles N. Flagg School of Marine and Atmospheric Sciences, Stony Brook University
 The Impact on Great South Bay of the Breach at Old Inlet Charles N. Flagg School of Marine and Atmospheric Sciences, Stony Brook University The previous report provided a detailed look at the conditions
COASTAL ENVIRONMENTS. 454 lecture 12
 COASTAL ENVIRONMENTS Repeated movement of sediment & water constructs a beach profile reflecting the balance between average daily or seasonal wave forces and resistance of landmass to wave action Coasts
An Update of Coastal Erosion in Puerto Rico
 Jack Morelock and Maritza Barreto An Update of Coastal Erosion in Puerto Rico Department of Marine Sciences, University of Puerto Rico at Mayagüez and Geography Department, University of Puerto Rico at
SURFACE CURRENTS AND TIDES
 NAME SURFACE CURRENTS AND TIDES I. Origin of surface currents Surface currents arise due to the interaction of the prevailing wis a the ocean surface. Hence the surface wi pattern (Figure 1) plays a key
Artificial headlands for coastal restoration
 Artificial headlands for coastal restoration J. S. Mani Professor, Department of Ocean Engineering, Indian Institute of Technology Madras, Chennai 636, India Abstract Construction of a satellite harbour
Undertow - Zonation of Flow in Broken Wave Bores
 Lecture 22 Nearshore Circulation Undertow - Zonation of Flow in Broken Wave Bores In the wave breaking process, the landward transfer of water, associated with bore and surface roller decay within the
Beach Profiles. Topics. Module 9b Beach Profiles and Crossshore Sediment Transport 3/23/2016. CE A676 Coastal Engineering
 Beach Profiles AND CROSS-SHORE TRANSPORT Orson P. Smith, PE, Ph.D., Professor Emeritus Topics Features of beach and nearshore profiles Equilibrium profiles Cross-shore transport References Text (Sorensen)
Earth Science Chapter 16 Section 3 Review
 Name: Class: Date: Earth Science Chapter 16 Section 3 Review Multiple Choice Identify the choice that best completes the statement or answers the question. 1. The movement of water that parallels the shore
SWASH MODELLING OF A COASTAL PROTECTION SCHEME
 SWASH MODELLING OF A COASTAL PROTECTION SCHEME Mark Klein 1, Andrew Symonds 2, Marcel Zijlema 3, Dan Messiter 4 and Michael Dufour 5 The Beresford shoreline, Australia, is subject to a complex interaction
LOCALLY CONCENTRATED SEVERE BEACH EROSION ON SEISHO COAST CAUSED BY TYPHOON T0709
 F-4 Fourth International Conference on Scour and Erosion 2008 LOCALLY CONCENTRATED SEVERE BEACH EROSION ON SEISHO COAST CAUSED BY TYPHOON T0709 Yoshimitsu TAJIMA 1 and Shinji SATO 2 1 Member of JSCE, Associate
COASTAL SYSTEMS WAVE ENERGY
 WAVE ENERGY The energy of a wave determines its ability to erode and transport material on the coast Wave energy depends on the fetch, the distance the wind has blown the wave Wind strength and wind duration
Beach Wizard: Development of an Operational Nowcast, Short-Term Forecast System for Nearshore Hydrodynamics and Bathymetric Evolution
 Beach Wizard: Development of an Operational Nowcast, Short-Term Forecast System for Nearshore Hydrodynamics and Bathymetric Evolution Ad Reniers Civil Engineering and Geosciences, Delft University of Technology
A process based approach to understand WA s complex coastline Jeff Hansen Ryan Lowe Graham Symonds Laura Segura Gundula Winter
 A process based approach to understand WA s complex coastline Jeff Hansen Ryan Lowe Graham Symonds Laura Segura Gundula Winter WA s coastline is highly variable due to offshore and shore-attached coral
Chapter 8 Wave climate and energy dissipation near Santa Cruz Island, California
 Chapter 8 Wave climate and energy dissipation near Santa Cruz Island, California NATHAN BURLEY A* AND ROBYN SUDDETH B A CIVIL & ENVIRONMENTAL ENGINEERING B GRADUATE GROUP IN HYDROLOGIC SCIENCES UNIVERSITY
MONITORING SEDIMENT TRANSPORT PROCESSES AT MANAVGAT RIVER MOUTH, ANTALYA TURKEY
 COPEDEC VI, 2003 in Colombo, Sri Lanka MONITORING SEDIMENT TRANSPORT PROCESSES AT MANAVGAT RIVER MOUTH, ANTALYA TURKEY Isikhan GULER 1, Aysen ERGIN 2, Ahmet Cevdet YALCINER 3 ABSTRACT Manavgat River, where
COASTAL EROSION: INVESTIGATIONS IN THE SOUTHWEST COAST OF SRI LANKA
 COASTAL EROSION: INVESTIGATIONS IN THE SOUTHWEST COAST OF SRI LANKA Wijayawardane I.S.K. 1, Ansaf K.M.M. 2, Ratnasooriya A.H.R. 3, Samarawickrama S.P. 4 1,2 Postgraduate Student, Department of Civil Engineering,
Waves. G. Cowles. General Physical Oceanography MAR 555. School for Marine Sciences and Technology Umass-Dartmouth
 Waves G. Cowles General Physical Oceanography MAR 555 School for Marine Sciences and Technology Umass-Dartmouth Waves Sound Waves Light Waves Surface Waves Radio Waves Tidal Waves Instrument Strings How
4/20/17. #30 - Coastlines - General Principles Coastlines - Overview
 Writing Assignment Due one week from today by 11:59 pm See main class web pages for detailed instructions Essays will be submitted in Illinois Compass (instructions later) Pick one: Earthquakes, tsunamis,
MULTIDECADAL SHORELINE EVOLUTION DUE TO LARGE-SCALE BEACH NOURISHMENT JAPANESE SAND ENGINE? Abstract
 MULTIDECADAL SHORELINE EVOLUTION DUE TO LARGE-SCALE BEACH NOURISHMENT JAPANESE SAND ENGINE? Masayuki Banno 1, Satoshi Takewaka 2 and Yoshiaki Kuriyama 3 Abstract Beach nourishment is one of the countermeasures
Undertow - Zonation of Flow in Broken Wave Bores
 Nearshore Circulation Undertow and Rip Cells Undertow - Zonation of Flow in Broken Wave Bores In the wave breaking process, the landward transfer of water, associated with bore and surface roller decay
The construction of Deepwater Navigation Channel (DNC) in the Bystry arm of the Danube Delta has started in The whole project provides the
 in the Bystry arm of the Danube Delta has started in The whole project provides the") Annex 45 Numerical Studies of Waves, Currents and Sediment Transport at the Marine Part of Deepwater Navigation Channel through the Bystry Arm of the Danube Delta and Model Verification based on Laboratory
Annex 45 Numerical Studies of Waves, Currents and Sediment Transport at the Marine Part of Deepwater Navigation Channel through the Bystry Arm of the Danube Delta and Model Verification based on Laboratory
April 7, Prepared for: The Caribbean Disaster Emergency Response Agency Prepared by: CEAC Solutions Co. Ltd.
 April 7, 2006 Prepared for: The Caribbean Disaster Emergency Response Agency Prepared by: Introduction CEAC Solutions Co. Ltd was commissioned in May 2005 to prepare coastal beach erosion hazard maps for
Technical Brief - Wave Uprush Analysis 129 South Street, Gananoque
 Technical Brief - Wave Uprush Analysis 129 South Street, Gananoque RIGGS ENGINEERING LTD. 1240 Commissioners Road West Suite 205 London, Ontario N6K 1C7 June 12, 2013 Table of Contents Section Page Table
Shore - place where ocean meets land Coast - refers to the larger zone affected by the processes that occur at this boundary.
 Waves, Beaches, and Coasts Shore - place where ocean meets land Coast - refers to the larger zone affected by the processes that occur at this boundary. Waves: energy moving through water The height of
G. Meadows, H. Purcell and L. Meadows University of Michigan
 www.coj.net/departments/fire+and+rescue/emergency+preparedness/rip+current.htm G. Meadows, H. Purcell and L. Meadows Over 80% of all surf related rescues are attributable to Rip Currents According to the
Nearshore Placed Mound Physical Model Experiment
 Nearshore Placed Mound Physical Model Experiment PURPOSE: This technical note describes the migration and dispersion of a nearshore mound subjected to waves in a physical model. The summary includes recommendations
COASTAL MORPHODYNAMICS
 COASTAL MORPHODYNAMICS PATRICIA CHARDÓN-MALDONADO, PHD, EIT Miguel Canals, Jack A. Puleo, Alec Torres-Freyermuth & Jens Figlus March 9, 2017 OUTLINE INTRODUCTION Meteorological Phenomena Forcing Conditions
Overview. Beach Features. Coastal Regions. Other Beach Profile Features. CHAPTER 10 The Coast: Beaches and Shoreline Processes.
 Overview CHAPTER 10 The Coast: Beaches and Shoreline Processes Coastal regions constantly change. The beach is a dominant coastal feature. Wave activity continually modifies the beach and coastal areas.
THE WAVE CLIMATE IN THE BELGIAN COASTAL ZONE
 THE WAVE CLIMATE IN THE BELGIAN COASTAL ZONE Toon Verwaest, Flanders Hydraulics Research, toon.verwaest@mow.vlaanderen.be Sarah Doorme, IMDC, sarah.doorme@imdc.be Kristof Verelst, Flanders Hydraulics Research,
MAR 110 LECTURE #15 Wave Hazards
 1 MAR 110 LECTURE #15 Wave Hazards Rogue Wave Hazard Rogue waves are very large open ocean waves of sometimes can range in height from 60 ft (20m) to120 feet (40m) and thus a significant hazard to large
Directed Reading. Section: Ocean Currents. a(n). FACTORS THAT AFFECT SURFACE CURRENTS
. FACTORS THAT AFFECT SURFACE CURRENTS") Skills Worksheet Directed Reading Section: Ocean Currents 1. A horizontal movement of water in a well-defined pattern is called a(n). 2. What are two ways that oceanographers identify ocean currents? 3.
Skills Worksheet Directed Reading Section: Ocean Currents 1. A horizontal movement of water in a well-defined pattern is called a(n). 2. What are two ways that oceanographers identify ocean currents? 3.
Wave behaviour in the inner surf zone
 Wave behaviour in the inner surf zone Hannah POWER 1 and Michael HUGHES 2 Abstract: The inner surf zone is a critical component of models that are used to predict nearshore wave behaviour and beach morphodynamics.
The Continuing Evolution of the New Inlet
 The Continuing Evolution of the New Inlet Charles N. Flagg, Roger Flood and Robert Wilson School of Marine and Atmospheric Sciences, Stony Brook University It is now a year plus since super storm Sandy
Anatomy of Coastal Regions
 The Coast I. BEACH ANATOMY Anatomy of Coastal Regions Terms for different parts of beaches and coastal regions Are all about ENERGY- ie, where the ocean s energy Mostly through tides and waves, and shape
Technical Brief - Wave Uprush Analysis Island Harbour Club, Gananoque, Ontario
 Technical Brief - Wave Uprush Analysis RIGGS ENGINEERING LTD. 1240 Commissioners Road West Suite 205 London, Ontario N6K 1C7 October 31, 2014 Table of Contents Section Page Table of Contents... i List
A REVIEW OF THE CONDITION OF THE MUNICIPAL BEACHES AS A RESULT OF HURRICANE SANDY IN THE BOROUGH OF STONE HARBOR, CAPE MAY COUNTY, NEW JERSEY
 A REVIEW OF THE CONDITION OF THE MUNICIPAL BEACHES AS A RESULT OF HURRICANE SANDY IN THE BOROUGH OF STONE HARBOR, CAPE MAY COUNTY, NEW JERSEY View along the dune scarp from 103 rd Street on October 31,
PROPAGATION OF LONG-PERIOD WAVES INTO AN ESTUARY THROUGH A NARROW INLET
 PROPAGATION OF LONG-PERIOD WAVES INTO AN ESTUARY THROUGH A NARROW INLET Takumi Okabe, Shin-ichi Aoki and Shigeru Kato Department of Civil Engineering Toyohashi University of Technology Toyohashi, Aichi,