5. Tropical Cyclone Storm Surge and Open Ocean Waves
|
|
|
- Collin Wright
- 6 years ago
- Views:
Transcription
1 Chapter Five Dr. Steve Lyons U.S. National Weather Service 5. Tropical Cyclone Storm Surge and Open Ocean Waves 5.1 Introduction There has been some misunderstanding about the forecasting of tropical cyclone (TC) waves. In fact, some centers that forecast tropical storm and hurricane/typhoon waves have collocated the radius of 12-ft (4-m) seas with the radius of 34-kt (64 km/h) winds (tropical storm force winds). I am uncertain where this methodology came from, but it is a completely unfounded and an incorrect practice. It is very possible to get 12-ft (4-m) seas more than 1500 miles (~2400 km) away from a TC and I am unaware that tropical storm winds have ever had such a radial extent! So what practices are useful for forecasting TC waves? Part of the problem lies in the fact that very few numerical models actually represent the correct magnitude of TC winds in their analysis, let alone in their forecasts, especially for very strong TCs. These model wind deficiencies very often result in large underestimates of wave heights in and around a TC, especially for strong ones. 5.2 Wave growth The physics of waves in and around a TC are no different than they are for any other oceanic wind system. The elements that dictate wave growth are three, namely; 1) Wind speed 2) Wind fetch (distance the wind blows over the ocean) 3) Wind duration (how much time wind of a given speed blows) Wind speed is fairly straight forward assuming one has good measurements of it in and around a TC. Unfortunately, ships sortie away from strongest winds in a tropical cyclone in most cases. In fact, most ship captains try to keep their ships well outside the 34-knot (64 km/h) wind radius of a TC. Satellite winds most typically represent elevations near cumulus cloud base and can be used and adjusted to the surface (the standard is a 10 meter wind), but this requires some knowledge of atmospheric stability in the lowest few thousand feet and some knowledge of the vertical profile of wind change with height. Neither is routinely well known in and around a TC from direct measurements, hence reasonable physical assumptions are often applied which can and do have uncertainty and error. Microwave/scatterometer winds can see through deep layers of clouds and are excellent wind sources, but can become smoothed near small tight
2 eyes of TCs where averaging of near calm eye winds and fast eyewall winds and strong tight gradients of wind within the and just outside the eyewall can occur. The signature of scatterometer winds becomes poor for very high winds making estimates of wind speeds above 80 knots (129 km/h) very difficult. But for winds below that, they provide excellent surface (10- m) winds except where land contamination can make them unusable in coastal waters and in bays. I will not detail how to determine the best wind estimates, but sound meteorological reasoning and excellent synoptic weather analysis skills are essential. These techniques are discussed in Chapters 3 and 4. What makes wave forecasting even more challenging is the fact that the magic three parameters (above) controlling wave growth are NOT "linearly" related to wave growth. Instead wave growth is related to them as follows: 1. Wave growth is proportional to wind speed squared 2. Wave growth is proportional to the 3/2 power of wind duration 3. Wave growth is proportional to the square root of wind fetch distance So if one is to make error in the estimates of these parameters the most sensitive is wind speed, followed by wind duration; the least sensitive is fetch distance. Obviously one would want to be as accurate as possible estimating all three parameters. The fact that it is very possible for a knowledgeable meteorologist to determine current wind speed within a TC better than a numerical model can determine it begs for a simple wave model that allows direct wind inputs by the forecaster. This may not be the case for wind "forecasts." Fortunately, because TCs are generally small compared to typical synoptic scale oceanic weather features, and because they are either short lived or meander and loop along contoured tracks, both the wind fetch and/or the wind duration are huge limiting factors for wave growth in TCs that typically produce very high winds. If it were not for this fact, we could see ocean waves routinely in the 100- to 150-foot (30- to 45-m) range from strong TCs! The most fortunate aspect of TC wave forecasting is that wave growth is controlled by the time integrated wind speed and wind fetch. This means that we can get a fairly close approximation to wave heights without knowing the "exact" local value and spatial distribution of wind, but rather the ensemble effect of wind integrated through time. We know this by the fact that model wind nowcasts and forecasts compared to local observations have a much lower correlation than do model wave forecasts compared to local wave observations. This aspect of wave forecasting is NOT by itself obvious to many forecasters! By getting the integrated picture correct we can very often get a close estimate of wave heights and wave periods, but the exact spectrum of waves generated can be less accurate and can result in significant errors. 5.3 Wave spectrum
, that spectrum can become even broader than in a typical oceanic")
3 The nature of wind blowing on the ocean results in not a single wave height and wave period, but rather a spectrum of wave heights and wave periods. For TCs where we have very large changes in wind speed over very short distances (eye wall to eye and eye wall to circulation edge), that spectrum can become even broader than in a typical oceanic storm. The result can often be a very tumultuous sea state in and near a TC. What we actually attempt to forecast is the significant wave height which statistically is the average of the highest 1/3 of waves, referred to as H1/3 or H s. This convention is used in buoy wave measurements as well as in wave forecasts for the simple reason that a ship at sea reporting a single wave height will provide a number very close to the average of the highest 1/3 of waves. So, measurements, models and forecasters attempt to measure or predict what the customer typically reports as the dominant sea state. A simple diagram, showing averages from a spectrum of waves, is shown below with significant wave height (H s ) marked. Figure 5.1. Diagram of the spectrum of waves or number versus height, where Hs is the significant wave height, H1/10 is the "maximum wave height" or the highest 10th wave, and H1/100 is the highest 100th wave. The diagram shows the relationship between the most probable wave height, the mean wave height, and the highest 1/3 of waves. The statistical character of waves allows us to also estimate not only the average of the highest 1/3 but the average of the highest 1/10, 1/100 or single maximum wave likely to occur within a large sample. Those numbers are approximately related to H 1/3 or H s as follows: H max = 2.00 x H s H 1/100 = 1.67 x H s H 1/10 = 1.27 x H s H 1/3 = 1.00 x H s
4 When more than one group of waves is occurring at the same time the combined H s is typically given by H s combined = sqrt (w*w + s1*s1 + s2*s2 + s3*s3 + etc.) Namely, the square root of the sum of the squares of the wind wave and each swell group within a given area. In the case of a TC this can get complicated as the circular rotation of winds around a tight center generates waves basically spreading out in all directions, some superimposing upon others temporarily as they race away from the wind wave generation source. The maximum combined sea would then be approximated by 2.0 x H s combined. As you can see individual very large waves can and have occurred within or near a TC. The rare "rogue wave" is basically nothing more than a very temporary, local superposition of waves of varied height and period. In some rarer cases, the "maximum single wave" recorded has been closer to 3-4 times H s combined! 5.4 Wind fetch length With a relatively small (in most cases) and circular TC, ideally there is only a single point around the circulation that is pointing in the same direction that might be considered a wind fetch distance. As the cyclone circulation becomes larger this point effectively becomes an area that grows with decreasing curvature (increasing cyclone size). For all practical purposes a fetch that appears to work best is that area where wind directions are within about 20 degrees of a center line of interest. Thus an area with wind directions that span about a 40 degree region most often provide the best input to determining wind fetch length. Hence, for example, along a line directed toward west (270 degrees), all winds within a range of approximately 250 degrees and 290 degrees would be considered within a fetch generation area pointing toward west (270 degrees). A very simple schematic is shown below of a fetch distance marked out by my time-trusted "40 degree rule" (shown in green) along a line directed from right to left.
5 Figure 5.2. Relationship between wind speed and fetch length in a tropical cyclone. The green line shows the fetch length for a 34-knot wind, a 50-knot wind, and a 64- knot wind. This fetch length could be for a 34-kt (64-km/h) wind, a 50-kt (93-km/h) wind, a 64-kt (119-km/h) wind or any other wind speed that might be known or estimated (as shown in Fig. 5.2).Immediately obvious is the fact that the distance of this green line increases quickly as the size of a TC increases. It is for this reason that large TCs generate much higher waves than do small TCs, many times even when the small TC is much more intense! The net wind within a fetch can then be averaged to include the fraction or percent of wind of known speed added to those of other speeds. The net result is a wind fetch length of specific size with an averaged wind speed within it. Hence rather than have a highly changing wind speed across a short distance of a TC sector which is rarely known with great certainty, one uses a weighted wind (based on % of distance) across a larger simpler wind radius. Some reasonable assumptions using this methodology can be used to build a very simple TC wave forecast model that can be tuned using observations from a number of TC wave observations. Ideally this would be tuned initially with a TC(s) that is stationary for some length of time (not too many samples to choose from). A very accurate forecast of Hs and the period of those waves can be gotten in this manner. There can be some underestimate of maximum wave heights using this methodology when the fetch of maximum winds is very small (i.e. very small TCs), fortunately in those cases wave heights are severely limited by wind fetch and wind duration. It turns out that because the weaker winds (e.g. tropical storm winds) around the TC always cover a larger area than hurricane or strong hurricane winds, they can at times be the dominant wave generation area from a TC, especially when the strong wind area is tiny. The exact spectral characteristics of the wave group cannot be gotten using the simple methodology described here, but if the dominant waves and wave periods are forecast, this information will be by far the most important information about any TC wave set for most purposes, especially for mariners at sea and for coastal impacts. As noted above the "wind fetch" is the least sensitive input parameter to wave growth, that does not mean you can get it wrong and still get the correct wave answer, but the errors from incorrect wind fetches are more forgiving and will result in far less wave forecast errors than errors in wind speed or wind duration.
6 Obviously, a two dimensional wave model can be used with excellent success IF one knows the 2-D wind field through time within the model with great detail. This is sometimes known with some certainty "after" the TC event; hence it is a very valuable post-storm analysis/hindcast tool. Maximum wave climates (or wave height return periods) for specific ocean areas are often estimated in this way which aid in decisions made about coastal development among other things. A significant problem comes in real-time events with forecasts of wind waves by the wave model out in time using model wind forecasts. Poor wind forecasts can obscure/blur the more accurate wind wave forecasts generated by initial wind conditions and/or short term wind forecasts that are more accurate. There is no way to separate the more accurate portions of modeled waves from the highly uncertain portions of modeled waves within any numerical wave model forecast. These forecast errors can also infect the initial conditions in the wave model as no wave models that I am aware of use wave observations or "wave analyses" as input to wave model initial conditions. First guesses all come from model wave 6 hour or 12 hour forecasts based on wind forcing. For example, an atmospheric model forecasts the TC to turn toward NW in 36 hours and strengthen, but in reality the cyclone continues on a more WNW track and does not intensify. The short term wave forecast may be accurate, but the wave forecast during the time the wind forecast was incorrect is completely erroneous. There is no way to separate the good wave forecasts from the bad ones within that model. The resultant impact at a distant coast is then a combination of an accurate swell forecast by initial conditions mixed with completely erroneous wind waves possibly affecting that coastline! Because model forecasts of TC rapid intensity change are very poor, the most sensitive wave model input (wind speed) completely overwhelms in a negative way the accuracy of the wave model forecast. Human interaction with simpler wave models allows for portions of poor wind/wave forecasts to be excluded or immediately reworked with new or more accurate winds at any time that information becomes known. 5.5 Wind duration You know about the dangerous "right-front quadrant" of a TC in the Northern Hemisphere, it would be the "left-front quadrant" in the Southern Hemisphere. Most tropical meteorologists attribute this to the fact that this quadrant typically has the highest winds due to the forward motion of the TC being added to the winds from cyclostrophic balance or gradient wind balance (based on the rotation direction around the circulation center). However, it may be a surprise to you that the asymmetry in winds around a TC, rarely are a major cause for wave asymmetries shifted toward the cyclone's right-front quadrant! Let's look at a few examples. The first is a stationary TC with winds exactly symmetric around the circulation. This does not mean a symmetric pressure field/gradient, as the Coriolis parameter changes with latitude and hence causes wind asymmetries around a TC for a symmetric pressure gradient due to latitudinal changes in Coriolis force. This changing Coriolis force across a TC from equator to pole leads to "Beta Drift", which alters the TC track forecasts
7 also. Assuming no currents or shallow water, and the same ocean temperature, waves everywhere around the TC would be identical as the wind forcing on the ocean would be symmetric (Fig. 5.3). Only the increases in winds nearing the eyewall would cause radial wave height changes, but those too would be symmetric. Figure 5.3. The circle represents a stationary tropical cyclone with symmetric wind field and no ocean currents. The red arrows indicate that the wave growth and propagation are the same everywhere. Now let us add a forward motion vector (green arrow below not drawn to scale) (Fig. 5.4) to the TC as depicted below (the specific direction is irrelevant just change the direction vector to one you desire and the result relative to that direction will be unchanged).
8 Figure 5.4. The circle represents a tropical cyclone (TC) moving in a direction and at a speed as indicated by the green TC motion vector. Orange arrows indicate the speed and direction of the wind in the direction of TC movement and opposite the TC motion. Red arrows indicate the relative winds around the TC. The blue irregular lines indicate the waves being generated by the TC in the direction of motion and opposite the direction of motion. Two things now happen: 1) Winds on the north (top) side of this diagram become stronger (orange arrow pointing west/left) than those on the south (bottom) side of the diagram (orange arrow pointing east/right) because you are now adding the storm forward motion vector to east winds at the top, but are subtracting the forward motion vector from west winds at the bottom. This results in a wind asymmetry which can result in higher waves where winds are stronger. But this is the much smaller affect of the two. 2) Waves (blue) at the top of the diagram move to the west/left in the same direction the wind is blowing and in the same direction the TC is moving. Waves at the bottom of the diagram move to the east/right in the opposite direction the wind is blowing and in the opposite direction the TC is moving. In a relatively short time, waves moving east/right find themselves well removed from the TC wind field, while waves moving west/left continue to be within the TC wind field and depending upon the speed of the waves and the speed of the TC could remain in that wind generation area for a long time! So 12 to 24 hours later we find that waves, which remain in the wind generation area, have grown significantly, while waves that have been left behind and are moving away from the TC, had only a short time to grow and are now decaying as swell (see Fig. 5.5). This is an example of the significant influence wind duration has on wave growth in a TC. That duration can be very short for small TCs moving quickly in quadrants other than the right-front quadrant where waves move with the TC and have more wind duration to generate waves.
9 Figure 5.5. Same as Figure 5.4 but for "some later time". Blue lines show the large wave growth where waves remain in the wave generation area (top) and large wave decay where waves leave the wave generation area (bottom). It turns out that waves spend the least amount of time in the left (right) rear quadrant in the Northern (Southern) Hemisphere and are routinely smallest there, that time dependent upon TC speed and size. Waves spend more time in the quadrants perpendicular to the TC's motion than in the left-rear quadrant, that time is dependent upon TC speed and TC size. Times (wind durations) are the same in both quadrants perpendicular to motion. Waves spend the most time in the quadrant moving in the same direction as the waves generated by the wind and that time is dependent upon how fast wave energy moves compared to how fast the TC moves. Because wave energy speed is directly proportional to the wave's period, it is possible to generate waves with wave periods that move waves at exactly the same speed as the TC, thus keeping waves beneath the wind generation area for long periods of time (for a straight moving TC) resulting in astoundingly high wave growth. For TCs of typical size and of hurricane intensity wave periods that allow them to stay with the TC correspond to a TC forward motion of "about" mph (29-35 km/h). For small and/or weak TCs generating shorter period, slower moving waves, the optimal speed is slower. For large and strong TCs this optimal wave growth speed is faster. Note that the optimal speed can and does change because early on waves are just beginning to form while later they become much larger. Hence, ideally maximum wave growth will occur from a TC that steadily increases in forward speed along a straight (great circle) track up to about mph (29-35 km/h). The "trapped fetch" scenario is discussed in more detail in section If a TC moves very fast (typical for those transitioning to non-tcs in the mid-latitudes), it leaves behind most of the waves it generates, not allowing them to continue to grow. If a TC moves too slowly, generated waves move away from the TC and are no longer able to grow (the most typical scenario). The track of the TC is very important for wind duration and hence wave generation. For a TC moving along a track that has large turns in it (e.g., Fig. 5.6), wind duration can be determined in pieces for each segment with persistent motion (e.g. the 5 segments shown below along a highly varying TC track). For a straight mover, one only has to calculate wave speed versus TC speed, determine wind fetch length and calculate the time wind remains over the waves it is generating.
10 Figure 5.6. Irregular tropical cyclone track that must be split into segments (1 to 5) in order to calculate the wind duration and the resulting wave generation. In summary, the PRIMARY reason for waves being so much larger in the right-front (left-front) quadrant of a TC in the Northern (Southern) Hemisphere is due to the duration winds have to generate waves in that sector! 5.6 Tropical cyclone swells So far we have talked about waves generated within a TC wind area. These wind waves, do not just stop when they exit or leave the wind generation area, instead they continue to move/propagate as "swell" (waves that have left the wind generation area) away from the TC in all directions, and they will usually propagate until they reach land! The wind waves have been generated and with asymmetric heights dependent on wind speed, wind fetch length and wind duration asymmetries around the TC. Four things happen to these swells, namely: 1. They move along great circle tracks with some spreading laterally along those tracks; 2. They undergo wave dispersion, that is they attempt to separate into swells of like wave period, the longer period swells racing away faster than the shorter period swells because swell speed increases as swell period increases (Speed in meters is approximately equal to 1.56 times wave period squared). The farther from the TC the swells go, the more ordered into like wave periods they become;

11 3. They decrease in height (they decay) due to swell dispersion and due to angular spreading of the swell away from the TC; 4. Because of swell dispersion, the dominate wave period associated with significant wave heights increases the farther away from the TC the swells move. By using great circles, one can determine direction changes and final destinations of swells of like initial propagation direction. An example of some great circle tracks ending in the Hawaiian Islands is shown in Figure 5.7 (courtesy National Weather Service Pacific Region Headquarters). They represent the shortest distances between two points on a sphere (in the case of Earth an oblate spheroid) and the track along which swells must move in order to reach Hawaii. Wind directions and speeds are overlaid on these great circles in order to determine whether wind fetch areas are pointed in a direction that will allow swells generated by distance winds to move to the Hawaiian Islands (the red polygon identifies those winds in this example.
12 Figure 5.7. Diagram illustrating the great circle tracks that end in the Hawaiian Islands. The red box indicates the fetch area for the indicated low-level wind flow northwest of Hawaii. The amount of wave dispersion and the rate and amount of swell decay along any great circle can be calculated by knowing the travel distance along the great circle to the destination of interest. One key element of swell decay is related to the width of the fetch that generates the initial wind waves. The wider the initial wind generation area, the slower/less the swell decay rate will be to any point along the great circle. It turns out that because wave dispersion occurs quickly, about 50% of wave decay occurs the first nm ( km) along the swell travel route. The next 50% of decay can take as many as 3000 nm (~5500 km) to occur (depending on fetch width and initial wave period) and is nearly all related to angular spreading of wave energy away from the great circle track of interest. As swell steepness decreases, swell decay rates lessen; that is steep waves/swells decay faster than long period less steep, flatter swells. There are numerous equations available to calculate swell decay, the end result does not differ very much among the various methods assuming the correct initial wave significant wave height and wave period are known. A very simplified example (not suggested for operation use) of swell decay rates is shown in Table 5.1. These numbers represent the fraction of wave height remaining after a specific decay distance for shown fetch widths. Table 5.1. Fraction of wave height remaining as a function of decay distance (nm) from wave generation area and fetch width (nm) of wave generation area. Decay Distance (nm) Fetch Width (nm) Fraction of Wave Height Remaining For example, a wave of 10 feet (3.0 m) generated in a wind fetch with a width of 200 nm (370 km) would be about 5.2 ft (1.6 m) high after 200 nm (370 km) of travel and about 2 ft (0.6 m) after 3000 nm (5500 km) of travel. These fractions multiplied by initial wave/swell height would give the swell decay height at the stated decay distance. Note that wave/swell HEIGHT does not have anything directly to do with decay rate!
13 There is typically more error involved in determining the final significant wave height at the start of swell motion than there is in the decay methodology, unless there are obstacles (islands) in the way. Numerical wave models obviously have decay physics in them. In numerical wave models that do not have high angle resolution, it is possible to lose wave energy in the decay process and/or dump energy from one direction bin into a nearest model direction bin that does not match reality. The result is erroneous swell heights at the end of decay and erroneous swell final destinations due to direction-bin jumping! In the case of more simple man interacting models, this problem does not exist assuming you have the correct initial wave direction and hence great circle track! 5.7 Radius of 12 foot seas vs coastal wave heights The oceanic forecast of 12 foot (4-m) seas has been a number used by some TC prediction centers as a critical number, likely because below these heights most vessels in the high seas will survive, but above this, some can begin to have problems and have to slow their forward progress potentially delaying arrival to a final destination. Hence the radius of 12 foot (4m) seas may be seen attached to TC advisories. The 12 foot (4m) seas should NEVER be assumed to be collocated with the radius of 34 knot (64 km/h) winds (or any other wind radii) as heights are solely determined by the height of wind waves generate by winds in the TC and the decay of those waves as swell to a height of 12 feet (4m). Neither has anything directly to do with the radius of 34 knot (64 km/h) winds! 12 foot (4m) seas in the form of swell can routinely occur hundreds of miles away from a TC, even one that has generated waves along that great circle track and subsequently turned away from it and is dissipating! Hence one has to keep track of all waves/swells moving toward a point of interest throughout the life of a tropical cyclone and beyond that. Heights must be calculated by initial wave height forecasts measured within the TC and wave/swell decay methods. 5.8 Coastal surf When it comes to coastal surf caused by a TC, whether making landfall or from surf generated by a TC hundreds or thousands of miles away and never striking land, many additional shallow water effects become important and can cause very large breaking wave/swell heights even when the deep water wave/swell heights are very modest. Wave shoaling and wave refraction are the two key shallow water effects of interest. Both of these effects are highly dependent upon wave/swell period, not dependent on wave/swell height. Long period waves/swells (typically found in TCs) result in much greater wave shoaling and wave refraction than do common low wind day to day short period wind waves. The effect of both shoaling and refraction is to increase breaking surf heights at the coastline. Wave shoaling is an increase in wave height due to slowing of wave/swell in shallow water while wave/swell period is conserved. The effect is to increase wave/swell height as it moves into shallow water and finally breaks because wave energy is concentrated into smaller areas. Shoaling can enhance breaker heights between about 10% and 100% (a doubling in
14 height). The amount of shoaling can be determined if one knows the wave period and near coastal bathymetry. Wave refraction is the bending of wave/swell energy by asymmetries in shallow water/coastal bathymetry. Waves/swells will ALWAYS bend toward shallow water due to a slowing of wave/swell speeds as they move into shallower and shallower water. Refraction can enhance breaker heights between about 10% and 100% (a doubling in height). It too can be calculated if one knows wave period and the 2-dimensional distribution of near coast bathymetry. The result of these shallow water effects can be in cases of longer period TC swells nearly a quadrupling of breaking surf heights compared to wave/swell heights measured by a deep water buoy not far from shore! It is for this reason that nearly always breaking waves from TCs along a coastline will be higher than deep water waves associated with the same tropical cyclone.the result of this is that even a swell of 4 ft (1.2 m) in deep water can result in breaker heights along an exposed beach that may approach 16 ft (4.9 m)! In this simple example above the coastline is exposed to surf higher than 12 feet (4 m) (e.g., 16 ft/4.9 m) and deep water waves of 12 ft (4 m) if collocated with TC 34-kt (64 km/h) winds hundreds of miles offshore would be a terrible indicator of what actually happens at the coastline! Obvious the 12-ft (4-m) seas in deep water and the radius of them collocated with a 34-kt (64 km/h) wind around a TC far at sea is a worthless assessment of beach impacts from that same TC hundreds of miles away. No meteorologist or oceanographer should use deep water wave/swell heights as a proxy to breaking wave heights, or their impacts in the form of beach erosion and rip current threats they can cause. They must apply the correct relationships between deep water and shallow water waves. 5.9 Tropical cyclone wave/swell setup & run-up For many TC forecasters who leave coastal water rise to a wind driven surge model, surge is NOT the whole story! It turns out where surge can be extreme, breaking waves are typically not a big problem, but where surge potential is not as high, waves/swells are a big threat. This is primarily because surge is large in shallow coastal waters while surf potential is high near deep coastal water. No matter the coastal water depths, if you do not include coastal water rise from the action of breaking waves you will not only forecast water rise that is too low, but you will also potentially incorrectly forecast the time of water rise onset, its peak and its demise. A classic example of a coastline with a high wave threat and a modest surge threat is along the western Florida panhandle. In 1995 Hurricane Opal struck that coastline. Surge models including the National Weather Service SLOSH model indicated surge values that would be in the 8 foot range. However, very large waves had been generated in the right-front quadrant of that northward moving large hurricane; some waves offshore approached 45 ft (13.7 m)! The diagram below (from the National Hurricane Center) shows high water marks associated with Hurricane Opal along that Florida coast near landfall. The surge forecast of 8 ft (2.4 m) was a good one, but water rose in some locations to as high as 25 ft (7.6

15 m), taking out coastal homes and toppling some high rise buildings on the coastline into the sand and surf! Figure 5.8. Diagram illustrating the distribution of total coastal water level rise associated with Hurricane Opal along the west Florida Peninsula as a function of horizontal distance along the coast. The purple area shows the surge component and the red area shows the wave and wave setup component. This clearly shows the importance of water rise associated with wave action alone and how omitting it will contribute to, at times, a huge underestimate of coastal water rise. So what is wave setup? It is the water rise associated with breaking wave energy on a coastline. A very simple approximation can be estimated by 12% of the coastal breaking surf depth. A slightly more sophisticated estimate of wave setup is given by: S = (sqrt(g) * H s 2 * P) / (64* π * BD 3/2 ) Namely, the square root of gravity (g) times significant wave height (H s ) squared times wave period (P) divided by 64 times π ( ) times breaker depth (BD) to the 3/2 power. Large waves with long periods breaking in shallow water provide the greatest wave setup. Small waves with short periods breaking in deeper water provide the least wave setup.
16 Wave run-up, the water rise up the beach face associated with individual waves racing landward and then retreating to sea also contributes to water rise in a semi-transient way with an interval consistent with the dominant wave period. It contributes to the water rise and is approximately given by: R = 1.38 * H b * E 0.77, where H b is breaker height, and E = beach slope/squareroot (breaker height/wave length). This expression for E doesn't make sense to me. Also, are breaker height and breaker depth (prev page) the same thing? Maximum wave run-up for a large sample of waves is approximately 1.7 times R. As you can see coastal breaking surf heights (not deep water wave heights) are critical to forecast in order to determine wave setup, wave run-up and hence water rise associated with breaking wave action on any beach. Surge on the other hand is related only to the onshore component of wind and some elevation due to lower pressure (hydrostatic effect or inverse barometer effect). The coastal bathymetry waves/surf is excluded! Channeling by local bathymetry, and reflections from the coast also contribute to substantially amplify the surge height. Some confusion exists between storm tides and storm surges. In this report a storm surge is the elevation of water generated by a tropical cyclone above or below the normal astronomical tide. A storm tide, on the other hand, is the total elevation (including the astronomical tide) above or below a standard datum. The storm tides are predicted water heights issued in TC advisories. The generic term "surges" is often used interchangeably according to context. It is important to identify the expected inundation, where salt water will penetrate into what is normally dry land. Storm surge and surf can be computed with modeling efforts, but the storm tide is difficult because of phasing uncertainties with the astronomical tides. Because there are frequently two high tides during a 24-hour period, the rule of thumb to convey to emergency managers is to always plan for high tide. Because very often large long period swells outrun a TC to the coastline by hours or even days, water rise from breaking wave action can and often does begin well before any TC winds near the coastline and surge begins. Obviously surf-induced water rise can occur even when a TC never makes it to land!this means that water rise can be large and significant well before TC arrival at a coastline. These rising waters can and have prevented timely coastal evacuations ahead of high winds and surge as exit routes have become impassible before winds even begin to increase. The result can lead to coastal residents trapped by water rise well before the TC wind threat and surge begin! With proper calculation of coastal breaking surf, wave setup and wave run-up, the meteorologist should never be caught with a water rise forecast that waits for the wind, nor will he/she underestimate the total water rise by only including "surge."
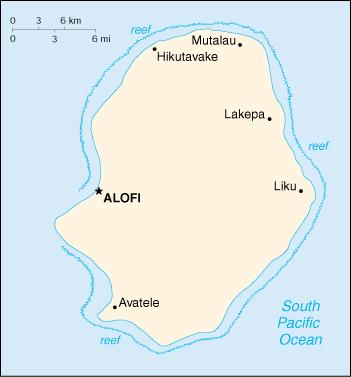
17 On coral atolls and islands surrounded by a fringing reef, the reef flat can act to help dampen out the breaking waves. Thus, given two locations with similar bathymetry, the wider the reef, the more the waves will be dampened (by turbulence), and the smaller the waves and run-up will be. Conversely, the narrower the reef, the less effect the reef will have on dampening the waves and run-up. For very strong storms, where the water level is 30 ft (10 m) or more across the reef, the reef has little effect on dampening the waves. But, usually, where the reefs are wide, the damages will be less than where the reefs are narrow Some specific forecast problems Trapped fetch (contributed by Mr. Jeff Callaghan) Cyclone Heta was a powerful Category 5 cyclone that caused catastrophic damage to Tonga, Niue (Figure 5.9), and American Samoa in late December 2003 and early January Heta formed on December 25, 2003, and reached its maximum intensity of 160 mph (260 km/h) and estimated minimum sea level pressure of 915 hpa. As Heta developed, it became a large system, which is ideal for developing large waves. (a)
18 (b)
 sustained winds")

19 Figure 5.9. (a) Map of Niue and (b) the main centre on Niue, Alofi, which is located on top of 20m elevated Coral Cliffs. Heta then accelerated southwards, passing to the west of Niue with an extensive fetch of 60-kt (111-km/h) sustained winds (Figure 5.10). The speed of Heta could be accurately calculated due to it having a clear eye. Figure Scatterometer observations with areas highlighted where wind has a component of 330/60 knots, e.g., wind of 010/80 knots equivalent to 330/60 knots.
20 The development and movement of a wave train through the 60-kt (111-km/h) fetch of Heta is shown in Figure The last analyses at 0425UTC 6 January 2004 was just before seawater surged into Alofi. Niue was under the eastern eye wall from the IR image at 0514UTC 6 January Figure Development of wave train moving through the 60-kt (111-km/h) fetch of Heta. The wave speeds in Figure 5.12 were calculated from the WMO manual on wave forecasting (WMO No.702) nomogram. From the nomogram, after 29 hours in the 60-kt (111 km/h) fetch zone, the significant wave height is just over 52 ft (16 m) and the period is 15.2 seconds.

21 Figure Calculation of wave train speed from a WMO manual forecasting nomogram. Figure 5.13 shows the forerunner waves reaching Alofi at 2239UTC 5 January 2004 and the severe wave damage caused by the waves around 0500UTC 6 January.
 Forerunner waves at Alofi at 2239 UTC 5 January 2004; (bottom) damage at")

22 Figure (top) Forerunner waves at Alofi at 2239 UTC 5 January 2004; (bottom) damage at Alofi after the passage of the storm. To illustrate that these events can be forecast, below is a note from the Brisbane Tropical Cyclone Warning Centre attached to a SATELLITE ANALYSIS BULLETIN at 2317 UTC 5 January 2004.
23 Heta appears to have moved around 170 nmi (315 km) over the past 12 hours or around 14 kts (26 km/h). This is fast enough for significant fetch enhancement to be occurring leading to exceptionally large waves moving with the storm." The following calculations show how the waves grow with minimal decay in a trapped fetch scenario. For a wind speed of 60 kts (111 km/h) after 1h period (T) = 4.5 sec as long as fetch is at least 6 nmi (11 km). The group velocity (C g ) associated with this period = 1.5 period (in knots) = 6.8 knots. Therefore average velocity over hour = (0+6.8)/2 = 3.4 knots. After 2h T = 5.6 s, C g = 8.4 knots and average speed = ( )/2 = 7.6 knots Similarly, average speed over third hour = 9 knots and at the end of the third hour C g = 9.7 knots and waves are now moving slightly faster than Heta. However over the 3 hours, waves travelled 20 nm and Heta travelled 3 times 9.5 knots = 28.5 nm Storm surge probabilities Tropical cyclone storm surge probabilities (2-25 feet) produced by the US National Hurricane Center can be found at Summary Things to remember when forecasting tropical cyclone waves: 1) Accurately determine the "time integrated" wind, fetch and duration, don't sweat the details. 2) Time integrated wind speeds are most important to get correct. 3) Larger tropical storm wind areas can often be more important for wave growth than tiny areas of very strong hurricane winds. 4) Concentrate on wind duration for the TC quadrant of most interest to you. 5) Wind duration within a quadrant is more important to access accurately than is fetch length. 6) The PRIMARY reason for waves being so much larger in the right-front (left front) quadrant of a TC in the Northern Hemisphere (Southern Hemisphere) is due to the duration winds have to generate waves in that quadrant.
24 7) Fetches and fetch lengths should be done in pieces for highly varying tracks; make sure that a fetch lies along a great circle to the destination of interest. 8) NEVER use any specific wind radii as a proxy to forecasting wave heights. 9) Coastal surf can be much larger than deep water waves/swells at buoys, NEVER use buoy heights as a proxy to breaking wave heights without applying coastal wave modification processes that include shoaling and refraction. 10) Do not forget waves/swells have a spectral character both wave height and wave period. Significant wave height is routinely used as a single height identifier but the majority of waves have lower heights, while some waves can be double the significant wave height. 11) Remember that you must include wave setup and wave run-up when forecasting coastal water rise; surge alone will be an underestimate in most cases and a huge underestimate in many cases!
TRAPPED-FETCH WAVES The Theory from an Observational Perspective
 TRAPPED-FETCH WAVES The Theory from an Observational Perspective Peter J Bowyer Allan W MacAfee 50 50 45 45 40 40 35 35 System Speed (kt) System Speed (kt) 30 30 25 25 20 20 15 15 10 10 5 5 Fetch Enhancements
MAR 110 LECTURE #20 Storm-Generated Waves & Rogue Waves
 MAR 110 LECTURE #20 Storm-Generated Waves & Rogue Waves Wave Principles Review Figure 20.1 Wave Principles (ABOVE) A simple ocean surface wave is a sea level distortion that repeats itself over a distance
page - Laboratory Exercise #5 Shoreline Processes
 page - Laboratory Exercise #5 Shoreline Processes Section A Shoreline Processes: Overview of Waves The ocean s surface is influenced by three types of motion (waves, tides and surface currents). Shorelines
Chapter 22, Section 1 - Ocean Currents. Section Objectives
 Chapter 22, Section 1 - Ocean Currents Section Objectives Intro Surface Currents Factors Affecting Ocean Currents Global Wind Belts (you should draw and label a diagram of the global wind belts) The Coriolis
Swell and Wave Forecasting
 Lecture 24 Part II Swell and Wave Forecasting 29 Swell and Wave Forecasting Motivation Terminology Wave Formation Wave Decay Wave Refraction Shoaling Rouge Waves 30 Motivation In Hawaii, surf is the number
Swell and Wave Forecasting
 Lecture 25 Swell and Wave Forecasting Swell and Wave Forecasting Motivation Terminology Wave Formation Wave Decay Wave Refraction Shoaling Rouge Waves 1 2 Motivation In Hawaii, surf is the number one weather-related
WIND SPEED LENGTH OF TIME WIND BLOWS (Duration) DISTANCE OVER WHICH IT BLOWS (Fetch)
 DISTANCE OVER WHICH IT BLOWS (Fetch)") WAVES Up and down movement of ocean surface Transportation of energy across the water over vast distances If not stopped by anything, waves can travel entire oceans Size and speed depend upon: WIND SPEED
WAVES Up and down movement of ocean surface Transportation of energy across the water over vast distances If not stopped by anything, waves can travel entire oceans Size and speed depend upon: WIND SPEED
Atmospheric Waves James Cayer, Wesley Rondinelli, Kayla Schuster. Abstract
 Atmospheric Waves James Cayer, Wesley Rondinelli, Kayla Schuster Abstract It is important for meteorologists to have an understanding of the synoptic scale waves that propagate thorough the atmosphere
G. Meadows, H. Purcell and L. Meadows University of Michigan
 www.coj.net/departments/fire+and+rescue/emergency+preparedness/rip+current.htm G. Meadows, H. Purcell and L. Meadows Over 80% of all surf related rescues are attributable to Rip Currents According to the
Chapter 10 Lecture Outline. The Restless Oceans
 Chapter 10 Lecture Outline The Restless Oceans Focus Question 10.1 How does the Coriolis effect influence ocean currents? The Ocean s Surface Circulation Ocean currents Masses of water that flow from one
CHAPTER 6 DISCUSSION ON WAVE PREDICTION METHODS
 CHAPTER 6 DISCUSSION ON WAVE PREDICTION METHODS A critical evaluation of the three wave prediction methods examined in this thesis is presented in this Chapter. The significant wave parameters, Hand T,
Cyclone Hazards: waves and storm tide
 Cyclone Hazards: waves and storm tide 1/32 HIGH WAVES TORRENTIAL RAIN (FLOODING) SURGE ON COAST AT CROSSING GALE FORCE WINDS 2/32 Waves and Swell MetEd Comet Program Wind and Wave forecasting https://www.meted.ucar.edu/training_course.php?id=8
Directed Reading. Section: Ocean Currents. a(n). FACTORS THAT AFFECT SURFACE CURRENTS
. FACTORS THAT AFFECT SURFACE CURRENTS") Skills Worksheet Directed Reading Section: Ocean Currents 1. A horizontal movement of water in a well-defined pattern is called a(n). 2. What are two ways that oceanographers identify ocean currents? 3.
Skills Worksheet Directed Reading Section: Ocean Currents 1. A horizontal movement of water in a well-defined pattern is called a(n). 2. What are two ways that oceanographers identify ocean currents? 3.
Chapter 10 Waves. wave energy NOT the water particles moves across the surface of the sea. wave form moves and with it, energy is transmitted
 Capillary Waves, Wind Waves, Chapter 10 Waves Anatomy of a Wave more like a real wave Tsunamis, Internal waves big waves huge waves rogue waves small waves more like a sine wave Wave direction Wave wave
LAB: WHERE S THE BEACH
 Name: LAB: WHERE S THE BEACH Introduction When you build a sandcastle on the beach, you don't expect it to last forever. You spread out your towel to sunbathe, but you know you can't stay in the same spot
CHAPTER 8 WIND AND WEATHER MULTIPLE CHOICE QUESTIONS
 CHAPTER 8 WIND AND WEATHER MULTIPLE CHOICE QUESTIONS 1. is the movement of air measured relative to the Earth's surface. a. Gravity b. The pressure gradient force c. The Coriolis Effect d. The centripetal
Oceans in Motion: Waves and Tides
 Oceans in Motion: Waves and Tides Waves Waves are among the most familiar features in the ocean. All waves work similarly, so although we are talking about ocean waves here, the same information would
PUV Wave Directional Spectra How PUV Wave Analysis Works
 PUV Wave Directional Spectra How PUV Wave Analysis Works Introduction The PUV method works by comparing velocity and pressure time series. Figure 1 shows that pressure and velocity (in the direction of
Ocean Waves and Surf Forecasting: Wave Climate and Forecasting
 Overview Ocean Waves and Surf Forecasting: Wave Climate and Forecasting Ocean regions Characterizing and describing ocean waves Wave theory, propagation, and dispersion Refraction, shadowing, and bathymetry
Currents measurements in the coast of Montevideo, Uruguay
 Currents measurements in the coast of Montevideo, Uruguay M. Fossati, D. Bellón, E. Lorenzo & I. Piedra-Cueva Fluid Mechanics and Environmental Engineering Institute (IMFIA), School of Engineering, Research
Name Class Date. Use the terms from the following list to complete the sentences below. Each term may be used only once. Some terms may not be used.
 Assessment Chapter Test B The Movement of Ocean Water USING KEY TERMS Use the terms from the following list to complete the sentences below. Each term may be used only once. Some terms may not be used.
Figure 4, Photo mosaic taken on February 14 about an hour before sunset near low tide.
 The Impact on Great South Bay of the Breach at Old Inlet Charles N. Flagg and Roger Flood School of Marine and Atmospheric Sciences, Stony Brook University Since the last report was issued on January 31
OCEAN WAVES NAME. I. Introduction
 NAME OCEAN WAVES I. Introduction The physical definition of a wave is a disturbance that transmits energy from one place to another. In the open ocean waves are formed when wis blowing across the water
Sea and Land Breezes METR 4433, Mesoscale Meteorology Spring 2006 (some of the material in this section came from ZMAG)
") Sea and Land Breezes METR 4433, Mesoscale Meteorology Spring 2006 (some of the material in this section came from ZMAG) 1 Definitions: The sea breeze is a local, thermally direct circulation arising from
Sea and Land Breezes METR 4433, Mesoscale Meteorology Spring 2006 (some of the material in this section came from ZMAG) 1 Definitions: The sea breeze is a local, thermally direct circulation arising from
Section 6. The Surface Circulation of the Ocean. What Do You See? Think About It. Investigate. Learning Outcomes
 Chapter 5 Winds, Oceans, Weather, and Climate Section 6 The Surface Circulation of the Ocean What Do You See? Learning Outcomes In this section, you will Understand the general paths of surface ocean currents.
Meteorology. Circle the letter that corresponds to the correct answer
 Chapter 6 Worksheet 2 Meteorology Name: Circle the letter that corresponds to the correct answer 1) A steep pressure gradient: a. produces light winds. b. produces strong winds. c. is only possible in
Chapter. The Dynamic Ocean
 Chapter The Dynamic Ocean An ocean current is the mass of ocean water that flows from one place to another. 16.1 The Composition of Seawater Surface Circulation Surface Currents Surface currents are movements
HURRICANE SANDY LIMITED REEVALUATION REPORT UNION BEACH, NEW JERSEY DRAFT ENGINEERING APPENDIX SUB APPENDIX D SBEACH MODELING
 HURRICANE SANDY LIMITED REEVALUATION REPORT UNION BEACH, NEW JERSEY DRAFT ENGINEERING APPENDIX SUB APPENDIX D SBEACH MODELING Rev. 18 Feb 2015 1 SBEACH Modeling 1.0 Introduction Following the methodology
Wednesday, September 27, 2017 Test Monday, about half-way through grading. No D2L Assessment this week, watch for one next week
 Wednesday, September 27, 2017 Test Monday, about half-way through grading No D2L Assessment this week, watch for one next week Homework 3 Climate Variability (due Monday, October 9) Quick comment on Coriolis
4/20/17. #30 - Coastlines - General Principles Coastlines - Overview
 Writing Assignment Due one week from today by 11:59 pm See main class web pages for detailed instructions Essays will be submitted in Illinois Compass (instructions later) Pick one: Earthquakes, tsunamis,
Undertow - Zonation of Flow in Broken Wave Bores
 Nearshore Circulation Undertow and Rip Cells Undertow - Zonation of Flow in Broken Wave Bores In the wave breaking process, the landward transfer of water, associated with bore and surface roller decay
Oceans and the Global Environment: Lec 2 taking physics and chemistry outdoors. the flowing, waving ocean
 Oceans and the Global Environment: Lec 2 taking physics and chemistry outdoors the flowing, waving ocean Peter Rhines 1 Eric Lindahl 2 Bob Koon 2, Julie Wright 3 www.ocean.washington.edu/courses/has221a-08
Earth s oceans covers 71 % _ of the planet s surface. In reality, Earth s ocean waters are all. interconnected as part of a single large global ocean.
 Ocean Motion Met 101: Introduction to the World's Oceans Produced by The COMET Program Geography: Name Pd. Earth s oceans covers 71 % _ of the planet s surface. In reality, Earth s ocean waters are all
Waves Part II. non-dispersive (C g =C)
") Waves Part II Previously we discussed Surface Gravity Waves Deep Water Waves Shallow Water Waves C g T 2 C g h dispersive (C g =C/2) Definitions: phase speed C= /T= /k non-dispersive (C g =C) group speed
Waves Part II Previously we discussed Surface Gravity Waves Deep Water Waves Shallow Water Waves C g T 2 C g h dispersive (C g =C/2) Definitions: phase speed C= /T= /k non-dispersive (C g =C) group speed
Tracking of Large-Scale Wave Motions
 Tracking of Large-Scale Wave Motions Nikki Barbee, Adam Cale, Justin Wittrock Dr. William Gutowski Meteorology 44 Fall 29 This semester we have observed large scale wave patterns in both the Northern and
General Coastal Notes + Landforms! 1
 General Coastal Notes + Landforms! 1 Types of Coastlines: Type Description Primary Coast which is essentially in the same condition when sea level stabilized Coastline after the last ice age, younger.
MAR 110 LECTURE #15 Wave Hazards
 1 MAR 110 LECTURE #15 Wave Hazards Rogue Wave Hazard Rogue waves are very large open ocean waves of sometimes can range in height from 60 ft (20m) to120 feet (40m) and thus a significant hazard to large
Waves. G. Cowles. General Physical Oceanography MAR 555. School for Marine Sciences and Technology Umass-Dartmouth
 Waves G. Cowles General Physical Oceanography MAR 555 School for Marine Sciences and Technology Umass-Dartmouth Waves Sound Waves Light Waves Surface Waves Radio Waves Tidal Waves Instrument Strings How
Ocean Currents Unit (4 pts)
") Name: Section: Ocean Currents Unit (Topic 9A-1) page 1 Ocean Currents Unit (4 pts) Ocean Currents An ocean current is like a river in the ocean: water is flowing traveling from place to place. Historically,
Name: Section: Ocean Currents Unit (Topic 9A-1) page 1 Ocean Currents Unit (4 pts) Ocean Currents An ocean current is like a river in the ocean: water is flowing traveling from place to place. Historically,
OECS Regional Engineering Workshop September 29 October 3, 2014
 B E A C H E S. M A R I N A S. D E S I G N. C O N S T R U C T I O N. OECS Regional Engineering Workshop September 29 October 3, 2014 Coastal Erosion and Sea Defense: Introduction to Coastal Dynamics David
SURFACE CURRENTS AND TIDES
 NAME SURFACE CURRENTS AND TIDES I. Origin of surface currents Surface currents arise due to the interaction of the prevailing wis a the ocean surface. Hence the surface wi pattern (Figure 1) plays a key
Atmospheric Forces and Force Balances METR Introduction
 Atmospheric Forces and Force Balances METR 2021 Introduction In this lab you will be introduced to the forces governing atmospheric motions as well as some of the common force balances. A common theme
Surface Waves NOAA Tech Refresh 20 Jan 2012 Kipp Shearman, OSU
 Surface Waves NOAA Tech Refresh 20 Jan 2012 Kipp Shearman, OSU Outline Surface winds Wind stress Beaufort scale Buoy measurements Surface Gravity Waves Wave characteristics Deep/Shallow water waves Generation
UNDERSTANDING STORM SURGE
 The Education Program at the New Jersey Sea Grant Consortium 22 Magruder Road, Fort Hancock, NJ 07732 (732) 872-1300 www.njseagrant.org UNDERSTANDING STORM SURGE ACTIVITY 6 SURGE OF THE STORM http://secoora.org/classroom/virtual_hurricane/surge_of_the_storm>
Lecture Outlines PowerPoint. Chapter 15 Earth Science, 12e Tarbuck/Lutgens
 Lecture Outlines PowerPoint Chapter 15 Earth Science, 12e Tarbuck/Lutgens 2009 Pearson Prentice Hall This work is protected by United States copyright laws and is provided solely for the use of instructors
Atmospheric Circulation (Ch. 8) Ocean & Atmosphere are intertwined Gases & waters freely exchanged Wind Weather Climate
 Ocean & Atmosphere are intertwined Gases & waters freely exchanged Wind Weather Climate") Atmospheric Circulation (Ch. 8) Ocean & Atmosphere are intertwined Gases & waters freely exchanged Wind Weather Climate Atmospheric Structure Consists of Layers Separated by Temperature Stratosphere: Temperature
Atmospheric Circulation (Ch. 8) Ocean & Atmosphere are intertwined Gases & waters freely exchanged Wind Weather Climate Atmospheric Structure Consists of Layers Separated by Temperature Stratosphere: Temperature
Reading Material. Inshore oceanography, Anikouchine and Sternberg The World Ocean, Prentice-Hall
 Reading Material Inshore oceanography, Anikouchine and Sternberg The World Ocean, Prentice-Hall BEACH PROCESSES AND COASTAL ENVIRONMENTS COASTAL FEATURES Cross section Map view Terminology for Coastal
El Niño Southern Oscillation. Pressure systems over Darwin Australia and Tahiti Oscillate Typically occurs every 4-7 years
 El Niño Southern Oscillation Pressure systems over Darwin Australia and Tahiti Oscillate Typically occurs every 4-7 years 1 2 What is it? Normal Conditions... What is it? During El Niño. 3 Local Effects
Undertow - Zonation of Flow in Broken Wave Bores
 Lecture 22 Nearshore Circulation Undertow - Zonation of Flow in Broken Wave Bores In the wave breaking process, the landward transfer of water, associated with bore and surface roller decay within the
+ R. gr T. This equation is solved by the quadratic formula, the solution, as shown in the Holton text notes given as part of the class lecture notes:
 Homework #4 Key: Physical explanations 1.The way water drains down a sink, counterclockwise or clockwise, is independent of which hemisphere you are in. A draining sink is an example of vortex in cyclostrophic
Nature Of Marine winds, Waves and Swells over West African Coasts Case study of Victoria Island beach in Lagos, Nigeria
 Nature Of Marine winds, Waves and Swells over West African Coasts Case study of Victoria Island beach in Lagos, Nigeria By S. O. Gbuyiro and E. Olaniyan Marine Unit, Nigeria Meteorological Agency, Lagos
Section 1. Global Wind Patterns and Weather. What Do You See? Think About It. Investigate. Learning Outcomes
 Chapter 5 Winds, Oceans, Weather, and Climate Section 1 Global Wind Patterns and Weather What Do You See? Learning Outcomes In this section, you will Determine the effects of Earth s rotation and the uneven
Wave Propagation and Shoaling
 Wave Propagation and Shoaling Focus on movement and natural alteration of the characteristics of waves as they travel from the source region toward shore Waves moving from deep to intermediate/shallow
Why should I read this?
 Tim s Tips #4 : What s the Storm Doing? Why should I read this? If you ve been through a hurricane you ll already know that before it comes, you ll find yourself making a lot of decisions, taking a lot
Ocean Motion Notes. Chapter 13 & 14
 Ocean Motion Notes Chapter 13 & 14 What is a Wave? Wave: movement of energy through a body of water How are Waves Caused? Caused mostly by wind Wind blowing on the water transmits energy to the water Size
ESCI 107/109 The Atmosphere Lesson 9 Wind
 Reading: Meteorology Today, Chapter 8 ABOUT WIND Wind is the motion of the air. ESCI 107/109 The Atmosphere Lesson 9 Wind The direction of the wind is given by which direction it is blowing from. For example,
Atmospheric Rossby Waves in Fall 2011: Analysis of Zonal Wind Speed and 500hPa Heights in the Northern and Southern Hemispheres
 Atmospheric Rossby Waves in Fall 211: Analysis of Zonal Wind Speed and 5hPa Heights in the Northern and Southern s Samuel Cook, Craig Eckstein, and Samantha Santeiu Department of Atmospheric and Geological
Scales of Atmospheric Motion Scale Length Scale (m) Time Scale (sec) Systems/Importance Molecular (neglected)
 Time Scale (sec) Systems/Importance Molecular (neglected)") Supplement Wind, Fetch and Waves Scales of Atmospheric Motion Scale Length Scale (m) Time Scale (sec) Systems/Importance Molecular 10-7 - 10-2 10-1 (neglected) Coriolis not important Turbulent 10-2 10
Supplement Wind, Fetch and Waves Scales of Atmospheric Motion Scale Length Scale (m) Time Scale (sec) Systems/Importance Molecular 10-7 - 10-2 10-1 (neglected) Coriolis not important Turbulent 10-2 10
Atomspheric Waves at the 500hPa Level
 Atomspheric Waves at the 5hPa Level Justin Deal, Eswar Iyer, and Bryce Link ABSTRACT Our study observes and examines large scale motions of the atmosphere. More specifically it examines wave motions at
3/6/2001 Fig. 6-1, p.142
 First GOES 11 image http://visible earth.nasa.g ov/view_rec. php?id=190 Air-born dust from the Sahara Desert, Feb. 2001 Fig. 6-CO, p.140 dust from China over Japan. 3/5/2001 FIGURE 6.1 A model of the atmosphere
The Coriolis force, geostrophy, Rossby waves and the westward intensification
 Chapter 3 The Coriolis force, geostrophy, Rossby waves and the westward intensification The oceanic circulation is the result of a certain balance of forces. Geophysical Fluid Dynamics shows that a very
Volume and Shoreline Changes along Pinellas County Beaches during Tropical Storm Debby
 Volume and Shoreline Changes along Pinellas County Beaches during Tropical Storm Debby Ping Wang and Tiffany M. Roberts Coastal Research Laboratory University of South Florida July 24, 2012 Introduction
Shorelines Earth - Chapter 20 Stan Hatfield Southwestern Illinois College
 Shorelines Earth - Chapter 20 Stan Hatfield Southwestern Illinois College The Shoreline A Dynamic Interface The shoreline is a dynamic interface (common boundary) among air, land, and the ocean. The shoreline
The Impact on Great South Bay of the Breach at Old Inlet Charles N. Flagg School of Marine and Atmospheric Sciences, Stony Brook University
 The Impact on Great South Bay of the Breach at Old Inlet Charles N. Flagg School of Marine and Atmospheric Sciences, Stony Brook University The previous report provided a detailed look at the conditions
ATMS 310 Tropical Dynamics
 ATMS 310 Tropical Dynamics Introduction Throughout the semester we have focused on mid-latitude dynamics. This is not to say that the dynamics of other parts of the world, such as the tropics, are any
13. TIDES Tidal waters
 Water levels vary in tidal and non-tidal waters: sailors should be aware that the depths shown on the charts do not always represent the actual amount of water under the boat. 13.1 Tidal waters In tidal
The ocean water is dynamic. Its physical
 CHAPTER MOVEMENTS OF OCEAN WATER The ocean water is dynamic. Its physical characteristics like temperature, salinity, density and the external forces like of the sun, moon and the winds influence the movement
Oceans - Laboratory 12
 Oceans - Laboratory 12 (Name) How do ocean waves form? All waves are disturbances of a fluid medium through which energy is moved (Davis, 1997). Ocean waves travel on the interface between oceans and the
Coastal management has lagged behind the growth in population leading to problems with pollution
 Fifty percent of the population of the industrialized world lives within 100 km of a coast. Coastal management has lagged behind the growth in population leading to problems with pollution and natural
The Composition of Seawater
 The Composition of Seawater Salinity Salinity is the total amount of solid material dissolved in water. Most of the salt in seawater is sodium chloride, common table salt. Element Percent Element Percent
EVE 402/502 Air Pollution Generation and Control. Introduction. Intro, cont d 9/18/2015. Chapter #3 Meteorology
 EVE 402/502 Air Pollution Generation and Control Chapter #3 Meteorology Introduction Meteorology is the study and forecasting of weather changes resulting from large-scale atmospheric circulation Characteristics
ATMOSPHERIC CIRCULATION
 Name ATMOSPHERIC CIRCULATION (adapted from Dr. S. Postawko, U. of Ok.) INTRODUCTION Why does the wind blow? Why do weather systems in the mid-latitudes typically move from west to east? Now that we've
Small- and large-scale circulation
 The Earth System - Atmosphere II Small- and large-scale circulation Atmospheric Circulation 1. Global atmospheric circulation can be thought of as a series of deep rivers that encircle the planet. 2. Imbedded
Prediction of Nearshore Waves and Currents: Model Sensitivity, Confidence and Assimilation
 Prediction of Nearshore Waves and Currents: Model Sensitivity, Confidence and Assimilation H. Tuba Özkan-Haller College of Oceanic and Atmospheric Sciences Oregon State University, 104 Ocean Admin Bldg
McKnight's Physical Geography 11e
 Chapter 2 Lecture McKnight's Physical Geography 11e Lectures Chapter 5 Atmospheric Pressure and Wind Michael Commons Ohio Northern University Atmospheric Pressure and Wind The Nature of Atmospheric Pressure
PHSC 3033: Meteorology Air Forces
 PHSC 3033: Meteorology Air Forces Pressure Gradient P/ d = Pressure Gradient (Change in Pressure/Distance) Horizontal Pressure Gradient Force (PGF): Force due to pressure differences, and the cause of
Appendix E Cat Island Borrow Area Analysis
 Appendix E Cat Island Borrow Area Analysis ERDC/CHL Letter Report 1 Cat Island Borrow Area Analysis Multiple borrow area configurations were considered for Cat Island restoration. Borrow area CI1 is located
Winds and Ocean Circulations
 Winds and Ocean Circulations AT 351 Lab 5 February 20, 2008 Sea Surface Temperatures 1 Temperature Structure of the Ocean Ocean Currents 2 What causes ocean circulation? The direction of most ocean currents
14/10/2013' Bathymetric Survey. egm502 seafloor mapping
 egm502 seafloor mapping lecture 10 single-beam echo-sounders Bathymetric Survey Bathymetry is the measurement of water depths - bathymetry is the underwater equivalent of terrestrial topography. A transect
What are Waves? Earthquake. Waving flags. Vocal Cords Vibrate
 Waves Ch. 10 What are Waves? All waves are movement of energy through a medium (air, rock, water) Series of vibrations or undulations in a medium Wave types: ocean, sound, light, seismic Vocal Cords Vibrate
APPENDIX G WEATHER DATA SELECTED EXTRACTS FROM ENVIRONMENTAL DATA FOR BCFS VESSEL REPLACEMENT PROGRAM DRAFT REPORT
 APPENDIX G WEATHER DATA SELECTED EXTRACTS FROM ENVIRONMENTAL DATA FOR BCFS VESSEL REPLACEMENT PROGRAM DRAFT REPORT Prepared for: B.C. Ferries Services Inc. Prepared by: George Roddan, P.Eng. Roddan Engineering
Wednesday, September 20, 2017 Reminders. Week 3 Review is now available on D2L (through Friday) Exam 1, Monday, September 25, Chapters 1-4
 Exam 1, Monday, September 25, Chapters 1-4") Wednesday, September 20, 2017 Reminders Week 3 Review is now available on D2L (through Friday) Exam 1, Monday, September 25, Chapters 1-4 PLEASE don t memorize equations, but know how to recognize them
Wednesday, September 20, 2017 Reminders Week 3 Review is now available on D2L (through Friday) Exam 1, Monday, September 25, Chapters 1-4 PLEASE don t memorize equations, but know how to recognize them
Exemplar for Internal Assessment Resource Geography Level 3. Resource title: The Coastal Environment Kaikoura
 Exemplar for internal assessment resource Geography 3.5A for Achievement Standard 91430 Exemplar for Internal Assessment Resource Geography Level 3 Resource title: The Coastal Environment Kaikoura This
Introduction to Physical Oceanography STUDENT NOTES Date: 1. What do you know about solar radiation at different parts of the world?
 Introduction to Physical Oceanography STUDENT NOTES Date: 1 Warm up What do you know about solar radiation at different parts of the world? What affect does the tilt of the Earth have on the northern and
Synoptic Lab, MET 421, Test 2
 Name Synoptic Lab, MET 421, Test 2 1) For a 15 ms -1 east wind blowing towards Milwaukee a) Calculate the distance to the east shore of Lake Michigan. You can use a distance calculator website such as
Homework 2a Bathymetric Charts [based on the Chauffe & Jefferies (2007)]
![Homework 2a Bathymetric Charts [based on the Chauffe & Jefferies (2007)]](/thumbs/73/69074241.jpg "Homework 2a Bathymetric Charts [based on the Chauffe & Jefferies (2007)]") 14 August 2008 MAR 110 HW-2a: ex1bathymetric Charts 1 2-1. BATHYMETRIC CHARTS Homework 2a Bathymetric Charts [based on the Chauffe & Jefferies (2007)] Nautical charts are maps of a region of the ocean
14 August 2008 MAR 110 HW-2a: ex1bathymetric Charts 1 2-1. BATHYMETRIC CHARTS Homework 2a Bathymetric Charts [based on the Chauffe & Jefferies (2007)] Nautical charts are maps of a region of the ocean
Chapter 9: Circulation of the Ocean
 Chapter 9: Circulation of the Ocean Tropical gardens on Britain s Scilly Isles. Only 48 kilometers (30 miles) off the coast of Cornwall at 50 N, these scenic islands lie in the path of the warm waters
MAR 110 LECTURE #14 Ocean Waves
 MAR 110: Lecture 14 Outline Ocean Waves 1 MAR 110 LECTURE #14 Ocean Waves Figure 19.1 Do Ocean Surface Waves Present a Hazard?...a picture is worth a thousand words Tsunamis - giant shallow water waves
The Setting - Climatology of the Hawaiian Archipelago. Link to Video of Maui Waves
 The Setting - Climatology of the Hawaiian Archipelago Link to Video of Maui Waves What caused this week s weather? What caused this weekend s weather? Today s Objective: Provide overview and description
CROSS-SHORE SEDIMENT PROCESSES
 The University of the West Indies Organization of American States PROFESSIONAL DEVELOPMENT PROGRAMME: COASTAL INFRASTRUCTURE DESIGN, CONSTRUCTION AND MAINTENANCE A COURSE IN COASTAL DEFENSE SYSTEMS I CHAPTER
ABNORMALLY HIGH STORM WAVES OBSERVED ON THE EAST COAST OF KOREA
 ABNORMALLY HIGH STORM WAVES OBSERVED ON THE EAST COAST OF KOREA WEON MU JEONG 1 ; SANG-HO OH ; DONGYOUNG LEE 3 ; KYUNG-HO RYU 1 Coastal Engineering Research Department, Korea Ocean Research and Development
2. Water levels and wave conditions. 2.1 Introduction
 18 2. Water levels and wave conditions 2.1 Introduction This Overtopping Manual has a focus on the aspects of wave run-up and wave overtopping only. It is not a design manual, giving the whole design process
Lecture 8: Pressure and Wind
 Lecture 8: Pressure and Wind Pressure Distribution Forces Affect Wind Earth s Rotation Coriolis Force Geostrophic Balance Energy (Heat) The first law of thermodynamics Air Temperature Air Pressure Air
ITTC Recommended Procedures and Guidelines
 Page 1 of 6 Table of Contents 1. PURPOSE...2 2. PARAMETERS...2 2.1 General Considerations...2 3 DESCRIPTION OF PROCEDURE...2 3.1 Model Design and Construction...2 3.2 Measurements...3 3.5 Execution of
A Hare-Lynx Simulation Model
 1 A Hare- Simulation Model What happens to the numbers of hares and lynx when the core of the system is like this? Hares O Balance? S H_Births Hares H_Fertility Area KillsPerHead Fertility Births Figure
Synthetic Aperture Radar imaging of Polar Lows
 Oslo Polar Low workshop 21-22 May 2012 Extended abstract Synthetic Aperture Radar imaging of Polar Lows Birgitte Furevik, Gunnar Noer and Johannes Röhrs met.no Forecasting polar lows is to a large degree
Lecture 13 El Niño/La Niña Ocean-Atmosphere Interaction. Idealized 3-Cell Model of Wind Patterns on a Rotating Earth. Previous Lecture!
 Lecture 13 El Niño/La Niña Ocean-Atmosphere Interaction Previous Lecture! Global Winds General Circulation of winds at the surface and aloft Polar Jet Stream Subtropical Jet Stream Monsoons 1 2 Radiation
Zonal (East-West) Currents. Wind-Driven Ocean Currents. Zonal (East-West) Currents. Meridional (N-S) Currents
 Currents. Wind-Driven Ocean Currents. Zonal (East-West) Currents. Meridional (N-S) Currents") Wind-Driven Ocean Currents Similarities between winds & surface currents Zonal (East-West) Currents Trade winds push currents westward north & south of the equator Equatorial currents. Up to 100 cm/sec.
Wind-Driven Ocean Currents Similarities between winds & surface currents Zonal (East-West) Currents Trade winds push currents westward north & south of the equator Equatorial currents. Up to 100 cm/sec.
Taranaki Tsunami Inundation Analysis. Prepared for Taranaki Civil Defence Emergency Management Group. Final Version
 Taranaki Tsunami Inundation Analysis Prepared for Taranaki Civil Defence Emergency Management Group Final Version June 2012 AM 12/07 HBRC Plan Number 4362 Asset Management Group Technical Report Prepared
THERMALLING TECHNIQUES. Preface
 DRAFT THERMALLING TECHNIQUES Preface The following thermalling techniques document is provided to assist Instructors, Coaches and Students as a training aid in the development of good soaring skills. Instructors