PublicBeach AssessmentReport. CentralBeach and CastlewoodPark Beach ColonialBeach,Virginia
|
|
|
- Julie Cameron
- 6 years ago
- Views:
Transcription

1 PublicBeach AssessmentReport CentralBeach and CastlewoodPark Beach ColonialBeach,Virginia October 22
2 PUBLIC BEACH ASSESSMENT REPORT Central Beach and Castlewood Park Beach Colonial Beach, Virginia by Donna A. Milligan C. Scott Hardaway, Jr. R. H. Brindley George R. Thomas Linda M. Meneghini Virginia Institute of Marine Science College of William and Mary Gloucester Point, Virginia 2362 A Technical Report Obtained Under Contract with The Virginia Department of Conservation and Recreation for The Board on Conservation and Development of Public Beaches and the Town of Colonial Beach October 22
3 EXECUTIVE SUMMARY The Town of Colonial Beach occupies a peninsula between the Potomac River and Monroe Bay and has approximately 2.5 miles of publicly-owned shoreline. Two areas on the Potomac River have been enhanced as recreational beaches for swimming and sunbathing. Central Beach is located just south of the Town Pier and is the main recreational beach. Castlewood Beach is south of Central Beach near the entrance to Monroe Bay. In 1982, breakwater and beach fill systems were completed at Central and Castlewood beaches. Four gapped breakwaters were constructed at Central Beach, and 5, cubic yards of sand was placed. At Castlewood Beach, three gapped breakwaters and 16, cubic yards of sand were placed, and a terminal groin was constructed to reduce shoaling in the entrance channel to Monroe Bay. The purpose of this report is to document the recent history of Colonial Beach s Potomac River shoreline as well as assess the historical shoreline evolution and status of the beach zone. Review of previously-published literature, field survey data, aerial photos, and computer modeling were used to address the study objectives. In order to quantify the general wave climate acting upon the Colonial Beach shoreline and to provide our wave refraction model with reasonable incident wave conditions, it was necessary to evaluate the local wind/wave climate using wind data from nearby Quantico. These data are used to determine effective fetch for each grid and are input to the SMB program which provides wave height and period for a suite of wind speeds and water levels of the project shore. The predicted wave heights and periods for the four subject directions (N, NE, E, and SE) are used as input to the hydrodynamic model, RCPWAVE. RCPWAVE takes a simulated incident wave condition at the seaward boundary of the grid and allows it to propagate shoreward across the nearshore bathymetry. The results of the RCPWAVE analysis are wave vector and wave orthogonal plots showing wave attenuation and refraction across the nearshore and shoreline that allow us to determine the net movement of littoral materials. Vertical aerial photography through time reveal that little beach has existed along Colonial Beach s shore. Since 1937, sandy beaches have only existed in isolated pockets. Various types of shore protection structures were constructed to abate erosion and protect infrastructure as beach width narrowed where it had previously existed. However, after the installation of the breakwaters, stable beaches were created at Central and Castlewood beaches. Sediment analysis revealed that the native grain size along Colonial Beach s shore was relatively coarse. Recent beach fills at Central have reduced the percent of gravel in each sample and the median grain size at the beach berm and toe. However, at the toe of the beach, the sediment is becoming coarser as the fill material is equilibrated. Beach profile analysis at Central Beach revealed a stable, protective beach. Measured change occurred behind the breakwaters as the upper berm retreated over the last two years. The permeability of the breakwaters does not allow full highwater attachment of a tombolo. However, net change between 1998 and 22 indicates that the tombolo berm is closer to the breakwater than it was and that overall, the embayments have retreated toward equilibrium. The change in the state of the beach at both Central Beach and Castlewood beach has been marked. Wide, usable, protective, stable recreational beaches have been created. The town shoreline north of Central Beach, the proposed area of redevelopment by the Town has been relatively stable in recent years thanks in part to the stability created by the breakwaters and beach fill at Central Beach which has pinned its south boundary and prevented sand loss down river. i
4 TABLE OF CONTENTS EXECUTIVE SUMMARY... i TABLE OF CONTENTS... ii LIST OF FIGURES...iii LIST OF TABLES... v I. Introduction...1 A. Background and Purpose...1 B. Scope of the Study...1 C. Approach and Methodology...3 II. Coastal Setting...1 A. Hydrodynamic Setting Wave Climate Tides and Storm Surge...11 B. Physical Setting Shore Morphology Sediments Sediment Transport...25 III. Beach Characteristics...3 A. Beach Profiles and their Variability... 3 B. Analysis of Beach Profile Data... 3 IV. Summary and Conclusions...44 V. References...47 Appendix I. Data report on sand elevations at Central Beach ii
5 LIST OF FIGURES Figure 1. Location of Central and Castlewood Beaches along the Town of Colonial Beach s shore...2 Figure 2. Location of beach profiles used in this analysis...4 Figure 3. Profile terminology used in this report...5 Figure 4. Bathymetric grids used in the RCPWAVE analysis...8 Figure 5A. Wave vectors and trajectories for Grid 1. Input conditions utilize a 26 mph wind and 3 ft water surge from the northeast...12 Figure 5B. Wave vectors and trajectories for Grid 1. Input conditions utilize a Figure 5C. 26 mph wind and 3 ft water surge from the east...13 Wave vectors and trajectories for Grid 1. Input conditions utilize a 26 mph wind and 3 ft water surge from the southeast...14 Figure 6. Wave trajectory for Grid 1 under a northeast storm condition...15 Figure 7A. Vertical aerial photo of Colonial Beach in Figure 7B. Vertical aerial photo of Colonial Beach in Figure 7C. Vertical aerial photo of Colonial Beach in Figure 7D. Vertical aerial photo of Colonial Beach in Figure 7E. Vertical aerial photo of Colonial Beach in Figure 8. State of Colonial Beach s shore in May Figure 9. State of the shore on 26 June A variety of structures existed along the shore...23 Figure 1. Position of the shore at the Riverboat pier in 1981 and Figure 11A. Percent of sediment sampled that is larger than 2 mm at all three profiles through time at the berm...26 Figure 11B. Percent of sediment sampled that is larger than 2 mm at all three profiles through time at the toe of the beach...26 Figure 12A. Mean sediment sample grain size at all three profiles through time at the berm. 27 Figure 12B. Mean sediment sample grain size at all three profiles through time at the toe of the beach...27 Figure 13 Approximate littoral transport along Colonial Beach s shore...29 Figure 14-A. Beach survey data taken at Profile 1 between June 2 and May Figure 14-B. Beach survey data taken at Profile 2 between June 2 and May Figure 14-C. Beach survey data taken at Profile 3 between June 2 and May Figure 14-D. Beach survey data taken at Profile 4 between June 2 and May Figure 14-E. Beach survey data taken at Profile 5 between June 2 and May Figure 14-F. Beach survey data taken at Profile 6 between June 2 and May Figure 14-G. Beach survey data taken at Profile 7 between June 2 and May Figure 14-H. Beach survey data taken at Profile 8 between June 2 and May Figure 14-I. Beach survey data taken at Profile 9 between June 2 and May Figure 14-J. Beach survey data taken at Profile 1 between June 2 and May Figure 14-K. Beach survey data taken at Profile 11 between June 2 and May Figure 14-L. Beach survey data taken at Profile 12 between June 2 and May iii
6 Figure 14-M. Beach survey data taken at Profile 13 between June 2 and May Figure 14-N. Beach survey data taken at Profile 14 between June 2 and May Figure 14-O. Beach survey data taken at Profile 15 between June 2 and May Figure 14-P. Beach survey data taken at Profile 16 between June 2 and May Figure 14-Q. Beach survey data taken at Profile 17 between June 2 and May Figure 14-R. Beach survey data taken at Profile 18 between June 2 and May Figure 15A. Distance from the baseline to MHW at Central Beach between 1998 and Figure 15B. Distance from the baseline to MHW at Central Beach between 2 and Figure 16. Net change in the distance from the baseline to MHW between 1998 and Figure 17. Total site volume above MLW at Central Beach...42 Figure 18A. Central Beach storm water outfall pipe associated beach erosion after Hurricane Floyd in Figure 18B. Central Beach storm water outfall pipe associated beach erosion in Figure 19. Central Beach in 1977 and Figure 2. Castlewood Beach in 1977 and iv
7 LIST OF TABLES Table 1. Information on available profile data...3 Table 2. Summary wind conditions at Quantico from Table 3. RCPWAVE input conditions...9 Table 4. Storm surge levels as shown in U.S. Army Corps of Engineers (199)...16 Table 5. Grain size (median diameter) at Colonial Beach from published data and sampled data v
8 I. INTRODUCTION A. Background and Purpose The Town of Colonial Beach occupies a peninsula between the Potomac River and Monroe Bay (Figure 1). Approximately 2.5 miles of the shoreline is publicly-owned. Two areas on the Potomac River have been enhanced as recreational beaches for swimming and sunbathing. Central Beach is located just south of the Town Pier and is the main recreational beach. Castlewood Beach is south of Central Beach near the entrance to Monroe Bay In 1982, breakwater and beach fill systems were completed to abate erosion and restore the beach along the Town s shoreline. Four gapped breakwaters were constructed at Central Beach, and 5, cubic yards of sand was placed as part of an U.S. Army Corps of Engineers shore project. At Castlewood Beach, three gapped breakwaters and 16, cubic yards of sand were placed, and a terminal groin was constructed to reduce shoaling in the entrance channel to Monroe Bay. Sections of the shoreline had a rock revetment placed along it by A project in 1989 called for 1,25 cubic yards of sand, breakwater maintenance, and cleanup and removal of small rocks from the river bed at the toe of the beach at Central Beach. In the fall of 1992, the Town, in conjunction with the U.S. Army Corps of Engineers replenished Central Beach with 11,2 cy of sand. In the mid-199s, the Virginia Department of Transportation put in additional riprap revetment along a large section of Colonial Beach s shoreline. Prior to that, a mix of different types of materials had been placed along the shore to abate erosion. In 1998, approximately 2,1 cubic yards of sand was place primarily on Central Beach with some on Castlewood. Again in the winter of 1999, more sand was placed on Central and Castlewood Beaches. The purpose of this report is to document the recent history of Colonial Beach s Potomac River shoreline as well as assess the historical shoreline evolution and status of the beach zone. Integrating an understanding of recent anthropogenic impacts with long-term change provide a detailed picture of how this shoreline is evolving. It also provides a means to determine the effectiveness of management strategies employed along this stretch of shore. B. Scope of Study Specific shore change is addressed at Central Beach through recent beach profiles. However, much of the Town s Potomac River shore is considered for shore change and management issues. In addition, at the Town s request, an analysis was performed on beach fill template data from the original beach and breakwater project and profile data taken after project installation at Central Beach. The purpose of that analysis was to determine the change in sand volume between the template, after the project was installed and in recent years. The report and data provided to the U.S. Army Corps of Engineers is in Appendix I. 1


9 Baltimore WashingtonDC Townof Colonial Beach Norfolk 1 2 1"=2ft Central Beach 18 May 1999 ColonialStreet Riverboat onthepotomac TownPier Boundary Street WeemsStreet Castlewood Park 18 May 1999 LafayetteStreet Robin Grove Park ThackeryRoad LawrenceLane LunsfordPoint Figure 1. Location of Central and Castlewood Beaches along the Town of Colonial Beach s shore. 2
10 C. Approach and Methodology Review of previously-published literature, field survey data, aerial photos, and computer modeling were used to address the study objectives. Personnel at VIMS began monitoring Central Beach in April 1998 (Table 1). Eighteen profiles were established along the shore and are monitored semi-annually (Figure 2). The profile terminology used in this report is demonstrated in Figure 3. Historic and recent aerial images were used to evaluate changes in shoreline conditions through time. Table 1. Beach profile data available for Central Beach in Colonial Beach. Date Survey Number Profile Number Comments 3 April ,3,5,7,9,11,13,15,17 Post-Twin Northeaster 26 May ,3,5,7,9,11,13,15,17,18 28 October ,3,5,7,9,11,13,15,17,18 23 April ,3,5,7,9,11,13,15,16,17,18 23 September ,3,5,7,9,11,13,15,17,18 Post-Hurricane Dennis 2 June ,3,5,7,9,11,13,15,17,18 3 October June November Baseline Reset 12 June In order to quantify the general wave climate acting upon the Colonial Beach shoreline and to provide our wave refraction model with reasonable incident wave conditions, it was necessary to evaluate the local wind climate. The long-term wind data for Quantico are applicable at Colonial Beach (Table 2). These data are used to generate a corresponding wave field using procedures developed by Sverdrup and Monk (1947) and Bretschneider (1958) as modified by Kiley (1982). SMB is a shallow water estuarine wind-generated wave prediction model; it generates waves which cross the Potomac River and are directed toward Colonial Beach. The procedure involves the following steps for each grid: Determine effective fetch for each grid using procedures outlined in the U.S. Army Corps of Engineers Shore Protection Manual (1984). Use the above data as input into the SMB program which provides wave height and period for a suite of wind speeds and water levels. Effective fetch, a parameter in wind wave growth, was determined for the four directions, north (N), northeast (NE), east (E), and southeast (SE), which are assumed to significantly impact Colonial Beach. The southerly wind field has a significant impact on the Colonial Beach shore, but it was difficult to model numerically. The more oblique the input waves are to the bathymetric contours and the shoreline, the more difficult it is to numerically simulate wave changes across the grid. The wind field evaluation and effective fetch as well as bathymetric 3
11 1 1 2 Feet 2 3 IrvingSt Top of Bank Baseline MSL March Figure 2. Survey baselinefor CentralBeach in Colonial Beach.
12 UPLAND BEACH BACKSHORE NEARSHORE ZONE FORESHORE/BEACH FACE BASE OF DUNE ORBANK MHW BERM MLW TOE BAR MHW =MEANHIGHWATER MLW =MEAN LOWWATER TROUGH Figure3. Profile terminology used in this report. Beachprofiles withabreakwater and subaeriallyattachedtomboloare shown dashed.
13 contours and storm surge are input to the SMB program which provides wave height, period, and length for a suite of wind speeds. In this case, wind speeds of 8, 16, 26, 36, 46, and 6 mph were used. Specified water levels ranged from 2 to 9.5 feet. Offshore, the wind and wave direction were assumed the same. However, at about -15 ft MLW, the waves enter the nearshore shoaling region and must be evaluated using a hydrodynamic wave refraction model. The predicted wave heights and periods for the four subject directions (N, NE, E, and SE) are used as input to the hydrodynamic model, RCPWAVE. The process, which calculates the impinging wave climate at a site, was developed and used during previous projects (Hardaway et al., 1991; Hardaway et al., 1993; Milligan et al., 1995). Table 2. Summary wind conditions at Quantico from WIND DIRECTION Wind Speed (mph) Mid Range (mph) North North east East South east South South west West North west Total < * > Total *Number of occurrences Percent RCPWAVE is a linear wave propagation model designed by the USACE (Ebersole et al., 1986) for engineering purposes. It computes changes in wave characteristics that result naturally from refraction, shoaling, and diffraction over complex topography. To this fundamental, linear theory-based model, routines to estimate wave energy dissipation due to bottom friction have been added (Wright et al., 1987). The use of RCPWAVE to model the hydrodynamics at Colonial Beach assumes that only the offshore bathymetry affects wave transformation; the application does not include the effects of tidal currents. 6
14 RCPWAVE takes a simulated incident wave condition at the seaward boundary of the grid and allows it to propagate shoreward across the nearshore bathymetry. Frictional dissipation due to bottom roughness is accounted for in this analysis and is relative in part to the mean grain size of the bottom sediment. Waves also tend to become smaller over shallower bathymetry and remain larger over deeper bathymetry. Upon entering shallow water, waves are subject to refraction, in which the direction of wave travel changes with decreasing depth in such a way that wave crests tend to become parallel to the depth contours. Irregular bottom topography can cause waves to be refracted in a complex way and produce variations in the wave height and energy along the coast. In general, waves break when the ratio of wave height to water depth equals.78 (Komar, 1976). RCPWAVE requires the creation of bathymetric grids in order to refract and shoal waves. Two grids (Figure 4) of the study region were digitized from a National Oceanic and Atmospheric Administration chart no , updated to 23 January 1993 by BBA Chart Kits. Bathymetric Grid 1 was used for the southeast, east and northeast wind conditions while bathymetric Grid 2 accommodates the north winds. The results of the RCPWAVE analysis are wave vector and wave orthogonal plots showing wave attenuation and refraction across the nearshore and shoreline that allow us to determine the net movement of littoral materials. Wave vector plots show modeled wave orthogonals that have a magnitude and direction associated with them. Wave orthogonal plots can indicate areas of the shoreline that might be impacted by a convergence or divergence of wave energy. Areas of convergence indicate an increased amount of energy is impacting a section of shore whereas divergence indicates that the wave orthogonals are spreading out resulting in a lesser amount of energy impacting that shore. The conditions input into RCPWAVE are listed in Table 3. The direction is a wind blowing from the north/northeast/east/southeast generating a wave orthogonal bearing to the southwest/west/northwest or 18 o TN/235 o TN/27 o TN/315 o TN. The wave condition number is an assigned designation for each case run through RCPWAVE. The water level is the estimated storm surge, in ft above MLW, associated with each event. The modal, or annual average conditions, described by the 16, 26, and 36 mph winds were run at spring high water or slightly above. Significant wave height and period were determined by the SMB analysis. 7


15 2 1 N Miles 1 Feet Kilometer Figure 4. Bathymetricgrids used inthercpwave analysis. 8
16 Table 3. RCPWAVE input conditions (SMB output). Direction and Bearing North 18 deg TN Northeast 225 deg TN East 27 deg TN Southeast 315 deg TN Case Number Wind Speed (mph) Surge (ft) Height (ft) Period (seconds )
17 II. COASTAL SETTING A. Hydrodynamic Processes 1. Wind/Wave Climate The wave climate in the Chesapeake Bay is characterized by fetch-limited and depthlimited conditions. For this study, the main hydrodynamic forces operating along the project area are the waves and wave-induced currents and tidal currents. The assessment of hydrodynamic conditions along the Colonial Beach shoreline results in the determination of the annual, average or modal conditions as well as the storm conditions impacting the site. The assessment is based on the wind field analysis as well as the hydrodynamic modeling. Colonial Beach has effective fetches to the north, northeast, east, and southeast of 5.2 nautical miles (nm), 6.4 nm, 8.3 nm and 8. nm, respectively. Effective fetch is a measure of the size of waves that can be generated at a shoreline. Winds less than 7 mph were not used in the analysis because they typically generate wind chop which is not sufficiently large or organized to move sediment. Winds from 1-36 mph generate local wind waves when propagated over a fetch (Ludwick, 1987). Wind data taken between 1945 and 1975 at Quantico Marine Corps Base was analyzed in U.S. COE (198). Observed storm winds (sustained 44 mph winds) were from the east. Average wind speeds over those 3 yrs showed that the three dominant wind directions were the northeast, south-southeast, and east-southeast. Analysis of wind data taken Quantico between 1973 and 21 showed that the southerly condition dominated at the lower wind speeds (1-11 mph). While the southerly component is still significant at mph range, the north and northwest conditions dominate. At the highest wind speeds indicating storm conditions, the northwest, north and west conditions dominate. Long-term wind frequencies of the directions that impact the study shoreline indicate the south wind is dominant in the 5-31 mph range followed by the northwest, then the north. The beach orientation tends to protect the shore from direct northwest storm events. The southerly wind component may indirectly effect the Colonial Beach shore as generated waves refract around the Gum Bar Point. The east and southeast directions which have the longest effective fetches provide the largest potential wave. The U.S. COE (198) projected a maximum design wave with a 45 mph sustained wind from the east-southeast with a deep water significant wave height of 4.5 ft and a period of 4.65 seconds. The SMB analysis resulted in a slightly smaller wave with a wave height of 4.2 ft and a period of 4.28 seconds. Two types of storms can impact the area. A storm that will impact Colonial Beach from the southeast is a hurricane or other low-pressure system off the Atlantic coast of the Eastern Shore. A storm of this type could generate large waves over the southeast fetch as well as produce a large storm surge. However, this is a rare event, and the wind data indicate that storm conditions experienced at Colonial Beach are generally from the northeast. These second, more 1
18 frequent types of storms are the extra-tropical storms or northeasters. Northeasters have a smaller storm surge than a hurricane but can last several tidal cycles longer. The nearshore region varies along the study site. This has an impact on the wave climate in that the wider shallow nearshore regions will tend to attenuate wave action more than narrower shelves. At Colonial Beach, the nearshore is relatively narrow and steep at the northern end of the town with the 15 ft contour approximately 1,4 ft from the shore at the bend in the shoreline near Lincoln Avenue at White Point. At the southern end of Colonial Beach near Gum Bar Point, the 15 ft contour is approximately 11, ft from the shoreline. RCPWAVE allows us to determine the wave climate along a shore reach. Figures 5A, 5B, and 5C show the typical results of the RCPWAVE analysis along Colonial Beach for modal wind conditions (26 mph sustained wind with a 3 ft surge) from the northeast, east and southeast. This case is indicative of less than a one-year event. Under modal conditions, the offshore bathymetry tend to disperse waves at Central Beach when the winds come from the east and southeast. From the northeast, wave trajectories are not dispersed, but they also are not concentrated. However, just north of Central Beach, a small area of wave concentration is indicated under northeast wave conditions. Trajectory plots demonstrate how wave patterns are established offshore at the 4 m and 5 m contours. The wave trajectories resulting from a northeast storm wave are shown in Figure 6. This case used a 6 mph wind with an 8 ft surge. This is indicative of approximately a 5-yr event. As under modal conditions, the wave do not tend to concentrate directly at Central Beach, but farther north toward Lincoln Avenue, they do tend to increase. 2. Tides and Storm Surge The beach has a mean tide range of 1.66 ft and a spring tide range of 1.97 ft (NOAA website, 22). Storm surge may pose a threat to certain resources regardless of potential wave impacts. The wave climate assessment included a determination of the frequency of storm surges and flooding based on FEMA s Flood Insurance Studies (Table 4). This assessment is critical when determining the potential impacts of the local wave climate and related storm surge on shoreline management strategies. Central Beach is backed by a high bank which serves to protect the upland from storm damage. Most upland structures, with the exception of the bathrooms, would be protected against the highest predicted storm surge, the 1-yr event with wave action. The beach and bank protect the road, parking lot and parking meters at the site. Areas to the north of Boundary Road to Lincoln Avenue are more flood prone. 11

19 White Point Central Beach Castlewood Beach Y(km) MonroeBay MLW White Point Central Beach Castlewood Beach Y(km) MonroeBay MLW Approximate locationsof geographical pointsand the position of meanlowwater. Figure 5A. Wavevectors and trajectories forgrid1. Inputconditions utilizea26mph windand 3ftwater surge from thenortheas.t

20 MLW White Point Central Beach Castlewood Beach Y(km) MonroeBay White Point Central Beach Castlewood Beach Y(km) MonroeBay MLW Approximate locationsof geographical pointsand the position of meanlowwater. Figure 5B.Wave vectors and trajectories forgrid1. Input conditions utilize a26mph wind and3ftwater surge fromthe east.

21 White Point Central Beach Castlewood Beach Y(km) MonroeBay MLW White Point Central Beach Castlewood Beach Y(km) MonroeBay MLW Approximate locationsof geographical pointsand the position of meanlowwater. Figure 5C.Wave vectors and trajectories forgrid1. Input conditions utilize a26mph wind and3ftwater surge fromthe southeast.

22 White Point Central Beach Castlewood Beach Y(km) MonroeBay MLW Approximate locationsof geographical pointsand the position of meanlowwater. Figure 6. Wavetrajectoryfor Grid 1under anortheaststorm condition.
23 Table 4. Storm surge levels as shown in U.S. Army Corps of Engineers (199). Frequency (years) Exceedance Frequency (%) Stage (ft MLW) B. Physical Setting 1. Shore Morphology Much of the Town of Colonial Beach exists on a peninsula between the Potomac River and Monroe Bay. The geology of the upland is described as undifferentiated Lynnhaven and Poquoson Members of the Tabb Formation. The Tabb Formation was created during the Upper Pleistocene 7,-12, years ago. The Lynnhaven and Poquoson members are described as pebbly and cobbly grading into finer sand and silt. Vertical aerial photos taken in 1937, 1969, 1987, 1994, 21 (Figures 7A through 7E) were assessed. Historically, little beach has existed along most of the Colonial Beach shore. In 1937 (Figure 7A), some sand did reside in the pocket formed by the curve in the shoreline at Boundary Street where Central Beach now exists. The photo also seems to indicate a vegetated backshore. Erosion of the upland along this stretch of shore probably provided little beach quality sand. The larger pebbles and cobbles are difficult to transport alongshore, and the finer sand and silt are likely transported quickly along or offshore. The existence of Gum Bar Point indicates transport to the south. In 1937, the shoreline may have partially been fringe marsh at the southern end of Colonial Beach. The beach was particularly narrow north of the northern headland at Lincoln Avenue. Few shoreline structures existed in just a few piers along the northern section of this reach. By 1969 (Figure 7B), many structures appeared along the shore. At least 9 piers and 23 groins were visible in the photo. The beach area still existed at the pocket at Boundary Street. However, it was narrower than in 1937 with a reduced backshore area. At Gum Bar Point, sand had filled in the marsh headlands. The Monroe Bay shore had been hardened at the Point. This allowed the formation of a sand spit at the southernmost point of Colonial Beach. North of the headland at Lincoln Avenue, sand beach only existed in small pockets. 16


24 A 1Apr Dec1969 Lincoln Avenue Lincoln Avenue Boundary Street Boundary Street Gum Bar Point Gum Bar Point Figure 7. Verticalaerialphotos of ColonialBeach ina)1937andb)1969. B 17
1987.")
25 C 5Oct 1987 Lincoln Avenue Boundary Street Gum Bar Point Figure 7. Verticalaerialphotos of ColonialBeach in C)
1994.")
26 D 7Sep 1994 Lincoln Avenue Boundary Street Gum Bar Point Figure 7. Verticalaerialphotos of ColonialBeach in D)
 21.")
27 E 2Aug 21 Lincoln Avenue Boundary Street Gum Bar Point Figure 7. Verticalaerialphotos of ColonialBeach in E) 21. 2
28 In 1977, the shoreline had a variety of structures along it in an attempt to abate erosion. At Central Beach, a concrete revetment existed along the shore (Figure 8). Farther south toward Castlewood Beach, sandbags and broken concrete were placed along the shore. At Castlewood, a sand beach existed probably because of the resistance of the underlying marsh substrate to erosion as well as the transport of sand into the area. Figure 9 shows the types of materials placed along the beach. Erosion, indicated by the fallen tree, resulted in the placement of sandbags both alongshore and offshore as groins. Broken concrete and other materials also were placed along the shore. The 1987 photo (Figure 7C) shows the seven breakwaters constructed at Central Beach and Castlewood Beach. The breakwaters and beach fill created wide recreational beaches at these two subreaches. The more cohesive management strategy reduced the number of large piers and groins along the shore south of Lincoln Avenue. However, along several sections of the shore between Central and Castlewood Beaches, lower level photos show many of the small groins still existed. Much of the shoreline did have a rock revetment along it. By 1994 (Figure 7D), the stone revetment had been placed along much of the Town s shoreline south of Central Beach. Overall beach width increased at Central Beach and Castlewood as sand accumulated behind the breakwaters mostly as a result of beach nourishment. In addition, another set of breakwaters were constructed at Gum Bar Point to limit sand movement into the entrance channel to Monroe Bay. The breakwaters are on privatelyowned property. In 21 (Figure 7E), the beach width at Central Beach appears to be slightly reduced while Castlewood seems to have changed little since Several piers were built along the shoreline. Figure 1 shows the shore position at the Riverboat pier in 1981 and 22. Along this particular section of shore, little change has occurred. This is probably due to the input of sand to the system at Central Beach that is occasionally transported north and trapped by the groins. 2. Sediments The sedimentology of the study area is based on both active processes as well as the underlying geology of the region. Sorting and winnowing of the sediments by the littoral currents and waves occurs continuously in the nearshore region and erosion can expose outcrops of material deposited long ago. At Colonial Beach, the native sediment type is relatively coarse (Table 5). In general, the median grain size at Central Beach has increased at the toe of the beach (MLW) while decreasing at the berm (MHW). The sediment data from 1946 and 1974 was published by U.S. COE (198). 21


29 17 May1977 Concrete Revetment Central Beach Town Pier Central Beach Concrete Revetment Castlewood Beach Broken Conrete Figure 8. State of thecolonialbeach s shore inmay


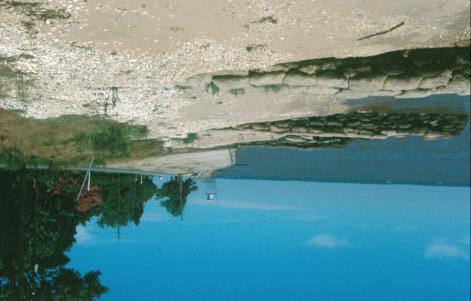
30 Figure 9. State of theshore on 26June1977. Avarietyofstructures existed along the shore. 23


31 7April 1981 Shore Position Shore Position Riverboat Pier 16 April 22 Figure 1. Positionof theshore atthe Riverboat pier in1981 and
32 Table 5. Grain size (median diameter) at Colonial Beach from published data and sampled data. Sample Location Central Beach Median Diameter (mm) Castlewood Beach Median Diameter (mm) MHW MLW Sediment data taken at morphologic locations along profiles 5, 9, and 13 were analyzed for grain size parameters. Figure 11 shows the percent of the sample that is considered gravel (grain size over 2 mm) for samples taken at the berm and the toe of the beach through time. The amount of gravel at the berm has decreased through time at all profiles. The percent of gravel in the sediment samples decreased at the toe until June 2 when it started increasing again. Figure 12 shows the median sample grain size at the berm and the toe through time at all three profiles. The trend is the same as the percent gravel; the grain size has decreased at the berm and at the toe, it decreased until June 2 when it started increasing again. This is likely due to the influence of the beach fills. Smaller grained sand was placed on the beach decreasing grain size at the berm and the toe. However, the beach adjusted to the fill. While the smaller grained sand remained on the berm, it was transported away from the toe which is generally the most energetic portion of the beach and typically more gravelly than other parts of the beach. 3. Sediment Transport Sediment transport is, in large part, due to the influence of waves along the shore. At Central Beach, sediment transport occurs alongshore and offshore only during local storm events which occur five to six times per year (U.S. COE, 198). Swell-type waves do not occur in fair weather so sediment moved offshore during storms does not move back to the beach and is lost to the system. Little natural alongshore transport is received at Central Beach, particularly just south of this section where the revetment occurs. However, the northern end of the site is open allowing transport into and out of the breakwater area resulting in variable volumes when sand moves through the system. At Castlewood Beach, however, storm waves tend to drive sediment alongshore due to its northeast-southwest orientation. Sediment moves to the southwest toward the entrance to Monroe Bay. The Corps (198) found that the entrance channel of Monroe Bay was shoaling at a rate of 1,5 cy/yr. However, offshore sand transport during east and east-southeast storm events also plays a major role in erosion at Castlewood. This section of Colonial Beach s shoreline eroded at about 4 ft/yr between 1944 and 1977 losing about 3,4 cy of sand per year. The U.S. COE (198) estimated that the initial beach fill and breakwater project would require maintenance at a rate of 1,25 cy for Central Beach and 1,57 cy at Castlewood every two to three years. 25
33 1 8 Berm A Oct1998 3Apr199826May Apr Sep1999 2Jun2 3Oct2 25Jun21 6Nov21 Date 1 B Toe 28Oct1998 3Apr199826May Apr Sep1999 2Jun2 3Oct2 25Jun21 6Nov21 Date Profile 5 Profile 9 Profile 13 Figure 11. Percent of sedimentsampled thatis largerthan2mm atallthreeprofiles through time atthea) berm andb) the toeofthebeach. 26
34 14 Berm A Apr May Apr Sep1999 2Jun2 3Oct2 25Jun21 6Nov21 Date 14 B Toe 3Apr May Apr Sep1999 2Jun2 3Oct2 25Jun21 6Nov21 Date Profile 5 Profile 9 Profile 13 Figure 12. Meansedimentsamplegrain size atallthreeprofiles through time atthea)berm and B) toeofthebeach. 27
35 Utilizing wave vector output from the RCPWAVE analysis, a limited-scope littoral transport-potential analysis was performed. The wind/wave height and angle to the shore at the Colonial Beach shoreline were determined from the RCPWAVE output. The northeast, east, and southeast modal conditions only were used in the analysis. Modal conditions are the annual average waves at the site. For the purpose of this report, it is the predicted wave height and angle from a 16 mph, 26 mph, and 36 mph wind from the three main directions of influence that could be modeled (northeast, east, and southeast). Figure 13 shows the resultant transport vectors. The vectors were calculated using the energy flux method for determining sediment transport (USACE, 1984). The shoreline is divided into morphologic sections based on approximate shore orientation. Section A at Central Beach has the greatest transport rate toward the south. The rate decreases down the shoreline through Sections B (Central Beach breakwater section) and C. These rates are only based on the wave height and angle. The analysis does not account for sediment amount and types available for transport or the presence of structures. These rates are close to annual beach fill maintenance estimated by the Corps of Engineers. 28


36 A 1,3cy/yr B 1,cy/yr C 8 cy/yr N Transport Scale 1,cy/yr Chart Scale.5 1 Kilometers Feet.5 Miles 1 Figure 13. Approximatelittoraltransportrates alongcolonial Beach s shore. 29
37 III. BEACH CHARACTERISTICS A. Beach Profiles and their Variability Semi-annual monitoring by personnel in the Shoreline Studies Program began at Central Beach in the spring of Plots of profile data taken between 2 and 22 are shown in Figures 14A through 14R. Little net change has occurred at Central Beach. Upper berm retreat or adjustment was noted at profile 2 and behind all four breakwaters. Behind the southernmost breakwater (profile 15), the lower berm advanced while the upper berm retreated. Profile 14 showed the greatest net change; the bank face showed an increase in sand while the beach face retreated. Changes in sand elevations at specific points along the shore may be the result of shifting of sediment within the embayments as a response to changes in the wave climate. Also, the bulldozing of the beach for maintenance and cleaning impact the beach profiles. B. Analysis of Beach Profile Data One portrayal of shore change is the movement of a tidal contour through time. Following traditional methods, the position of mean high water (MHW) for each study profile was plotted through time (Figures 15A and 15B). For the data set, all the beach profiles were not surveyed. This results in the shoreline not plotting the same as the later dates. Figures 15A and 15B also show very little net change along the shoreline. In April 1999, the tombolo berm behind each breakwater was at its closest point. By June 2, it had retreated. Between April 1998 and May 22 (Figure 16), the net position of MHW has advanced behind each breakwater (1, 2, 3, and 4) and retreated in the apex of each embayment (A, B, C). The tombolo berm behind breakwaters 1 and 4 are the most susceptible to change since they are on the ends of the system. Embayment B tends to be the most stable since it is enclosed within the system. In October of 2, all 18 profiles began to be surveyed instead of every other profile. Calculations for the beach system volume are slightly different but are comparable. Figure 17 shows the overall volume change along Central Beach through time. The small beach fills are noted. In general, the net measured change in volume between 1998 and 22 has been a net gain of approximately 3, cubic yards (cy). One problem that Central Beach has, which is not reflected in the beach profile data, is the outfall pipes that exit through the beach. Figure 18 shows the result of storm water drainage after Hurricane Floyd passed through the area in But even under non-storm events, large channels are created through the beach. 3
38 A 2Jun 2 11Nov21 2Oct 2 14May22 25Jun21 B 2Oct 2 11Nov21 25Jun21 14May22 Figure 14. Beach survey data taken between June 2 andmay22 ata)profile1and B) Profile2.
39 C 2Jun 2 11Nov21 2Oct 2 14May22 25Jun21 D 2Oct 2 11Nov21 25Jun21 14May22 Figure 14. Beach survey data taken between June 2 andmay22 atc)profile3and D)Profile 4.
40 E 2Jun 2 11Nov21 2Oct 2 14May22 25Jun21 F 2Oct 2 11Nov21 25Jun21 14May22 Figure 14. Beach survey data taken between June 2 andmay22 ate) Profile5and F) Profile6.
41 G 2Jun 2 11Nov21 2Oct 2 14May22 25Jun21 H 2Oct 2 11Nov21 25Jun21 14May22 Figure 14. Beach survey data taken between June 2 andmay22 atg) Profile7and H) Profile8.
42 I 2Jun 2 11Nov21 2Oct 2 14May22 25Jun21 J 2Oct 2 11Nov21 25Jun21 14May22 Figure 14. Beach survey data taken between June 2 andmay22 ati) Profile9andJ) Profile1.
43 K 2Jun 2 11Nov21 2Oct 2 14May22 25Jun21 L 2Oct 2 11Nov21 25Jun21 14May22 Figure 14. Beach survey data taken between June 2 andmay22 atk) Profile11and L)Profile 12.
44 M 2Jun 2 11Nov21 2Oct 2 14May22 25Jun21 N 2Oct 2 11Nov21 25Jun21 14May22 Figure 14. Beach survey data taken between June 2 andmay22 atm) Profile13and N)Profile 14.
45 O 2Jun 2 11Nov21 2Oct 2 14May22 25Jun21 P 25Jun21 11Nov21 14May22 Figure 14. Beach survey data taken between June 2 andmay22 ato) Profile15 and P) Profile16.
46 Q 2Jun 2 11Nov21 2Oct 2 14May22 25Jun21 R 2Jun 2 11Nov21 2Oct 2 14May22 25Jun21 Figure 14. Beach survey data taken between June 2 andmay22 atq) Profile17 and R) Profile18.
47 3 Bw1 Bw2 A 25 2 A B Bw3 C Bw Revetment ProfileNumber 3-Apr May Oct Bw1 23-Apr Sep-99 2-Jun- Bw2 A Bw3 B Bw4 C B ProfileNumber Revetment 2-Jun- 3-Oct- 25-Jun-1 19-Nov-1 14-May-2 Figure 15. Distancefrom the baseline tomhwatcentralbeach betweena) and B)
48 3 BW BW A B BW3 C BW 1 Revetment Profile Number 3-Apr May-2 Figure 16. Net change inthe distancefromthe baselineto MHWbetween 1998and 22.
49 42

 after HurricaneFloyd")
50 A 23 Sep 1999 B Figure 18.CentralBeach storm water outfallpipeassociatedbeach erosiona) after HurricaneFloyd in 1999and B) in
51 IV. SUMMARY AND CONCLUSIONS The change in the state of the beach at both Central Beach and Castlewood beach has been marked (Figures 19 and 2). Wide, usable, protective, stable recreational beaches have been created. In addition, Castlewood Beach acts to reduce shoaling at the entrance to Monroe Bay by allowing sand to accumulate behind the breakwaters. On the northern end, Central Beach also reduces the loss of sand to the system. The town shoreline north of Central Beach, the proposed area of redevelopment by the Town has been relatively stable in recent years thanks in part to the stability created by the breakwaters and beach fill at Central Beach and the structures placed along the shore. The breakwater system has pinned its south boundary and prevented sand loss down river. However, the area is subject to increased wave activity under northeast wind/wave conditions, particularly during northeast storm events. Through time, much of the shoreline at Colonial Beach has been hardened with a rock revetment. Both the revetment and the breakwater systems replace a myriad of smaller, less efficient shore protection structures. However while the revetment abates erosion and protects infrastructure, it has halted the supply of native materials to the sediment transport system. Should sand be lost from the beaches during storm events, it is unlikely that it will return naturally. The native sediment type along this shore is relatively coarse due to the underlying geology. However, Central Beach s median grain size has been decreasing due to the beach fills that have taken place. Measured shore change is occurring behind the breakwaters at Central Beach. The breakwaters are relatively low in comparison with the elevation of the beach. They provide a very stable beach but do not allow complete attachment of the sand behind the breakwaters due to their permeability. Still the beach is able to maintain its total sand volume. Sand shifts within the overall system in response to the wave climate. The storm drains empty onto the beach and cause local erosion in the upper beach. These losses are not accounted for in the beach profile data. During storm events with a great deal of rainfall, severe erosion of the upper beach can occur. This situation can be rectified by directing the storm drains under the beach and through the breakwaters. 44


52 19 June November 21 Figure 19.CentralBeach in1977 and


53 Castlewood Beach 17 May 1977 Castlewood Beach Figure 2.CastlewoodBeach in 1977 and April 22
54 V. REFERENCES Bretschneider, C.L., Revisions in wave forecasting: Deep and shallow water. Proceedings Sixth Conf. on Coastal Engineering, ASCE, Council on Wave Research. Ebersole, B.A., M.A. Cialone, and M.D. Prater, RCPWAVE - A Linear Wave Propagation Model for Engineering Use. CERC-86-4, U.S. Army Corps of Engineers Report, 26 pp. Hardaway, C.S., Jr., G.R. Thomas, and J.H. Li, Chesapeake Bay Shoreline Studies: Headland Breakwaters and Pocket Beaches for Shoreline Erosion Control. SRAMSOE No. 313, Virginia Institute of Marine Science, College of William and Mary, Gloucester Point, VA, 153 pp. Hardaway, C.S., Jr., D.A. Milligan and G.R. Thomas, Public Beach Assessment Report: Cape Charles Beach, Town of Cape Charles, Virginia. Technical Report, Virginia Institute of Marine Science, College of William and Mary, Gloucester Point, VA, 42 pp. + app. Kiley, K., Estimates of bottom water velocities associated with gale wind generated waves in the James River, Virginia. Virginia Institute of Marine Science, School of Marine Science, College of William and Mary, Gloucester Point, VA. Komar, P.D., Beach Processes and Sedimentation. Prentice-Hall, Inc., Englewood Cliffs, NJ, 429 pp. Ludwick, J.C., Mechanisms of Sand Loss from an Estuarine Groin System Following an Artificial Sand Fill. Old Dominion University Technical Report 87-2, 89 pp. Milligan, D.A., C.S. Hardaway, Jr., and G.R. Thomas, Public Beach Assessment Report: Huntington Park Beach, Anderson Park Beach, and King-Lincoln Park Beach, City of Newport News, Virginia. Technical Report, Virginia Institute of Marine Science, College of William and Mary, Gloucester Point, VA, 6 pp. + app. NOAA website, Sverdrup, H.U. and W.H. Munk, Wind sea, and swell: Theory of relations for forecasting. U.S. Navy Hydrographic Office Publ. No. 61. Tidelog, Chesapeake Tidewater. Pacific Publishers, Bolinas, CA. U.S. Army Corps of Engineers, 198. Beach Erosion Control, Colonial Beach, Virginia. Detailed Project Report. Baltimore District. 47
55 U.S. Army Corps of Engineers, Shore Protection Manual. U.S. Government Printing Office, Washington, D.C. Wright, L.D., C.S. Kim, C.S. Hardaway, Jr., S.M. Kimball, and M.O. Green, Shoreface and Beach Dynamics of the Coastal Region from Cape Henry to False Cape, Virginia. Technical Report, Virginia Institute of Marine Science, College of William and Mary, Gloucester Point, Virginia, 116 pp. 48
56 Appendix I Data report on sand elevations at Central Beach
57 I. Data Information Beach profile data came from several sources. The February 1981 beach profile and the beach fill template came from the U.S. Army Corps of Engineers Baltimore District s Preliminary Beach Erosion Control - Colonial Beach, Virginia plans. The April 3, 1986 data were measured from plots of profiles taken by R. Peel Dillard, Certified Land Surveyor, Tappahannock, Virginia. The June 25, 21 data is from VIMS s database of semi-annual profiles. However, all 18 profiles were not surveyed each date. VIMS s baseline is generally parallel and behind the Corps baseline at Central Beach (Figure I-1). VIMS profiles were placed to measure changes at the ends of the breakwaters, across the center of the breakwaters, and mid-bay. The Corps cross-sections are based on the design of the system. Since cross-sectional profiles are not directly comparable because the profiles are not located directly on top on another, adjustments were made to the Corps and Dillard surveys (both used the same baseline) to make the data comparable to VIMS data (Table I-1). The northernmost section of the beach is difficult to compare since the Corps baseline angled at VIMS profile 3. Also note that a revetment was installed at the southern end of Central Beach and profile 18 crosses it. Table I-1. Adjustment data for Corps data to VIMS baseline. VIMS profiles 4 and 15 were not used in the analysis. VIMS Profile No. Corps Profile No. Change West (ft) Change North (ft) Appendix I- Page 1
Dune Monitoring Data Update Summary: 2013
 Dune Monitoring Data Update Summary: 13 Shoreline Studies Program Virginia Institute of Marine Science College of William & Mary Gloucester Point, Virginia September 13 Dune Monitoring Data Update Summary:
Salt Ponds Shore Zone Modeling for Breakwater Placement: Summary Report
 Salt Ponds Shore Zone Modeling for Breakwater Placement: Summary Report Virginia Institute of Marine Science May 2014 Salt Ponds Shore Zone Modeling for Breakwater Placement: Summary Report For Waterway
IMPACTS OF COASTAL PROTECTION STRATEGIES ON THE COASTS OF CRETE: NUMERICAL EXPERIMENTS
 IMPACTS OF COASTAL PROTECTION STRATEGIES ON THE COASTS OF CRETE: NUMERICAL EXPERIMENTS Tsanis, I.K., Saied, U.M., Valavanis V. Department of Environmental Engineering, Technical University of Crete, Chania,
CROSS-SHORE SEDIMENT PROCESSES
 The University of the West Indies Organization of American States PROFESSIONAL DEVELOPMENT PROGRAMME: COASTAL INFRASTRUCTURE DESIGN, CONSTRUCTION AND MAINTENANCE A COURSE IN COASTAL DEFENSE SYSTEMS I CHAPTER
Beach Nourishment Impact on Beach Safety and Surfing in the North Reach of Brevard County, Florida
 Beach Nourishment Impact on Beach Safety and Surfing in the North Reach of Brevard County, Florida Prepared by John Hearin, Ph.D. Coastal Engineering Vice Chairman Cocoa Beach Chapter Port Canaveral Patrick
Design and Construction of Living
 Design and Construction of Living Shorelines A course for living shorelines professionals September 29, 2010 This course made possible by a grant from the Virginia Coastal Zone Management Program NOAA
Volume and Shoreline Changes along Pinellas County Beaches during Tropical Storm Debby
 Volume and Shoreline Changes along Pinellas County Beaches during Tropical Storm Debby Ping Wang and Tiffany M. Roberts Coastal Research Laboratory University of South Florida July 24, 2012 Introduction
Figure 4, Photo mosaic taken on February 14 about an hour before sunset near low tide.
 The Impact on Great South Bay of the Breach at Old Inlet Charles N. Flagg and Roger Flood School of Marine and Atmospheric Sciences, Stony Brook University Since the last report was issued on January 31
OECS Regional Engineering Workshop September 29 October 3, 2014
 B E A C H E S. M A R I N A S. D E S I G N. C O N S T R U C T I O N. OECS Regional Engineering Workshop September 29 October 3, 2014 Coastal Erosion and Sea Defense: Introduction to Coastal Dynamics David
Reading Material. Inshore oceanography, Anikouchine and Sternberg The World Ocean, Prentice-Hall
 Reading Material Inshore oceanography, Anikouchine and Sternberg The World Ocean, Prentice-Hall BEACH PROCESSES AND COASTAL ENVIRONMENTS COASTAL FEATURES Cross section Map view Terminology for Coastal
DUXBURY WAVE MODELING STUDY
 DUXBURY WAVE MODELING STUDY 2008 Status Report Duncan M. FitzGerald Peter S. Rosen Boston University Northeaster University Boston, MA 02215 Boston, MA 02115 Submitted to: DUXBURY BEACH RESERVATION November
HURRICANE SANDY LIMITED REEVALUATION REPORT UNION BEACH, NEW JERSEY DRAFT ENGINEERING APPENDIX SUB APPENDIX D SBEACH MODELING
 HURRICANE SANDY LIMITED REEVALUATION REPORT UNION BEACH, NEW JERSEY DRAFT ENGINEERING APPENDIX SUB APPENDIX D SBEACH MODELING Rev. 18 Feb 2015 1 SBEACH Modeling 1.0 Introduction Following the methodology
New Jersey Coastal Zone Overview. The New Jersey Beach Profile Network (NJBPN) 3 Dimensional Assessments. Quantifying Shoreline Migration
 3 Dimensional Assessments. Quantifying Shoreline Migration") New Jersey Coastal Zone Overview The New Jersey Beach Profile Network (NJBPN) Objectives Profile Locations Data Collection Analyzing NJBPN Data Examples 3 Dimensional Assessments Methodology Examples Quantifying
New Jersey Coastal Zone Overview The New Jersey Beach Profile Network (NJBPN) Objectives Profile Locations Data Collection Analyzing NJBPN Data Examples 3 Dimensional Assessments Methodology Examples Quantifying
Yorktown Beach with Hurricane Isabel Impacts
 Yorktown Beach 3-5 with Hurricane Isabel Impacts VIMS Shoreline Studies Program January 5 Yorktown Beach 3-5 with Hurricane Isabel Impacts Donna A. Milligan C. Scott Hardaway, Jr. Linda M. Meneghini George
UPPER BEACH REPLENISHMENT PROJECT RELATED
 ASSESSMENT OF SAND VOLUME LOSS at the TOWNSHIP of UPPER BEACH REPLENISHMENT PROJECT RELATED to the LANDFALL OF HURRICANE SANDY - PURSUANT TO NJ-DR 4086 This assessment is in response to Hurricane Sandy
STATUS REPORT FOR THE SUBMERGED REEF BALL TM ARTIFICIAL REEF SUBMERGED BREAKWATER BEACH STABILIZATION PROJECT FOR THE GRAND CAYMAN MARRIOTT HOTEL
 August 23 STATUS REPORT FOR THE SUBMERGED REEF BALL TM ARTIFICIAL REEF SUBMERGED BREAKWATER BEACH STABILIZATION PROJECT FOR THE GRAND CAYMAN MARRIOTT HOTEL performed by Lee E. Harris, Ph.D., P.E. Consulting
Town of Duck, North Carolina
 Tracking No. 00.00.2010 Erosion Mitigation And Shoreline Management Feasibility Study Town of Duck, North Carolina Coastal Planning & Engineering of North Carolina August 15, 2012 Tom Jarrett Robert Neal
Long Beach Island Holgate Spit Little Egg Inlet Historical Evolution Introduction Longshore Transport Map, Survey and Photo Historic Sequence
 Appendix B Long Beach Island Holgate Spit Little Egg Inlet Historical Evolution Introduction The undeveloped southern end of Long Beach Island (LBI) is referred to as the Holgate spit as it adjoins the
Nearshore Placed Mound Physical Model Experiment
 Nearshore Placed Mound Physical Model Experiment PURPOSE: This technical note describes the migration and dispersion of a nearshore mound subjected to waves in a physical model. The summary includes recommendations
For more information or permission to reprint slides, please contact Donna Milligan at 1
 For more information or permission to reprint slides, please contact Donna Milligan at milligan@vims.edu 1 For more information or permission to reprint slides, please contact Donna Milligan at milligan@vims.edu
Brief History of Headland Breakwaters Usage in Chesapeake Bay, USA. 25 Years of Rock, Sand and Plants for Shore Protection
 Brief History of Headland Breakwaters Usage in Chesapeake Bay, USA. 25 Years of Rock, Sand and Plants for Shore Protection Beach Tech 2011 C. Scott Hardaway, Jr., Geologist, Virginia Institute of Marine
Appendix E Cat Island Borrow Area Analysis
 Appendix E Cat Island Borrow Area Analysis ERDC/CHL Letter Report 1 Cat Island Borrow Area Analysis Multiple borrow area configurations were considered for Cat Island restoration. Borrow area CI1 is located
SHORE PROTECTION AND HABITAT CREATION AT SHAMROCK ISLAND, TEXAS ABSTRACT
 SHORE PROTECTION AND HABITAT CREATION AT SHAMROCK ISLAND, TEXAS M. Cameron Perry, P.E., and Daniel J. Heilman, P.E. Coastal Engineer Shiner Moseley & Associates., Inc. 555 N. Carancahua Corpus Christi,
USE OF SEGMENTED OFFSHORE BREAKWATERS FOR BEACH EROSION CONTROL
 .. CETN-III-22 4/84 PURPOSE: USE OF SEGMENTED OFFSHORE BREAKWATERS FOR BEACH EROSION CONTROL To provide information on the functional application of and general design considerations for using offshore
ALTERNATIVES FOR COASTAL STORM DAMAGE MITIGATION
 ALTERNATIVES FOR COASTAL STORM DAMAGE MITIGATION Dave Basco Old Dominion University, Norfolk, Virginia, USA National Park Service Photo STRUCTURAL (changes to natural, physical system) hardening (seawalls,
A REVIEW OF THE CONDITION OF THE MUNICIPAL BEACHES AS A RESULT OF HURRICANE SANDY IN THE BOROUGH OF STONE HARBOR, CAPE MAY COUNTY, NEW JERSEY
 A REVIEW OF THE CONDITION OF THE MUNICIPAL BEACHES AS A RESULT OF HURRICANE SANDY IN THE BOROUGH OF STONE HARBOR, CAPE MAY COUNTY, NEW JERSEY View along the dune scarp from 103 rd Street on October 31,
RE: Hurricane Matthew Beach Damage Assessment and Recommendations [CSE 2416]
![RE: Hurricane Matthew Beach Damage Assessment and Recommendations [CSE 2416]](/thumbs/83/87675702.jpg "RE: Hurricane Matthew Beach Damage Assessment and Recommendations [CSE 2416]") October 25, 2016 Iris Hill Town Administrator Town of Edisto Beach 2414 Murray St Edisto Beach SC 29438 RE: Hurricane Matthew Beach Damage Assessment and Recommendations [CSE 2416] Dear Iris, Hurricane
October 25, 2016 Iris Hill Town Administrator Town of Edisto Beach 2414 Murray St Edisto Beach SC 29438 RE: Hurricane Matthew Beach Damage Assessment and Recommendations [CSE 2416] Dear Iris, Hurricane
Figure79. Location map for the 10 NJBPN profile sites in Atlantic County, NJ 155
 154 Figure79. Location map for the 10 NJBPN profile sites in Atlantic County, NJ 155 ATLANTIC COUNTY SPRING 2009 to FALL 2010 The Atlantic County coastline consists of three barrier islands. Between Little
Atlantic Coast of Long Island, Jones Inlet to East Rockaway Inlet, Long Beach Island, NY Construction Update
 Atlantic Coast of Long Island, Jones Inlet to East Rockaway Inlet, Long Beach Island, NY Construction Update June 2016 US Army Corps of Engineers Project Purpose Three specific damage mechanisms of coastal
SPECIAL SPRING 2018 STORM REPORT ON THE CONDITION OF THE MUNICIPAL BEACHES FOR THE BOROUGH OF STONE HARBOR, CAPE MAY COUNTY, NEW JERSEY
 SPECIAL SPRING 2018 STORM REPORT ON THE CONDITION OF THE MUNICIPAL BEACHES FOR THE BOROUGH OF STONE HARBOR, CAPE MAY COUNTY, NEW JERSEY Aerial photograph taken April 21, 2018 showing the view up the beach
General Coastal Notes + Landforms! 1
 General Coastal Notes + Landforms! 1 Types of Coastlines: Type Description Primary Coast which is essentially in the same condition when sea level stabilized Coastline after the last ice age, younger.
Shorelines Earth - Chapter 20 Stan Hatfield Southwestern Illinois College
 Shorelines Earth - Chapter 20 Stan Hatfield Southwestern Illinois College The Shoreline A Dynamic Interface The shoreline is a dynamic interface (common boundary) among air, land, and the ocean. The shoreline
INTRODUCTION TO COASTAL ENGINEERING
 The University of the West Indies Organization of American States PROFESSIONAL DEVELOPMENT PROGRAMME: COASTAL INFRASTRUCTURE DESIGN, CONSTRUCTION AND MAINTENANCE A COURSE IN COASTAL DEFENSE SYSTEMS I CHAPTER
Julebæk Strand. Effect full beach nourishment
 Julebæk Strand Effect full beach nourishment Aim of Study This study is a part of the COADAPT funding and the aim of the study is to analyze the effect of beach nourishment. In order to investigate the
COASTAL ENVIRONMENTS. 454 lecture 12
 COASTAL ENVIRONMENTS Repeated movement of sediment & water constructs a beach profile reflecting the balance between average daily or seasonal wave forces and resistance of landmass to wave action Coasts
Shoreline Studies Program, Department of Physical Sciences, VIMS
 Living Shoreline Training Class 2017 1 Demonstration sites discussed in this talk. 2 A shoreline management plan for the entire creek made conceptual shoreline management recommendations along every stretch
ALTERNATIVES FOR COASTAL STORM DAMAGE MITIGATION AND FUNCTIONAL DESIGN OF COASTAL STRUCTURES
 The University of the West Indies Organization of American States PROFESSIONAL DEVELOPMENT PROGRAMME: COASTAL INFRASTRUCTURE DESIGN, CONSTRUCTION AND MAINTENANCE A COURSE IN COASTAL DEFENSE SYSTEMS I CHAPTER
Nearshore Dredged Material Placement Pilot Study at Noyo Harbor, CA
 1 Nearshore Dredged Material Placement Pilot Study at Noyo Harbor, CA Noyo Cove N 2011 National Conference on Beach Preservation Technology 9-11, February 2011 Lihwa Lin, Honghai Li, Mitchell Brown US
Currents measurements in the coast of Montevideo, Uruguay
 Currents measurements in the coast of Montevideo, Uruguay M. Fossati, D. Bellón, E. Lorenzo & I. Piedra-Cueva Fluid Mechanics and Environmental Engineering Institute (IMFIA), School of Engineering, Research
BEACH PROCESSES AND COASTAL ENVIRONMENTS
 BEACH PROCESSES AND COASTAL ENVIRONMENTS COASTAL FEATURES Cross section Map view TOPICS: Terminology Waves Beach Morphology Barriers Coastal Migration Tides Tidal Flats and Marshes Sediment Budgets Human
Chapter 4 EM THE COASTAL ENGINEERING MANUAL (Part I) 1 August 2008 (Change 2) Table of Contents. Page. I-4-1. Background...
 1 August 2008 (Change 2) Table of Contents. Page. I-4-1. Background...") Chapter 4 EM 1110-2-1100 THE COASTAL ENGINEERING MANUAL (Part I) 1 August 2008 (Change 2) Table of Contents I-4-1. Background... Page I-4-1 a. Shore Protection Planning and Design, TR 4... I-4-1 b. Shore
Chapter 4 EM 1110-2-1100 THE COASTAL ENGINEERING MANUAL (Part I) 1 August 2008 (Change 2) Table of Contents I-4-1. Background... Page I-4-1 a. Shore Protection Planning and Design, TR 4... I-4-1 b. Shore
EVALUATION OF BEACH EROSION UP-DRIFT OF TIDAL INLETS IN SOUTHWEST AND CENTRAL FLORIDA, USA. Mohamed A. Dabees 1 and Brett D.
 EVALUATION OF BEACH EROSION UP-DRIFT OF TIDAL INLETS IN SOUTHWEST AND CENTRAL FLORIDA, USA Mohamed A. Dabees 1 and Brett D. Moore 1 The paper discusses the analysis of up-drift beach erosion near selected
CMS Modeling of the North Coast of Puerto Rico
 CMS Modeling of the North Coast of Puerto Rico PRESENTED BY: Dr. Kelly Rankin Legault, Ph.D., P.E. 1 Dr. Alfredo Torruella, Ph.D. 2 1 USACE Jacksonville District 2 University of Puerto Rico October 2016
Inlet Management Study for Pass-A-Grille and Bunces Pass, Pinellas County, Florida
 Inlet Management Study for Pass-A-Grille and Bunces Pass, Pinellas County, Florida Final Report Submitted By Ping Wang, Ph.D., Jun Cheng Ph.D., Zachary Westfall, and Mathieu Vallee Coastal Research Laboratory
Chapter 10 Lecture Outline. The Restless Oceans
 Chapter 10 Lecture Outline The Restless Oceans Focus Question 10.1 How does the Coriolis effect influence ocean currents? The Ocean s Surface Circulation Ocean currents Masses of water that flow from one
Evaluation of June 9, 2014 Federal Emergency Management Agency Flood Insurance Study for Town of Weymouth, Norfolk, Co, MA
 Evaluation of June 9, 2014 Federal Emergency Management Agency Flood Insurance Study for Town of Weymouth, Norfolk, Co, MA Prepared For: Woodard & Curran 95 Cedar Street, Suite 100 Providence, RI 02903
BEACH NOURISHMENT COMBINED WITH SIC VERTICAL DRAIN IN MALAYSIA. Claus Brøgger 1 and Poul Jakobsen 2
 BEACH NOURISHMENT COMBINED WITH SIC VERTICAL DRAIN IN MALAYSIA. Claus Brøgger 1 and Poul Jakobsen 2 The present paper presents measurements and results from a three year full scale Pilot Project with the
VIMS CCRM Coastal Management Decision Tools. Decision Tree for Undefended Shorelines and Those with Failed Structures
 VIMS CCRM Coastal Management Decision Tools Decision Tree for Undefended Shorelines and Those with Failed Structures Center for Coastal Resources Management Virginia Institute of Marine Science Gloucester
SORTING AND SELECTIVE MOVEMENT OF SEDIMENT ON COAST WITH STEEP SLOPE- MASUREMENTS AND PREDICTION
 SORTING AND SELECTIVE MOVEMENT OF SEDIMENT ON COAST WITH STEEP SLOPE- MASUREMENTS AND PREDICTION Toshiro San-nami 1, Takaaki Uda 2, Masumi Serizawa 1 and Toshinori Ishikawa 2 Conveyer belts carrying gravel
Advanced Series on Ocean Engineering - Volume 14 COASTAL STABILIZATION. Richard Silvester John R C Hsu. \v? World Scientific
 Advanced Series on Ocean Engineering - Volume 14 COASTAL STABILIZATION Richard Silvester John R C Hsu \v? World Scientific Contents PREFACE xv 1 INTRODUCTION 1 /. / Coastal Environment 2 J.2 State of Beach
Low-crested offshore breakwaters: a functional tool for beach management
 Environmental Problems in Coastal Regions VI 237 Low-crested offshore breakwaters: a functional tool for beach management K. Spyropoulos & E. Andrianis TRITON Consulting Engineers, Greece Abstract Beach
Chapter. The Dynamic Ocean
 Chapter The Dynamic Ocean An ocean current is the mass of ocean water that flows from one place to another. 16.1 The Composition of Seawater Surface Circulation Surface Currents Surface currents are movements
An Update of Coastal Erosion in Puerto Rico
 Jack Morelock and Maritza Barreto An Update of Coastal Erosion in Puerto Rico Department of Marine Sciences, University of Puerto Rico at Mayagüez and Geography Department, University of Puerto Rico at
Oceans and Coasts. Chapter 18
 Oceans and Coasts Chapter 18 Exploring the oceans The ocean floor Sediments thicken and the age of the seafloor increases from ridge to shore The continental shelf off the northeast United States Constituent
New Jersey Beach Profile Network Atlantic County Profile Site Locations
 215 RICHARD STOCKTON COLLEGE OF NEW JERSEY New Jersey Beach Profile Network Atlantic County Profile Site Locations COASTAL RESEARCH CENTER Figure 128 There are nine NJBPN survey sites on the Atlantic County
/50. Physical Geology Shorelines
 Physical Geology Shorelines Multiple Guess: (You know the drill 2 points each) 1. The path of movement of a water particle in a wave at sea is 1. circular 2. horizontal 3. vertical 4. elliptical 5. none
April 7, Prepared for: The Caribbean Disaster Emergency Response Agency Prepared by: CEAC Solutions Co. Ltd.
 April 7, 2006 Prepared for: The Caribbean Disaster Emergency Response Agency Prepared by: Introduction CEAC Solutions Co. Ltd was commissioned in May 2005 to prepare coastal beach erosion hazard maps for
DUNE STABILIZATION AND BEACH EROSION
 DUNE STABILIZATION AND BEACH EROSION CAPE HATTERAS NATIONAL SEASHORE NORTH CAROLINA ROBERT DOLAN PAUL GODFREY U. S. DEPARTMENT OF INTERIOR NATIONAL PARK SERVICE OFFICE OF NATURAL SCIENCE WASHINGTON, D.
To: William Woods, Jenni Austin Job No: CentrePort Harbour Deepening Project - Comments on community queries
 Memo To: William Woods, Jenni Austin From: Richard Reinen-Hamill Date: Subject: cc: 1 Purpose This memo sets out our response to issues raised at and after Seatoun community consultation sessions held
Prediction of Nearshore Waves and Currents: Model Sensitivity, Confidence and Assimilation
 Prediction of Nearshore Waves and Currents: Model Sensitivity, Confidence and Assimilation H. Tuba Özkan-Haller College of Oceanic and Atmospheric Sciences Oregon State University, 104 Ocean Admin Bldg
4/20/17. #30 - Coastlines - General Principles Coastlines - Overview
 Writing Assignment Due one week from today by 11:59 pm See main class web pages for detailed instructions Essays will be submitted in Illinois Compass (instructions later) Pick one: Earthquakes, tsunamis,
Coastal Engineering 57 (2010) Contents lists available at ScienceDirect. Coastal Engineering
 Contents lists available at ScienceDirect. Coastal Engineering") Coastal Engineering 57 (2010) 203 212 Contents lists available at ScienceDirect Coastal Engineering journal homepage: www.elsevier.com/locate/coastaleng Design and performance of headland bays in Chesapeake
Coastal Engineering 57 (2010) 203 212 Contents lists available at ScienceDirect Coastal Engineering journal homepage: www.elsevier.com/locate/coastaleng Design and performance of headland bays in Chesapeake
Undertow - Zonation of Flow in Broken Wave Bores
 Nearshore Circulation Undertow and Rip Cells Undertow - Zonation of Flow in Broken Wave Bores In the wave breaking process, the landward transfer of water, associated with bore and surface roller decay
SELECTION OF THE PREFERRED MANAGEMENT OPTION FOR STOCKTON BEACH APPLICATION OF 2D COASTAL PROCESSES MODELLING
 SELECTION OF THE PREFERRED MANAGEMENT OPTION FOR STOCKTON BEACH APPLICATION OF 2D COASTAL PROCESSES MODELLING C Allery 1 1 DHI Water and Environment, Sydney, NSW Abstract This paper presents an approach
STORM RESPONSE SIMULATION
 APPENDIX V STORM RESPONSE SIMULATION Final Environmental Impact Statement Village of Bald Head Island Shoreline Protection Project Brunswick County, North Carolina Delft3D Storm Response Simulations With
2013 ANNUAL REPORT - TO THE CITY OF NORTH WILDWOOD ON THE CONDITION OF THE CITY BEACHES
 2013 ANNUAL REPORT - TO THE CITY OF NORTH WILDWOOD ON THE CONDITION OF THE CITY BEACHES View on June 18, 2013 from the 2 nd Avenue jetty looking south while the 2013 beach nourishment project was under
Comparison of Predicted and Measured Shoaling at Morro Bay Harbor Entrance, California
 Comparison of Predicted and Measured Shoaling at Morro Bay Harbor Entrance, California by Edward F. Thompson, Inocencio P. DiRamos, and Robert R. Bottin, Jr. PURPOSE: This Coastal and Hydraulics Engineering
Jimmy s beach preliminary results
 Jimmy s beach preliminary results LP 668979 Jimmy s Beach Restoration Society 1 Outline 1. Long term: GIS analyses. Aerial photos, charts Shoreline analyses Storm data from MHL/DECC 2. Medium term: morphologic
Beach profile surveys and morphological change, Otago Harbour entrance to Karitane May 2014 to June 2015
 Beach profile surveys and morphological change, Otago Harbour entrance to Karitane May 2014 to June 2015 Prepared for Port Otago Ltd Martin Single September 2015 Shore Processes and Management Ltd Contact
Lecture Outlines PowerPoint. Chapter 15 Earth Science, 12e Tarbuck/Lutgens
 Lecture Outlines PowerPoint Chapter 15 Earth Science, 12e Tarbuck/Lutgens 2009 Pearson Prentice Hall This work is protected by United States copyright laws and is provided solely for the use of instructors
Delaware Chapter Surfrider Foundation - Indian River Inlet Monitoring
 Delaware Chapter Surfrider Foundation - Indian River Inlet Monitoring In 2012, the Delaware Surfrider Foundation Chapter formed the Surf Quality and Access Committee to focus on issues such as surf spot
Performance of Upham Beach T-Groin Project and Its Impact to the Downdrift Beach
 Performance of Upham Beach T-Groin Project and Its Impact to the Downdrift Beach Progress Report for the Period of October 2008 to April 2009 Submitted by Ping Wang, Ph.D., and Tiffany M. Roberts Department
2014 ANNUAL REPORT - TO THE CITY OF NORTH WILDWOOD ON THE CONDITION OF THE CITY BEACHES
 2014 ANNUAL REPORT - TO THE CITY OF NORTH WILDWOOD ON THE CONDITION OF THE CITY BEACHES View on September 25, 2014 looking northwest into Hereford Inlet. Considerable southerly expansion of the tip of
page - Laboratory Exercise #5 Shoreline Processes
 page - Laboratory Exercise #5 Shoreline Processes Section A Shoreline Processes: Overview of Waves The ocean s surface is influenced by three types of motion (waves, tides and surface currents). Shorelines
Technical Brief - Wave Uprush Analysis 129 South Street, Gananoque
 Technical Brief - Wave Uprush Analysis 129 South Street, Gananoque RIGGS ENGINEERING LTD. 1240 Commissioners Road West Suite 205 London, Ontario N6K 1C7 June 12, 2013 Table of Contents Section Page Table
INTRODUCTION TO COASTAL ENGINEERING AND MANAGEMENT
 Advanced Series on Ocean Engineering Volume 16 INTRODUCTION TO COASTAL ENGINEERING AND MANAGEMENT J. William Kamphuis Queen's University, Canada World Scientific Singapore New Jersey London Hong Kong Contents
Beach Wizard: Development of an Operational Nowcast, Short-Term Forecast System for Nearshore Hydrodynamics and Bathymetric Evolution
 Beach Wizard: Development of an Operational Nowcast, Short-Term Forecast System for Nearshore Hydrodynamics and Bathymetric Evolution Ad Reniers Civil Engineering and Geosciences, Delft University of Technology
Undertow - Zonation of Flow in Broken Wave Bores
 Lecture 22 Nearshore Circulation Undertow - Zonation of Flow in Broken Wave Bores In the wave breaking process, the landward transfer of water, associated with bore and surface roller decay within the
First Year Morphological Evolution of an Artificial Berm at Fort Myers Beach, Florida
 University of South Florida Scholar Commons Geology Faculty Publications Geology 1-2012 First Year Morphological Evolution of an Artificial Berm at Fort Myers Beach, Florida Katherine Brutsche University
Tangier Island, Virginia. Shoreline Management Plan for the West Coast of the Uppards
 Tangier Island, Virginia Shoreline Management Plan for the West Coast of the Uppards Shoreline Studies Program Department of Physical Sciences Virginia Institute of Marine Science College of William &
Chapter 15 SEASONAL CHANGES IN BEACHES OP THE NORTH ATLANTIC COAST OF THE UNITED STATES
 Chapter 15 SEASONAL CHANGES IN BEACHES OP THE NORTH ATLANTIC COAST OF THE UNITED STATES By John M. Darling Hydraulic Engineer, Research Division U. S. Army Coastal Engineering Research Center Corps of
North Shore of Long Island, Feasibility Study
 North Shore of Long Island, Asharoken New York Asharoken, Feasibility Study Asharoken, NY Public Meeting June 30, 2015 US Army Corps of Engineers US Army Corps of Engineers New York BUILDING STRONG BUILDING
Beach Restoration in Okaloosa and Walton Counties. FSBPA Technology Conference Clearwater, FL
 Beach Restoration in Okaloosa and Walton Counties FSBPA Technology Conference Clearwater, FL Presented by: Duncan Greer, E.I. February 5, 2015 PRESENTATION OUTLINE 1. Overview of Project Locations 2. Eglin
Chapter 11. Beach Fill and Soft Engineering Structures
 Chapter 11 Beach Fill and Soft Engineering Structures Solutions to Coastal Erosion Soft Structures Hard Structures Retreat No such thing as low cost coastal protection Beach Nourishment Beach Filling Beach
Australian Coastal Councils Conference
 Australian Coastal Councils Conference Kiama March 2019 Where Has My Beach Gone? (and what can I do about it?) Dr Andrew McCowan Water Technology Where Has My Beach Gone? Where Has My Beach Gone? Where
SACO RIVER AND CAMP ELLIS BEACH SACO, MAINE SECTION 111 SHORE DAMAGE MITIGATION PROJECT APPENDIX F ECONOMIC ASSESSMENT
 SACO RIVER AND CAMP ELLIS BEACH SACO, MAINE SECTION 111 SHORE DAMAGE MITIGATION PROJECT APPENDIX F ECONOMIC ASSESSMENT Department of the Army New England District, Corps of Engineers 696 Virginia Road
MIAMI BEACH 32ND STREET HOT SPOT: NUMERICAL MODELING AND DESIGN OPTIMIZATION. Adam Shah - Coastal Engineer Harvey Sasso P.E.
 ABSTRACT MIAMI BEACH 32ND STREET HOT SPOT: NUMERICAL MODELING AND DESIGN OPTIMIZATION Adam Shah - Coastal Engineer Harvey Sasso P.E. - Principal Coastal Systems International, Inc. 464 South Dixie Highway
Nearshore Morphodynamics. Bars and Nearshore Bathymetry. Sediment packages parallel to shore, that store beach sediment
 Nearshore Morphodynamics http://coastal.er.usgs.gov/bier/images/chandeleur-xbeach-lg.jpg Bars and Nearshore Bathymetry Sediment packages parallel to shore, that store beach sediment Can be up to 50 km
Impact of Dredging the Lower Narrow River on Circulation and Flushing
 Impact of Dredging the Lower Narrow River on Circulation and Flushing Craig Swanson Ph.D. Swanson Environmental Alex Shaw Ocean Engineering, URI Prof. Malcolm L. Spaulding Ocean Engineering, URI 29 January
A brief history of headland breakwaters for shore protection in Chesapeake Bay, USA
 A brief history of headland breakwaters for shore protection in Chesapeake Bay, USA By C. Scott Hardaway Jr. Coastal Geologist, Virginia Institute of Marine Science P.O. Box 1346, Gloucester Point, VA,
HARBOUR SEDIMENTATION - COMPARISON WITH MODEL
 HARBOUR SEDIMENTATION - COMPARISON WITH MODEL ABSTRACT A mobile-bed model study of Pointe Sapin Harbour, in the Gulf of St. Lawrence, resulted in construction of a detached breakwater and sand trap to
Assateague Island National Seashore North End Restoration Project Timeline
 Assateague Island National Seashore North End Restoration Project Timeline Date Event Some information provided in the Project Introduction document. Detailed events are available in a timeline compiled
CHAPTER 134 INTRODUCTION
 CHAPTER 134 NEW JETTIES FOR TUNG-KANG FISHING HARBOR, TAIWAN Chi-Fu Su Manager Engineering Department Taiwan Fisheries Consultants, Inc. Taipei, Taiwan INTRODUCTION Tung-Kang Fishing Harbor, which is about
Figure 106. Locations of the 28 NJBPN profile stations in Ocean County, NJ.
 130 Figure 106. Locations of the 28 NJBPN profile stations in Ocean County, NJ. 131 2016-2017 Beach Fills in Ocean County: The federal/state/local storm damage reduction project (beachfill) between Manasquan
OCEAN WAVES NAME. I. Introduction
 NAME OCEAN WAVES I. Introduction The physical definition of a wave is a disturbance that transmits energy from one place to another. In the open ocean waves are formed when wis blowing across the water
Coasts. 1. Coastal Processes. 1.1 Coastal erosion. 1.2 Sediment transport. Coastal Processes and Landforms. i. Hydraulic action
 Coasts Coastal Processes and Landforms 1. Coastal Processes 1.1 Coastal erosion i. Hydraulic action When waves strike against a rock surface, the waves trap air in the rock joints. This air is compressed
CHAPTER 179. Performance of a Submerged Breakwater for Shore Protection
 CHAPTER 179 Abstract Performance of a Submerged Breakwater for Shore Protection Albert E. Browder',A. Member, ASCE; Robert G. Dean 2, Member, ASCE; and Renjie Chen 3 A summary is presented of the results
Figure 262. Location map for the 10 NJBPN profile sites in Atlantic County, NJ 279
 278 Figure 262. Location map for the 10 NJBPN profile sites in Atlantic County, NJ 279 ATLANTIC COUNTY SUMMARY The Atlantic County coastline consists of three barrier islands. The island of Little Beach
Technical Brief - Wave Uprush Analysis Island Harbour Club, Gananoque, Ontario
 Technical Brief - Wave Uprush Analysis RIGGS ENGINEERING LTD. 1240 Commissioners Road West Suite 205 London, Ontario N6K 1C7 October 31, 2014 Table of Contents Section Page Table of Contents... i List
EROSION MECHANICS OF A CARBONATE- TOMBOLO BEACH IN MIYAKOJIMA ISLAND, OKINAWA PREFECTURE, JAPAN.
 EROSION MECHANICS OF A CARBONATE- TOMBOLO BEACH IN MIYAKOJIMA ISLAND, OKINAWA PREFECTURE, JAPAN. Ryuichiro NISHI 1, Takaaki UDA 2, Akio KIKUCHI 3 and Kou FURUIKE 4 1) Associate Prof. Dept. of Ocean Civil