St. Francis Bay Beach Long- Term Coastal Protection Phase 2
|
|
|
- Neal Peters
- 5 years ago
- Views:
Transcription


1 St. Francis Bay Beach Long- Term Coastal Protection Phase 2 22/02/ Allen Drive Loevenstein Cape Town 7530 South Africa C PMT-PRE
2 Synopsis This report documents the preliminary design undertaken as part of the St. Francis Bay Beach Long-Term project. Disclaimer This report has been prepared on behalf of and for the exclusive use of St Francis Property Owners, and is subject to and issued in accordance with the agreement between St Francis Property Owners and Advisian. Advisian accepts no liability or responsibility whatsoever for it in respect of any use of or reliance upon this report by any third party. Copying this report without the permission of St Francis Property Owners and Advisian is not permitted. Project No: C PMT-PRE-0001 : Rev Description Author Review Advisian Approval Date 00 Draft Report SR/ GR FS GM 18/01/08 01 Final Report GR FS GM 18/02/22 Advisian ii
3 Table of Contents Executive Summary... xi 1 Introduction Project Location and Background Scope of Work (Phase 2) Report Structure Basis of Design Units Chart Datum Reference Coordinate System Design Life Design standards Site Characterisation Bathymetry Beach Profiles Surveys undertaken Profile variations over time Spit retreat Beach profile characteristics Beach Sand Grain Size Water Levels Tidal Levels Storm Surge Sea Level Rise Advisian iii
4 3.4.4 Extreme Water Levels Design Water Levels Offshore winds Offshore waves Coastal Processes Modelling Wave Modelling Model Set-up and Approach Nearshore Wave Climate Extreme Waves Design Waves Storm Induced Beach Erosion SBEACH Software Model Input Parameters Input beach profile Input storm events Estimated short term erosion Long Term Shoreline Modelling Modelling Suite Description Modelling Setup Shoreline Evolution Results ( ) Conceptual Options Option 1: Beach Nourishment Depth of Closure Nourishment Beach Profile Volume of Nourishment Advisian iv
5 5.1.4 Summary Option 2: Groyne Field and Nourishment Methodology Layout Dimensions Summary Option 3: Detached Breakwaters and Nourishment Methodology Layout Dimensions Summary Alternative Beach Nourishment Options: Headland Structures and Nourishment Methodology Option 1A Option 1B Summary Options Comparison Cost comparison and Schedule Advantages and Disadvantages Workshop Recommendation & Preferred Option Preliminary Design Beach nourishment General Layout Rock Groynes Armour Stability Section at -2 m CD Advisian v
6 6.4.2 Section at -1 m CD Section at 0 m CD Toe and apron stability Estimated Quantities Cost Estimates Construction Duration The Way Forward References Figure List Figure 1: Locality Map St. Francis Bay... 1 Figure 2: Time-line of St. Francis Bay historic reports... 2 Figure 3: Location of revetment upgrade (PRDW, 2015)... 3 Figure 4: Existing shoreline protection along St Francis Bay (PRDW, 2015)... 4 Figure 5: Bathymetric Chart showing the survey run-lines (ASR, 2006) Figure 6: Location of beach surveys Figure 7: Horizontal movement of elevation contours at Profile 26 from 2006 to Figure 8: Horizontal movement of elevation contours at Profile 4 from 2006 to Figure 9: Spit retreat Figure 10: Measured water level at Port Elizabeth. Source: UHSLC (2017) Figure 11: Predicted tide, measured water level and residual water level at Port Elizabeth Figure 12: Probability plot of residual water level Figure 13: Time series of the projected global mean sea level for scenario RCP4.5 and the contributions made to the global mean sea level by various sources. Source: (IPCC, 2013) Figure 14: Wind sources location map Figure 15: NWW3 Wind 1 Annual wind rose Advisian vi
7 Figure 16: Wave sources location map Figure 17: NWW3 Wave 1 Annual significant wave height rose (top) and annual peak wave period rose (bottom) Figure 18: Extent of the computational domain for the nested wave model used for St Francis Bay Figure 19: Extreme wave condition illustrating sheltering effects of Cape St Francis at St Francis Bay Figure 20: Simulated wave conditions for the strongest easterly wind and swell conditions - Offshore swell: H S = 7.5m, T P = 12s, Direction = 90 N and winds: WS = 22.0m/s, Direction = 67.5 N along St Francis Bay Figure 21: Simulated wave conditions for the strongest westerly wind conditions and easterly swell conditions - Offshore swell: H S = 7.5m, T P = 12s, Direction = 90 N and winds: WS = 26.5m/s, Direction = 270 N along St Francis Bay Figure 22: Simulated wave conditions for the strongest easterly wind condition and south-westerly swell conditions - Offshore swell: H S = 11.5m, T P = 15.6s, Direction = N and winds: WS = 22m/s, Direction = 67.5 N along St Francis Bay Figure 23: Simulated wave conditions for the strongest westerly wind condition and south-westerly swell conditions - Offshore swell: H S = 11.5m, T P = 15.6s, Direction = N and winds: WS = 26.5m/s, Direction = 270 N along St Francis Bay Figure 24: Annual wave rose at Point 1, -10 m CD Figure 25: Comparison of measured and modelled beach erosion due to October 2009 storm event Figure 26: Initial pre-storm profile utilized in SBEACH simulations Figure 27: Dean's equilibrium profile shape definition sketch (Source: 36 Figure 28: Joint Probability Curves for extreme significant wave heights and high water levels Figure 29: 100 year ARI simulated erosion: High Hs at low WL vs low Hs at high WL Figure 30: Storm duration of selected storms Figure 31: SBEACH storm erosion results (with and without SLR) Figure 32: Location map of the local wave conditions extracted for shoreline modelling at St Francis Bay Advisian vii
8 Figure 33: Location map of the UNIBEST-CL reference line, initial coastline and computational grid for the shoreline model of St Francis Bay Figure 34: Location map of the UNIBEST-CL rock revetments for the shoreline model of St Francis Bay Figure 35: Simulated shorelines along St. Francis Bay for the considered simulation period ( ) Figure 36: Beach nourishment (Source: 47 Figure 37: Beach nourishment conceptual option Figure 38: Design nourishment beach profile Figure 39: Non-intersecting profiles (Dean, 1991) Figure 40: Groyne conceptual layout Figure 41: Definition sketch of groyne key variables. Source: (USACE, 2002) Figure 42: Detached breakwater conceptual layout Figure 43: Definition sketch of nearshore breakwater key variables. Source: (USACE, 2002) Figure 44: Headland and beach nourishment layout options Figure 45: Definition sketch of artificial headland system. Source: (USACE, 2002) Figure 46: Headlands conceptual layout Option 1A Figure 47: Headlands conceptual layout Option 1B Figure 48: Staged implementation of Headlands Option 1B Figure 49: Revised staged solution Figure 50: General Layout Plan (Appendix A) Figure 51: Groyne Section A Figure 52: Groyne Section B Figure 53: Groyne Section C Table List Table 1: Beach Profile Surveys undertaken from 2006 to 2015 and Advisian viii
9 Table 2: Tidal Levels (in meters CD) of Port Elizabeth (The SA Navy Hydrographer, 2017) Table 3: Principal tidal constituents (Judith Bosboom, 2012) Table 4: Extreme storm surge based on Port Elizabeth tidal levels Table 5: Extreme Water Levels Table 6: Sources of wind data Table 7: Summary of the wind data extracted Table 8: NWW3 Wind 1 Annual wind speed wind direction frequency table Table 9: Sources of wave data Table 10: Detailed information of the wave data extracted Table 11: NWW3 Wave 1 Annual frequency tables. T P MWD frequency table (top), H m0 MWD frequency table (middle) and H m0 T P frequency table (bottom) Table 12: Delft3D-WAVE computational grid details Table 13: Simulated conditions Table 14: Extreme significant wave height estimates (m) and associated 95% confidence intervals for Point 1* Table 15: Extreme wave conditions (100 year ARI) based on depth-limited conditions Table 16: Selected peak storm conditions for SBEACH simulations Table 17: Representative water level conditions for UNIBEST-LT model Table 18: Conceptual Options Table 19: Estimated Volume of nourishment required Table 20: Definition of groyne key variables Table 21: Definition of nearshore breakwater key variables Table 22: Input and output parameters for the detached breakwater solution Table 23: Cost and schedule comparison Table 24: Summary of advantages/disadvantages for each option Advisian ix
10 Table 25: Rock armour design parameters Section at -2.0 m CD Table 26: Rock armour design parameters Section at -1.0mCD Table 27: Rock armour design parameters Section at -1.0 m CD Table 28: Estimated quantities Table 29: Cost Estimate Table 30: Estimated Construction Duration Appendix List Appendix A Appendix B Appendix C Appendix D Appendix E Drawings Offshore Hind-cast Analysis Nearshore Wave Analysis UNIBEST Modelling Software Beach Profile Analysis Advisian x
11 Executive Summary The sandy beach at St. Francis Bay has suffered from significant erosion events over the past few decades. This has effectively reduced the beach width and impacted on the recreational amenity of the area, as well as threatened backshore infrastructure. The 700 m long unprotected spit area has suffered even more aggressive erosion, with consequent loss of considerable sand material in the dune, and may be subject to a breach if not provided with some level of protection. In 2014 WorleyParsons undertook a review of various studies and interventions undertaken in the past and compiled an updated review report, inclusive of indicative cost and time lines for possible remedial solutions to the erosion problem. During 2015 PRDW produced a design report for the maintenance and upgrade of rock revetments to protect ten privately owned properties and a design report for the maintenance and upgrade of the rest of the St Francis Bay shoreline. Environmental authorisation was received during 2016 for the maintenance and upgrade of existing rock revetments and sandy beach backshore areas at Erven 720, 623, 2257, 185, 53, 184 and 625 along the coastline. This work was undertaken as Phase 1 of a 2-Phased approach to protect the coastline. Advisian have been appointed by the St Francis Property Owners (SFPO) for the design and construction supervision of the second phase of the long term coastal protection and sand retention structures for St Francis Bay. This preliminary design report presents An analysis of the available data, in particular beach surveys, to be considered in the design; The Phase 2 design basis; Wave, cross-shore transport and long-term shoreline modelling undertaken to assist in schemes assessments; The conceptual schemes developed for consideration; The preferred scheme as agreed by the SFPO and all other participants in the workshop held on 29/11/2017; The preliminary design of the preferred scheme, including plan layout and cross-sections; The cost estimate for the preferred scheme; and Scheme phasing options so as to align with the preferred approach of the SFPO. Site Characterization Bathymetry Limited bathymetric data was available during the preliminary design stage. Based on the available data, the nearshore sea bed slope (200 to 300m from the coastline) varies between approximately between 1 in 40 and 1 in 70. Advisian xi
12 Beach Profiles The St Francis Bay beach had been surveyed fairly often over the last 20 years. Survey data 2006 to 2017 were made available and analysed. The short term back and forth movement of beach over the last 10 years is approximately 15 m. The long term shoreline retreat is along the mid- and northern stretch of coastline is between 1.5 to 3.0 m per year. Along the southern end of the beach, slow long term rate of accretion is observed. Water levels The tidal planes provided at Port Elizabeth were adopted in the design. The storm surge was estimated by calculating the residual water levels from the hourly tidal measurements at Port Elizabeth and undertaking an extreme value analysis. Sea level rise (SLR) over the 50 year design life is 0.26 m. The extreme design water level, adopted for the coastal structures is 2.92 m CD, which is the sum of Mean High Water Spring, 100 year ARI storm surge and SLR. Offshore Winds and Waves Offshore wind and wave data was sourced from the National Centers for Environmental Prediction (NCEP) WaveWatch III (WW3) global model and the NCEP Global Data Assimilation System (GDAS) Climate Forecast System Reanalysis (CFSR). The principal wave direction at the offshore data points is from the southwestern sector with an approximate occurrence of around 60% of the time. The maximum significant wave height is between 11 and 12 m with an associated peak wave period ranging between 12 and 19 s. The average significant wave height is about 3.5 m and the average peak wave period is around 11 s The offshore wind and wave data sets are presented as annual wind and wave roses with their associated frequency tables in Appendix B. Coastal Processes Modelling Wave Modelling Offshore waves were transformed to nearshore using the Delft3D modelling suite. The dominant wave direction along the shoreline is from the south and south-east with a smaller component approaching the shoreline from the east. The average significant wave height, estimated over the last 17 years at -10 m CD, is around 1 m. The maximum significant wave height in the simulated time series along the -10 m CD depth contour is 4.5 m. An extreme value analysis (EVA) was undertaken for the data sets to determine the extreme wave conditions for various average return intervals (ARI) at -10 m CD. However, the design wave conditions were based on depth limited conditions and shown in section Advisian xii
 ranges between 5 and 15 m.")
13 Storm Induced Beach Erosion The short term storm induced erosion for established extreme events were estimated with SBEACH software. The input beach profile was based on the present characteristics of the beach. If SLR is not considered, the estimated recession of the beach crest (+3.8 m CD) ranges between 5 and 15 m. However, with SLR over 50 years, the recession increases to between 15 and 25 m with over wash of sediment reaching almost 40 m landward. Long Term Shoreline Modelling A shoreline evolution assessment was undertaken with UNIBEST modelling software to derive the initial changes in the shoreline position due to the estimated annual nearshore wave conditions in combination with the existing rock revetments, and to test shoreline response to the preferred option (Section 6) for the long term coastal protection and sand retention structures. The model was calibrated to sufficiently represent the historical shoreline changes due to i) the reduction of available sand supply (damming of the Kromme River and stabilization of Santereme dunes) over the past decades and ii) the effect of the constructed rock revetments. Conceptual Options The following three options from the WorleyParsons 2014 report were selected by the SFPO for further investigation during the project inception are presented in Section 5 (also illustrated in the figure below): 1. Beach nourishment Advisian xiii
14 The net long term coastline retreat was found to be relatively gradual over most of the coastal frontage (approx. 1m-3m/year). Based on international experience an intervention of beach nourishment to restore the historical wider beach would be considered a feasible solution. This option, which obviates the incorporation of coastal structures, is the least aesthetically intrusive and would have minimal environmental impacts if properly implemented. In order for this solution to be successfully executed, adequate large scale initial capital nourishment will be required with regular beach maintenance to maintain the beach width. 2. Beach Nourishment +Groynes This option consists of 300m long groynes crossing the surfzone and extending to approximately -4 m CD. Shore perpendicular groyne structures are mainly used when the wave direction is oblique to the shoreline and where sediment transport is longshore dominant. Further, rip currents induced near the groynes may remove sediment from the littoral drift zone. These structures would require a large volume of rock and would require additional site investigations such as physical modelling to verify their adequacy and stability. This solution is not considered to be suitable for St Francis Bay s coastline. 3. Beach Nourishment + Offshore Breakwaters Offshore breakwater structures would provide a high level of coastal protection and retention of sediment on the beaches. It would however require large and costly structures which would be environmentally intrusive and have a negative aesthetic impact on the coastline. Additionally it would require further site investigations and physical modelling to confirm the stability of the structures. This option would require a significant volume of sediment and would be complex to construct due to the need for offshore marine equipment. While this option is considered to be excellent for coastal protection, financial constraints of the community and the long construction duration makes this option less favourable. The feasibility, advantages and disadvantages of each of the options are discussed in Section 5. Two permutations of the beach nourishment option 1 were developed using smaller scale and modified groyne arrangements in order to reduce the ongoing beach maintenance requirement. These options were based on a coastal headland approach and are illustrated in the figure below. Advisian xiv
15 Option 1A This option provides rock groynes with similar overall length to Option 2, however, the groynes are angled obliquely to the predominant wave direction. The structures therefore terminate in shallower water than Option 2 (at approximately -3 m CD) and are expected to allow some sediment to bypass the cells. By terminating in shallower water the headland groynes have less volume and are therefore less costly and intrusive than the groyne option. They are also expected to have some advantages in retaining sediment in key areas of the frontage. Option 1B The second option consists of much shorter stub groynes which terminate at an approximate depth of -2 m CD or shallower. More sediment would bypass Option 1B than Option 1A however the groynes should require less material and have a shorter construction duration than Option 1A. Option 1B is considered to be more suitable than Option 1A as it is less costly, could be implemented more easily in a phased approach, would require shorter construction duration and is less environmentally intrusive. It is noted that the shoreline configurations depicted for Option 1A and Option 1B are purely conceptual, based on engineering judgement and not coastal modelling. Although shoreline configurations of the selected option can be somewhat better assessed in the detailed design Advisian xv
16 phase, there are limitations in the numerical and empirical modelling of such solutions. If such options are adopted there is benefit in phasing the implementation to effectively test effectiveness of an initial structure in prototype. Preferred Option The options were presented during a Workshop meeting held on 29 th November The preferred option as derived from the workshop was Beach Nourishment with Stub Groynes Option 1B: Relatively short groynes allowing a percentage of sediment to pass Staged implementation of this solution was required due to financial constraints and the effectiveness of the solution will be evaluated. Preliminary Design The concept layout of the preferred option (Option 1B above) was further developed during the preliminary design. Coastal modelling demonstrated that the southernmost groyne of the second stage was not deemed beneficial, hence this structure was removed. The effectiveness of this solution would need to be monitored during the implementation of the various stages and the need for modification to the design would need to be re-evaluated. General Layout Five (5) groynes will be constructed from the back of the beach to a depth of -2 m CD. The groynes reach a length of between 170 m to 200 m offshore. Preliminary Design Drawings are included in Appendix A. Beach Nourishment Profile The design nourishment beach characteristics are as follows: dry beach width of 40 m; crest level of +3.8 m CD (+3.0 m MSL); upper beach slope of 1 in 20; and sub-aqueous beach profile based on an equilibrium beach profile (Dean, 1991) Where appropriate the shoreline will be nourished in between the rock groynes (Section 6 and Appendix A). Rock Groynes The preliminary design plan layout and cross sections of the rock groynes are included Appendix A. Four (4) non-standard rock gradings are adopted long the length of the groyne. Advisian xvi
17 Cost Estimate The estimated cost for the completed solution was estimated to be R 89 million based on rates for locally sourced rock material. Construction Duration The construction duration for the completed project is estimated to be 23 months. Way Forward Typical cross-sections were developed based on the available information with the purpose of providing information for costing. The sections will be further developed in the detailed design stage based on: Material availability; Constructability; High resolution bathymetry data, if required. Way forward: 1. Confirm available rock gradings from local quarry and modify design accordingly 2. Undertake bathymetric survey, if required (not currently in scope of works) 3. Update wave modelling 4. Detail rock Groynes based on existing topography / bathymetry 5. Update beach nourishment design based on sand source investigation (to be undertaken by SFPO) 6. Determine beach nourishment volume based on existing topography / bathymetry 7. Produce detailed design drawings Advisian xvii

18 1 Introduction 1.1 Project Location and Background St. Francis Bay beach lies on the southern shores of the greater St. Francis Bay, stretching between the Cape St. Francis headland in the south and the Kromme river mouth in the north as shown in Figure 1. The sandy beach at St. Francis Bay has suffered from significant erosion events over the past few decades which can be attributed to the stabilisation of large headland bypass dune-fields during the 1970 s and 1980 s. This has led to a reduction in sediment supply to the beach which resulted in a rapid retreat of the shoreline. The erosion problem was worsened by the construction of Impofu dam upstream of the Kromme river mouth (completed in 1983) which limited the supply of sediments that would be flushed out during floods and deposited on the adjacent beaches. Figure 1: Locality Map St. Francis Bay The continued beach erosion has threatened to undermine beach properties and infrastructure, leading to the placement of rock revetments along much of the beach. Where properly maintained these revetment structures have provided some backshore protection but significant beach erosion has been experienced both in front of these structures and along unprotected areas. The unprotected northern most 700 m of the beach, known as the Spit area, is backed by a narrow sand dune which has experienced significant erosion over recent years (Anderson, 2008). This is a narrow barrier dune and is in danger of being breached, with potential severe implications for the canal and Marina.
19 Numerous historic studies have been undertaken to investigate and evaluate the erosion problems and several studies have proposed possible remedial solutions. A time line of historic reports (WorleyParsons, 2014) is shown in Figure 2. Figure 2: Time-line of St. Francis Bay historic reports WorleyParsons collated and analysed the previous studies in a status review report in 2014 and proposed several conceptual erosion protection solutions (WorleyParsons, 2014). PRDW issued a design report for the maintenance and upgrade of rock revetments to protect ten privately owned properties in March 2015, shown in Figure 3 (PRDW, March 2015). Advisian 2


20 Figure 3: Location of revetment upgrade (PRDW, 2015) This was followed by a second design report during July 2015 focusing on revetments along the St Francis Bay shoreline, which was divided into 17 sub-areas as shown in Figure 4 (PRDW., July 2015) Advisian 3

21 - Figure 4: Existing shoreline protection along St Francis Bay (PRDW, 2015) Environmental authorisation was received during 2016 for the maintenance and upgrade of existing rock revetments and sandy beach backshore areas at Erven 720, 623, 2257, 185, 53, 184 and 625 along the St Francis Bay coastline. This work was undertaken as Phase 1 of an envisaged two-phased project to protect the coastline along St Francis. 1.2 Scope of Work (Phase 2) The purpose of the present Project is the design and construction supervision of Phase 2 of the long term coastal protection and sand retention structures. This Project considers the work undertaken during Phase 1 regarding the upgrade of revetment structures as being completed and Advisian 4
22 will therefore not need to be revisited during Phase 2. This Phase further does not include provision for revetment type shore protection options covering the Spit area. The project scope of work is outlined below: i. Provide feasible long-term solutions that will restore beach amenity, that is both time and cost effective: a. Present alternative long-term conceptual solutions. b. Select the preferred solution during a Workshop, to be further developed during the Preliminary Design; c. Detail and optimize the design with a focus on minimizing capital and maintenance costs during the detailed design stage; ii. Interact with the environmental consultant on the project as required; iii. Prepare construction drawings and tender documentation; iv. Identify suitable contractors to undertake the work; v. Assist during tendering and respond to contractors queries; vi. Assess submitted tenders and compile a tender report with recommendation; vii. Carryout 6 months of construction monitoring during the implementation phase. This report is related to the first task (Task i) listed in the scope of work and sets out the preliminary design of the scheme to be implemented under Phase Report Structure The report is structured as follows: Section 2 presents the basis of design for this project, including the design life and design standards utilised in the design. The physical and environmental site characteristics are described in Section 3, which serves as input to the coastal processes modelling presented in Section 4. The modelling comprise wave modelling, storm induced beach erosion modelling and long term shoreline modelling. Four (4) conceptual layout options are briefly outlined in Section 5. The preliminary design of the preferred option is presented in Section 6 together with the associated estimated costs, material quantities and construction duration. The report is concluded with recommendations given in Section 7 and followed by the list of references cited throughout the report in Section 8. Advisian 5
23 2 Basis of Design 2.1 Units S.I Units are adopted throughout the drawings, calculations and documentation. 2.2 Chart Datum Reference All levels in maritime works shall be relative to Chart Datum (CD) which is the Lowest Astronomical Tide (LAT) in all ports in South Africa. CD is m below the Mean Sea Level (MSL) or Land Levelling Datum (LLD). 2.3 Coordinate System The coordinate system to be used for all setting out and survey shall be UTM, Zone 34H, spheroid WGS Design Life The design life of the structures is 50 years. A design event with a return period of 100 years has been selected for design. This event has a probability of occurrence of approximately 40% during the structure design life. 2.5 Design standards Marine works and coast protection and should be designed in accordance with the following codes, standards and guidance documents: Standards: BS :2000. British Standards for Maritime Structures: Part 1 Code of practice for general criteria. BS : British Standards for Maritime Structures: Part 2. Design of Quay wall, jetties and dolphins. BS EN Eurocode 7: Geotechnical design. BS EN Eurocode 2: Design of Concrete Structures. BS EN Eurocode 3: Design of Steel Structures. BS EN Eurocode 8: Design of structures for earthquake resistance. UK National Annex to BS EN1997- Eurocode 7: Geotechnical design Part 1: General rules. BS EN Parts 1 and 2 European Armourstone Specification. SANS Basis for structural design Advisian 6
24 SANS Structural use of concrete Best Practice Guidelines The Rock Manual: the use of rock in hydraulic engineering (2 nd edition), C683, CIRIA. London (CIRIA, CUR, CETMEF, 2007). Wave overtopping of sea defences and related structures: Assessment Manual. Environment Agency, UK (EurOtop, 2007). Coastal Engineering Manual, US Army Corps of Engineers, Advisian 7

25 3 Site Characterisation 3.1 Bathymetry Nautical Chart data and beach profile data are available for the St. Francis Bay site. A detailed bathymetric survey study was also undertaken by Mr Dylan Anderson during 2005 as part of his MSc studies. The survey covered a large area of the bay as indicated in Figure 5 below. Despite study team requests this survey was unfortunately not made available. Figure 5: Bathymetric Chart showing the survey run-lines (ASR, 2006). The nearshore sea bed slope (200 to 300m from the coastline) varies between approximately between 1 in 40 and 1 in 70. Advisian 8
26 3.2 Beach Profiles Surveys undertaken Maarschalk & Partners undertook beach profile surveys from 2006 to 2015 and again in Table 1 presents the months of the year when surveys were undertaken. The highest frequency of surveys was during 2007 and Table 1: Beach Profile Surveys undertaken from 2006 to 2015 and 2017 Month Year Jan Feb Mar May Jun July Aug Sep Oct Nov Dec A map depicting survey profiles with their associated dates is shown in Figure 6. Surveys undertaken during 2006 and 2007 were not measured along beach profiles, but were scatter point surveys along the beach. This is indicated as light blue shading in Figure 6. The beach was surveyed 13 times during this period. From 2008 to 2014, a total of 27 beach profiles were surveyed, each profile located at evenly spaced intervals along the shoreline (Figure 6). A total number of 39 surveys were undertaken during this period. The location and number of beach profiles surveyed in 2015 and in 2017 differed from the previous surveys as indicated in Figure 6. A total number of 10 profiles were surveyed in The same profiles surveyed in 2015 were again surveyed in 2017 with 11 additional profiles added inbetween. Advisian 9
 approximate")
27 Figure 6: Location of beach surveys Profile variations over time Beach profiles were compared to evaluate the fluctuations in the beach profiles over time and establish i) approximate short term variation envelopes for the profiles and ii) any discernible erosion or accretion trends. Advisian 10

28 The horizontal fluctuation of the 0 m, 0.5 m and 1 m elevation contours relevant to MSL for Profile 26 (north end, close to the spit) is illustrated in Figure 7. Based on the standard deviation of the data, the short term horizontal excursion is in the order of 15 m. Linear trend lines fitted through the data points indicate a long term erosion trend of between 10 m and 20 m over 11 years, thus on average about 1.5 to 2 m per year. ASR (ASR, 2006) estimated the rate of retreat as between 1.5 and 3 m based on data sets from 1995 to ASR stated that based on previous studies and aerial photographs, the rate of erosion in recent years is lower than in previous decades (where the majority of rapid erosion took place). This could potentially be due to a combination of the beach approaching a new equilibrium, with the non-erodible shallow subtidal reefs establishing a controlling effect (pg. 26, ASR 2006). The estimated rate of retreat is thus in line with the findings of (ASR, 2006). Figure 7: Horizontal movement of elevation contours at Profile 26 from 2006 to Along the southern end of the beach at the location of Profile 4, the shore term horizontal movement is also estimated to be around 15 m. Over the long term, the beach accreted about 5 m seaward from 2006 to 2015, thus on average just over half a metre per year (Figure 8). However, the survey taken in 2017 indicates significant erosion between 2015 and 2017, likely the result of one or more significant storm events, which reversed the long term accretion trend. Advisian 11


29 Figure 8: Horizontal movement of elevation contours at Profile 4 from 2006 to 2017 For further beach profiles refer to Appendix E Spit retreat The shoreline evolution in the Spit area is of interest for several reasons, in particular to capture historical beach response in the absence of shore revetments. Several surveys were undertaken by Maarschalk & Partners between 2010 and 2017 to identify the retreat of the toe of the dune along the spit. The retreat was compared with the MHW tidal level of While a steady retreat is noticeable between 2010 and 2015, it was observed that the northern tip of the spit retreated significantly between 2015 and 2017, as shown in Figure 9. Figure 9: Spit retreat Advisian 12
30 It is therefore strongly recommended that shore protection measures, such as the spit protection investigated during Phase 1, be implemented to prevent a breach. Without further study by Advisian it is not possible to provide a recommendation on preferred measures. The solutions provided in this study (Phase 2) would complement the spit protection proposed in Phase 1 but not replace the need for direct shore protection defences to be fully implemented Beach profile characteristics The maximum beach elevation measured along the back of the beach over the last 11 years, occurred mostly along the southern and northern stretches of coastline and varied between +2.5 m and +3.5 m MSL (+3.3 to +4.3 m CD). The slope of the beach above mean sea level was on average between 1 in 15 and 1 in Beach Sand Grain Size Sediment surveys of the offshore seabed, beach and estuary were undertaken by ASR (2006). It was found that the beach sand and sand in the shallow sub-tidal areas is mostly of similar grain size along the beach. The local bathymetry is also likely to influence the distribution of the sediment in the cross-shore direction, with finer sediments accumulating in the deeper areas according to ASR (2006). According to the (Entech, 2002) sand source report the average median grain size, D 50, of the upper beach was found to be 0.18 mm and the lower beach was 0.22 mm. It is recommended for additional sand source investigations to be undertaken to identify possible variations in grain size at various depths at the potential sand sources. 3.4 Water Levels Tidal Levels Tides on the Southern African coasts are regular, semi-diurnal and their range seldom exceeds 2.2m. Tidal planes are provided at the South African ports by the SA Navy Hydrographer (2007). St Francis Bay is situated mid-way between Knysna Port and Port Elizabeth Port. The tidal planes at Port Elizabeth (Table 2) were adopted for this project. Table 2: Tidal Levels (in meters CD) of Port Elizabeth (The SA Navy Hydrographer, 2017) Location LAT MLWS MLWN ML MHWN MHWS HAT Port Elizabeth Tidal measurements taken at the Port of Elizabeth were obtained from the University of Hawaii Sea Level Centre (UHSLC, 2017). The available hourly average water level dataset covers the period of 15 June 1978 to 31 May The hourly water levels represent the average of fifteen-minute Advisian 13
 A tidal analysis was undertaken for the 32.")
31 values taken at 7.5 minutes before and after the hour. Accounting for gaps, the effective dataset length is 32.8 years as presented in Figure 10. Figure 10: Measured water level at Port Elizabeth. Source: UHSLC (2017) A tidal analysis was undertaken for the 32.8 years dataset using UTide Matlab Functions (Codiga, 2011), which is suitable for multi-year analysis and can handle the tidal analysis of either sea levels or currents. This analysis provided the tidal constants (amplitude and phase) as well as the predicted water levels based on the derived tidal constituents. The main tidal constituents are provided in the table below: Table 3: Principal tidal constituents (Judith Bosboom, 2012) Constituent Symbol Period (hours) Semidiurnal Principal lunar M Principal solar S Lunar elliptical N Lunar-solar declinational K Diurnal Lunar-solar declinational K Principal lunar O Principal solar P Lunar elliptical Q Advisian 14
32 3.4.2 Storm Surge Storm surge is defined as the influence of meteorological effects such as winds and barometric pressure that result in the actual sea level being above or below the predicted astronomical tide level. The storm surge events have durations of hours to days and can thus be extracted from hourly tidal measurements. The storm surge at Port Elizabeth was estimated by calculating the residual water levels from the 32.8 years hourly tidal measurements (UHSLC dataset) as the difference between the measured hourly water level and the predicted tide outlined in Section The measured, predicted and residual tides are presented in Figure 11. The maximum and minimum residuals determined from Port Elizabeth dataset are m and m, respectively. Advisian 15
 for 1, 5, 10, 25, 50 and 100 year average return intervals.")
33 Figure 11: Predicted tide, measured water level and residual water level at Port Elizabeth. An extreme analysis of the residuals was carried out to estimate the positive storm surge (water level higher than the predicted tide) for 1, 5, 10, 25, 50 and 100 year average return intervals. The storm surge dataset was analysed to establish extreme estimates for the site by fitting a Weibull distribution to the highest independent values in the data set. In this case, independence was defined as maximum positive storm surge levels being at least three days apart. Advisian 16
 Average Surge 95% Confidence Interval Lower Limit Upper Limit 1 0.51 0.49 0.53 5 0.62 0.59 0.65 10 0.66 0.63 0.70 25 0.")
34 The probability plot and extreme water levels resulting from the analysis are provided in Figure 12 and Table 4, respectively. Figure 12: Probability plot of residual water level. Table 4: Extreme storm surge based on Port Elizabeth tidal levels ARI (year) Average Surge 95% Confidence Interval Lower Limit Upper Limit Sea Level Rise Different projections of sea level rise have been made by the Intergovernmental Panel on Climate Change (IPCC) (IPCC, 2013). They present estimates for a number of different scenarios that depend on population growth, GDP growth, energy use, land use changes, resource availability and pace and direction of technology. Advisian 17

35 It is recommended to use the central projection of the RCP4.5 estimate (IPCC, 2013) (illustrated in Figure 13). Assuming the coastal protection solution is implemented in 2018 and has a 50 year design life, this means an increase in mean sea level of approximately 0.26 m by Figure 13: Time series of the projected global mean sea level for scenario RCP4.5 and the contributions made to the global mean sea level by various sources. Source: (IPCC, 2013) Extreme Water Levels For the extreme water level, the effects of sea level rise for the 50 year design life of the coastal structures, as well as the storm surge corresponding to the 100 year Average Return Interval (ARI) was superimposed onto the Mean High Water Spring Tide (MHWS). Advisian 18
36 Table 5: Extreme Water Levels Parameter Water level excluding SLR Water level including SLR Tide Level (MHWS) m CD m CD Residual (1:100) 0.80 m 0.80 m Sea-level rise 0 m 0.26 m Total Water Level m CD m CD Design Water Levels Design Still High Water Level was defined based on the combination of tide, surge and sea level rise resulting in +2.92m above CD (Table 5). Design Still Low Water Level was defined as LAT (0.00 m CD). 3.5 Offshore winds The available wind sources, extraction locations of these datasets and their details are provided in Table 6, Figure 14 and Table 7. Table 6: Sources of wind data. Source Description Information Provided National Centers for Environmental Prediction (NCEP) WaveWatch III (WW3) global model Three-hourly average wind direction and magnitude data (data period outlined in Table 7) Offshore wind magnitude and direction. National Centers for Environmental Prediction (NCEP) Global Data Assimilation System (GDAS) Climate Forecast System Reanalysis (CFSR) Hourly wind direction and magnitude data (data period outlined in Table 7). Onshore wind magnitude and direction data. Advisian 19
37 Figure 14: Wind sources location map. Table 7: Summary of the wind data extracted. Wind Datasets Coordinates Period of Recorded Data % of Recorded Data Type dataset of NWW3 Wind S, 25.0 E From 01/01/1997 to 31/07/ % 3 hourly NWW3 Wind S, 27.5 E From 01/01/1997 to 31/07/ % 3 hourly GDAS Wind S, E From 01/01/1979 to 31/12/ % 1 hourly 1 Combined dataset from existing NCEP WW3 model resolutions 2 Combined dataset from existing NCEP WW3 model resolutions Advisian 20
38 Annual wind roses and annual wind speed wind direction frequency tables were produced for each of the locations and are presented in Appendix B. As an example, the annual wind rose and wind speed wind direction frequency table for the NWW3 Wind 1 location are presented in Figure 15 and Table 8, respectively. The principal wind direction for the NWW3 Wind 1 dataset is from the western sector with an approximate occurrence of 33% of the time (combining W, WSW, and WNW directions). The second most predominant wind direction comes from the east-north-eastern sector with an approximate occurrence of 26% of the time (combining ENE, NE and E directions). The maximum wind speed from the extracted time series is 26.5 m/s, whilst the average wind speed is 8.3 m/s. Figure 15: NWW3 Wind 1 Annual wind rose. Advisian 21
39 Wind Direction, WD ( o N) St Francis Property Owners Table 8: NWW3 Wind 1 Annual wind speed wind direction frequency table. Annual Wind speed, WS (m/s) 0 > 0-4 > 4-8 > 8-12 > > > > > 28 All WS Cum WS N NNE NE ENE E ESE SE SSE S SSW SW WSW W WNW NW NNW All WD Cum WD The wind time series extracted from the NWW3 Wind 1 dataset were utilized to set up the forcing conditions for the wave model described in Section Offshore waves The available offshore wave sources, extraction locations of these datasets and their details are provided in Table 9, Figure 16 and Table 10. Table 9: Sources of wave data. Source Description Information Provided NCEP WaveWatch III (WW3) global model Three-hourly significant wave height, peak wave period and direction data (data period outlined in Table 10). Offshore significant wave height, peak wave period and direction data. Advisian 22
40 Figure 16: Wave sources location map. Table 10: Detailed information of the wave data extracted. Wave Datasets Coordinates Period of Recorded Data % of Recorded Data Type dataset of NWW3 Wave S, 25.0 E From 01/01/1997 to 31/07/ % 3 hourly NWW3 Wave S, 27.5 E From 01/01/1997 to 31/07/ % 3 hourly Annual wave roses (H m0 MWD and T P MWD) and annual frequency tables (T P MWD, H m0 MWD and H m0 T P ) were produced for the offshore locations and are presented in Appendix C. As an example, the annual wave roses and the annual frequency tables for the NWW3 Wave 1 location are provided in Figure 17 and Table 11, respectively. 3 Combined dataset from existing NCEP WW3 model resolutions 4 Combined dataset from existing NCEP WW3 model resolutions Advisian 23
41 The principal wave direction for the NWW3 Wave 1 dataset is from the southwestern sector with an approximate occurrence of 61% of the time (combining SW, WSW and SSW directions). The maximum significant wave height from the extracted time series is 11.5 m with an associated peak wave period ranging between 12 and 18s. The average significant wave height is 3.5 m and the average peak wave period is 11.1 s. The wave time series extracted from the NWW3 Wave 1 dataset were utilized to set up the forcing conditions for the wave model described in Section 4.1. Figure 17: NWW3 Wave 1 Annual significant wave height rose (top) and annual peak wave period rose (bottom). Advisian 24
42 Significant Wave Height, Hs (m) Mean Wave Direction, MWD ( o N, from) Mean Wave Direction, MWD ( o N, from) St Francis Property Owners Table 11: NWW3 Wave 1 Annual frequency tables. T P MWD frequency table (top), H m0 MWD frequency table (middle) and H m0 T P frequency table (bottom). Annual Wave Peak Period, T P (s) < 2 > 2-4 > 4-6 > 6-8 > 8-10 > > > > > > 20 All T P Cum T P N NNE NE ENE E ESE SE SSE S SSW SW WSW W WNW NW NNW All Dir Cum Dir Annual Significant Wave Height, H s (m) < 1 > 1-2 > 2-3 > 3-4 > 4-5 > 5-6 > 6-7 > 7-8 > 8-9 > 9-10 > > > 12 All Hs Cum Hs N NNE NE ENE E ESE SE SSE S SSW SW WSW W WNW NW NNW All Dir Cum Dir Annual Wave Peak Period, T P (s) < 2 > 2-4 > 4-6 > 6-8 > 8-10 > > > > > > 20 All T P Cum T P < > > > > > > > > > > > > All H s Cum H s Advisian 25

43 4 Coastal Processes Modelling The sediment transport along the St Francis Bay shoreline is largely driven by the nearshore wave climate. In the absence of local wave measurements at the project site, numerical wave modelling was undertaken to estimate the nearshore wave conditions. Possible shoreline changes due to both cross-shore and long-shore sediment transport were evaluated through sediment transport models. The results served as input to prepare conceptual layout options to restore the beach and limit beach recession. The modellings tasks are further detailed in the sub-sections that follow. 4.1 Wave Modelling Model Set-up and Approach A nested spectral wave model was prepared for St Francis Bay consisting of four (4) grids (Figure 18). The Delft3D modelling suite was used to set up the model domain and simulate the wave climate at the project site. For these simulations Delft3D-WAVE modelling module was used. The Delft3D-WAVE module uses SWAN (Simulating Waves Nearshore) numerical model to simulate the generation and propagation of wind-generated waves. For this study, the flow effect on waves was defined by a spatially uniform water level. Figure 18: Extent of the computational domain for the nested wave model used for St Francis Bay. Advisian 26
44 Nesting is a modelling technique in which a larger model encloses a smaller model, and as the larger model runs it generates hydrodynamic and wave boundary conditions that can be applied to the smaller model. A benefit of this technique is the improved resolution provided by the inner, fine-scale model, while not substantially extending the model processing time. Table 12 summarises the details of the computational grids used to establish the nearshore wave climates. Table 12: Delft3D-WAVE computational grid details Grid Description Grid Length (km) Grid Width (km) Cell resolution (m) Coarse x 1000 Intermediate x 333 Intermediate x 11 Fine x 35 Offshore wave and wind conditions were extracted from the National Centers for Environmental Prediction (NCEP) WaveWatch III (WW3) global hindcast model (Section 3.5 and 3.6) was applied at the domain boundaries (coarse grid) and numerically propagated towards the shore. Instead of running a continuous simulation for the entire 18 year period, combinations of significant wave height, direction, period, wind speed and wind direction were simulated. Sea (locally generated) and swell were simulated separately. The results from the discrete simulations are then linearly interpolated to the continuous time series data at the desired locations nearshore. The characteristics of the simulated conditions are presented in Table 13. Table 13: Simulated conditions. Parameter Range Bin size No. of Bins H m0 (m) T P (s) PWD ( o ) WS (m/s) WD ( o ) The model was run in stationary mode with the water level set to Mean Sea Level Nearshore Wave Climate The wave climate in St Francis Bay is considered mild since most of the swell wave energy is substantially reduced in wave height due to the shelter offered by Cape St Francis, as well as refraction and diffraction effects (Figure 19). However, local strong winds can generate strong short-period waves throughout St Francis Bay which enhances the harshness of the coastal environment. This is demonstrated in the wave height vector fields plotted in Figure 20 to Advisian 27

45 Figure 23, which provide the simulated wave conditions for the strongest easterly and westerly wind conditions in combination with easterly and south-westerly swell, respectively. Figure 19: Extreme wave condition illustrating sheltering effects of Cape St Francis at St Francis Bay The reductions in wave heights in the nearshore are due to the combined effects of offshore shoals, refraction, diffraction, bed friction losses and wave breaking. Advisian 28


46 Figure 20: Simulated wave conditions for the strongest easterly wind and swell conditions - Offshore swell: H S = 7.5m, T P = 12s, Direction = 90 N and winds: WS = 22.0m/s, Direction = 67.5 N along St Francis Bay Figure 21: Simulated wave conditions for the strongest westerly wind conditions and easterly swell conditions - Offshore swell: H S = 7.5m, T P = 12s, Direction = 90 N and winds: WS = 26.5m/s, Direction = 270 N along St Francis Bay Advisian 29


47 Figure 22: Simulated wave conditions for the strongest easterly wind condition and south-westerly swell conditions - Offshore swell: H S = 11.5m, T P = 15.6s, Direction = N and winds: WS = 22m/s, Direction = 67.5 N along St Francis Bay Figure 23: Simulated wave conditions for the strongest westerly wind condition and south-westerly swell conditions - Offshore swell: H S = 11.5m, T P = 15.6s, Direction = N and winds: WS = 26.5m/s, Direction = 270 N along St Francis Bay Advisian 30
48 The annual wave rose at Point 1 (x = m ; y = m, WGS84 UTM 35S), location also indicated in Figures 19 to 22, at -10 m CD, is shown in Figure 24. The dominant wave direction is from the south-east with a smaller component approaching the shoreline from the east. The average significant wave height, estimated over the last 17 years, is 1.1 m. The maximum significant wave height in the simulated time series is 4.5 m. Figure 24: Annual wave rose at Point 1, -10 m CD Advisian 31
49 4.1.3 Extreme Waves An extreme value analysis (EVA) was undertaken for the data sets to determine the extreme wave conditions for various average return intervals (ARI). Extreme events were selected based on a peaks over threshold method, with the threshold defined as 2 m. Two successive events were extracted only if the time between the events exceeded 72 hours to ensure independence. The extreme value series was then fitted to a three parameter Weibull distribution. Extreme wave height estimates and associated peak wave periods for various ARI s at the Point 1 location are presented in Table 14. Table 14: Extreme significant wave height estimates (m) and associated 95% confidence intervals for Point 1* ARI (yr) Omni-directional Wave 95% Confidence Interval characteristics H s T P Lower Limit Upper Limit * Point 1: x = m ; y = m, WGS84 UTM 35S, -10 m CD Design Waves The extreme wave conditions used as input for the design of the shoreline coastal structures were based on depth limited conditions as defined in (Kamphuis, 2000). Where: H sb : Breaking wave height d b : Breaking depth m: seabed slope H sb d b = 0.56e 3.5m A summary of the design conditions is presented in Table 15. Advisian 32
50 Table 15: Extreme wave conditions (100 year ARI) based on depth-limited conditions Seabed Elevation (mcd) SWL (mcd) Total water depth (m) H m0b (m) T P (s) Storm Induced Beach Erosion Short term cross-shore erosion is typically the consequence of extreme wave events, where sediment is temporarily transported seaward. During calmer conditions, the beach profile typically tends to recover as the sediment is shifted towards the shoreline and deposited on the beach. The estimated extent of beach recession due to an extreme event informs the minimum beach width required to accommodate such an event without impacting the landside boundary SBEACH Software Preliminary simulations of storm induced changes to the beach profile were carried out using SBEACH (Simulation of storm induced BEAch CHange). The software was developed jointly by the Department of Water Resources, University of Lund, Sweden and the Coastal Engineering Research Center, US Army Waterways Experiment Station, USA. SBEACH is a system for modelling the changes occurring in beach profiles, adapted to predicting the impact of storms in coastal areas (Larson, Kraus, & Byrnes, 1990). SBEACH describes the impacts of storms (short-term events) on upper and lower beach profiles. The typical beach profile and sediment characteristics along St Francis shoreline is utilised to determine the expected beach recession. This will inform the minimum beach width required to maintain a useable beach after a storm event and optimise and limit beach maintenance as far as possible. SBEACH model uses the conservation of sand mass equation: Where K is an empirical transport rate coefficient, K (D D eq + ε dh q = { K dx ) D > D eq ε dh K dx 0 D < D eq ε dh K dx Advisian 33
51 2.5x10⁻⁷ m 4 /N K 2.5x10⁻⁶ m 4 /N ε is a transport rate coefficient for the slope dependant term, 0.001m 2 /s ε 0.003m 2 /s D is a wave energy dissipation per unit volume, and D eq is an equilibrium energy dissipation per unit volume Model Input Parameters In an effort to determine the input sediment transport parameters, an erosion event was modelled in SBEACH for which the following were known: 1. Significant wave height and peak period time series for the storm duration 2. Water elevation time series for the storm duration 3. Pre- and post-storm measured beach profiles A storm which occurred between the 21 st and 28 th of October 2009 was selected as the beach profiles were surveyed on 19 October 2009 (pre-storm) and 17 November 2009 (post-storm). The transformed nearshore significant wave heights, extracted at the -10 m CD contour (Section 4.1) were applied together with the water level time series (Section 3.1). Grain size of 0.22 mm was adopted (Section 3.3) together with an empirical transport rate coefficient K of 3.0 x 10⁻⁷ m 4 /N; and a transport rate coefficient for the slope dependant term ε of m 2 /s. The pre- and post-storm measured and modelled profiles are shown in Figure 25. With the chosen set of model parameters, the modelled and measured post-storm profiles compare reasonably well. These model parameters were adopted for subsequent SBEACH simulations. Advisian 34
.")
52 Figure 25: Comparison of measured and modelled beach erosion due to October 2009 storm event Input beach profile The initial beach profile (pre-storm) utilised to estimate short term erosion is shown in Figure 26. Figure 26: Initial pre-storm profile utilized in SBEACH simulations The beach profile was based on the existing beach profile characteristics (Section 3.2.4). The highest elevation of the beach profile was adopted as +3 m MSL (+3.8 m CD) with a 1 in 20 slope to MSL ( m CD). The sub-aqueous section of the profile (below MSL) was assumed to be similar to the equilibrium beach profile based on Dean s equation (Dean, 1991): Advisian 35
 and A is the Sediment Scale Parameter, a function of the sand grain size D 50")
53 d = Ax 2/3 A = D where x is the offshore distance from still water line, d is the water depth (measure from the still water level) and A is the Sediment Scale Parameter, a function of the sand grain size D 50 (Figure 27). A particle grain size of 0.20 mm, thus slightly finer than the native sand of 0.22 mm, was adopted for the beach profile. This considered as a conservative approach as a smaller grain size will result in more higher rates of erosion. Figure 27: Dean's equilibrium profile shape definition sketch (Source: Input storm events A simplified joint probability analysis was undertaken to determine the probability of simultaneous occurrence of total significant wave heights and high water levels, using the established nearshore climate and the tidal data time series from UHSLC (Refer to Section and Section 4.1). The simplified method as presented in (Hawkes & Svensson, 2003) to compute the joint probability of extremes was used. This method constructs tables of joint exceedance using the extreme values estimated for the variables (total significant wave height and high water levels) and a singleparameter representing the dependence between the two variables. In this case the variables were assumed to be nearly completely independent. The combined conditions are called joint exceedance extremes and the associated joint exceedance return period refers to the average time between occasions when both variables exceed their specified values simultaneously. The resulting joint probability curves for different average return intervals (ARI s) or return periods are shown in Figure 28. Preliminary simulations with SBEACH indicated that the combination of higher water levels and lower wave heights resulted in more severe erosion compared to lower water levels and higher wave heights (Figure 29). Advisian 36


54 Figure 28: Joint Probability Curves for extreme significant wave heights and high water levels Figure 29: 100 year ARI simulated erosion: High Hs at low WL vs low Hs at high WL The wave conditions selected for simulations with SBEACH are listed in Table 16. Advisian 37
55 Table 16: Selected peak storm conditions for SBEACH simulations ARI (yr) High WL (m CD) High WL including H s (m) T p (s) SLR (m CD) The SBEACH model is sensitive to the storm duration. To determine the typical storm duration at St Francis Bay, nine storms were selected from the wave climate time series at the -10 m CD contour (Figure 30). Two of the nine storms (Storm 1 and Storm 2, Figure 30) had durations of approximately 100 hours, including the build-up and tapering down of the wave heights. The duration of the other 7 storms ranged between roughly 30 and 60 hours. For the selected storm events (Table 16), a storm duration of 84 hours was adopted. Figure 30: Storm duration of selected storms Advisian 38
56 4.2.5 Estimated short term erosion The estimated cross shore eroded profiles resulting from the SBEACH model simulations for the 1 year and 100 year ARI, with and without sea level rise (SLR), are presented in Figure 31. Figure 31: SBEACH storm erosion results (with and without SLR) If SLR is not considered, the estimated recession of the beach crest (+3.8 m CD) ranges between 5 and 15 m. However, with SLR over 50 years, the recession increases to between 15 and 25 m with overwash of sediment reaching almost 40 m landward. 4.3 Long Term Shoreline Modelling It is necessary to understand the movement or evolution of the shoreline in the long-term to establish shoreline response to beach protection schemes. The long-term patterns of shoreline movement observed in nature can be classified as follows: Slow retreat of the shoreline due to long term erosion (shoreline moving landwards), Build-up of sediment over the long term pushing the shoreline seawards, Short-term back and forth movement of the shoreline in cycles due to episodic events and seasonal wave climate influences (shoreline is dynamically stable), and No signs of significant movement (shoreline is dynamically stable). The long-term response of the shoreline is fundamentally dependant on the day-to-day environmental conditions influencing the longshore and cross-shore processes and related Advisian 39
57 morphodynamics of beach profiles. These processes and the resulting shoreline response were estimated by the use of numerical modelling, outlined in the sub-sections that follow Modelling Suite Description The UNIBEST (Uniform Beach Sediment Transport) software suite was used to setup the model domain and simulate the coastline change at the project site. The software has been developed by Deltares to study the longshore and cross-shore processes and related morphodynamics of beach profiles and coastline evolution. UNIBEST-CL is a sediment balance model that computes longshore sediment transports at specific locations along the coast due to various oceanographic forcing like waves and currents. Thereafter, the longshore transports are translated to shoreline evolution by calculating the gradient in the longshore sediment transport as a function of the coastline orientation. The engines of UNIBEST-CL consist of LT (longshore transport) and CL (coastline). The former computes longshore currents and sediment transports due to various oceanic forcing, like waves and currents, while the latter uses the divergence of transport rates to calculate the actual coastline change by assuming a single line theory. Longshore transport and its distribution along the coastal profile can be evaluated according to several total-load sediment transport formulae for sand (such as Bijker, Kamphuis, van Rijn, etc.) or gravel (Van der Meer & Pilarczyk). As sections within the coastal cells accrete or erode, shoreline angle changes, and transport rates adjust to the changed wave approach angle. A background description of the Deltares UNIBEST-CL+ software applied in this study is included in Appendix D Modelling Setup Water Levels Three water level conditions, based on the tidal levels outlined in Section 3.4.1, were applied in the coastline evolution model namely Mean High Water (MHW), Mean Sea Level (MSL) and Mean Low Water (MLW). These tidal levels together with their associated percentage of occurrence are listed in Table 17. The percentage of occurrence at MHW and MLW are conservative and will tend to lead to slightly higher transport rates especially at the upper beach. Advisian 40
58 Table 17: Representative water level conditions for UNIBEST-LT model Water level (m CD) Percentage of occurrence (%) 1.68 (MHW) (MSL) (MLW) 25 SLR was not considered in the initial shoreline modelling as the intent is to investigate the shoreline response in the first 15 to 20 years after completion of the nourishment scheme Wave Conditions Based on the coastline orientation of St Francis Bay and the number of existing coastal structures (revetments), 14 nearshore wave climate datasets, based on the numerical wave modelling outlined in Section 4.1, were used to define the wave forcing conditions along the beach and drive the shoreline evolution modelling as depicted in Figure 32. Appendix C provides the annual wave roses for each local wave dataset. Figure 32: Location map of the local wave conditions extracted for shoreline modelling at St Francis Bay Advisian 41
59 Beach Profiles Based on the bathymetric and beach profile data summarised in Section 3.1 and 3.2, cross-shore profiles were derived along St Francis Bay for each of the local wave climate locations established above (Section ). The beach profile extends from a water depth of -10 m CD to a beach elevation ranging between 2.5 m CD and 4.3 m CD Sediment Grain Diameter The average median grain size (D 50 ) for the St Francis Bay beach was found to range between 0.18 mm and 0.22 mm (Section 3.3). An average grain diameter size of 0.20 mm was applied in the shoreline model Sediment Transport Formulation and Parameters In coastal waters, sediment transport processes are strongly affected by waves and currents. Waves generally act as sediment stirring agents, while the mean currents will transport the stirred sediments. Two main modes of sand transport are observed in nature: Suspended-load transport. Suspended sediments in the water column, which may have been stirred by waves and/or currents, will typically settle when the current speeds are reduced. This transport mode is dominated by turbulence-induced drag forces on the particles. Bed-load transport. When the sediment is coarser or the fine sediment is in a cohesive form, strong currents will generate a mud layer that will move along the seabed bottom. This transport mode is dominated by flow-induced drag forces and gravity forces acting on the particles. Several formulations have been developed over the years to estimate the sediment transport in coastal waters, which combine the abovementioned transport mechanisms. For this study, the Soulsby van Rijn formulation (Soulsby, 1997) were applied. The sediment transport parameters used in the formulation are ideally defined based on local field data. As data was limited at the time of undertaking this study, the default parameters provided in the UNIBEST software were adopted Shoreline Definition UNIBEST-CL presents the position of the coastline using a single line, which is defined via two components: a reference line (that remains unmodified during the entire simulation) and the distance between this reference line and the coastline position at each time step. Therefore, Geographic Information System (GIS) software was used to establish the location of the reference line and the initial coastal position for St Francis Bay beach. The initial coastline was established as the 1 m CD contour. Advisian 42

60 A curvilinear grid was used in the model to distribute cross-shore profiles, which allows for higher resolution in the areas of interest, including the rock revetments and the sand spit. The shoreline model consisted of 167 grid points from the southern boundary to the northern boundary, stretching over a distance of approximately 3 km. The locations of the reference line, initial coastline position and computational grid applied in the model are shown in Figure 33. Figure 33: Location map of the UNIBEST-CL reference line, initial coastline and computational grid for the shoreline model of St Francis Bay Existing coastal protection structures The sandy beach at St. Francis Bay has suffered from significant erosion events over the past few decades. This has effectively reduced the beach width and threatened to undermine beach properties and infrastructure, which lead to the placement of rock revetments along the beach. These coastal protection structures, as depicted in Figure 34, have also been included in the model to derive the current shoreline situation. Advisian 43
61 Figure 34: Location map of the UNIBEST-CL rock revetments for the shoreline model of St Francis Bay Shoreline Evolution Results ( ) A shoreline evolution assessment was undertaken to derive the initial changes in the shoreline position due to the estimated annual nearshore wave conditions along St. Francis Bay beach in combination with the existent rock revetments, as well as to test shoreline response to the preferred option (Section 6) for the long term coastal protection and sand retention structures. The sediment transport along the coast is defined by the angle of incidence of the dominant wave direction and the energy in the waves. This information is computed in UNIBEST-LT module for the studied coastal stretch and then applied in the UNIBEST-CL module to determine the changes along the coastlines. Figure 35 provides the shoreline evolution of St. Francis Bay beach for the 42 year modelling period considered ( ). Advisian 44
62 Figure 35: Simulated shorelines along St. Francis Bay for the considered simulation period ( ). The UNIBEST model for St Francis sufficiently represents the historical shoreline changes due to i) the reduction of available sand supply (damming of the Kromme River and stabilization of Santereme dunes) over the past decades and the effect of the constructed rock revetments. Advisian 45
63 5 Conceptual Options During the project inception meeting held on 21 st September 2017, updated costs and a multi criteria analysis was presented for the options provided in the WorleyParsons 2014 report. The options are listed in Table 18. Table 18: Conceptual Options A B C Key Do-nothing Beach nourishment only Spit protection only Option B+C B+D B+C+F B+C+E B+C+C 1 C+C 1 B+D+F Beach nourishment + spit protection Beach nourishment + single groyne Beach nourishment + spit protection + offshore breakwaters Beach nourishment + spit protection + groyne field Beach nourishment + spit protection + revetment rearmouring at vulnerable locations Spit protection + revetment re-armouring at vulnerable locations Beach nourishment + single groyne + offshore breakwaters During the inception meeting Advisian recommended and SFPO agreed to advance the following three options from the WorleyParsons 2014 report: 1. Beach nourishment 2. Beach Nourishment +Groynes 3. Beach Nourishment + Offshore Breakwaters These options were presented during a Workshop meeting held on 29 th November 2017 including two alternative groyne arrangement options. The alternative arrangement options were developed based on a headland groyne approach offering better protection to the coastline than straight groynes and allowing slightly larges beach amenity areas to be developed near the groynes. Advisian 46

64 5.1 Option 1: Beach Nourishment One of the least environmentally intrusive methods of protecting the St. Francis Bay coastline from further erosion is to artificially nourish the beach with sediment from suitable borrow sources. Beach nourishment or beach recharging involves the importation of sand to an eroding beach. Sand can be delivered to the beach by pipelines, trucks or dredgers. The placements of sand could be either directly on the dry beach or within the surf-zone. This additional sand will provide added protection against wave attack as waves will dissipate their energy before reaching the existing eroding area. Figure 36: Beach nourishment (Source: Small beach nourishment operations were initiated in St. Francis Bay beach in 1996, where sand was dredged from the Kromme river estuary and supplied via a 150 mm flexible pipe to discharge locations on the beach. This system proved inadequate to make a significant improvement in beach nourishment and was abandoned. The implementation of this option will require a large volume of initial nourishment (capital nourishment) to be placed on the beach to allow the creation of a sufficiently wide beach crest (Figure 37). This would provide both a beach amenity and provide a buffer for storm events. The likely source of sand for beach nourishment has still to be identified from a comprehensive sand source investigation (not part of the Advisian study), but is likely to include sourcing from the sand banks in the river mouth as was previously done. During a previous study in 2002 potential sand sources were identified upstream of the Kromme river estuary, the sand river and the remaining open dune fields at the south of Santareme that could be used for the nourishment of the beach (Entech, 2002). Advisian 47

65 It is strongly recommended that a comprehensive updated sand source investigation to be undertaken to verify the volume and suitability of the sand for beach nourishment and to apply for environmental approval. Figure 37: Beach nourishment conceptual option The preliminary estimate of sand volume required for beach nourishment for St Francis Bay shoreline is detailed in the sections below Depth of Closure The depth of closure is defined as the seaward limit of the active beach profile (Birkemeier, 1985): h = 1.75H s,12h/y 57.9 H s,12h/y 2 gt s 2 Advisian 48

66 Where H s,12h/y is the significant wave height exceeded on average 12 hours per year and T s is the associated wave period. The depth of closure has been calculated based on the wave climate from the spectral wave model. The depth of closure is estimated as -4.6 m CD Nourishment Beach Profile The beach profile used as input in the storm induced beach erosion simulations (Section 4.2) were adopted as the preliminary nourishment profile. A horizontal dry beach width of 40 m was adopted in the design, as confirmed by SFBHOA. This will allow for short term horizontal movement of the shoreline of 15 m (Section 3.2) and the estimated extreme storm induced erosion of 15 m (associated to the 100 year ARI event without SLR and the 1 year ARI event with SLR), thus maintaining a beach width of approximately 10 m. The design nourishment beach profile is illustrated in Figure 38. Figure 38: Design nourishment beach profile Volume of Nourishment The beach profile adopted in the storm induced beach erosion simulations (Section 4.2.3) were adopted as the preliminary nourishment profile. The volume of beach nourishment was estimated based on the Equilibrium Beach Profile (EBP) methodology (Dean, 1991), assuming the nourishment grain size to be similar to that of the native sand (Figure 39): y = V h + B Advisian 49
67 where V = Volume of nourishment y = horizontal width of nourished material h = depth of closure B = berm height measured from the mean water level to the crest of the beach Surf zone width W is the horizontal distance from the beach crest to the depth of closure. Figure 39: Non-intersecting profiles (Dean, 1991) The approximate volume of sand require per linear metre of beach length for various crest widths is provided in Table 19. Table 19: Estimated Volume of nourishment required Crest width (m) Volume of Sand (m 3 )/m * *Preliminary design beach profile For the preliminary design beach profile with a crest width of 40 m, the estimated volume of sand is 336 m 3 /m. Note that the volumes shown in Table 19 do not account for potential overfill required if the nourishment sand differs from the native beach or if the fines are washed away during placement. Overfill could increase the nourishment volumes required by up to 40%. It is also noted that if the sourced sand is finer than the native beach, it would result in a gentler beach profile and require larger volumes of nourishment to achieve the same beach crest width as coarser sand (Dean, 1991). Advisian 50
68 5.1.4 Summary The net long term coastline retreat was found to be relatively gradual over most of the coastal frontage (approx. 1m-3m/year). Based on international experience an intervention of beach nourishment to restore the historical wider beach would be considered a feasible solution. This option, which obviates the incorporation of coastal structures, is the least aesthetically intrusive and would have minimal environmental impacts if properly implemented. In order for this solution to be successfully executed, adequate large scale initial capital nourishment will be required with regular beach maintenance to maintain the beach width. 5.2 Option 2: Groyne Field and Nourishment The conceptual layout for groyne field in combination with beach nourishment is illustrated in Figure 40. The methodology and estimated dimensions for this layout is presented in the subsections that follow Methodology The groyne field layout was developed based on the available site information, CEM (USACE, 2002) and (Van Rijn, 2013) guidelines. The CEM states that the main parameters to define a groyne field are: Length Elevation Porosity Orientation Spacing Sediment characteristics Wave and currents Although groynes have been around a long time and many references exist, most only provide a few rules of thumb: Groynes function best on beaches with pre-dominant longshore transport direction Groyne spacing should be about two to four times the groyne length Groyne fields should be filled (nourished) Sand by-passing depend on groyne length, permeability and elevation Groynes offer little reduction in wave energy to shore-normal waves during storms The width of the crest should not be smaller than 3m and at least 0.5m above MSL to allow the passage of construction equipment For the root of the groyne, the crest level should be approximately 0.5m above the required beach level Advisian 51

69 Figure 40: Groyne conceptual layout Advisian 52
70 The key variables adopted for the layout development are illustrated in Figure 41 and defined in Table 20. Table 20: Definition of groyne key variables Abbreviation Definition X g Groyne spacing Y g Cross-shore distance from nourished shoreline to tip of groyne W Design beach width Figure 41: Definition sketch of groyne key variables. Source: (USACE, 2002) Layout Dimensions The tip of the groynes was established within the active profile at a seabed elevation of approximately -4.0 m CD in order to allow some sediment by-pass and reduce overall costs. A groyne length of 300 m and spacing between breakwaters of 600 m (2 times the groyne length) was adopted in the conceptual layout. The actual groyne layout (length and spacing) was adjusted based on the bathymetric information and shoreline constraints. The groyne lengths could potentially be optimised through shoreline modelling in subsequent stages. Advisian 53
71 Initial beach nourishment of 40 m would be placed widening the back of the beach and additional nourishment would be added to form the expected coastline response. This would reduce the possible erosion of the coastline as it responds to changes to the wave climate caused by the structures Summary These structures would require a large volume of rock and would require additional site investigations such as physical modelling to verify their adequacy and stability. The structures are not well suited for low cross-shore sediment transport and currents induced near the groynes may remove sediment from the littoral drift zone. These structures are mainly used when the wave direction is oblique to the shoreline and where sediment transport is longshore dominant. This solution is not considered to be the most efficient solution for St Francis Bay s coastline. Advisian 54

72 5.3 Option 3: Detached Breakwaters and Nourishment The conceptual layout for detached breakwaters in combination with beach nourishment is illustrated in Figure 42. The methodology and estimated dimensions for this layout are presented in the sub-sections that follow. Figure 42: Detached breakwater conceptual layout Advisian 55
73 5.3.1 Methodology The detached breakwater layout was developed based on the available site information, the UK Environment Agency (Environment Agency UK, 2010) and CEM (USACE, 2002) guidelines. The predicted shoreline planform shape was obtained with MEPBAY (Klein, 2003) which determines the equilibrium beach alignment based on the parabolic bay-shape equations. MEPBAY (Klein, 2003) calculates the idealized shoreline planform of a headland-bay beach in static equilibrium based on the parabolic model. It then presents the results graphically on a screen display overlaying the image of the existing beach. It thus allows the stability of a headland-bay beach to be assessed visually by comparing the existing shoreline periphery with the static equilibrium planform. The software offers a friendly environment from simple input to instant visualization of the results. MEPBAY not only helps students understand the morphological process, but also provides engineers with a valuable tool for practical applications on shoreline protection and coastal management. The final layout was adjusted based on previous experience and engineering judgment. The key variables adopted for the layout development are illustrated in Figure 43 and described in Table 21. Figure 43: Definition sketch of nearshore breakwater key variables. Source: (USACE, 2002) Advisian 56
74 Table 21: Definition of nearshore breakwater key variables Abbreviation L S L G Y Y B Y S W d S Definition Length of breakwater Gap, distance between two adjacent breakwaters Cross-shore distance from shoreline to breakwater Cross-shore distance from shoreline to breaker line Salient size Design beach width Depth at breakwater structure Layout Dimensions A summary of the input and output parameters for the detached breakwater main dimensions are presented in Table 22. It was decided to keep the structure within the active profile at a seabed elevation of approximately -4.0 m CD in order to allow some sediment by-pass and reduce overall costs. Table 22: Input and output parameters for the detached breakwater solution Parameter Abbreviation Unit Value Notes Significant wave height exceeded 12h/y H m0 12h/yr m 3.4 Based on wave climate Peak wave period T P s 9.0 Based on wave climate Breakwater Location Depth of closure d C m CD Distance from beach crest to depth of closure Y dc m 450 Based on typical profile Distance from shoreline to structure Y m 300 Based on typical profile Depth at structure location d S m CD -4.0 Assumed Breakwater length and accretion Structure length/distance from shoreline to structure L S /Y For salient formation Structure length L S m Gap width/distance from shoreline to structure L G /Y To avoid erosion within the embayment Gap width L G Advisian 57
75 The configuration results in a detached breakwater located 300 m from the nourished shoreline with a length of 240 m and a gap between breakwaters of 240 m. This configuration was tested in MEPBAY and the final configuration is presented in Figure Summary The offshore breakwater structures would provide a high level of coastal protection and retention of sediment on the beaches. It would however require large and costly structures which would be environmentally intrusive and have a negative aesthetic impact on the coastline. Additionally it would require further site investigations and physical modelling to confirm the stability of the structures. This option would require a significant volume of sediment, making it sand hungry, and would be complex to construct due to the need for offshore marine equipment. While this option is considered to be excellent for coastal protection, financial demands and the long environmental study and construction durations makes this option less favourable for implementation. 5.4 Alternative Beach Nourishment Options: Headland Structures and Nourishment As noted above although beach nourishment alone is a possible solution for St Francis Bay it will require regular beach maintenance. The determination of this nourishment quantity will need further study in the detailed design stage, at which point it is expected to have further information on available sand sources. Advisian took the initiative to investigate possible alternatives to Option 1, whereby shoreline structures smaller than the groyne configuration (Option 2) are introduced to try to reduce the rate of sand loss and consequent maintenance nourishment. Also investigated was the benefit of restricting initial & maintenance nourishment to specific shoreline sections where the implementation is most beneficial. It needs to be clear that such options will not eliminate the need for ongoing maintenance nourishment. As depicted in (Figure 44) below two conceptual layouts were developed for so called headland structures in combination with beach nourishment: Option 1A: relatively long rock groynes angled obliquely to the predominant wave direction; Option 1B: shorter groynes. The methodology and layout dimensions for the two options are described in the sub-sections that follow. Advisian 58
 recommends using the parabolic bay-shape equations to determine embayment equilibrium shape.")
76 Figure 44: Headland and beach nourishment layout options Methodology No specific guidance exists for the development of a headland system. CEM (USACE, 2002) recommends using the parabolic bay-shape equations to determine embayment equilibrium shape. The layout was developed using MEPBAY (Klein, 2003) which determines the equilibrium beach alignment based on the parabolic bay-shape equations. A definition sketch of a headland system is presented in Figure 45. Two options have been developed for this concept and are presented in and Advisian 59
77 Figure 45: Definition sketch of artificial headland system. Source: (USACE, 2002) Option 1A This option provides rock groynes with similar overall length to Option 2, however, the groynes are angled obliquely to the predominant wave direction. The structures therefore terminate in shallower water than Option 2 (at approximately -3 m CD) and are expected to allow some sediment to bypass the cells. By terminating in shallower water the headland groynes have less volume and are therefore less costly and intrusive than the groyne option. They are also expected to have some advantages in retaining sediment in key areas of the frontage. The headland field conceptual layout for St. Francis bay is presented in Figure 46. For this option beach nourishment of 40 m would also be placed widening the back of the beach and additional nourishment would be added to form the expected coastline response. Advisian 60
78 Figure 46: Headlands conceptual layout Option 1A Advisian 61
79 5.4.3 Option 1B The second option consists of much shorter stub groynes which terminate at an approximate depth of -2 m CD or shallower. More sediment would bypass this Option 1B than Option 1A however the groynes should require less material and have a shorter construction duration than Option 1A. The second headland field conceptual layout for St. Francis bay is presented in Figure 47. Beach nourishment would be placed between the groynes as shown in Figure 47. It is advised not to reclaim the central section of the coastline as highlighted since the coastline orientation of the central section does not lend itself to a stable beach orientation. This area was found to be a divergence point for the sediment transport with sediment moving at the northern section to north and the southern section to the south. If this area needs to be protected and a beach reinstated, a T-shaped groyne structure may need to be constructed near the centre of this area Summary Option 1B is considered to be more suitable than Option 1A as it is less costly, could be implemented more easily in a phased approach, would require shorter construction duration and is less environmentally intrusive. It needs to be noted that the shoreline configurations depicted above are purely conceptual, based on engineering judgement and not coastal modelling. Although shoreline configurations of the selected option can be somewhat better assessed in the detailed design phase, there are limitations in the numerical and empirical modelling of such solutions. If such options are adopted there is benefit in phasing the implementation to effectively test effectiveness of an initial structure in prototype. Advisian 62

80 Figure 47: Headlands conceptual layout Option 1B Advisian 63
81 5.5 Options Comparison Cost comparison and Schedule During the workshop meeting high level cost estimates and the expected construction durations for the aforementioned options were presented (refer to Table 23 below). Rock for the groynes and breakwaters could either be sourced locally near Humansdorp or imported to St Francis from quarries near Port Elizabeth. It is known that the local quarry produces rock which has a tabular shape and may not be suitable for the marine structures or may require the designs to be adjusted. Further investigations will need to be undertaken to determine the suitability of the rock produced at the quarries. For the cost comparison it was assumed that the rock would be sourced from local quarries. Table 23: Cost and schedule comparison Option Cost 5 Duration Construction (months) 1: Beach Nourishment R72,000, A: Beach nourishment + Headland Option1A R174,000, B: Beach nourishment + Headland Option 1B R86,000, : Beach nourishment + Groyne fields R191,000, : Offshore breakwaters R363,000, The most cost effective option is beach nourishment only. This option would however require more maintenance than the other options. The most expensive option is the offshore breakwaters which offers the best level of coastal protection and would require the least maintenance. For assumptions used for the cost estimate refer to section Rock prices are based on a quotation received from the nearby SupaCrush Quarries, with no guarantee of rock suitability (size, shape and material) for marine construction. Advisian 64
82 5.5.2 Advantages and Disadvantages A summary of the advantages/disadvantages for each option described in the previous sections is presented in Table 24. Table 24: Summary of advantages/disadvantages for each option OPTION ADVANTAGES DISADVANTAGES 1. Nourishment Only 2. Groyne Field and Nourishment 3. Detached Breakwaters and Nourishment 1A. Headland Structures and Nourishment 1B. Headland Structures and Nourishment Soft solution (no hard structures) More economical compared to hard structures Simple construction Aesthetically attractive Least environmental impact Contains sediment in compartments, limits loss of sediment from St Francis Bay system High level of coastal protection Less beach maintenance expected Moderate level of coastal protection Additional area behind headland would be protected and could be used to create amenity features Angled alignment ensures some beach areas would be stable Offers both partial longshore and crossshore transport control More economical than Option 1A, 2 and 3. Angled alignment ensures some pockets will be stable Low environmental impact Staged approach Sand expected to be lost more rapidly Highest maintenance requirement Initial high levels of erosion Expensive Not suited for near perpendicular wave attack Can induce local currents Can cause downdrift erosion Interrupts traversing of beach More complex constructability Larger volumes of sand nourishment required Large visual impact May cause hazardous rip currents Expensive High level of environmental impact Some beach maintenance required Expensive Can induce local currents Moderate environmental impact Low level of coastal protection Beach maintenance required Sand in some stretches of coast will not be retained by coastal structures Advisian 65
83 5.6 Workshop Recommendation & Preferred Option Given all the considerations presented above, including a relatively low long term recession rate, Advisian recommended the following: Beach nourishment (Option1) to establish a beach width of approximately 40 m. Following the initial capital nourishment operation regular beach maintenance would still be required; An alternative recommended intervention would be: Headlands (Option 1B). This option could be implemented in various stages to evaluate performance & as finances become available. This option would still require regular beach maintenance, however, the short stub groynes would somewhat reduce the beach maintenance required. The consensus from the November workshop was that the latter option would be adopted, with the SFPO requesting that consideration be given to a staged solution, with an associated proposed sequence of implementation. Five (5) areas were identified as shown in Figure 48 with the fifth area being optional as this area is deemed to be unstable and not suitable for beach nourishment. Area 1 Area 2 Area 3 Area 4 650m beach nourishment 2x 200m groynes 300m beach nourishment 2x 170m groyne 300m beach nourishment 2x 170m groynes 400m beach nourishment Area 5 (optional) 650m beach nourishment Possible staged implementation of Headlands Options 2 is shown in Figure 48: Advisian 66
84 Figure 48: Staged implementation of Headlands Option 1B Advisian 67
85 The agreed preferred option was implementing nourishment and stub groyne structures in area 1 near the Spit. The solutions for the other areas would be implemented as and when finances become available. As the stub groynes will not extend to the full depth of closure and exact shoreline response is difficult to quantify through modelling, a staged approach will represent an excellent opportunity to evaluate the effectiveness of the stub groyne measures. By monitoring effectiveness of the initial stage in prototype, modifications could be made to subsequent areas prior to their implementation. Notwithstanding the initiation of beach restoration measures in area 1 the current Advisian advice is that shore armouring in the Spit area will still be required. This relates in part to the extent of time required to obtain environmental approvals & construct the solution, whereas permits are already approved for Phase 1 type shore armouring in this area. Advisian would need to carry out a separate study to better understand the implications of no dune armouring as well as implementation delays such as extended environmental approval periods and a staged nourishment exercise in Area 1. Advisian 68
86 6 Preliminary Design This chapter presents the preliminary design of the preferred option. The general layout, beach nourishment, staged implementation, expected costs, construction programme and the hydraulic stability calculations for the preferred solution is discussed. Three typical sections have been developed for groynes at seabed levels of -2 m CD, -1 m CD and for the back of the beach. An intermediate damage level, S D, was adopted since groynes are not critical structures and will perform its functional requirements even in case of some damage. The crest level was defined at +2.1 m CD (HAT) in order for the groynes to be constructed using land based plant. The width of the crest is defined as 3xD n50 rocks as per recommendations of (CIRIA/CUR/CETMEF, 2007) and (USACE, 2002). The concept layout of the staged development as shown in Figure 48 above was further developed during the preliminary design. Coastal modelling demonstrated that the southernmost groyne of the second stage was not overly beneficial, hence this structure was removed as shown in Figure 49 below. The effectiveness of the single groyne would need to be monitored during the implementation of this stage and the need for the second groyne would be re-evaluated during the implementation of the third stage. Advisian 69
87 Figure 49: Revised staged solution Advisian 70

88 6.1 Beach nourishment A minimum horizontal dry beach width of 40 m was adopted in the design. The nourishment design beach profile is shown in Section 5.1.2, Figure 38. This will allow the short term horizontal movement of the shoreline of 15 m (Section 3.2) and the estimated extreme storm induced erosion of 15 m while maintaining a minimum beach width of approximately 10 m. 6.2 General Layout The general layout plan were developed using the results from the lonshore numerical modelling and guidelines provided in the (USACE, 2002), (CIRIA/CUR/CETMEF, 2007) and (Van Rijn, 2013). The preliminary design layout drawing are included in Appendix A. Figure 50: General Layout Plan (Appendix A) The tips of the groynes are within the surf zone allowing for some sand bypassing of the structure. The groynes are spaced approximately two to three times their length apart. To present outflanking of the groynes during storm events the root of the groynes are extended to the back of the beach. Beach nourishment will be placed between the groynes and is extended 50 m further on either side of the groynes in order to reduce possible further erosion of the adjacent unnourished downstream beaches. Advisian 71
89 6.3 Rock Groynes The rock groynes are designed to have three distinct sections with the rock armour increasing as the groynes advance into deeper water and encounter larger wave conditions. The sections are applied to the following water depths: 1. Section A: Between back of the beach until 0 m CD (shown in Figure 51) 2. Section B: Between 0 m CD until -1 m CD (shown in Figure 52) 3. Section C: Between -1 m CD until -2 m CD (shown in Figure 53 ) Figure 51: Groyne Section A Figure 52: Groyne Section B Advisian 72
90 Figure 53: Groyne Section C For more detail of the sections please refer to the drawing in Appendix A. 6.4 Armour Stability Armour stability was calculated based on the Van der Meer deep water equations and the Van der Meer and Van Gent shallow water equations (CIRIA/CUR/CETMEF, 2007) Section at -2 m CD The input design parameters for the rock armour stability calculation are listed in Table 25. The required median rock size is 3,176 kg. A non-standard rock grading of 2.2 to 4.6 tonne (TYPE I) will therefore be stable. The grading will be refined during detailed design based on the availability of rock from the local quarries and guidelines provided in The Rock Manual. Advisian 73
91 Table 25: Rock armour design parameters Section at -2.0 m CD Parameter Abbreviation Seabed elevation h -2.0 m CD Design High Water Level DHWL +2.9 m CD Spectral significant (breaking) wave height H m0 3.0 m Significant wave height H S 3.1 m 2% exceedance wave height H 2% 3.8 m Spectral wave period T m-1, s Density of sea water ρ s 1,025 kg/m 3 Density of rock ρ r 2,650 kg/m 3 Number of waves in 6h N 2178 Damage parameter S d 5 Notional permeability P 0.4 Water depth at toe of structure to significant wave height ratio h t /H s [1.6<3] (Shallow water) Armour slope cot α 1V:2.5H Median rock mass W 50 3,176 kg Section at -1 m CD The input design parameters for the rock armour stability calculation are listed in Table 26. The required median rock size is 1,920 kg. A non-standard rock grading of 1.3 to 2.8 tonne (TYPE II) will therefore be stable. The grading will be refined during detailed design based on the availability of rock from the local quarries and guidelines provided in The Rock Manual. Advisian 74
92 Table 26: Rock armour design parameters Section at -1.0mCD Parameter Abbreviation Seabed elevation h -1.0 m CD Design High Water Level DHWL +2.9 m CD Spectral significant (breaking) wave height H m0 2.4 m Significant wave height H S 2.48 m 2% exceedance wave height H 2% 3.04 m Spectral wave period T m-1, s Density of sea water ρ s 1,025 kg/m 3 Density of rock ρ r 2,650 kg/m 3 Number of waves in 6h N 2178 Damage parameter S d 5 Notional permeability P 0.5 Water depth at toe of structure to significant wave height ratio h t /H s [1.6<3] (Shallow water) Armour slope cot α 1V:2.5H Median rock mass W 50 1,920 kg Section at 0 m CD The input design parameters for the rock armour stability calculation are listed in Table 26. The required median rock size is 650 kg. A non-standard rock grading of 500 kg to 900 tonne (TYPE III) will therefore be stable. The grading will be refined during detailed design based on the availability of rock from the local quarries and guidelines provided in The Rock Manual. Advisian 75
93 Table 27: Rock armour design parameters Section at -1.0 m CD Parameter Abbreviation Seabed elevation h 0.0 m CD Design High Water Level DHWL +2.9 m CD Spectral significant (breaking) wave height H m0 1.8 m Significant wave height H S 1.86 m 2% exceedance wave height H 2% 2.28 m Spectral wave period T m-1, s Density of sea water ρ s 1,025 kg/m 3 Density of rock ρ r 2,650 kg/m 3 Number of waves in 6h N 2178 Damage parameter S d 5 Notional permeability P 0.5 Water depth at toe of structure to significant wave height ratio h t /H s [1.6<3] (Shallow water) Armour slope cot α 1V:2.5H Median rock mass W kg Toe and apron stability The toe armour is designed the methods as presented in (CIRIA/CUR/CETMEF, 2007) using the lowest non-zero proposed value of the damage parameter, N od = 0.5, corresponding to the start of damage. The apron is designed taking N od = 2, corresponding to some reshaping of the berm. The toe width was defined as 3 x D n50 rocks. The required toe stability median rock size was found to be less than the median rock size required for the primary armour. In order to reduce the complexity during the construction it was decided to keep the toe armour the same as the primary armour. Advisian 76
94 6.5 Estimated Quantities The approximate quantities of material required for the preliminary design is provided in Table 28 below. Table 28: Estimated quantities Option Rock W50= 3.2t (m 3 ) Rock W50= 1.92t (m 3 ) Rock W50= 650kg (m 3 ) Rock Core (m 3 ) Sand (m 3 ) Complete Solution 13,750 9,900 11,300 6, ,000 Area 1 5,500 3,300 4,700 2, ,000 Area 2 2,750 1,650 2,350 1, ,000 Area 3 5,500 3,300 4,700 2, ,000 Area 4 134,000 **Area 5 (Optional) 218,000 * The Complete Solution excludes the development of Area 5. **Area 5 may experience high levels of erosion and require significantly more beach maintenance than the other 4 areas. This area is not recommended for further development. 6.6 Cost Estimates The cost estimates are provided in Table 29 for both a staged and non-staged approach. Rock could either be sourced locally near Humansdorp or imported to St Francis from quarries near Port Elizabeth. It is known that the local quarry produces rock which has a tabular shape and may not be suitable for the marine structures or may require the designs to be adjusted. Further investigations will need to be undertaken to determine the suitability of the rock produced at the quarries. For the cost estimate it was assumed that the rock would be sourced from local quarries. Advisian 77
95 Table 29: Cost Estimate Option Cost 6 *Complete Solution R89,000,000 Area 1 R38,000,000 Area 2 R24,000,000 Area 3 R26,000,000 Area 4 R11,000,000 **Area 5 (Optional) R17,000,000 * The Complete Solution excludes the development of Area 5. ** Area 5 may experience high levels of erosion and require significantly more beach maintenance than the other 4 areas. This area is not recommended for further development. It may cost between 10-15% more to implement the solution in stages rather than one complete solution. Additional costs due to inflation must also be considered. It should be noted that the following assumptions were made in preparing the preliminary cost estimate: All rates are exclusive of VAT Sand pumping rate to the beach: R 58.85/m 3 Supply of rock to site (larger than 1t): R 266/t Supply of rock (smaller than 1t): R 171/t P&Gs: 10% Contingency: 10% 6 Rock prices are based on a quotation received from the nearby SupaCrush Quarries, with no guarantee of rock suitability (size, shape and material) for marine construction. Advisian 78
96 6.7 Construction Duration The approximate construction duration for the various areas are provided in the Table 30 below. The groyne construction and nourishment would be undertaken concurrently. Table 30: Estimated Construction Duration Option Lead time (months ) Mobilisatio n (months) Groyne Construction (months) Nourishment (months) Demobilisation (months) Total Construction Duration (months) *Complete Solution Area Area Area Area **Area * The Complete Solution excludes the development of Area 5. **Optional Area which may experience high levels of erosion and require significantly more beach maintenance than the other 4 areas. This area is not recommended for further development. Advisian 79
97 7 The Way Forward This report presents the preliminary design for St. Francis coastal protection project. It includes the basis of design used to undertaken the design and modelling of coastal protection solutions. Several layout options were identified and evaluated for suitability to provide a beach amenity at St Francis Bay. The preferred layouts and shore configurations were at this stage derived based on empirical formulations, initial numerical modelling and engineering judgement. The preferred layout will be further assessed during the detailed design with more refined numerical modelling of shoreline evolution behaviour. Typical beach profiles and coastal structure cross-sections were developed based on the available information with the purpose of providing information for costing. The structural sections will be further developed in the detailed design stage based on: Material availability; Constructability; High resolution bathymetry data, if required; Bed geotechnical characteristics (if available) Way forward: 1) Update sediment transport modelling; 2) Detailed design of rock groynes (based on available topography / bathymetry); 3) Update beach nourishment design based on sand source investigation (to be undertaken by SFPO); 4) Updated beach nourishment volumes based on existing topography / bathymetry; 5) Produce detailed design drawings. The following additional studies and investigations will be required in order to complete the detailed design and/or prior to the construction of the preferred solution which is not part of current study: a) Detailed bathymetric survey, if required; b) Shore protection design of spit area; c) Suitability study of rock sources; d) Sand source investigation; e) Environmental Impact Assessment. Advisian 80
98 8 References Anderson, D. R. (2008). A Hybrid Approach To Beach Erosion Mitigation and Amenity Enhancement, St Francis. Nelson Mandela Metropolitan University. ASR. (2006). ST FRANCIS BAY BEACH PROJECT: Investigations into the Application of Multi- Purpose Reefs at St Francis Beach for Coastal Protection and Amenity Enhancement. SR Ltd Marine Consulting and Reseach. CIRIA/CUR/CETMEF. (2007). The Rock Manual, the use of rock in hydraulic engineering (2nd Edition). London: C683 CIRIA. Codiga, D. (2011). Unified Tidal Analysis and Prediction Using the UTide Matlab Functions. Technical Report. Narragansett, RI. : Graduate School of Oceanography, University of Rhode Island. Dean, R. G. (1991). Equilibrium Beach Profiles: Characteristics and Applications. Journal of Coastal Research, Entech. (2002). St Francis Bay Proposed Beach Restoration Specialist Report. Environment Agency UK. (2010). Guidance for outline design of nearshore detached breakwaters on sandy macro-tidal coasts. Bristol: Environment Agency. Hawkes, P., & Svensson, C. (2003). Joint Probability: Dependence Mapping and Best Practice. IPCC. (2013). Climate Change 2013: The Physical Science Basis. Judith Bosboom, M. J. (2012). Coastal Dynamics I. TU Delft. Kamphuis, J. (2000). Introduction to Coastal Engineering and Management - Advanced Series on Ocean Engineering: Volume 16. Singapore: World Scientific. Klein, A. V. (2003). Visual Assessment of bayed beach stability with computer software. Computers and Geosciences 29, Larson, M., Kraus, N. C., & Byrnes, M. (1990). SBEACH Numerical Model for Simulating Storm Induced Beach Change Report2. Numerical Formulations and Model Tests. Advisian 81
99 PRDW. (March 2015). St Francis Bay Revetment Repair And Upgrade, Detailed Design Report. Cape Town. PRDW. (July 2015). St Francis Bay Revetment Upgrade Extension, Detailed Design Report. Cape Town. R. Hallemeier. (1983). A profile zonation for seasnoal sand beaches from wave climate. Coastal Engineering, vol. 7, pp Rijn, L. C. (2013, Oct). Design of hard coastal structures against erosion. Retrieved from Soulsby, R. (1997). Dynamics of marine sands, a manual for practical applications. London: Thomas Telford. The SA Navy Hydrographer. (2017, July 31). Tide Information. Retrieved from South African Navy Hydrographic Office: UHSLC. (2017, 10 2). University of Hawaii Sea Level Center. (n.d.) Retrieved 2 10, 2017, from uhslc.soest.hawaii.edu USACE. (2002). Coastal Engineering Manual (CEM), Engineer Manual EM Washington. Van Rijn, L. C. (2013, Oct). Design of hard coastal structures against erosion. Retrieved from WorleyParsons. (2014). Investigation of the St. Francis Bay Spit and Beach Erosion Problems - Review of Previous Studies and Investigations and Assessment of Potential Remedial Options. Bellville. Advisian 82
100 Appendix A Drawings Advisian 83
101 Appendix B cast Analysis Offshore Hind- Advisian 84
102 Offshore Wind Data The wind roses and frequency tables for the three offshore wind locations shown in Figure B 1 are presented in this Appendix. Figure B 1: Offshore Winds Location Map Advisian 85
103 Wind Direction, WD ( o N) St Francis Property Owners Figure B 2: GDAS Wind - Annual Wind Rose Table B 1: GDAS Wind Frequency Table Wind speed, WS (m/s) December 0 > 0-3 > 3-6 > 6-9 > 9-12 > > > > > 24 All WS Cum WS N NNE NE ENE E ESE SE SSE S SSW SW WSW W WNW NW NNW All WD Cum WD Advisian 86
104 Wind Direction, WD ( o N) St Francis Property Owners Figure B 3: NWW3 Wind1 - Annual Wind Rose Table B 2: NWW3 Wind1 Frequency Table Annual Wind speed, WS (m/s) 0 > 0-4 > 4-8 > 8-12 > > > > > 28 All WS Cum WS N NNE NE ENE E ESE SE SSE S SSW SW WSW W WNW NW NNW All WD Cum WD Advisian 87
105 Wind Direction, WD ( o N) St Francis Property Owners Figure B 4: NWW3 Wind2 - Annual Wind Rose Table B 3: NWW3 Wind2 Frequency Table Annual Wind speed, WS (m/s) 0 > 0-4 > 4-8 > 8-12 > > > > > 28 All WS Cum WS N NNE NE ENE E ESE SE SSE S SSW SW WSW W WNW NW NNW All WD Cum WD Advisian 88

106 Offshore Wave Data The wind roses and frequency tables for the three offshore wind locations shown in Figure E 5 are presented below. Figure E 5: Location map for offshore waves Advisian 89
107 Figure E 6: NWW3 Wave 1 Annual Wave Rose Advisian 90
108 Mean Wave Direction, MWD ( o N, from) Significant Wave Height, Hs (m) Mean Wave Direction, MWD ( o N, from) St Francis Property Owners Table E 4: NWW3 Wave 1 Mean Wave Direction (MWD) vs Significant Wave Height Frequency Tables Annual Significant Wave Height, H s (m) < 1 > 1-2 > 2-3 > 3-4 > 4-5 > 5-6 > 6-7 > 7-8 > 8-9 > 9-10 > > > 12 All Hs Cum Hs N NNE NE ENE E ESE SE SSE S SSW SW WSW W WNW NW NNW All Dir Cum Dir Table E 5: NWW3 Wave 1 Significant Wave Height vs Wave Peak Period Frequency Tables Annual Wave Peak Period, T P (s) < 2 > 2-4 > 4-6 > 6-8 > 8-10 > > > > > > 20 All T P Cum T P < > > > > > > > > > > > > All H s Cum H s Table E 6: NWW3 Wave 1 Mean Wave Direction (MWD) vs Wave Peak Period Frequency Tables Annual Wave Peak Period, T P (s) < 2 > 2-4 > 4-6 > 6-8 > 8-10 > > > > > > 20 All T P Cum T P N NNE NE ENE E ESE SE SSE S SSW SW WSW W WNW NW NNW All Dir Cum Dir Advisian 91
109 Figure B 7: NWW3 Wave 2 - Annual Wave Rose Advisian 92
110 Mean Wave Direction, MWD ( o N, from) Significant Wave Height, Hs (m) Mean Wave Direction, MWD ( o N, from) St Francis Property Owners Table B 7: NWW3 Wave 2 Mean Wave Direction (MWD) vs Significant Wave Height Frequency Tables Annual Significant Wave Height, H s (m) < 1 > 1-2 > 2-3 > 3-4 > 4-5 > 5-6 > 6-7 > 7-8 > 8-9 > 9-10 > > > 12 All Hs Cum Hs N NNE NE ENE E ESE SE SSE S SSW SW WSW W WNW NW NNW All Dir Cum Dir Table B 8: NWW3 Wave 2 Significant Wave Height vs Wave Peak Period Frequency Tables Annual Wave Peak Period, T P (s) < 2 > 2-4 > 4-6 > 6-8 > 8-10 > > > > > > 20 All T P Cum T P < > > > > > > > > > > > > All H s Cum H s Table B 9: NWW3 Wave 2 Mean Wave Direction (MWD) vs Wave Peak Period Frequency Tables Annual Wave Peak Period, T P (s) < 2 > 2-4 > 4-6 > 6-8 > 8-10 > > > > > > 20 All T P Cum T P N NNE NE ENE E ESE SE SSE S SSW SW WSW W WNW NW NNW All Dir Cum Dir Advisian 93
111 Appendix C Analysis Nearshore Wave Advisian 94
. Figure C 1 Nearshore Wave Climate Locations The associated wave roses at each location are presented below. Advisian 95")
112 Nearshore Wave Analysis The nearshore wave climate at the locations P03 to P17 (along -10 m CD depth contour) shown in Figure C 1 were utilised in the long-shore sediment transport simulations (UNIBEST). Figure C 1 Nearshore Wave Climate Locations The associated wave roses at each location are presented below. Advisian 95
113 Advisian 96
114 Advisian 97
115 Advisian 98
116 Advisian 99
117 Appendix D Modelling UNIBEST Software Advisian 100
118 The coastal evolution modelling software used in this study is UNIBEST-CL+. UNIBEST is a software package developed by Deltares capable of simulating longshore and cross-shore processes and related morphodynamics of beach profiles and coastline evolution. It constitutes a powerful coastal engineering tool to be used in coastal erosion control and coastal management. The UNIBEST software suite consists of three separate modules: UNIBEST-TC: Designed for the computation of cross-shore transport and resulting beach changes induced by waves, tidal currents and wind; UNIBEST-DE: Designed for the computation of dune erosion during storm conditions; and UNIBEST-CL+: Designed for the simulation of coastline changes due to longshore sediment transport gradients. The longshore transports are induced by tide and wave driven longshore currents. UNIBEST-CL+ consists of two integrated sub-modules: The Longshore Transport module (LT-module) is designed to compute tide- and wave-induced longshore currents and sediment transports on an alongshore uniform beach with an arbitrary profile. The surf zone dynamics are derived from a built-in random wave propagation and decay model that transforms the offshore wave data to the coast. The computational procedure takes any pre-defined wave climate and tidal regime in order to assess gross and yearly longshore transport, seasonal variation and storm events. The Coastline module (CL-module) is designed to simulate the coastline changes due to longshore sediment transport gradients of an alongshore nearly uniform coast on the basis of the single line theory. The CL-module is capable of modelling the morphologic effects of various coastal situations: Sediment sources and sinks; Headlands; Coastal revetments and sea walls; Groynes and breakwaters; Offshore breakwaters; Artificial sand by-pass; and Beach nourishments. Advisian 101
119 Appendix E Analysis Beach Profile Advisian 102


120 The horizontal movement of the elevation contours over time is presented in this Appendix for profiles nr. 26, 22, 18, 13 and 4 as indicated in the figure below. Advisian 103

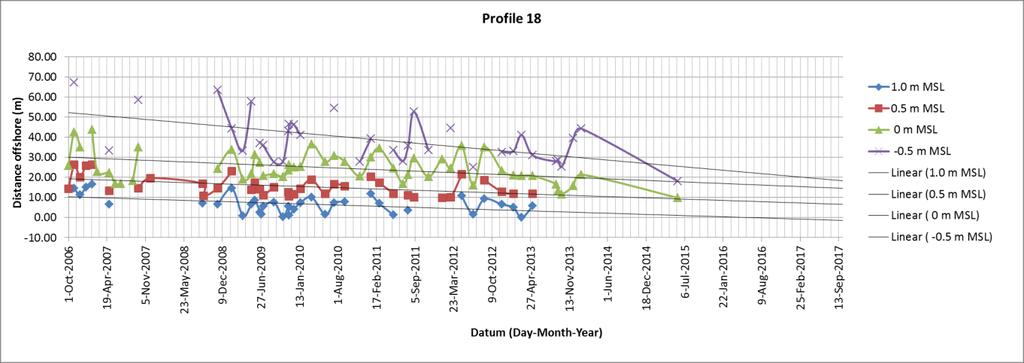
121 Advisian 104


122 For the profiles presented, the average yearly rates of retreat were estimated as shown in the table below. As the survey taken in 2017 indicates significant erosion between 2015 and 2017, likely the result of one or more significant storm events, the rates were estimated with and without the 2017 survey. It is evident that due to the significant erosion between 2015 and 2017, the average yearly retreat increases and almost reverses the accretion observed in the south (Profile 4). Advisian 105
HURRICANE SANDY LIMITED REEVALUATION REPORT UNION BEACH, NEW JERSEY DRAFT ENGINEERING APPENDIX SUB APPENDIX D SBEACH MODELING
 HURRICANE SANDY LIMITED REEVALUATION REPORT UNION BEACH, NEW JERSEY DRAFT ENGINEERING APPENDIX SUB APPENDIX D SBEACH MODELING Rev. 18 Feb 2015 1 SBEACH Modeling 1.0 Introduction Following the methodology
IMPACTS OF COASTAL PROTECTION STRATEGIES ON THE COASTS OF CRETE: NUMERICAL EXPERIMENTS
 IMPACTS OF COASTAL PROTECTION STRATEGIES ON THE COASTS OF CRETE: NUMERICAL EXPERIMENTS Tsanis, I.K., Saied, U.M., Valavanis V. Department of Environmental Engineering, Technical University of Crete, Chania,
SELECTION OF THE PREFERRED MANAGEMENT OPTION FOR STOCKTON BEACH APPLICATION OF 2D COASTAL PROCESSES MODELLING
 SELECTION OF THE PREFERRED MANAGEMENT OPTION FOR STOCKTON BEACH APPLICATION OF 2D COASTAL PROCESSES MODELLING C Allery 1 1 DHI Water and Environment, Sydney, NSW Abstract This paper presents an approach
Town of Duck, North Carolina
 Tracking No. 00.00.2010 Erosion Mitigation And Shoreline Management Feasibility Study Town of Duck, North Carolina Coastal Planning & Engineering of North Carolina August 15, 2012 Tom Jarrett Robert Neal
Inlet Management Study for Pass-A-Grille and Bunces Pass, Pinellas County, Florida
 Inlet Management Study for Pass-A-Grille and Bunces Pass, Pinellas County, Florida Final Report Submitted By Ping Wang, Ph.D., Jun Cheng Ph.D., Zachary Westfall, and Mathieu Vallee Coastal Research Laboratory
Volume and Shoreline Changes along Pinellas County Beaches during Tropical Storm Debby
 Volume and Shoreline Changes along Pinellas County Beaches during Tropical Storm Debby Ping Wang and Tiffany M. Roberts Coastal Research Laboratory University of South Florida July 24, 2012 Introduction
OECS Regional Engineering Workshop September 29 October 3, 2014
 B E A C H E S. M A R I N A S. D E S I G N. C O N S T R U C T I O N. OECS Regional Engineering Workshop September 29 October 3, 2014 Coastal Erosion and Sea Defense: Introduction to Coastal/Marine Structures
EVALUATION OF BEACH EROSION UP-DRIFT OF TIDAL INLETS IN SOUTHWEST AND CENTRAL FLORIDA, USA. Mohamed A. Dabees 1 and Brett D.
 EVALUATION OF BEACH EROSION UP-DRIFT OF TIDAL INLETS IN SOUTHWEST AND CENTRAL FLORIDA, USA Mohamed A. Dabees 1 and Brett D. Moore 1 The paper discusses the analysis of up-drift beach erosion near selected
INTRODUCTION TO COASTAL ENGINEERING
 The University of the West Indies Organization of American States PROFESSIONAL DEVELOPMENT PROGRAMME: COASTAL INFRASTRUCTURE DESIGN, CONSTRUCTION AND MAINTENANCE A COURSE IN COASTAL DEFENSE SYSTEMS I CHAPTER
Long Beach Island Holgate Spit Little Egg Inlet Historical Evolution Introduction Longshore Transport Map, Survey and Photo Historic Sequence
 Appendix B Long Beach Island Holgate Spit Little Egg Inlet Historical Evolution Introduction The undeveloped southern end of Long Beach Island (LBI) is referred to as the Holgate spit as it adjoins the
Appendix E Cat Island Borrow Area Analysis
 Appendix E Cat Island Borrow Area Analysis ERDC/CHL Letter Report 1 Cat Island Borrow Area Analysis Multiple borrow area configurations were considered for Cat Island restoration. Borrow area CI1 is located
CROSS-SHORE SEDIMENT PROCESSES
 The University of the West Indies Organization of American States PROFESSIONAL DEVELOPMENT PROGRAMME: COASTAL INFRASTRUCTURE DESIGN, CONSTRUCTION AND MAINTENANCE A COURSE IN COASTAL DEFENSE SYSTEMS I CHAPTER
April 7, Prepared for: The Caribbean Disaster Emergency Response Agency Prepared by: CEAC Solutions Co. Ltd.
 April 7, 2006 Prepared for: The Caribbean Disaster Emergency Response Agency Prepared by: Introduction CEAC Solutions Co. Ltd was commissioned in May 2005 to prepare coastal beach erosion hazard maps for
Australian Coastal Councils Conference
 Australian Coastal Councils Conference Kiama March 2019 Where Has My Beach Gone? (and what can I do about it?) Dr Andrew McCowan Water Technology Where Has My Beach Gone? Where Has My Beach Gone? Where
SACO RIVER AND CAMP ELLIS BEACH SACO, MAINE SECTION 111 SHORE DAMAGE MITIGATION PROJECT APPENDIX F ECONOMIC ASSESSMENT
 SACO RIVER AND CAMP ELLIS BEACH SACO, MAINE SECTION 111 SHORE DAMAGE MITIGATION PROJECT APPENDIX F ECONOMIC ASSESSMENT Department of the Army New England District, Corps of Engineers 696 Virginia Road
Julebæk Strand. Effect full beach nourishment
 Julebæk Strand Effect full beach nourishment Aim of Study This study is a part of the COADAPT funding and the aim of the study is to analyze the effect of beach nourishment. In order to investigate the
Available online at ScienceDirect. Procedia Engineering 116 (2015 )
") Available online at www.sciencedirect.com ScienceDirect Procedia Engineering 116 (2015 ) 320 325 8th International Conference on Asian and Pacific Coasts (APAC 2015) Department of Ocean Engineering, IIT
Available online at www.sciencedirect.com ScienceDirect Procedia Engineering 116 (2015 ) 320 325 8th International Conference on Asian and Pacific Coasts (APAC 2015) Department of Ocean Engineering, IIT
Shoreline Response to an Offshore Wave Screen, Blairgowrie Safe Boat Harbour, Victoria, Australia
 Shoreline Response to an Offshore Wave Screen, Blairgowrie Safe Boat Harbour, Victoria, Australia T.R. Atkins and R. Mocke Maritime Group, Sinclair Knight Merz, P.O. Box H615, Perth 6001, Australia ABSTRACT
DUXBURY WAVE MODELING STUDY
 DUXBURY WAVE MODELING STUDY 2008 Status Report Duncan M. FitzGerald Peter S. Rosen Boston University Northeaster University Boston, MA 02215 Boston, MA 02115 Submitted to: DUXBURY BEACH RESERVATION November
Figure 4, Photo mosaic taken on February 14 about an hour before sunset near low tide.
 The Impact on Great South Bay of the Breach at Old Inlet Charles N. Flagg and Roger Flood School of Marine and Atmospheric Sciences, Stony Brook University Since the last report was issued on January 31
BYPASS HARBOURS AT LITTORAL TRANSPORT COASTS
 BYPASS HARBOURS AT LITTORAL TRANSPORT COASTS by K. Mangor 1, I. Brøker 2, R. Deigaard 3 and N. Grunnet 4 ABSTRACT Maintaining sufficient navigation depth in front of the entrance at harbours on littoral
Low-crested offshore breakwaters: a functional tool for beach management
 Environmental Problems in Coastal Regions VI 237 Low-crested offshore breakwaters: a functional tool for beach management K. Spyropoulos & E. Andrianis TRITON Consulting Engineers, Greece Abstract Beach
CHAPTER 134 INTRODUCTION
 CHAPTER 134 NEW JETTIES FOR TUNG-KANG FISHING HARBOR, TAIWAN Chi-Fu Su Manager Engineering Department Taiwan Fisheries Consultants, Inc. Taipei, Taiwan INTRODUCTION Tung-Kang Fishing Harbor, which is about
To: William Woods, Jenni Austin Job No: CentrePort Harbour Deepening Project - Comments on community queries
 Memo To: William Woods, Jenni Austin From: Richard Reinen-Hamill Date: Subject: cc: 1 Purpose This memo sets out our response to issues raised at and after Seatoun community consultation sessions held
Bay County, MI Coastal Hazard Analysis Flood Risk Review Meeting. May 14, 2018
 Bay County, MI Coastal Hazard Analysis Flood Risk Review Meeting May 14, 2018 Agenda Introductions Coastal Flood Risk Study and Mapping Program Current Status Technical Overview of Study and Mapping Floodplain
STATUS REPORT FOR THE SUBMERGED REEF BALL TM ARTIFICIAL REEF SUBMERGED BREAKWATER BEACH STABILIZATION PROJECT FOR THE GRAND CAYMAN MARRIOTT HOTEL
 August 23 STATUS REPORT FOR THE SUBMERGED REEF BALL TM ARTIFICIAL REEF SUBMERGED BREAKWATER BEACH STABILIZATION PROJECT FOR THE GRAND CAYMAN MARRIOTT HOTEL performed by Lee E. Harris, Ph.D., P.E. Consulting
Technical Brief - Wave Uprush Analysis Island Harbour Club, Gananoque, Ontario
 Technical Brief - Wave Uprush Analysis RIGGS ENGINEERING LTD. 1240 Commissioners Road West Suite 205 London, Ontario N6K 1C7 October 31, 2014 Table of Contents Section Page Table of Contents... i List
BILLY BISHOP TORONTO CITY AIRPORT PRELIMINARY RUNWAY DESIGN COASTAL ENGINEERING STUDY
 Bâtiment Infrastructures municipales Transport Industriel Énergie Environnement BILLY BISHOP TORONTO CITY AIRPORT PRELIMINARY RUNWAY DESIGN COASTAL ENGINEERING STUDY N. Guillemette 1, C. Glodowski 1, P.
INTRODUCTION TO COASTAL ENGINEERING AND MANAGEMENT
 Advanced Series on Ocean Engineering Volume 16 INTRODUCTION TO COASTAL ENGINEERING AND MANAGEMENT J. William Kamphuis Queen's University, Canada World Scientific Singapore New Jersey London Hong Kong Contents
Technical Brief - Wave Uprush Analysis 129 South Street, Gananoque
 Technical Brief - Wave Uprush Analysis 129 South Street, Gananoque RIGGS ENGINEERING LTD. 1240 Commissioners Road West Suite 205 London, Ontario N6K 1C7 June 12, 2013 Table of Contents Section Page Table
CHAPTER 8 ASSESSMENT OF COASTAL VULNERABILITY INDEX
 124 CHAPTER 8 ASSESSMENT OF COASTAL VULNERABILITY INDEX 8.1 INTRODUCTION In order to assess the vulnerability of the shoreline considered under this study against the changing environmental conditions,
SHORE PROTECTION AND HABITAT CREATION AT SHAMROCK ISLAND, TEXAS ABSTRACT
 SHORE PROTECTION AND HABITAT CREATION AT SHAMROCK ISLAND, TEXAS M. Cameron Perry, P.E., and Daniel J. Heilman, P.E. Coastal Engineer Shiner Moseley & Associates., Inc. 555 N. Carancahua Corpus Christi,
Appendix M: Durras Lake Tailwater Conditions
 Appendix M: Durras Lake Tailwater Conditions M.1 Preamble WRL has completed a tailwater condition assessment for the entrance to Durras Lake, to be used as an ocean boundary condition for a future flood
FEMA Region V. Great Lakes Coastal Flood Study. Pilot Study Webinar. Berrien County, Michigan. February 26, 2014
 FEMA Region V Great Lakes Coastal Flood Study Pilot Study Webinar Berrien County, Michigan February 26, 2014 2 Pilot Study Webinar Agenda Great Lakes Coastal Flood Study Background Demonstration Project
Currents measurements in the coast of Montevideo, Uruguay
 Currents measurements in the coast of Montevideo, Uruguay M. Fossati, D. Bellón, E. Lorenzo & I. Piedra-Cueva Fluid Mechanics and Environmental Engineering Institute (IMFIA), School of Engineering, Research
Modeling Sediment Transport Along the Upper Texas Coast
 Modeling Sediment Transport Along the Upper Texas Coast David B. King Jr. Jeffery P. Waters William R. Curtis Highway 87 roadbed, Jefferson County Galveston District Corps Sabine Pass to San Luis Pass
Appendix D: SWAN Wave Modelling
 Appendix D: SWAN Wave Modelling D.1 Preamble The Eurobodalla Shire Council area is subject to extreme waves originating from offshore storms. When swell waves approach the coast, they are modified by the
Cross-shore sediment transports on a cut profile for large scale land reclamations
 Cross-shore sediment transports on a cut profile for large scale land reclamations Martijn Onderwater 1 Dano Roelvink Jan van de Graaff 3 Abstract When building a large scale land reclamation, the safest
Taranaki Tsunami Inundation Analysis. Prepared for Taranaki Civil Defence Emergency Management Group. Final Version
 Taranaki Tsunami Inundation Analysis Prepared for Taranaki Civil Defence Emergency Management Group Final Version June 2012 AM 12/07 HBRC Plan Number 4362 Asset Management Group Technical Report Prepared
OECS Regional Engineering Workshop September 29 October 3, 2014
 B E A C H E S. M A R I N A S. D E S I G N. C O N S T R U C T I O N. OECS Regional Engineering Workshop September 29 October 3, 2014 Coastal Erosion and Sea Defense: Introduction to Coastal Dynamics David
Q1. What are the primary causes/contributors to coastal erosion at Westshore and the concept of longshore / littoral drift.
 Q1. What are the primary causes/contributors to coastal erosion at Westshore and the concept of longshore / littoral drift. In order of (timing related) contribution to present problem 1. Beach is too
Coastal Wave Studies FY13 Summary Report
 DISTRIBUTION STATEMENT A. Approved for public release; distribution is unlimited. Coastal Wave Studies FY13 Summary Report Jeffrey L. Hanson US Army Corps of Engineers, Field Research Facility 1261 Duck
: Hydrodynamic input for 2D Vessel Simulations (HY- 0027)
") Technical Note To : Christian Taylor (PoHDA) From : Rohan Hudson Cc : Ben Gray Date : 1/04/2015 (Final Draft) Subject : Hydrodynamic input for 2D Vessel Simulations (HY- 0027) Introduction This Technical
Technical Note To : Christian Taylor (PoHDA) From : Rohan Hudson Cc : Ben Gray Date : 1/04/2015 (Final Draft) Subject : Hydrodynamic input for 2D Vessel Simulations (HY- 0027) Introduction This Technical
USE OF SEGMENTED OFFSHORE BREAKWATERS FOR BEACH EROSION CONTROL
 .. CETN-III-22 4/84 PURPOSE: USE OF SEGMENTED OFFSHORE BREAKWATERS FOR BEACH EROSION CONTROL To provide information on the functional application of and general design considerations for using offshore
THE WAVE CLIMATE IN THE BELGIAN COASTAL ZONE
 THE WAVE CLIMATE IN THE BELGIAN COASTAL ZONE Toon Verwaest, Flanders Hydraulics Research, toon.verwaest@mow.vlaanderen.be Sarah Doorme, IMDC, sarah.doorme@imdc.be Kristof Verelst, Flanders Hydraulics Research,
CMS Modeling of the North Coast of Puerto Rico
 CMS Modeling of the North Coast of Puerto Rico PRESENTED BY: Dr. Kelly Rankin Legault, Ph.D., P.E. 1 Dr. Alfredo Torruella, Ph.D. 2 1 USACE Jacksonville District 2 University of Puerto Rico October 2016
Sensitivity of storm waves in Montevideo (Uruguay) to a hypothetical climate change
 to a hypothetical climate change") Vol. 9: 81-85,1997 1 CLIMATE RESEARCH Clim Res I Published December 29 Sensitivity of storm waves in Montevideo (Uruguay) to a hypothetical climate change Eugenio Lorenzo*, Luis Teixeira Instituto de Mecanica
Vol. 9: 81-85,1997 1 CLIMATE RESEARCH Clim Res I Published December 29 Sensitivity of storm waves in Montevideo (Uruguay) to a hypothetical climate change Eugenio Lorenzo*, Luis Teixeira Instituto de Mecanica
NORTHERN CELL OPTIONS SHORTLIST RECOMMENDATIONS
 OPTIONS SHORTLIST RECOMMENDATIONS Coastal Unit C: Bayview Options recommended for MCDA scoring. Status quo. Planting 3. Renourishment (gravel) 6. Beach-scraping 7. Restore shingle crest. Inundation accommodation
Pier 8 Wave Overtopping Analysis (65 Guise Street East) Our File:
 Our File:") Shoreplan Engineering Limited 55 Eglinton Avenue E., Suite 800 Toronto, ON Canada M4P 1G8 T) 416.487.4756 F) 416.487.5129 E) mail@shoreplan.com March 31, 2016 Mr. Ed English Senior Project Manager Waterfront
Shoreplan Engineering Limited 55 Eglinton Avenue E., Suite 800 Toronto, ON Canada M4P 1G8 T) 416.487.4756 F) 416.487.5129 E) mail@shoreplan.com March 31, 2016 Mr. Ed English Senior Project Manager Waterfront
Evaluation of June 9, 2014 Federal Emergency Management Agency Flood Insurance Study for Town of Weymouth, Norfolk, Co, MA
 Evaluation of June 9, 2014 Federal Emergency Management Agency Flood Insurance Study for Town of Weymouth, Norfolk, Co, MA Prepared For: Woodard & Curran 95 Cedar Street, Suite 100 Providence, RI 02903
LAB: WHERE S THE BEACH
 Name: LAB: WHERE S THE BEACH Introduction When you build a sandcastle on the beach, you don't expect it to last forever. You spread out your towel to sunbathe, but you know you can't stay in the same spot
UPPER BEACH REPLENISHMENT PROJECT RELATED
 ASSESSMENT OF SAND VOLUME LOSS at the TOWNSHIP of UPPER BEACH REPLENISHMENT PROJECT RELATED to the LANDFALL OF HURRICANE SANDY - PURSUANT TO NJ-DR 4086 This assessment is in response to Hurricane Sandy
MONITORING SEDIMENT TRANSPORT PROCESSES AT MANAVGAT RIVER MOUTH, ANTALYA TURKEY
 COPEDEC VI, 2003 in Colombo, Sri Lanka MONITORING SEDIMENT TRANSPORT PROCESSES AT MANAVGAT RIVER MOUTH, ANTALYA TURKEY Isikhan GULER 1, Aysen ERGIN 2, Ahmet Cevdet YALCINER 3 ABSTRACT Manavgat River, where
MIAMI BEACH 32ND STREET HOT SPOT: NUMERICAL MODELING AND DESIGN OPTIMIZATION. Adam Shah - Coastal Engineer Harvey Sasso P.E.
 ABSTRACT MIAMI BEACH 32ND STREET HOT SPOT: NUMERICAL MODELING AND DESIGN OPTIMIZATION Adam Shah - Coastal Engineer Harvey Sasso P.E. - Principal Coastal Systems International, Inc. 464 South Dixie Highway
Figure79. Location map for the 10 NJBPN profile sites in Atlantic County, NJ 155
 154 Figure79. Location map for the 10 NJBPN profile sites in Atlantic County, NJ 155 ATLANTIC COUNTY SPRING 2009 to FALL 2010 The Atlantic County coastline consists of three barrier islands. Between Little
Door County, WI Coastal Hazard Analysis Flood Risk Review Meeting. August 21, 2017
 Door County, WI Coastal Hazard Analysis Flood Risk Review Meeting August 21, 2017 Agenda Introductions Coastal Flood Risk Study and Mapping Program Current Status Technical Overview of Study and Mapping
CLAM PASS RESTORATION AND MANAGEMENT PLAN BATHYMETRIC MONITORING REPORT NO. 7 Including Interior Bay Dredge Cuts and Tidal Data
 CLAM PASS RESTORATION AND MANAGEMENT PLAN BATHYMETRIC MONITORING REPORT NO. 7 Including Interior Bay Dredge Cuts and Tidal Data Submitted to: Florida Department of Environmental Protection DEP File No.
Comparison of Predicted and Measured Shoaling at Morro Bay Harbor Entrance, California
 Comparison of Predicted and Measured Shoaling at Morro Bay Harbor Entrance, California by Edward F. Thompson, Inocencio P. DiRamos, and Robert R. Bottin, Jr. PURPOSE: This Coastal and Hydraulics Engineering
SEDIMENT BUDGET OF LIDO OF PELLESTRINA (VENICE) Written by Marcello Di Risio Under the supervision of Giorgio Bellotti and Leopoldo Franco
 Written by Marcello Di Risio Under the supervision of Giorgio Bellotti and Leopoldo Franco") SEDIMENT BUDGET OF LIDO OF PELLESTRINA (VENICE) Written by Marcello Di Risio Under the supervision of Giorgio Bellotti and Leopoldo Franco Table of contents: 1. Introduction...3 2. Protection structures
SEDIMENT BUDGET OF LIDO OF PELLESTRINA (VENICE) Written by Marcello Di Risio Under the supervision of Giorgio Bellotti and Leopoldo Franco Table of contents: 1. Introduction...3 2. Protection structures
BEACH NOURISHMENT COMBINED WITH SIC VERTICAL DRAIN IN MALAYSIA. Claus Brøgger 1 and Poul Jakobsen 2
 BEACH NOURISHMENT COMBINED WITH SIC VERTICAL DRAIN IN MALAYSIA. Claus Brøgger 1 and Poul Jakobsen 2 The present paper presents measurements and results from a three year full scale Pilot Project with the
Beach profile surveys and morphological change, Otago Harbour entrance to Karitane May 2014 to June 2015
 Beach profile surveys and morphological change, Otago Harbour entrance to Karitane May 2014 to June 2015 Prepared for Port Otago Ltd Martin Single September 2015 Shore Processes and Management Ltd Contact
Reading Material. Inshore oceanography, Anikouchine and Sternberg The World Ocean, Prentice-Hall
 Reading Material Inshore oceanography, Anikouchine and Sternberg The World Ocean, Prentice-Hall BEACH PROCESSES AND COASTAL ENVIRONMENTS COASTAL FEATURES Cross section Map view Terminology for Coastal
Chapter 15 SEASONAL CHANGES IN BEACHES OP THE NORTH ATLANTIC COAST OF THE UNITED STATES
 Chapter 15 SEASONAL CHANGES IN BEACHES OP THE NORTH ATLANTIC COAST OF THE UNITED STATES By John M. Darling Hydraulic Engineer, Research Division U. S. Army Coastal Engineering Research Center Corps of
The Islands. Barbados. A prefeasibility study. R. Drieman M. Hinborch M. Monden E.A.J. Vendrik
 The Islands Barbados A prefeasibility study R. Drieman M. Hinborch M. Monden E.A.J. Vendrik General notice to the reader: In the academic programme for Hydraulic Engineering we have in the 4th year (i.e.
4/20/17. #30 - Coastlines - General Principles Coastlines - Overview
 Writing Assignment Due one week from today by 11:59 pm See main class web pages for detailed instructions Essays will be submitted in Illinois Compass (instructions later) Pick one: Earthquakes, tsunamis,
Coastal Change and Conflict
 Coastal Change and Conflict Outline of the Topic Contrasting Coasts why do all coasts not look the same? Geology of the coast the impact rock structure has on the coastline Waves Constructive and destructive
Implications of proposed Whanganui Port and lower Whanganui River dredging
 PO Box 637 Wanganui 4540 Attention: Rowan McGregor Dear Rowan 1 Summary We understand that it has been proposed to bring large vessels into the Port at Whanganui requiring the excavation of a channel up
New Jersey Coastal Zone Overview. The New Jersey Beach Profile Network (NJBPN) 3 Dimensional Assessments. Quantifying Shoreline Migration
 3 Dimensional Assessments. Quantifying Shoreline Migration") New Jersey Coastal Zone Overview The New Jersey Beach Profile Network (NJBPN) Objectives Profile Locations Data Collection Analyzing NJBPN Data Examples 3 Dimensional Assessments Methodology Examples Quantifying
New Jersey Coastal Zone Overview The New Jersey Beach Profile Network (NJBPN) Objectives Profile Locations Data Collection Analyzing NJBPN Data Examples 3 Dimensional Assessments Methodology Examples Quantifying
LAKKOPETRA (GREECE) EUROSION Case Study. Contact: Kyriakos SPYROPOULOS. TRITON Consulting Engineers. 90 Pratinou Str Athens (GREECE)
 EUROSION Case Study. Contact: Kyriakos SPYROPOULOS. TRITON Consulting Engineers. 90 Pratinou Str Athens (GREECE)") LAKKOPETRA (GREECE) Contact: Kyriakos SPYROPOULOS TRITON Consulting Engineers 90 Pratinou Str. 11634 Athens (GREECE) Tel: +32 10 729 57 61 Fax: +32 10 724 33 58 e-mail: kspyropoulos@tritonsa.gr 19 1 1.
LAKKOPETRA (GREECE) Contact: Kyriakos SPYROPOULOS TRITON Consulting Engineers 90 Pratinou Str. 11634 Athens (GREECE) Tel: +32 10 729 57 61 Fax: +32 10 724 33 58 e-mail: kspyropoulos@tritonsa.gr 19 1 1.
Jimmy s beach preliminary results
 Jimmy s beach preliminary results LP 668979 Jimmy s Beach Restoration Society 1 Outline 1. Long term: GIS analyses. Aerial photos, charts Shoreline analyses Storm data from MHL/DECC 2. Medium term: morphologic
# Post Consultation and Submissions Resource Consent Conditions for Surfing Impact Mitigation August 2016
 # Post Consultation and Submissions Resource Consent Conditions for Surfing Impact Mitigation August 2016 Surf Mitigation Management Plan 1 1 Not less than 6 months prior to the commencement of the construction
St. Louis County, MN Coastal Hazard Analysis Flood Risk Review Meeting. May 2, 2018
 St. Louis County, MN Coastal Hazard Analysis Flood Risk Review Meeting May 2, 2018 Agenda Introductions Coastal Flood Risk Study and Mapping Program Current Status Technical Overview of Study and Mapping
Morphological Impact of. Coastal Structures
 Morphological Impact of Coastal Structures Student: Remco van der Hoeven Studentno.: 9347290 December, 2010 Hydraulic Engineering Group Hydraulic and Geotechnical Engineering Division Faculty of Civil
Shorelines Earth - Chapter 20 Stan Hatfield Southwestern Illinois College
 Shorelines Earth - Chapter 20 Stan Hatfield Southwestern Illinois College The Shoreline A Dynamic Interface The shoreline is a dynamic interface (common boundary) among air, land, and the ocean. The shoreline
MESSOLOGI LAGOON AREA (GREECE)
") MESSOLOGI LAGOON AREA (GREECE) 20 Contact: Kyriakos SPYROPOULOS TRITON Consulting Engineers 90 Pratinou Str. 11634 Athens (GREECE) Tel: +32 10 729 57 61 Fax: +32 10 724 33 58 e-mail: kspyropoulos@tritonsa.gr
MESSOLOGI LAGOON AREA (GREECE) 20 Contact: Kyriakos SPYROPOULOS TRITON Consulting Engineers 90 Pratinou Str. 11634 Athens (GREECE) Tel: +32 10 729 57 61 Fax: +32 10 724 33 58 e-mail: kspyropoulos@tritonsa.gr
A REVIEW OF THE CONDITION OF THE MUNICIPAL BEACHES AS A RESULT OF HURRICANE SANDY IN THE BOROUGH OF STONE HARBOR, CAPE MAY COUNTY, NEW JERSEY
 A REVIEW OF THE CONDITION OF THE MUNICIPAL BEACHES AS A RESULT OF HURRICANE SANDY IN THE BOROUGH OF STONE HARBOR, CAPE MAY COUNTY, NEW JERSEY View along the dune scarp from 103 rd Street on October 31,
Bayfield & Ashland Counties, WI Coastal Hazard Analysis Flood Risk Review Meeting. June 05, 2018
 Bayfield & Ashland Counties, WI Coastal Hazard Analysis Flood Risk Review Meeting June 05, 2018 Agenda Introductions Coastal Flood Risk Study and Mapping Program Current Status Technical Overview of Study
Compiled by Uwe Dornbusch. Edited by Cherith Moses
 REPORT ON WAVE AND TIDE MEASUREMENTS Compiled by Uwe Dornbusch. Edited by Cherith Moses 1 Aims...1 2 Summary...1 3 Introduction...1 4 Site selection...1 5 Wave recorder settings...2 6 Results...2 6.1 Water
APPENDIX A APPENDIX B APPENDIX C APPENDIX D APPENDIX E APPENDIX F APPENDIX G SEDIMENT ANALYSIS APPENDIX A WAVE & SEDIMENT MODELS CRYSTAL BALL ANALYSIS
 APPENDIX A WAVE & SEDIMENT MODELS APPENDIX B SEDIMENT ANALYSIS APPENDIX A WAVE & SEDIMENT MODELS APPENDIX C CRYSTAL BALL ANALYSIS APPENDIX D SBEACH ANALYSIS APPENDIX E GENESIS ANALYSIS APPENDIX F PREFERRED
Dune Monitoring Data Update Summary: 2013
 Dune Monitoring Data Update Summary: 13 Shoreline Studies Program Virginia Institute of Marine Science College of William & Mary Gloucester Point, Virginia September 13 Dune Monitoring Data Update Summary:
Influence of oceanographic processes on coastal erosion, morphology and inundation
 FACULTY OF ENGINEERING, COMPUTING AND MATHEMATICS Influence of oceanographic processes on coastal erosion, morphology and inundation Charitha Pattiaratchi School of Civil, Environmental and Mining Engineering
Request Number IR1-12: Flow Passage. Information Request
 Request Number IR1-12: Flow Passage Information Request Provide additional information about the 100 metre flow passage channel scenario between the Westshore Terminals and the proposed Project terminal
Beach Profiles. Topics. Module 9b Beach Profiles and Crossshore Sediment Transport 3/23/2016. CE A676 Coastal Engineering
 Beach Profiles AND CROSS-SHORE TRANSPORT Orson P. Smith, PE, Ph.D., Professor Emeritus Topics Features of beach and nearshore profiles Equilibrium profiles Cross-shore transport References Text (Sorensen)
North Half Moon Bay Shoreline Improvement Project, Pillar Point Harbor, CA Coastal Engineering Appendix
 Engineer Research & Development Center / San Francisco District U. S. Army Corps of Engineers North Half Moon Bay Shoreline Improvement Project, Pillar Point Harbor, CA Coastal Engineering Appendix Photograph
Chapter 10 Field Survey and Sediment Analysis for the Candidate Site
 Chapter 1 Field Survey and Sediment Analysis for the Candidate Site 1.1 Overview Several kinds of field surveys have been carried out to obtain the necessary information for sediment analysis, planning,
Baraga County, MI Coastal Hazard Analysis Flood Risk Review Meeting. July 12, 2018
 Baraga County, MI Coastal Hazard Analysis Flood Risk Review Meeting July 12, 2018 Agenda Introductions Coastal Flood Risk Study and Mapping Program Current Status Technical Overview of Study and Mapping
Atlantic Coast of Long Island, Jones Inlet to East Rockaway Inlet, Long Beach Island, NY Construction Update
 Atlantic Coast of Long Island, Jones Inlet to East Rockaway Inlet, Long Beach Island, NY Construction Update June 2016 US Army Corps of Engineers Project Purpose Three specific damage mechanisms of coastal
Bob Battalio, PE Chief Engineer, ESA September 8, 2016
 RELATING FUTURE COASTAL CONDITIONS TO EXISTING FEMA FLOOD HAZARD MAPS Technical Methods Manual Bob Battalio, PE Chief Engineer, ESA September 8, 2016 FMA 2016 Sacramento, California DWR-OST-SIO PILOTING
Montserrat. Wise practices for coping with. i b bea n Se a
 Wise practices for coping with Montserrat Car i b bea n Se a Fisheries Division, Montserrat Physical Planning Department, Montserrat University of Puerto Rico, Sea Grant College Program Caribbean Development
SPECIAL SPRING 2018 STORM REPORT ON THE CONDITION OF THE MUNICIPAL BEACHES FOR THE BOROUGH OF STONE HARBOR, CAPE MAY COUNTY, NEW JERSEY
 SPECIAL SPRING 2018 STORM REPORT ON THE CONDITION OF THE MUNICIPAL BEACHES FOR THE BOROUGH OF STONE HARBOR, CAPE MAY COUNTY, NEW JERSEY Aerial photograph taken April 21, 2018 showing the view up the beach
Wind Blow-out Hollow Generated in Fukiage Dune Field, Kagoshima Prefecture, Japan
 R. Nishi Wind Blow-out Hollow Generated in Fukiage Dune Field, Kagoshima Prefecture, Japan Ryuichiro Nishi, Li Elikson and Myokhin PREFACE A sand dune is vulnerable to severe waves and wind. Therefore,
MODELING OF CLIMATE CHANGE IMPACTS ON COASTAL STRUCTURES - CONTRIBUTION TO THEIR RE-DESIGN
 Proceedings of the 14 th International Conference on Environmental Science and Technology Rhodes, Greece, 3-5 September 2015 MODELING OF CLIMATE CHANGE IMPACTS ON COASTAL STRUCTURES - CONTRIBUTION TO THEIR
SURGE SUPPRESSION ACHIEVED BY DIFFERENT COASTAL SPINE (IKE DIKE) ALIGNMENTS. Bruce A. Ebersole, Thomas W. Richardson and Robert W.
 ALIGNMENTS. Bruce A. Ebersole, Thomas W. Richardson and Robert W.") SURGE SUPPRESSION ACHIEVED BY DIFFERENT COASTAL SPINE (IKE DIKE) ALIGNMENTS Abstract Bruce A. Ebersole, Thomas W. Richardson and Robert W. Whalin, Jackson State University, Jackson, Mississippi The primary
SURGE SUPPRESSION ACHIEVED BY DIFFERENT COASTAL SPINE (IKE DIKE) ALIGNMENTS Abstract Bruce A. Ebersole, Thomas W. Richardson and Robert W. Whalin, Jackson State University, Jackson, Mississippi The primary
MAR 110 LECTURE #15 Wave Hazards
 1 MAR 110 LECTURE #15 Wave Hazards Rogue Wave Hazard Rogue waves are very large open ocean waves of sometimes can range in height from 60 ft (20m) to120 feet (40m) and thus a significant hazard to large
Performance of Upham Beach T-Groin Project and Its Impact to the Downdrift Beach
 Performance of Upham Beach T-Groin Project and Its Impact to the Downdrift Beach Progress Report for the Period of October 2008 to April 2009 Submitted by Ping Wang, Ph.D., and Tiffany M. Roberts Department
RE: Hurricane Matthew Beach Damage Assessment and Recommendations [CSE 2416]
![RE: Hurricane Matthew Beach Damage Assessment and Recommendations [CSE 2416]](/thumbs/83/87675702.jpg "RE: Hurricane Matthew Beach Damage Assessment and Recommendations [CSE 2416]") October 25, 2016 Iris Hill Town Administrator Town of Edisto Beach 2414 Murray St Edisto Beach SC 29438 RE: Hurricane Matthew Beach Damage Assessment and Recommendations [CSE 2416] Dear Iris, Hurricane
October 25, 2016 Iris Hill Town Administrator Town of Edisto Beach 2414 Murray St Edisto Beach SC 29438 RE: Hurricane Matthew Beach Damage Assessment and Recommendations [CSE 2416] Dear Iris, Hurricane
Marginal Marine Environments
 Marginal Marine Environments Delta: discrete shoreline protuberances formed where rivers enter oceans, semi-enclosed seas, lakes or lagoons and supply sediment more rapidly than it can be redistributed
ALTERNATIVES FOR COASTAL STORM DAMAGE MITIGATION
 ALTERNATIVES FOR COASTAL STORM DAMAGE MITIGATION Dave Basco Old Dominion University, Norfolk, Virginia, USA National Park Service Photo STRUCTURAL (changes to natural, physical system) hardening (seawalls,
Chapter 10 Lecture Outline. The Restless Oceans
 Chapter 10 Lecture Outline The Restless Oceans Focus Question 10.1 How does the Coriolis effect influence ocean currents? The Ocean s Surface Circulation Ocean currents Masses of water that flow from one
Preliminary Wake Wash Impact Analysis Redwood City Ferry Terminal, Redwood City, CA
 Technical Memorandum Preliminary Wake Wash Impact Analysis Redwood City Ferry Terminal, Redwood City, CA 1. Introduction The following preliminary wake wash impact analysis was initiated by the Port of