Health Impact Assessment Working Group Meeting #2
|
|
|
- Moses Holland
- 5 years ago
- Views:
Transcription


1 Health Impact Assessment Working Group Meeting #2 October 18, 2017 LYNX Central Station LYNX Board Room

2 Introductions and Icebreaker 2
3 Agenda SR 436 Transit Corridor Study Update HIA Pathway Diagram / Indicators Linking BRT and Complete Streets to Indicators Vulnerable Populations Discussion Interactive Exercise- Quality of Life survey topics Next Steps
4 SR 434 I-4 Study Area 23 Miles along SR 436 Regional and gateway corridor Connects 7 jurisdictions 11 LYNX routes along and 8 LYNX routes across the corridor 3 SuperStops Red Bug Lake Aloma SR 50 SR 408 Curry Ford Hoffner OIA 4
5 Schedule What are the issues, opportunities, & objectives? What are our alternatives? Which alternatives best meet our goals & objectives? How will the project impact the health of the corridor communities? Which alternatives do we want to move forward? How can we best fund & implement the preferred alternative? 7/17-6/ Jan Mar May Jul Sep Nov 2018 Mar May
 Identify Screen")
6 Tiered Alternatives Analysis Level 1 Modes Level 2 Alignments Level 3 Prep Operating scenarios Stations Multimodal access (Complete Streets) Identify Screen Select 6
7 Level 1 Screening Pop. and emp. density Ridership present Local bus Limited-stop bus Corridor Based BRT Fixed Guideway BRT BRT-Gold Modern Streetcar Light rail transit Commuter rail Heavy rail High speed rail Yes Yes Yes No No No No No No No No Yes Yes Yes No No No No Yes No No No MagLev Proven in North America Easy/simple accessibility Yes Yes Yes Yes Yes Yes Yes Yes Yes Yes No Yes Yes Yes Yes Yes Yes Yes Yes No No No Influence economic activity Low Low Medium High High High High Medium High High Adapt to land use changes High High High Medium Medium Low Low Low Low Low Low Permanence of infrastructure Low Low Medium High High High High High High High High ROW Needs Low Low Low High High Medium High High High High High Impact on auto access/turns Environmental/ROW impacts Low Low Low Medium High Medium High High Medium Medium Medium Low Low Medium Medium High Medium High High High High High Req s major improvements Low Low Medium High High High High High High High High Relative capital cost Low Low Low Medium Medium High High High High High High Relative operational cost Low Low Low Low Low Medium Medium High High High High 7 Potential for simple mods High High High Medium Medium Low Low Low Low Low Low


8 Level 1 - Modes BRT - Silver Ex: Cleveland Healthline Fixed Guideway BRT BRT - Bronze Ex: Eugene Emerald Express Corridor-Based BRT Limited-Stop Bus Ex: FastLinks Local Bus 8


9 Elements of Bus Rapid Transit Corridor Based BRT Operates in mixed traffic Frequent bi-directional service on weekdays Defined stations Transit Signal Priority Short headway times Fixed Guideway BRT Operates in exclusive lane on >50% of alignment during peak periods Frequent bi-directional service on weekdays and weekends Defined Stations Transit Signal Priority Short headway times *FTA BRT Categories 9

10 Eugene, OR Emerald Express Branded stations 10

11 Los Angeles, CA Metroliner Real-time info 11

12 Grand Rapids, MI The Rapid Level boarding 12


13 Cleveland, OH Healthline Light rail experience Ticket machines 13
14 Level 2 Alignments/Segments Extents From where to where? Facilities On which road? Runningways Shared/exclusive? Median/curb? 14
 OIA to SR 50 (green) Aloma Ave to Altamonte Mall (orange) US 17/92 to SR 434 (purple) SR 50 OIA")
15 SR 434 Mall Level 2 Candidate Alternatives (Alignments/Segments) Aloma Ave OIA to SR 434 (red) OIA to Aloma Ave (blue) OIA to SR 50 (green) Aloma Ave to Altamonte Mall (orange) US 17/92 to SR 434 (purple) SR 50 OIA 15

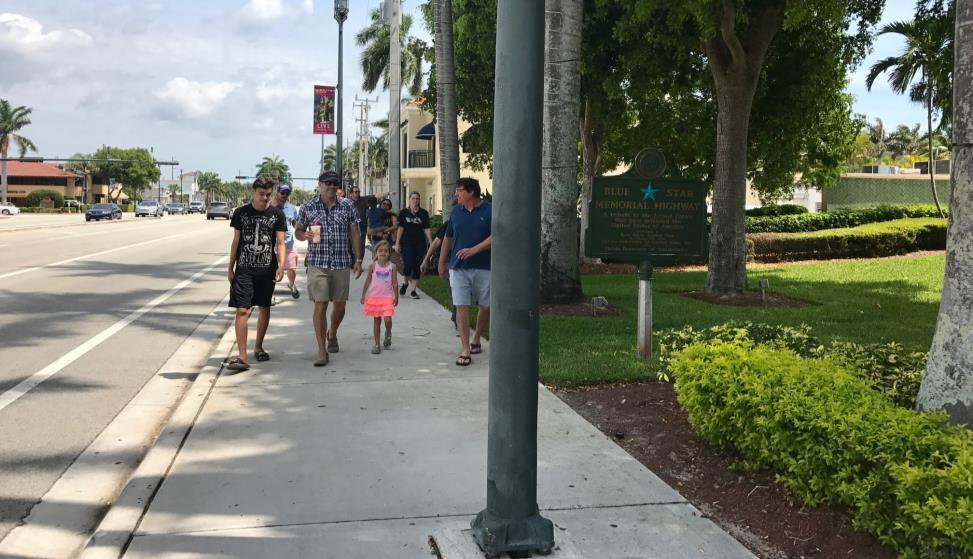
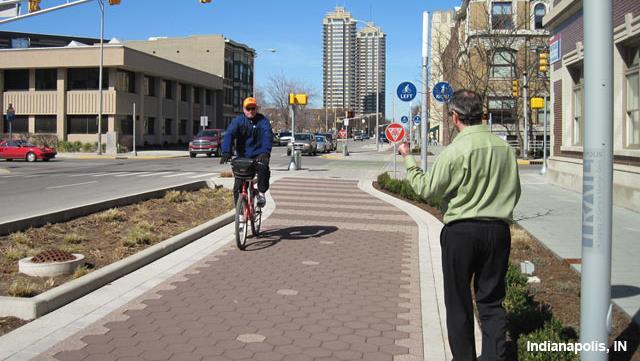
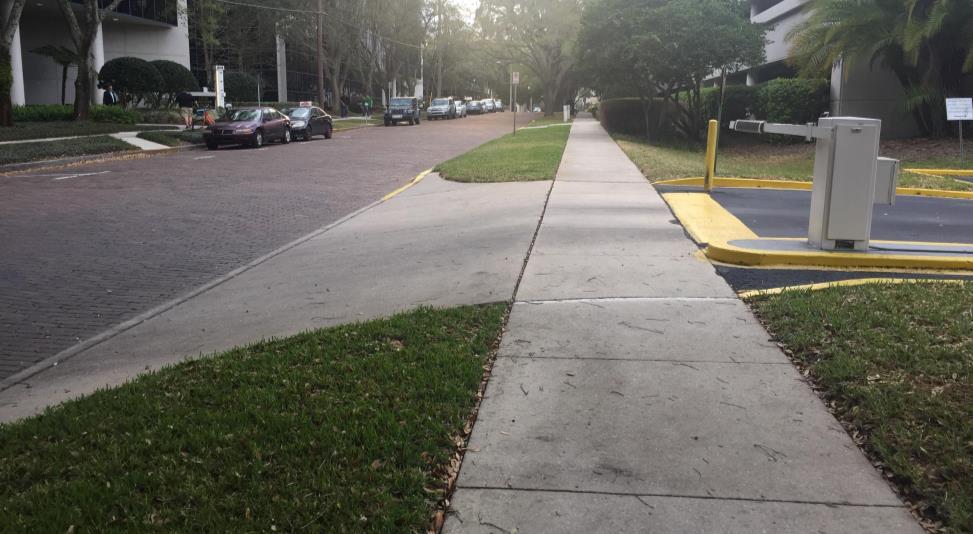
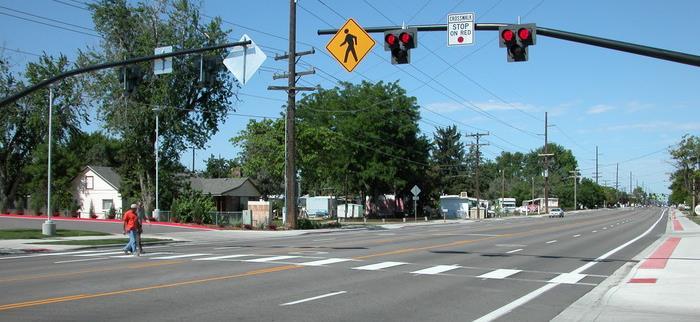
16 Complete Streets Improvements 16

17 HIA Pathway Diagram/ Health Indicators 17
18 HIA Goal The goal of the HIA is to better understand the impacts of the potential SR 436 transit improvements on the overall health of the communities that would be served by this proposed transit investment. This would include potential impacts of improvements on: 1. Enhanced transit experience to support current customers, increase ridership from a wider range of potential users, and increase access to community assets 2. Safe, comfortable, and accessible walking and bicycling environments 3. Transportation investments that encourage development and redevelopment consistent with community goals 4. Reliable and safe vehicular mobility 18
19 Pathway Diagram Exercise Mapping exercise that connects project goals to long-term health outcomes associated with them Outcomes to consider within the scope of an HIA include: Immediate Intermediate Long-term (measured by health indicators) Data sources
20 Pathway Diagram Exercise Needs/Goals Immediate Outcomes Intermediate Outcomes Long-Term Outcomes (Health Indicators) Potential Data Sources Increase Access and Ridership SR 436 Premium Transit Service Safe and Comfortable Walking & Biking Encourage Development / Redevelopment Reliable & Safe Vehicular Mobility


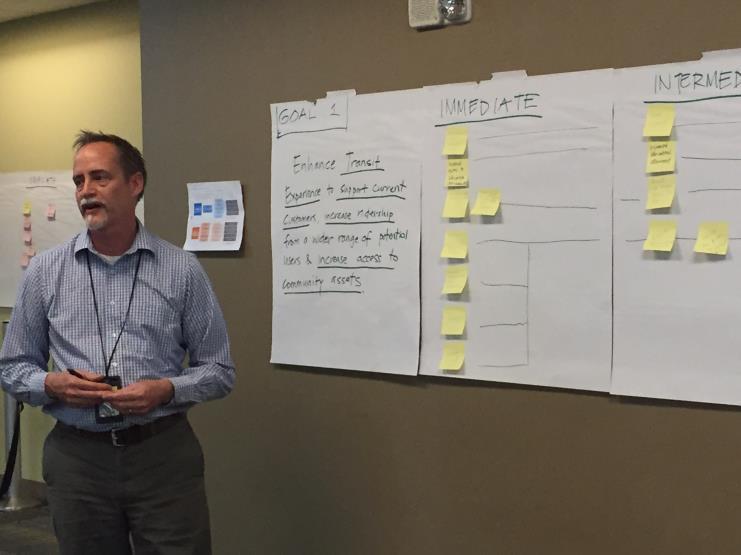
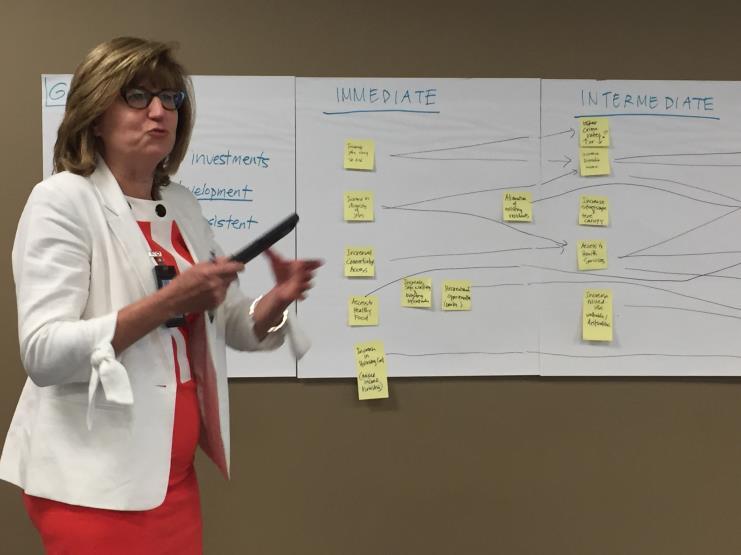
21 Pathway Diagram Exercise
22 Long List of Indicators Asthma / Air Quality Socioeconomic Status Physical Activity Sleep disturbance, stress, hypertension Chronic Disease (Diabetes, Obesity, Heart Disease) Range of Motion Cognition Mental Health / Depression Sense of Community / Quality of Life Bicyclist and Pedestrian Fatality Rates Crime Rates Disposable Income Health Costs Health Insurance Coverage Poverty Levels Mortality / Morbidity Rental Costs / Housing Cost Burden Economic Return on Investment Number of Jobs Crash Rates
23 Long List of Indicators Pathway Diagram Exercise during WG Meeting #1 Long List Indicators Strongest Relationships to Goals, Outcomes, and Public Preference Short List Indicators Data Availability Primary Indicators Final Pathway Diagram
24 Linking BRT & Complete Streets to HIA Indicators 24
25 Research Questions 1. How can the project impact: Ridership and physical activity levels? Transit travel time to work? To health care? Transportation affordability / disposable income? Economic development / redevelopment? 2. How can the project increase access to: Hospitals, clinics, and healthy food sources? Jobs and education? Social services, parks, and exercise opportunities?
26 Research Questions 3. How can the project affect frequency and severity of bike and pedestrian crashes? 4. How can the increased physical activity and commute benefits of the project affect obesity, respiratory disease, diabetes, and other chronic disease? 5. How can the project affect mental health, hypertension and corridor residents and workers perception of quality of life? 6. How can the project affect air quality and asthma levels? 7. Any others?

27 Economic Development/Return on Investment Social, Environmental, and Economic Impacts of BRT Systems EMBARQ, 2013 Travel time reductions & improvements with new transit = willingness to pay premium to be closer to stations Bus systems often do not provide sufficient service for working hours of low-skill/entrylevel, temporary, and evening/weekend shift-work jobs More Development for Your Transit Dollar Institute for Transportation and Development Policy, 2013 Economic Returns per Transit Dollar Spent $115: Cleveland Healthline $102: Kansas City MAX $4: Eugene Emerald Express Green Line
28 Transportation and Housing Affordability Transportation Affordability: Evaluation and Improvement Strategies Victoria Transport Policy Institute, 2017 Lower-income households spend a disproportionate share of their income on transportation Neighborhoods with > mobility options spend less on transportation than cardependent communities National Community Preference Survey National Association of Realtors, 2015 Americans are increasingly prioritizing affordable housing and alternatives to driving Losing Ground: The Struggle of Moderate- Income Households to Afford the Rising Costs of Housing and Transportation Center for Housing Policy, 2012 High housing and transportation costs leave less disposable income for food, education and health care
29 Transit Commute Time to Work and Health Care and Other Essentials Economic Development Impacts of Bus Rapid Transit University of Minnesota, 2016 BRT improvements shorten commutes and enhance job access Evaluating Public Transportation Health Benefits Victoria Transport Policy Institute, 2010 High quality transit (convenient, comfortable, fast rail and bus transport) can lead to increased access to medical care and healthy food Compared with those who drive, non-driving Americans aged 65 or older make 15% fewer trips to the doctor; 59% fewer shopping trips and restaurant visits; and 65% fewer trips for social, family and religious activities.
 increase")
30 Bike and Pedestrian Crash Rates Evaluation of the Safe Routes to Transit Program in California Safe Transportation Research & Education Center, 2014 Safe, welcoming streetscapes increase walking, biking and transit ridership Lessons from the Green Lanes National Institute for Transportation and Communities, 2014 Protected bike lanes (buffered bike lanes and separated cycle tracks) increase the perceived and actual safety of cycling Safety in numbers: more walkers and bicyclists, safer walking and bicycling Injury Prevention, 2003 Increased walking and biking = increased safety Motorists pay attention and adjust behavior

31 Mental Health and Quality of Life The Mental Health Benefits of Walking Atkinson, 2015 Increasing physical activity decreases anxiety and depression Social Ties and Mental Health Kawachi, 2001 Physical activity has been shown to prevent mental disorders Women who did not exercise were 2x as likely to have depressive symptoms than women who reported moderate+ levels of exercise


32 Respiratory Disease, Obesity, Diabetes, and Other Chronic Disease Lack of Exercise Responsible for Twice as Many Early Deaths as Obesity University of Cambridge, 2015 A brisk 20 minute walk each day can reduce an individual's risk of early death by between 16-30% Does Bus Rapid Transit Promote Walking? Journal of Physical Activity and Health, 2014 Walking distances to BRT > walking distances to local bus Transit can increase walking by 20 blocks per month or 240 blocks per year Safe walking environments increase walking and health
33 Emissions and Air Quality Risk of pediatric asthma morbidity from multipollutant exposures California Air Resources Board, 2015 Minority and low-income populations live in areas with higher levels of traffic-related pollution Conserving Energy and Preserving the Environment: The Role of Public Transportation Shapiro, 2002 Transit uses less energy and produces less pollution than travel by private vehicles reducing air pollution levels can reduce the burden of disease from stroke, heart disease, lung cancer, and both chronic and acute respiratory diseases, including asthma. ~World Health Organization
34 Other research? 34
35 Short List of Indicators Economic Return on Investment (Property Value) Transportation and Housing Affordability Transit Commute Time to Work Bicyclist and Pedestrian Injury and Fatality Rates Sense of Community / Quality of Life Mental Health / Depression / Stress and Hypertension Respiratory Disease, Obesity, Diabetes, and Other Chronic Disease Transit Access to Health Asthma / Air Quality Income and Poverty Levels Transit Access to Education Transit Access to Healthy Food
36 Short List of Indicators Pathway Diagram Exercise during WG Meeting #1 Long List Indicators Strongest Relationships to Goals, Outcomes, and Public Preference Short List Indicators Data Availability Primary Indicators Final Pathway Diagram
37 Primary Indicators Economic Return on Investment (Property Value) Transportation and Housing Affordability Transit Commute Time to Work Bicyclist and Pedestrian Injury and Fatality Rates Sense of Community / Quality of Life Mental Health / Depression / Stress and Hypertension Respiratory Disease, Obesity, Diabetes, and Other Chronic Disease Transit Access to Health Asthma / Air Quality Income and Poverty Levels Transit Access to Education Transit Access to Healthy Food
38 Primary Indicators No. Indicator Potential Source Data Resolution Priority 1 Economic ROI (Property Value) or New Development Seminole and Orange County Tax Collectors, DOR Parcel Primary 2 Transportation and Housing Affordability Census, Center for Neighborhood Technology Census Block Groups Primary 3 Transit commute time to work along corridor Census, LYNX O-D Survey, AirSage Corridor Users Primary 4 Bike and Pedestrian Crash Rates FDOT CARS and Signal Four Analytics Location-Specific Primary 5 Social Interaction / Quality of Life / Sense of Community HIA Survey, BRFSS, Florida Hospital Community Health Needs Assessment, DOH Survey Zip Code Primary 6 Mental Health / Depression / Hypertension or Mental Health Admissions Health Council of East Central Florida, Florida Hospital, BRFSS, CDC 500 Cities, FL Health CHARTS Zip Code, Census Tract, Blocks? Primary 7 Respiratory Disease, Obesity, Diabetes, and Other Chronic Disease Health Council of East Central Florida, Florida Hospital, BRFSS, CDC 500 Cities, FL Health CHARTS Zip Code, Census Tract, Blocks? Primary 8 Transit commute time to health care along corridor (Access to health care facilities) Orange County Health Department, Seminole County Health Department, Health Council of East Central Florida, Florida Location-Specific Hospital Primary

")


39 Final Pathway Diagram (Example)

40 Vulnerable Populations 40
 Millions of Americans, especially people with low incomes, the elderly, people with disabilities,")
41 Vulnerable Populations Rates of serious conditions such as obesity, heart disease, cancer and stroke are substantially higher in the poorest parts of the county (NASEM, 2017) Racial health disparities are projected to cost health insurers $337 billion between 2009 and 2018 (NASEM, 2017) Millions of Americans, especially people with low incomes, the elderly, people with disabilities, and other transit-dependent populations, have difficulty accessing fresh, nutritious food. (Vallianatos, 2002) Pedestrian deaths by race/ethnicity relative to U.S. Population ( ) White Non-White (incl. Hispanic) 34.9% 46.1% 53.1% 62.8% Percentage of Population Percentage of Pedestrian Deaths 0.0% 10.0% 20.0% 30.0% 40.0% 50.0% 60.0% 70.0%
42 Corridor Demographics Non-White and/or Hispanic 49% Population at or below 150% of Poverty Line 30% Limited English Proficiency 11% Non-Working Age (<18, 65+) 34% Under 18 Seniors 13% 21% Non-SOV Commuters Zero-Car Households Transit Commuters 3% 6% 16% Orlando MSA Study Area Source: ACS data Note: Updated on 4/13/2017 after the meeting had been held 0% 20% 40% 60% 80% 100%
43 Corridor Demographics Non-White and/or Hispanic 49% Population at or below 150% of Poverty Line 30% Limited English Proficiency 11% Non-Working Age (<18, 65+) 34% Under 18 Seniors 13% 21% Non-SOV Commuters Zero-Car Households Transit Commuters 3% 6% 16% Orlando MSA Study Area Source: ACS data Note: Updated on 4/13/2017 after the meeting had been held 0% 20% 40% 60% 80% 100%
44 Transit Riders Annual Household Income Basic Demographics Less than $10,000 $10,000-$19,999 $20,000-$29,999 $30,000-$39,999 18% 18% 21% 22% Not White Non- Hispanic Zero-Car Households Limited English Proficiency 11% 54% 71% $40,000-$49,999 11% Non-Working Age (<18, 65+) 9% $50,000-$74,999 $75,000-$99,999 $100,000 or more 1% 2% 8% Orlando MSA SR 436 Transit Riders Seniors Under 18 6% 3% Orlando MSA SR 436 Transit Riders 0% 10% 20% 30% 0% 20% 40% 60% 80% 100% Source: LYNX Onboard Survey ( ) 44
45 Transit Riders Annual Household Income 80% Basic Demographics Less than $10,000 $10,000-$19,999 $20,000-$29,999 $30,000-$39,999 18% 18% 21% 22% Not White Non- Hispanic Zero-Car Households Limited English Proficiency 11% 54% 71% $40,000-$49,999 11% Non-Working Age (<18, 65+) 9% $50,000-$74,999 $75,000-$99,999 $100,000 or more 1% 2% 8% Orlando MSA SR 436 Transit Riders Seniors Under 18 6% 3% Orlando MSA SR 436 Transit Riders 0% 10% 20% 30% 0% 20% 40% 60% 80% 100% Source: LYNX Onboard Survey ( ) 45


46 Top 5 Areas Mid-density areas with low vehicle availability
 Affordable")

47 SR 434 I-4 5 Housing & Red Bug Lake Transportation Affordability 4 Aloma Many residents burdened by the cost of housing and transportation In the MetroPlan Orlando region, the average household is also burdened (61%) Affordable H+T costs (as defined by the experts) = 45% 45% > 45% and 60% > 60% and 75% > 75% and 90% > 90% MSA Average: 61% 3 OIA SR 50 SR 408 Curry Ford Hoffner 1 2 Source: Center for Neighborhood Technology, American Community Survey
 83% rated available health care services as good to excellent")
48 Previous Surveys Florida Hospital Altamonte PSA Survey (2016) 43% say it is not easy to walk to a transit stop from their home 40% say they cannot easily walk to stores 30% believe it is unsafe to ride a bike in their neighborhood Concerns about speed of traffic and safety of crosswalks Department of Health Orange County CHIP (2015) 83% rated available health care services as good to excellent 23% of the population does not have health insurance 11% of the population rates their mental health status as fair or worse 2002: 51% participated in moderate physical activity; 2007: 49.6% participated in moderate physical activity
49 SR 436 Transit Survey How do you typically get around? Why don t you take transit?
50 SR 436 Transit Survey Most important project objectives 1.Effective connections to popular destinations 2.Optimize transportation system through things like signal timing 3.Increase ability for pedestrian and bicyclists to cross SR Increased transit frequency 5.Improved transit travel times


51 Most Desired Transit Features Arrival Time Display Level Boarding Pay Fare by Phone Pre-Board Payment Bike Racks Branded Stations 51
52 Interactive Exercise- Quality of Life Survey Topics What other health-related topics are we concerned about, keeping in mind the HIA Goal Areas: 1. Enhanced transit experience to support current customers, increase ridership from a wider range of potential users, and increase access to community assets 2. Safe, comfortable, and accessible walking and bicycling environments 3. Transportation investments that encourage development and redevelopment consistent with community goals 4. Reliable and safe vehicular mobility
53 Interactive Exercise- Quality of Life Survey Topics What other health-related topics are we concerned about? What factors contribute to quality of life / sense of community? Examples: How many community/neighborhood events have you attended in the past year? How connected do you feel to your community and neighbors? How often are you unable to get to work or health care due to public transportation issues?
54 Next Steps Assessment Phase Baseline Conditions Health Impact Assessment Next Working Group Meeting January 2018 Visit and share our website: Fill out our surveys Check out upcoming events Download and read study documents OVERVIEW SCHEDULE EXISTING CONDITIONS HIA NEXT STEPS

55 Community Events EVENTS Gateway Orlando Rebranding Semoran Block Party Full Sail SCA Networking Summit Casselberry EarthFest Neighborhood Leadership Council Orlando Gateway Guardian Active Living Expo Winter Park Casselberry Chamber of Commerce Business Expo Casselberry Jazz Fest Baldwin Park First Friday OktoberFest Bravo Grocery Store Outreach Future SuperStop Outreaches District 2 Fall Festival and more! 55 OVERVIEW SCHEDULE EXISTING CONDITIONS HIA NEXT STEPS

56 Please share our website and survey! 56 INTRO EXISTING CONDITIONS ONGOING WORK ALTERNATIVES NEXT STEPS

57 Questions? OVERVIEW SCHEDULE EXISTING CONDITIONS HIA NEXT STEPS
Health Impact Assessment Working Group Meeting #3
 Health Impact Assessment Working Group Meeting #3 January 31, 2018 Casselberry City Hall Multi-Purpose Room Introductions and Icebreaker 2 Agenda SR 436 Transit Corridor Study Update Primary Indicator
Agenda. US-1 Corridor Study and HIA Update. Pathway Diagram / Primary Indicators. Research Questions. Linking Multimodal Improvements to Indicators
 Icebreaker Agenda US-1 Corridor Study and HIA Update Pathway Diagram / Primary Indicators Research Questions Linking Multimodal Improvements to Indicators Vulnerable Populations US-1 Corridor Study Vision
Semoran Blvd. Transit Study. June 1, 2017 Gateway Guardian Public Safety Meeting Residence Inn, Orlando, FL
 Semoran Blvd. Transit Study June 1, 2017 Gateway Guardian Public Safety Meeting Residence Inn, Orlando, FL I-4 Study Area 23 Miles along SR 436 Regional and gateway corridor Connects 7 jurisdictions 11
Study Update. October 11, 2017 FDOT District 5
 Study Update October 11, 2017 FDOT District 5 1 I-4 Study Area 23 Miles along SR 436 Regional and gateway corridor Connects 7 jurisdictions 11 LYNX routes along and 8 LYNX routes across the corridor 3
Community Task Force July 25, 2017
 Community Task Force July 25, 2017 Welcome and Introductions Project Partners Regional Transportation District (RTD) Colorado Department of Transportation (CDOT) Denver Regional Council of Governments
Bus Rapid Transit ALTERNATIVES ANALYSIS. Open House
 Bus Rapid Transit ALTERNATIVES ANALYSIS Open House June 23, 2015 Open House Meeting Agenda Agenda Introductions What is BRT? Project Goals Study Tasks Next steps Discussion PVTA Bus Rapid Transit Study
TPA Committee Meetings May 2018
 TPA Committee Meetings May 2018 Purpose Develop a comprehensive plan to identify multimodal improvements for all users of the roadway and evaluate the potential for a premium express bus service Overview
RESOLUTION NO ?? A RESOLUTION OF THE CITY OF NEPTUNE BEACH ADOPTING A COMPLETE STREETS POLICY
 RESOLUTION NO. 2018-?? A RESOLUTION OF THE CITY OF NEPTUNE BEACH ADOPTING A COMPLETE STREETS POLICY WHEREAS, safe, convenient, and accessible transportation for all users is a priority of the City of Neptune
HIA Working Group Meeting #4 September 27, 2017
 HIA Working Group Meeting #4 September 27, 2017 Icebreaker Agenda US-1 Corridor Study Update Health Indicator Assessment Station Demonstration Area Assessment Preliminary Recommendations Discussion Next
What s Health Got to Do With It? Health and Land Use Planning
 What s Health Got to Do With It? Health and Land Use Planning CANDACE RUTT, PH.D. EXECUTIVE DIRECTOR APRIL 13 TH, 2016 Planning and Public Health Planning + Public Health Healthy Communities Healthier
PURPOSE AND NEED SUMMARY 54% Corridor Need 1. Corridor Need 2. Corridor Need 3. Corridor Need 4. Corridor Need 5
 SUMMARY PURPOSE AND NEED Chapel Hill Transit ridership has increased Buses operate every 4 minutes and have standing room only Exceeding seated capacity by 12% Corridor Need 1 by more than 20 percent between
Bus Rapid Transit Plans
 Twin Cities Region Bus Rapid Transit Plans ULI Minnesota Workshop Connecting Bus Rapid Transit to the Community December 15, 2009 John Levin Director of Service Development Metro Transit Metropolitan Area
Introduction Overview This document summarizes the Gateway Gold Line Bus Rapid Transit (Gold Line BRT) health impact assessment (HIA) process and reco
 health impact assessment (HIA) process and reco") Gateway Gold Line Bus Rapid Transit: A Closer Look at Health and Land Use Project Summary May 2016 Introduction Overview This document summarizes the Gateway Gold Line Bus Rapid Transit (Gold Line BRT)
Gateway Gold Line Bus Rapid Transit: A Closer Look at Health and Land Use Project Summary May 2016 Introduction Overview This document summarizes the Gateway Gold Line Bus Rapid Transit (Gold Line BRT)
Health Impact Analysis for Integrated Regional Land Use and Transportation Plan
 Health Impact Analysis for Integrated Regional Land Use and Transportation Plan Hsi-Hwa Hu, Guoxiong Huang, Frank Wen, Simon Choi (Southern California Association of Governments) Margaret Shih (Los Angeles
A Health Impact Assessment (HIA) on a Proposed Road Diet and Re-Striping Project In Spartanburg, SC
 on a Proposed Road Diet and Re-Striping Project In Spartanburg, SC") A Health Impact Assessment (HIA) on a Proposed Road Diet and Re-Striping Project In Spartanburg, SC Association for Commuter Transportation Annual Meeting July 31, 2012 Maya Pack, MS, MPA Health in All
A Health Impact Assessment (HIA) on a Proposed Road Diet and Re-Striping Project In Spartanburg, SC Association for Commuter Transportation Annual Meeting July 31, 2012 Maya Pack, MS, MPA Health in All
Complete Streets 101: The Basics
 Complete Streets 101: The Basics Michigan Municipal League - Capital Conference March 21, 2017 Chip Smith, AICP - Senior Planner - Wade Trim Inc. and City Council member City of Ann Arbor 2017 MML Capital
FACTS AND FIGURES: MAKING THE CASE FOR COMPLETE STREETS IN LEE COUNTY
 FACTS AND FIGURES: MAKING THE CASE FOR COMPLETE STREETS IN LEE COUNTY Safety: Close to 5,000 pedestrians and bicyclists die each year on U.S. roads, and more than 70,000 are injured. [Mean Streets, Surface
Greater Cleveland Regional Transit Authority
 Greater Cleveland Regional Transit Authority Transit Priority Corridor Initiatives West 25 th Street /East 105 th /East 93 rd Streets June 20, 2017 Presented to: Planning & Development Committee Greater
Corridor Vision Workshop Summary James Madison Elementary February 22,2018
 Corridor Vision Workshop Summary James Madison Elementary February 22,2018 WHY DEVELOP THIS STUDY? Ogden City is planning for better connectivity and access to jobs and housing. Working with area partners,
Transit-Driven Complete Streets
 Questions: Type questions into the box at bottom of webinar panel. Panelists for today s webinar: Nimotalai Azeez, Program Associate with the National Complete Streets Coalition Rich Weaver, Director of
The best indicator of an individual s and expanding access to parks and open space.
 Health & Wellness Create a Safe and Healthy Built Environment Artist s rendering, 2014 Health is important to Loveland residents, and stakeholders see the many strong connections between quality of life,
METRO RTA TRANSIT MASTER PLAN. May 25-26, 2011
 METRO RTA TRANSIT MASTER PLAN May 25-26, 2011 WHAT IS THE TRANSIT MASTER PLAN? A twenty-year plan for METRO RTA What will METRO look like in 2031? 1 TRANSIT TECHNOLOGIES 2 TRANSIT TECHNOLOGIES Transit
Health and Transportation: Integrated Transport and Health Impact Model in the Nashville Region. Leslie Meehan, AICP June 2015
 THE HONORABLE Mayor KEN WILBER, Karl Dean, CHAIRMAN Chairman Health and Transportation: Integrated Transport and Health Impact Model in the Nashville Region Leslie Meehan, AICP June 2015 Metropolitan Planning
Seattle Transit Master Plan
 Seattle Transit Master Plan Seattle City Council Transportation Committee Briefing July 26, 2011 Seattle Department of Transportation In Association with: URS Corporation SVR DKS Associates The Underhill
Greenhouse gas emissions from transport have been rising and are expected to continue to rise both in higher & lower income countries.
 1 Greenhouse gas emissions from transport have been rising and are expected to continue to rise both in higher & lower income countries. Transport is seen as a hard area for mitigation 2 However, there
BUILDING THE CASE FOR TRAVEL OPTIONS IN WASHING TON COUNTY. Image: Steve Morgan. Image: Steve Morgan
 BUILDING THE CASE FOR TRAVEL OPTIONS IN WASHING TON COUNTY Image: Steve Morgan Image: Steve Morgan Image: TriMet Image: TriMet WHAT ARE TRAVEL OPTIONS PROGRAMS? Travel options programs encourage residents,
DRAFT HEALTH IMPACT ASSESSMENT. PALM BEACH Transportation Planning Agency
 DRAFT HEALTH IMPACT ASSESSMENT PALM BEACH Transportation Planning Agency TABLE OF CONTENTS 5 Executive Summary 11 Introduction 13 What Are Health Impact Assessments? 14 Why Conduct an HIA on US 1? 15
GRAHAM PEDESTRIAN TRANSPORTATION PLAN
 GRAHAM PEDESTRIAN TRANSPORTATION PLAN Chapter 1 I 1.1 Scope and Purpose n March of 2005, the City of Graham contracted with Greenways Incorporated (GWI) to create a Pedestrian Transportation Plan. The
Arterial Transitway Corridors Study. Ave
 Arterial Transitway Corridors Study Ave January 2012 Arterial Transitway Corridors Study Overview Corridor Features and Demographics 11 study corridors, 95 route miles 86,000 daily rides and half of existing
 Time of Change We Are Growing We Are An Attractive Place To Live We Are Age Diverse + Living Longer 50000 40000 30000 20000 10000 0 2010 Census Job Density Housing Sheds Transit Sheds The Project FUNDING
Presentation of Staff Draft March 18, 2013 COUNTYWIDE TRANSIT CORRIDORS FUNCTIONAL MASTER PLAN
 Presentation of Staff Draft March 18, 2013 COUNTYWIDE TRANSIT CORRIDORS FUNCTIONAL MASTER PLAN Public Outreach Fall 2011: Two community meetings/open houses Fall 2012: Three community meetings/open houses
Typical Rush Hour Commute. PennyforTransportation.com
 Typical Rush Hour Commute In the News Overview of the Plan Collaborative plan with projects in every community Prioritizing connectivity and congestion relief Dedicated transportation-specific funding;
City of Novi Non-Motorized Master Plan 2011 Executive Summary
 City of Novi Non-Motorized Master Plan 2011 Executive Summary Prepared by: February 28, 2011 Why Plan? Encouraging healthy, active lifestyles through pathway and sidewalk connectivity has been a focus
Eliminate on-street parking where it will allow for a dedicated bus only lane %
 Traffic Dashboard Priorities Survey Responses Introduction 1) Are you familiar with bus rapid transit (BRT)? a. No, BRT is new to me. 597 23.5% b. I ve heard of BRT, but I don t know much about it. 1,136
Highway Transitway Corridor Study
 Highway Transitway Corridor Study CTS Research Conference May 21, 2014 1 2030 Transportation Policy Plan Transitway modes on highways: Highway bus rapid transit (BRT), plan identified 6 total Highway BRT
North Coast Corridor:
 North Coast Corridor: Connecting People, Transportation & Environment Legislative Hearing: 11.8.10 1 North Coast Corridor Region s Lifeline A Regional Strategy Mobility, Economy & Environment North Coast
TR NEWS. Public Health and Transportation. Innovation, Intervention, and Improvements NUMBER 299 SEPTEMBER OCTOBER 2015
 TR NEWS NUMBER 299 SEPTEMBER OCTOBER 2015 Public Health and Transportation Innovation, Intervention, and Improvements Public Health and Transportation Measuring the Health Benefits of Walking and Bicycling
Community Task Force March 14, 2018
 Community Task Force March 14, 2018 Welcome and Introductions Project Partners Regional Transportation District (RTD) City of Aurora Colorado Department of Transportation (CDOT) Denver Regional Council
Pocatello Regional Transit Master Transit Plan Draft Recommendations
 Pocatello Regional Transit Master Transit Plan Draft Recommendations Presentation Outline 1. 2. 3. 4. What is the Master Transit Plan? An overview of the study Where Are We Today? Key take-aways from existing
Swift Bus Rapid Transit. June DeVoll, Community Transit & Tom Hingson, Everett Transit
 Swift Bus Rapid Transit June DeVoll, Community Transit & Tom Hingson, Everett Transit October 22, 2013 Swift Washington State s First BRT is almost 4 years old Everett Transit Everett Transit College Station
Community Advisory Committee (CAC) Agenda Wednesday June 24, 2015, 6:00 8:00 pm East Side Enterprise Center 804 Margaret Street, Saint Paul, MN 55106
 Agenda Wednesday June 24, 2015, 6:00 8:00 pm East Side Enterprise Center 804 Margaret Street, Saint Paul, MN 55106") Community Advisory Committee (CAC) Agenda Wednesday June 24, 2015, 6:00 8:00 pm East Side Enterprise Center 804 Margaret Street, Saint Paul, MN 55106 1. Introductions / Meeting Overview 6:00 6:10 2. Health
Community Advisory Committee (CAC) Agenda Wednesday June 24, 2015, 6:00 8:00 pm East Side Enterprise Center 804 Margaret Street, Saint Paul, MN 55106 1. Introductions / Meeting Overview 6:00 6:10 2. Health
NASHUA REGIONAL PLANNING COMMISSION REGIONAL BICYCLE AND PEDESTRIAN PLAN
 NASHUA REGIONAL PLANNING COMMISSION REGIONAL BICYCLE AND PEDESTRIAN PLAN June, 2005 Prepared by the Nashua Regional Planning Commission 2005 NRPC Regional Bicycle and Pedestrian Plan- JUNE 2005 ACKNOWLEDGEMENTS
Living Streets Policy
 Living Streets Policy Introduction Living streets balance the needs of motorists, bicyclists, pedestrians and transit riders in ways that promote safety and convenience, enhance community identity, create
Proposed. City of Grand Junction Complete Streets Policy. Exhibit 10
 Proposed City of Grand Junction Complete Streets Policy Exhibit 10 1 City of Grand Junction Complete Streets Policy Vision: The Complete Streets Vision is to develop a safe, efficient, and reliable travel
2. Context. Existing framework. The context. The challenge. Transport Strategy
 Transport Strategy Providing quality connections Contents 1. Introduction 2. Context 3. Long-term direction 4. Three-year priorities 5. Strategy tree Wellington City Council July 2006 1. Introduction Wellington
Technical Working Group November 15, 2017
 Technical Working Group November 15, 2017 Welcome and Introductions Project Partners Regional Transportation District (RTD) Colorado Department of Transportation (CDOT) Denver Regional Council of Governments
Metropolitan Council Transportation Committee
 Nicollet-Central Transit Alternatives Metropolitan Council Transportation Committee August 2013 Project Purpose (approved by Policy Advisory Committee 10/25/2012) The purpose is to improve transit connectivity,
TULARE COUNTY ASSOCIATION OF GOVERNMENTS
 TULARE COUNTY ASSOCIATION OF GOVERNMENTS Workshop: Creating Bikeable, Walkable Communities Wednesday, June 7, 2017 REVIEW OF THE 2016 REGIONAL ACTIVE TRANSPORTATION PLAN TCAG - 559-623-0450 210 N. Church
Sistrunk Corridor DOTMOCRACY SUMMARY
 DOTMOCRACY SUMMARY The TOUCH initiative is a true collaborative working with multi- sector community organizations and agencies to reduce tobacco use and exposure to secondhand smoke, improve access to
How To Encourage More Efficient Transportation in Brazilian Cities
 How To Encourage More Efficient Transportation in Brazilian Cities Todd Litman Victoria Transport Policy Institute Presented Seminar on Discouraging The Use Of Cars São Paulo, Brazil 3 September 2013 Creating
Bikeway action plan. Bicycle Friendly Community Workshop March 5, 2007 Rochester, MN
 Bikeway action plan Summary The was held on March 5, 2007 at the Rochester Mayo Civic Center. The workshop was hosted by Rochester-Olmsted County Planning Department in collaboration with the League of
Bicycle Master Plan Goals, Strategies, and Policies
 Bicycle Master Plan Goals, Strategies, and Policies Mobilizing 5 This chapter outlines the overarching goals, action statements, and action items Long Beach will take in order to achieve its vision of
POLICY AGENDA For Elder Pedestrian Safety
 POLICY AGENDA For Elder Pedestrian Safety Older adults and people with disabilities often have mobility, cognitive, and sensory limitations that affect their behavior as pedestrians and place them at risk
HB 2017 Transit Advisory Committee. June 22, 2018
 HB 2017 Transit Advisory Committee June 22, 2018 Meeting Agenda Agenda & Public Comment Timeline Program Appeals: Streetcar, Demand Response, Fares, Electric Bus, Enhanced Transit Corridors Online Survey
A District Council of the Urban Land Institute
 A District Council of the Urban Land Institute Thank you to our sponsors! A District Council of the Urban Land Institute Thank you to our Community Partners! A District Council of the Urban Land Institute
Bottineau Transitway Health Impact Assessment Summary
 December 2013 Hennepin County Bottineau Transitway Health Impact Assessment Summary Prepared by Crystal Myslajek Overview of the Bottineau Transitway The Bottineau Transitway (METRO Blue Line extension)
HIA Working Group Meeting #5 November 29, 2017
 HIA Working Group Meeting #5 November 29, 2017 ICEBREAKER Agenda US-1 Corridor Study Update Health Indicator Assessment Update Station Demonstration Area Assessment HIA Recommendations Discussion + Exercise
Pathways to a Healthy Decatur
 CHAPTER 1 Pathways to a Healthy Decatur Health is a holistic sense of spiritual, mental, and physical well-being and the absence of illness and disease - a compilation of definitions of health by community
Transportation Issues Poll for New York City
 2016-17 Transportation Issues Poll for New York City 82% support Vision Zero and reducing traffic deaths 72% on average, support more street space for children to play, protected bike lanes and other safety
OC Healthy Communities Forum. The proportion of the population that live within a half mile of a major transit access point.
 OC Healthy Communities Forum Transit Access The proportion of the population that live within a half mile of a major transit access point. Use of public transit can result in decreased greenhouse gas emissions
Afeasibility study to evaluate bus rapid transit service in the East-West Corridor connecting major employment and activity centers between downtown
 East-West Bus Rapid Transit Feasibility Study Update and Recommended Locally Preferred Alternative (LPA) Summary City of Wauwatosa, Transportation Affairs Committee June 2016 Afeasibility study to evaluate
Urban planners have invested a lot of energy in the idea of transit-oriented
 DOES TRANSIT-ORIENTED DEVELOPMENT NEED THE TRANSIT? D A N I E L G. C H AT M A N Urban planners have invested a lot of energy in the idea of transit-oriented developments (TODs). Developing dense housing
Providence Downtown Transit Connector STAKEHOLDER MEETING #2. Stakeholder Meeting #1 October 24, 2016
 Providence Downtown Transit Connector STAKEHOLDER MEETING #2 Stakeholder Meeting #1 October 24, 2016 February 2017 1 AGENDA 1 DTC Goals and Expectations 2 Street Design Concepts 3 Potential Benefits and
Arterial Transitway Corridors Study. Sept. 26, 2011
 Arterial Transitway Corridors Study Sept. 26, 2011 Purpose of Study Study 11 urban corridors in Minneapolis, St. Paul and surrounding communities Develop service and facilities plan to improve Transit
Public Healthy and Community Design
 Public Healthy and Community Design Jeffery Rosenhall, MA, LCI #2312 Health Program Manager, CDPH April 24, 2017 Stairwell interventions Urban bike track Public health and planning: A Road Map Planning,
Community Task Force November 15, 2017
 Community Task Force November 15, 2017 Welcome and Introductions Project Partners Regional Transportation District (RTD) Colorado Department of Transportation (CDOT) Denver Regional Council of Governments
Perryville TOD and Greenway Plan
 Perryville TOD and Greenway Plan Greenway Glossary Pathway: A bicycle and pedestrian path separated from motorized vehicular traffic by an open space, barrier or curb. Multi-use paths may be within the
Chapter 5. Complete Streets and Walkable Communities.
 Chapter 5. Complete Streets and Walkable Communities. 5.1 Description of Complete Streets. Cities throughout the world, and specifically the United States, are coming to embrace a new transportation and
City of Davenport CitiBus Public Transportation Study. April 2015
 City of Davenport CitiBus Public Transportation Study April 2015 Overview Project Background Key Findings CitiBus Service Allocation Policy Discussion 2 Project Background 3 About CitiBus Operates 17 routes
Agenda. Overview PRINCE GEORGE S PLAZA METRO AREA PEDESTRIAN PLAN
 PRINCE GEORGE S PLAZA METRO AREA PEDESTRIAN PLAN May 28, 2008 Agenda Welcome and introductions Project overview and issue identification Planning context and strengths Design challenges and initial recommendations
BRT for Berkeley A Proposal for Consideration
 BRT for Berkeley A Proposal for Consideration CITY OF BERKELEY STAFF PROPOSAL FOR A LOCALLY PREFERRED ALTERNATIVE OF THE EAST BAY BUS RAPID TRANSIT PROJECT SEPTEMBER 8, 2009 Table of Contents Executive
Incorporating Health in Regional Transportation Planning
 Mayor Karl Dean, Chairman Incorporating Health in Regional Transportation Planning Leslie A. Meehan, AICP Center TRT Intervention Webinar January 29, 2013 Objectives for Today Background About the Nashville
Agency Advisory Group Meeting #3 and Walk Audit Anchorage Non-Motorized Plan
 Agency Advisory Group Meeting #3 and Walk Audit Anchorage Non-Motorized Plan Friday, May 18 th Walk Audit 10:00-11:30 AM Meeting 11:30 AM 1:00 PM Municipal Planning Department, 4700 Elmore Road, Training
Creating Complete Streets to Accommodate All Users
 Creating Complete Streets to Accommodate All Users Peter Lagerwey, Toole Design Group plagerwey@tooledesign.com Brian Dougherty, Seattle DOT brian.dougherty@seattle.gov International Conference on Urban
Incorporating Health in Regional Transportation Planning
 Mayor Karl Dean, Chairman Incorporating Health in Regional Transportation Planning Leslie A. Meehan, AICP Center TRT Intervention Webinar January 29, 2013 Objectives for Today Background About the Nashville
APPENDIX A: Complete Streets Checklist DRAFT NOVEMBER 2016
 APPENDIX A: Complete Streets Checklist DRAFT NOVEMBER 2016 Complete Streets Checklist MetroPlan Orlando s Complete Streets Checklist is an internal planning tool for staff to further implementation of
Vision Zero Task Force February 28, Collision Landscape Analysis
 Vision Zero Task Force February 28, 2017 Collision Landscape Analysis Welcome! What happened since our last Task Force meeting: City Council adopted the Vision Zero Resolution Applied for an OTS grant
Calculating the ROI of TDM for Physical Activity in Arlington, VA. Sonali Soneji, AICP Simple Solutions Planning & Design, LLC
 Calculating the ROI of TDM for Physical Activity in Arlington, VA Sonali Soneji, AICP Simple Solutions Planning & Design, LLC March 12, 2014 Research Question What is the Return on Investment of Arlington
Is St. Louis Ready for a Bike Share System? May 14, 2014 Public Open House
 Is St. Louis Ready for a Bike Share System? May 14, 2014 Public Open House PRESENTATION AGENDA 2 BIKE SHARE How does it work? What are the benefits? Who would use it? Will it be safe? Would it work in
Building a Toronto that Moves
 Building a Toronto that Moves Image courtesy of the City of Toronto Setting Election Priorities for Walking, Cycling & Public Transit Toronto is a fast-paced, dynamic city. It s a city that moves except
City of Decatur, GA. Speed Limits Study and Proposal
 City of Decatur, GA Speed Limits Study and Proposal Table of Contents SUMMARY 2 HEALTH IMPACTS 5 EXAMPLES 6 ASSESSMENT 7 Current Speed Limits 7 Safe Routes To School 9 Speed Limit Enforcement 11 Accidents
Cherry Creek Transportation and Land Use Forum September 25, 2013 Meeting Summary
 Cherry Creek Transportation and Land Use Forum September 25, 2013 Meeting Summary I. LEAD-IN TO SMALL GROUP DISCUSSION, POLLING AND STEERING COMMITTEE/TECHNICAL TASK FORCE DISCUSSION The meeting began
I-35W Solutions Alliance Project Update July 13, 2017
 Title I-35W Solutions Alliance Project Update July 13, 2017 Evaluating the potential for Bus Rapid Transit and MnPASS Express Lanes in the southwest Metro, Investigating options for improved bus service
Project Kickoff Meeting February 15, 2018
 Project Kickoff Meeting February 15, 2018 Scope of Work: Study Area Project Goals Develop traffic calming alternatives to the Vine Street local right of way, to mitigate speeding. Develop concept plans
Westside Transportation Access Needs Assessment - Short and Long Term Improvements
 ABSTRACT The Los Angeles County Metropolitan Transportation Authority (MTA) adopted the 2001 Long Range Transportation Plan (LRTP), which sets out the County s transportation investments for the next 20-25
Chapter 2. Bellingham Bicycle Master Plan Chapter 2: Policies and Actions
 Chapter 2 Bellingham Bicycle Master Plan Chapter 2: Policies and Actions Chapter 2: Policies and Actions The Bicycle Master Plan provides a road map for making bicycling in Bellingham a viable transportation
EL CAMINO REAL BUS RAPID TRANSIT (BRT) PROJECT
 PROJECT") Agenda Item #4.2 EL CAMINO REAL BUS RAPID TRANSIT (BRT) PROJECT VTA BOARD WORKSHOP MAY 1, 2015 ABOUT THIS PRESENTATION CONTEXT Existing conditions and planning for growth WHAT IS THE PROJECT? Project alternatives
Agenda Item #4.2 EL CAMINO REAL BUS RAPID TRANSIT (BRT) PROJECT VTA BOARD WORKSHOP MAY 1, 2015 ABOUT THIS PRESENTATION CONTEXT Existing conditions and planning for growth WHAT IS THE PROJECT? Project alternatives
Detroiters need to be able to conveniently and reliably get to work, school, church, stores, and parks.
 Environment & MOBILITY Detroiters need to be able to conveniently and reliably get to work, school, church, stores, and parks. Several surveyed challenges related to lack of mobility ranked in the top
Regional Transportation Needs Within Southeastern Wisconsin
 Regional Transportation Needs Within Southeastern Wisconsin #118274 May 24, 2006 1 Introduction The Southeastern Wisconsin Regional Planning Commission (SEWRPC) is the official areawide planning agency
Planning for Bus Rapid Transit in the Milwaukee Region
 Planning for Bus Rapid Transit in the Milwaukee Region Milwaukee County East-West BRT Study Preferred Route UWM Bus Rapid Transit Course, Fall 2015 Cleveland Health Line Bus Rapid Transit Panelists Kevin
Rhode Island Moving Forward Long-Range Transportation Plan 2040 Municipal Roundtable Newport County
 Rhode Island Moving Forward Long-Range Transportation Plan 2040 Municipal Roundtable Newport County www.planri.com PlanRI2040@gmail.com Municipal Roundtable Meeting Summary Date/time: Location: Wednesday,
Title VI Fare Change Equity Analysis
 Title VI Fare Change Equity Analysis Evaluation Report Submitted to Dallas Area Rapid Transit Submitted by TranSystems June 2012 Title VI Fare Change Equity Analysis Introduction DART has proposed a schedule
Everett Transit Action Plan. Community Open House November 16, 2015
 Everett Transit Action Plan Community Open House Everett has a great location, but getting around the city and into surrounding communities is a problem for all ages Many Voices, One Future: The Everett
Access BART: TOD and Improved Connections. October 29, 2008
 Access BART: TOD and Improved Connections October 29, 2008 1 Access BART Study Goals Evaluate at the system-level land use and access scenarios to optimize ridership Identify station clusters that provide
Complete Streets. presented by Active Transportation Alliance. Chicagoland s voice for better biking, walking and transit.
 Complete Streets presented by Active Transportation Alliance 1 Overview Why Complete Streets matter Overview of Complete Streets Benefits of Complete Streets Case studies Active Living = Active Transportation
Wilshire Boulevard Bus Rapid Transit Project
 Los Angeles County Metropolitan Transportation Authority Wilshire Boulevard Bus Rapid Transit Project COMMUNITY MEETINGS November 2008 Agenda Introduction Proposed Project Overview Participating Agencies
Transit Initiatives 1
 Transit Initiatives 1 TPA Transit Overview Capital Projects Transit Planning Initiatives Challenges Tri-Rail Layover Facility, New Boca Station Northern Layover Facility $28.7 M; Completion in 2023 Boca
CITY OF COCOA BEACH 2025 COMPREHENSIVE PLAN. Section VIII Mobility Element Goals, Objectives, and Policies
 CITY OF COCOA BEACH 2025 COMPREHENSIVE PLAN Section VIII Mobility Element Goals, Objectives, and Policies Adopted August 6, 2015 by Ordinance No. 1591 VIII MOBILITY ELEMENT Table of Contents Page Number
Arlington County 10-Year Transit Development Plan & Premium Transit Network Briefing. May 2016
 Arlington County 10-Year Transit Development Plan & Premium Transit Network Briefing May 2016 Overview 10-Year Transit Development Plan Premium Transit Network Columbia Pike service concept Premium amenities
Measuring Success: Performance Metrics and Project Selection
 Measuring Success: Performance Metrics and Project Selection Fayetteville Mobility Plan Presented by: Jeffrey Tumlin March 19, 2018 How do we use transportation performance metrics? Improving efficiency