WHITE OAK SCIENCE GATEWAY MASTER PLAN Transportation Appendix
|
|
|
- Zoe Tyler
- 6 years ago
- Views:
Transcription

1 WHITE OAK SCIENCE GATEWAY MASTER PLAN Transportation Appendix Montgomery County Planning Department M-NCPPC
2 Contents Master Plan and Study Area Boundaries... 1 Existing Conditions Master Planned Roadway Network... 1 Intersection Capacity and Roadway Traffic Volumes... 2 US 29 (Columbia Pike) Overview External Trip Making Profile Existing Metrobus and Ride-On Service Relevant Transit Planning Efforts Technical Approach for Recommendations Pertaining to BRT Summary BRT Network Recommendations Other Transit Service Pedestrian Network Existing Conditions Transit-Oriented Development and Density Non-Auto Driver Mode Share Assumptions Transportation Policy Area Review (TPAR) Local Area Transportation Review (LATR) Cordon Line Analysis Vehicular Traffic Volumes Recommended Master Plan Roadway Network Travel Demand Forecasting Process and Assumptions Travel/3 Forecasting Assumptions Local Area Modeling Process and Assumptions Figures Figure 1 Master Plan and Study Area Boundaries... 1 Figure 2 Traffic Analysis Sub-Zones and Network for Local Area Model (LAM)... 2 Figure 3 Existing Intersection CLVs Using 1600 CLV as the Congestion Standard... 6 Figure 4 US 29 South of Industrial Parkway - AADT Volumes... 7 Figure 5 US 29 South of New Hampshire Avenue - ADDT Volumes... 7 Figure 6 US 29 South of I AADT Volumes... 8 Figure 7 US 29 South of University Boulevard - AADT Volumes... 8 Figure 8 New Hampshire Ave. North of Randolph Road - AADT Volumes... 9 Figure 9 New Hampshire Avenue North of US 29 - AADT Volumes... 9 Figure 10 New Hampshire Avenue North of I AADT Volumes Figure 11 New Hampshire Ave. South of University Blvd.-AADT Volumes Figure 12 Randolph Road West of New Hampshire Ave. - AADT Volumes Figure 13 Cherry Hill Road South or East of US 29 - AADT Volumes Figure 14 Cherry Hill Road East of Powder Mill Road - AADT Volumes Figure 15 Composition of External Travel Along US 29 Current Conditions Figure 16 Composition of External Travel Along US 29 Year Figure 17 Existing Local Bus Routes in the WOSG Plan Area and Vicinity Figure 18 Bus Rapid Transit Conceptual Alignments and Station Locations
3 Figure 19 Plan Area Sidewalk Inventory Figure 20 Characteristics of Mixed-Use Transit-Oriented Development Figure 21 Transit Station Area Employment Densities Figure 22 Transit Station Area Household Densities Figure 23 Transit Station Area Land Use Densities All Stations Figure 24 Transit Station Area Land Use Densities Low Density Stations Figure 25 Countywide TPAR Analysis Results Figure 26 Countywide TPAR Analysis Results Excluding US 29 Traffic Figure 27 Intersection Congestion Standards by Policy Area Figure 28 Intersection Analysis Alternative Master Plan Scenario with US 29 Interchanges and Full Complement of Un-programmed Improvements Figure 29 Intersection Analysis Alternative Master Plan Scenario with US 29 Interchanges and Selected Un-programmed Improvements Figure 30 Powder Mill Road and Cherry Hill Road Figure 31 US 29 and University Boulevard Figure 32 Changing Trip Profile with the Plan Vision Figure 33 Street and Highway Classification Map Figure 34 Travel Forecasting Network Tables Table 1 Existing Street and Highway Classifications... 3 Table 2 Existing Critical Lane Volumes (CLVs)... 4 Table 3 MDSHA Intersection Level of Service (LOS) at Selected Locations Table 4 Existing Local Bus Service in the WOSG Plan Area and Vicinity Table 5 US 29 BRT Corridor Table 6 New Hampshire Avenue BRT Corridor Table 7 Randolph Road BRT Corridor Table 8 Summary of Land Use/Transportation Scenarios Table 9 Standards of Acceptable Roadway Average Level of Service (LOS) Table 10 Intersection Congestion Standards by Policy Area Table 11 Intersection Analysis Alternative Master Plan Scenario with US 29 interchanges and Full Complement of Un-programmed Improvements Table 12 Intersection Analysis Alternative Master Plan Scenario with US 29 Interchanges and Selected Un-programmed Improvements Table 13 Master Plan Cordon Line Traffic Volumes Table 14 Existing and Proposed Street and Highway Classifications Table 15 Local Area Model Peak Hour Trip Generation... 58
. The study area is comprised of the traffic analysis zones (TAZ s) which are within and contiguous to the Plan boundary.")
4 Master Plan and Study Area Boundaries The transportation analysis for the White Oak Science Gateway Master Plan takes into account a larger study area and a smaller area defined by the Plan boundary (see Figure 1). The study area is comprised of the traffic analysis zones (TAZ s) which are within and contiguous to the Plan boundary. The definition of the Plan area is important in that it is the first step in establishing the interface between the regional transportation model (Travel/3) and the Master Plan-specific local area model (LAM). The Plan boundary is formally established by the Planning Board during its deliberations on the Plan scope of work. The more detailed transportation analysis (using the LAM and other analysis tools) is conducted on the area within the Plan boundary. Figure 1 Master Plan and Study Area Boundaries The Plan area is further divided into sub-zones (see Figure 2) that provide a basis for further delineation of the road network. It is at this level using these sub-zones where the local area model (LAM) is applied. The application of the model involves two major phases the first being a replication of the existing conditions and a second being a forecast of future conditions. Existing Conditions Master Planned Roadway Network There are a number of major roadways that currently serve the Master Plan area. A summary of the currently adopted master-planned streets and highways in the Master Plan area is provided in Table 1. 1
.")
5 Figure 2 Traffic Analysis Sub-Zones and Network for Local Area Model (LAM) Intersection Capacity and Roadway Traffic Volumes There are a number of ways to measure the quality of service provided by a transportation network. In Montgomery County, the method of measuring network performance is established by the County s Subdivision Staging Policy (formerly called the Growth Policy). This policy requires consideration of the critical lane volume at major intersections as the major component of measuring the quality of service provided by the network. Critical lane volumes (CLVs) are essentially the sum of vehicles passing through an intersection at a single point. The level of CLVs considered acceptable varies by Policy Area within the County. Master Plan intersections included in this analysis are located within the Fairland/White Oak Policy Area, which has a congestion standard of 1,475 CLV. Intersections at or above 1,475 CLV are considered to be failing or not within the acceptable standard for the Policy Area. 2
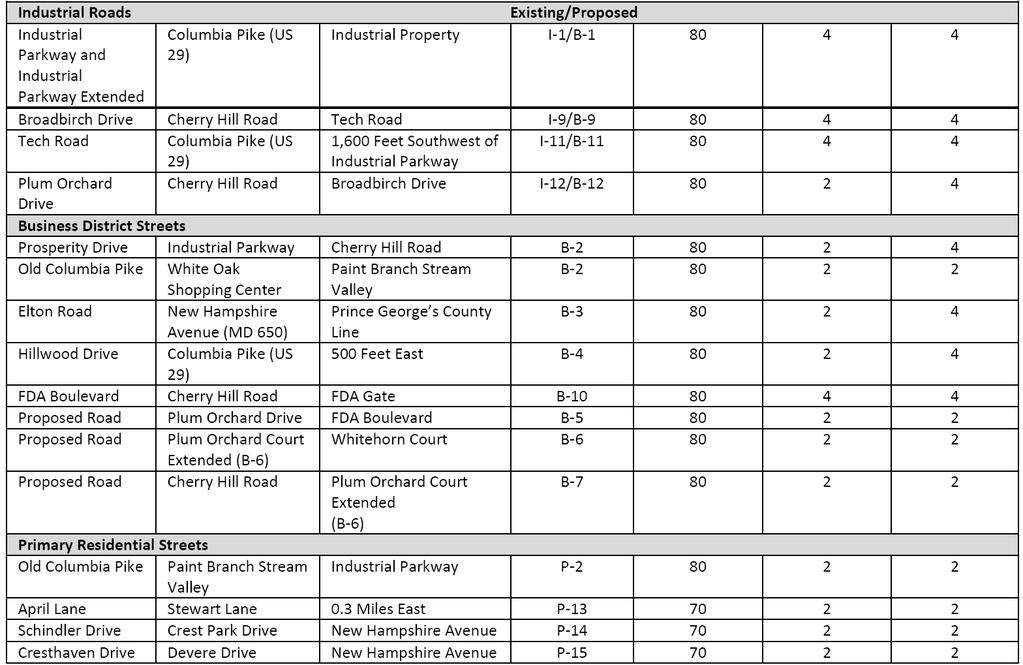
6 Table 1 Existing Street and Highway Classifications Master Planned Streets From To Freeways Master Plan of Highways No. Current Master Planned Minimum Right of Way (Feet) 1 Existing Number of Through Travel Capital Beltway (I-495) Northwest Branch Stream Valley Prince George's County Line F Divided Major Highways Columbia Pike (US 29) East Randolph Road / Cherry Hill Road Paint Branch Stream Valley CM Divided Paint Branch Stream Valley New Hampshire Avenue (MD 650) CM Divided New Hampshire Avenue (MD 650) Northwest Branch Stream Valley M Divided New Hampshire Avenue (MD 650) Columbia Pike (US 29) Capital Beltway (I-495) M Divided Arterials Cherry Hill Road Columbia Pike (US 29) Prince George's County Line A Powder Mill Road New Hampshire Avenue (MD 650) Prince George's County Line A Lockwood Drive (MD 895) Columbia Pike (US 29) 400 Feet West of New Hampshire Avenue (MD 650) A Lockwood Drive 400 Feet West of New Hampshire Avenue (MD 650) East Side of White Oak Shopping Center A Lockwood Drive East Side of White Oak Shopping Center Lockwood Drive Extended A Lockwood Drive Extended Lockwood Drive Stewart Lane A Stewart Lane Lockwood Drive Extended Columbia Pike (US 29) A Industrial Roads Industrial Parkway and Industrial Parkway Extended Columbia Pike (US 29) Industrial Property I Prosperity Drive Industrial Parkway Cherry Hill Road I Broad Birch Drive Cherry Hill Road Tech Road I FDA Access Road Cherry Hill Road FDA Gate I Tech Road Columbia Pike (US 29) 1,600 Feet Southwest of Industrial Parkway I Plum Orchard Drive Cherry Hill Road Broad Birch Drive I Business District Streets Prosperity Drive Industrial Parkway Cherry Hill Road B Old Columbia Pike White Oak Shopping Center Paint Branch Stream Valley B Elton Road New Hampshire Avenue (MD 650) Prince George's County Line B Hillwood Drive Columbia Pike (US 29) 500 Feet East B Primary Residential Streets Old Columbia Pike Paint Branch Stream Valley Industrial Parkway P April Lane Stewart Lane 0.3 Miles East P Schindler Drive Crest Park Drive New Hampshire Avenue (MD 650) P Cresthaven Drive Devere Drive New Hampshire Avenue (MD 650) P /13/11 Lanes 2 Current Master Planned Number of Through Travel Lanes 1 Reflects minimum right-of-way, and may not include lanes for turning, parking, acceleration, deceleration, or other purposes auxillary to through travel. Rights-of-way are considered to be measured symmetrically based 2 The recommended number of lanes refers to the number of planned through travel lanes for each segment. 3 Reflects the most representative roadway cross-section. 3
7 Existing CLVs for major intersections in the study area are shown in Table 2. Table 2 Existing Critical Lane Volumes (CLVs) County Intersection AM CLV PM CLV MC Old Columbia Pike & Fairland Rd MC US 29 & Fairland Rd MC US 29 & Musgrove Rd MC US 29 & University Blvd (N) MC US 29 & University Blvd (S) MC Powder Mill Rd & Cherry Hill Rd PG Powder Mill Rd & Beltsville Rd PG Fairland Rd & Briggs Chaney Rd MC Old Columbia Pike & Musgrove Rd MC Fairland Rd & Musgrove Rd MC Old Columbia Pike & Randolph Rd MC US 29 & Industrial Pkwy * MC US 29 & Stewart Ln * MC New Hampshire Ave & Mahan/Schindler * MC New Hampshire Ave & Chalmers* MC New Hampshire Ave & Powder Mill * MC New Hampshire Ave & I-495 * MC Cherry Hill Rd & Broadbirch/Calverton * MC US 29 & Tech Rd * MC New Hampshire Ave & Northwest * MC Cherry Hill Rd & Prosperity* MC Cherry Hill Rd & Plum Orchard/Cloverpatch * PG Powder Mill Rd & Riggs Rd MC Cherry Hill Rd & FDA Blvd * MC US 29 & Cherry Hill (Interchange)* MC New Hampshire Ave & Lockwood Dr * Notes: (1) * Denotes intersection locations within the Plan area. (2) Intersection CLVs within the Plan area that exceed the Policy Area standard are highlighted in red. 4
8 The Planning Department analysis of the existing CLVs for the major intersections located within the Plan area indicates that the following intersection exceeds the 1,475 CLV standard specified by policy during both the morning and afternoon peak hour of travel. US 29 and Tech Road Two other intersections within the Plan area exceed the 1,475 CLV standard during the PM peak hour: US 29 and Stewart Lane Cherry Hill Road and Broadbirch Drive / Calverton Boulevard Within Montgomery County and near but not within - the Plan area, the US 29 intersection with Fairland Road and the US 29 intersection with University Boulevard at Four Corners exceed the applicable policy area CLV standard during both the morning and afternoon peak hour. It should be noted that US 29 intersection with University Boulevard is located within the Kensington/Wheaton policy area which has a 1600 CLV congestion standard. Within Prince George s County and near the Plan area, the intersection of Powder Mill Road and Beltsville Road exceeds the Montgomery County Fairland/White Oak policy area congestion standard during the PM peak hour. Prince George s County does not use existing or forecasted intersection CLVs as a means of determining network adequacy for master planning. Figure 3 depicts the existing CLVs by intersection location using a CLV of 1600 as the congestion Level of Service standard. The rationale for using 1600 CLV as the congestion threshold (rather than the current 1475 CLV standard for the Fairland/White Oak policy area) stems from the Plan recommendation to raise the congestion standard to this level within the boundary of the Plan area when BRT becomes a travel option. There are other sources of information regarding the current performance of the road network in the Plan area. This information is briefly discussed below. The Maryland State Highway Administration (MDSHA) web site includes Average Annual Daily Traffic (AADT) count data, level of service (LOS), and traffic trend data for US 29 (Columbia Pike), MD 650 (New Hampshire Avenue) and Randolph Road/Cherry Hill Road. The traffic trend data for these major roadways at selected intersections are presented in Figures 4 through 14 below. 5

9 Figure 3 Existing Intersection CLVs Using 1600 CLV as the Congestion Standard 6
10 Figure 4 US 29 (Colesville Road) South of Industrial Parkway Average Annual Daily Traffic Volumes Figure 5 US 29 South of MD 650 (New Hampshire Avenue) Average Annual Daily Traffic Volumes

 Average Annual Daily Traffic Volumes 2004")
11 Figure 6 US 29 (Colesville Road) South of I-495 Average Annual Daily Traffic Volumes Figure 7 US 29 (Colesville Road) South of MD 193 (University Boulevard) Average Annual Daily Traffic Volumes
12 Figure 8 MD 650 (New Hampshire Avenue) North of Randolph Road Average Annual Daily Traffic Volumes Figure 9 MD 650 (New Hampshire Avenue) North of US 29 Average Annual Daily Traffic Volumes
13 Figure 10 MD 650 (New Hampshire Avenue) North of I-495 Average Annual Daily Traffic Volumes Figure 11 MD 650 (New Hampshire Avenue) South of MD 193 (University Boulevard) Average Annual Daily Traffic Volumes
14 Figure 12 Randolph Road West of MD 650 (New Hampshire Avenue) Average Annual Daily Traffic Volumes Figure 13 Cherry Hill Road South or East of US 29 (Columbia Pike) Average Annual Daily Traffic Volumes
15 Figure 14 Cherry Hill Road East of MD 212 (Powder Mill Road) Average Annual Daily Traffic Volumes In general, the data for the corridor traffic volumes during this eight year period indicate a downward trend on New Hampshire Avenue and Randolph/Cherry Hill Roads that has not occurred on US 29. The lower volumes are thought to be primarily attributable to the recent recession and are similar to the national trend for the time period in question. Within the County, most major corridors reflect a trend similar to New Hampshire Avenue. The exceptions are I-270, I-495, and US 29 roadways that proportionally accommodate more travel between Montgomery and neighboring counties in Maryland or Virginia and the District of Columbia. The (MDSHA) web site also includes traffic count data and Level of Service (LOS) information on major intersections within the Plan area. Table 3 depicts the available information from the web site on intersection performance at key intersections within and near the Plan area. It is important to note that an intersection with a LOS of F under the SHA methodology is not necessarily equivalent to an intersection that fails under the County s Subdivision Staging Policy (or vice-versa). 12
16 Table 3 MDSHA Intersection Level of Service (LOS) at Selected Locations Intersection Count Date AM LOS PM LOS US 29 at Fairland Road 06/01/2011 F F US 29 at Tech Road 05/24/2011 D F US 29 at Industrial Parkway 09/14/2006 E D US 29 at Stewart Lane 02/23/2011 D F US 29 at Lockwood Drive 05/25/2010 E E MD 650 at Elton Road 01/19/2011 C B MD 650 at Powder Mill Road 01/13/2011 D D MD 650 at Schindler Drive/ Mahan Road 02/08/2011 B A MD 650 at Lockwood Drive 06/07/2011 C C East Randolph Road at Old Columbia Pike 03/07/2006 A A MD 212 at Cherry Hill Road 05/18/2010 B C US 29 (Columbia Pike) Overview US 29 (Columbia Pike) is a six lane divided major highway that traverses the southern end of the Plan boundary (Northwest Branch) to the northern end (East Randolph/Cherry Hill Roads). Current (2010) average annual daily traffic is in the 60,000 to 65,000 range within the Plan area. The trend, as previously noted, is up since 2004 an average annual increase of about 1.5%. Within the Plan area there are full grade-separated interchanges where US 29 intersects New Hampshire Avenue and East Randolph/Cherry Hill Road. There are master planned (but not programmed) grade-separated interchanges within the Plan area at Stewart Lane and Tech Road/Industrial Parkway. The at-grade intersections at Stewart Lane and Tech Road are operating at LOS F based upon the latest available SHA count data (see Table 3 above). Beyond (but nearby) the Plan area there are existing grade-separated interchanges along US 29 to the north at Briggs Chaney Road and at the ICC. The US 29 master planned right-of -way varies between 100 and 200 feet along the segment within the Plan area. The existing applicable master plans (1997 Fairland Master Plan for the segment between Randolph/Cherry Hill Roads and the Paint Branch Stream Valley and 1997 White Oak Master Plan for the remaining segment to the south) both envision no more than six through lanes. The adjacent land use in the corridor includes single family (including townhouses), multifamily (both garden apartment and high-rise), and commercial (office, light industrial, retail, and other uses - hotels/institutional mainly). The setting is for the most part one that is auto oriented in context and scale and is dominated by the campus of the Federal Research Center at White Oak where the U.S. Food and Drug Administration (FDA) is 13
17 located and the light industrial and office park sites near the intersection of US 29 and East Randolph/Cherry Hill Road. External Trip Making Profile Because US 29 is a major corridor for trips entering and exiting the County, it is important to briefly examine the characteristics and scope of these trips when reviewing even the existing conditions. The following general attributes of the trips as currently forecasted by the regional model for 2040 using the COG adopted Round 8.1Cooperative Forecast land use data are worth noting. About 12,000 person trips per weekday in 2040 are expected to be made between the Fairland/ White Oak Policy area to jobs in the District of Columbia. This amounts to about 1% of the total person trips originating in the County but is nevertheless the 8 th highest origin/destination pair among the sub districts or policy areas. The forecasted number of home based work (person) trips from all of Howard County to jobs within all of Montgomery County is 6,400. Most of these trips will be made on either US 29 or I-95. The comparable number of home based work trips from Frederick County to jobs within Montgomery County is 38,000 (via I-270 for the most part). The comparable number of home based work trip from Fairfax County to jobs within Montgomery County is 12,800 (via I-495 for the most part). It is important to again note that I-270 and US 29 (and I-495 to a somewhat lesser extent) are essentially the only major corridors within the County where the average annual daily traffic volumes have increased over the last seven years. Given the function of Columbia Pike (US 29) as a major regional commuter facility linking Montgomery County with Howard County to the north and the District of Columbia to the south, it is useful to examine the composition of external traffic along this roadway. In this context, external traffic is defined as traffic originating primary in Howard County and points north. Figure 15 depicts the current (i.e., year 2010) composition of external daily traffic traveling southbound along US 29 after crossing the bridge over the Patuxent River. Based on the analysis of data derived from the application of the Department s regional transportation model, approximately 54% of this traffic is external on US29 just north of Cherry Hill/East Randolph Road (the northern boundary of the Plan area). The component of external traffic drops to 26% on US 29 just south of New Hampshire Avenue. On US 29 just south of the Beltway (I-495) the component of external traffic drops to approximately 9%. On US 29 at the boundary of the County with the District of Columbia the component of external traffic is estimated to be roughly 3.5%. Figure 16 depicts comparable information for the year 2040 assuming the Plan s Alternative Master Plan scenario and supporting transportation network. 14
18 Figure 15 Composition of External Travel Along US 29 Current Conditions 15

19 Figure 16 Composition of External Travel Along US 29 Year

20 Existing Metrobus and Ride-On Service A map depicting the existing Metrobus and Ride-On service operating in the Plan area and its immediate vicinity is provided below in Figure 17. Figure 17 Existing Local Bus Routes in the WOSG Plan Area and Vicinity Overall local bus coverage is relatively extensive within the Plan area taking into account that much of the bus service is unable to circulate within or traverse through the Federal Research Center site. Multiple routes operate over the alignments shown in the map as indicated in the summary provided in Table 4 below. 17
21 Table 4 Existing Local Bus Service in the WOSG Plan Area and Vicinity Line Route From To Via Peak Period Headway Notes Greencastle - Briggs Chaney Express Line Greencastle - Briggs Chaney Express Line Colesville - Ashton Line Calverton - Westfarm Line Metrobus Z11 Metrobus Z 13 Metrobus Z2 Metrobus Z 6 Fairland Line Metrobus Z 8 Riggs Road Line Metrobus R 2 Riggs Road Line Metrobus R 5 New Hampshire Ave. Maryland Line College Park - White Flint Line Ride-On Ride-On Ride-On Ride-On Ride-On UMD College Park Metrobus Route K 6 Metrobus Route C8 Ride On Route 10 Ride On Route 20 Ride On Route 21 Ride On Route 22 Ride On Route 39 UM Shuttle Route 100 Greencastle Park & Ride Greencastle Park & Ride Montgomery General Hospital Burtonsville Crossing / Briggs Chaney Park & Ride Lots Greencastle / Briggs Chaney Park & Ride Plum Orchard Dr. & Broadbirch Dr. Plum Orchard Dr. & Broadbirch Dr. White Oak White Flint Metrorail Twinbrook Metrorail Hillandale Briggs Chaney Park & Ride Silver Spring Metrorail Briggs Chaney Park & Ride Burtonsville Park & Ride Lot Silver Spring Metrorail Silver Spring Metrorail Silver Spring Metrorail Silver Spring Metrorail Silver Spring Metrorail Fort Totten Metrorail Fort Totten Metrorail Fort Totten Metrorail College Park UMD Metrorail Hillandale Silver Spring Metrorail Silver Spring Metrorail FRC / FDA Glenmont Metrorail UMD College Park Columbia Pike / Colesville Road (US 29) Columbia Pike / Colesville Road (US 29) New Hamshire Ave (MD 650) / Colesville Road (US 29) Columbia Pike / Lockwood Drive / Colesville Road (US 29) Old Columbia Pike / Columbia Pike / Lockwood Drive / Colesville Road (US 29) Powder Mill Road / Riggs Road (MD 212) / Prince George's Plaza Powder Mill Road / Riggs Road (MD 212) / Prince George's Plaza New Hamshire Ave (MD 650) Randolph Road / New Hampshire Ave. (MD 650) / Adelphi Road Randolph Road / Columbia Pike /New Hampshire Ave. (MD 650) New Hamshire Ave (MD 650) / Piney Branch Road (MD 320) Briggs Chaney Road / Fairland Road / New Hampshire Ave. (MD 650) / Columbia Pike / Colesville Road (US 29) New Hampshire Ave. (MD 650) / Columbia Pike / Colesville Road (US 29) Briggs Chaney Road / Bonifant Road / Layhill Road Columbia Pike (US 29) / Cherry Hill Road / Baltimore Ave (US 1) min min min. Peak Period & Peak Direction Only Peak Period & Off Peak Direction Only Peak Period Only min. All Day Service min. 30 min min Min. All Day Service with Focus on Segment Between White Oak (Stewart Lane & Old Columbia Pike)and Silver Spring Metro All Day Service with Focus on Minute Midday Service to Prince George's Plaza & NB AM Peak Period Trips All Day Service - Most Trips NB in Afternoon All Day Service But Serves FRC / FDA via Mahan Road Peak Hour Peak Direction Only 30 Min. All Day Service 30 Min. All Day Service 7-10 Min. All Day Service 30 Min. 15 Min. 30 Min. N/A Peak Period & Peak Direction Only Service is Peak Period Only and Focus is Peak Direction Service is Peak Period Only and Focus is Peak Direction One AM and One PM Trip
22 In general, the following profile can be used to describe the more prominent existing transit service within the Plan area: Ride-On Route 10 operates along the segments of US 29 and New Hampshire Avenue that are either adjacent to, or within, the plan boundary. This route provides 30 minute service during weekday peak periods connecting the Plan area to the Glenmont and Twinbrook Metrorail stations to the west via Randolph Road. US 29 (Columbia Pike) is well served in the weekday peak period by Metrobus Routes Z11, Z6, and Z8. These routes connect the Plan area with the Silver Spring Metrorail station. The combined frequencies of all buses operating on US 29 in or near the Plan area in the peak direction during peak periods is estimated to be somewhere between 2 and 4 minutes. MD 650 (New Hampshire Avenue) in the Plan area is served with frequent peak period service by Metrobus Routes K6 and C8, along with Ride-On Route 22. Route K6 connects the Plan area with the Fort Totten Metrorail station and Route C8 connects White Flint with UMD College Park via Randolph Road, New Hampshire Avenue and Adelphi Road. Route 22 connects the Federal Research Campus and FDA with the Silver Spring Metrorail station and Transit Center. The combined frequencies of all buses operating on New Hampshire Avenue in or near the Plan area in the peak direction during peak periods is estimated to be somewhere between 5 to 7 minutes. Service to and from Prince George s County from the Plan area is provided by Metrobus Route C8 as noted above and also Metrobus Routes R2 and R5 that connect the Plan area with the Fort Totten Metrorail station and Prince George s Plaza (Route R2 only) via Powder Mill Road and Riggs Road. Relevant Transit Planning Efforts Several recent transit planning efforts are relevant to the WOSG Plan. The results of these efforts help form the basis for the development of the BRT network-related recommendations for this Plan. These transit planning efforts are briefly described below. WMATA Priority Corridor Network (PCN) WMATA s PCN is a planning strategy that looks at improvements in selected high ridership bus corridors throughout the region that can be implemented quickly and efficiently. The overall objective is to increase average bus speeds, service reliability, capacity, ridership levels, and access to the system. There are two corridors (New Hampshire Avenue and Colesville Road/Columbia Pike/US 29) within the Plan area that are included in WMATA s PCN. Recommended improvements are based upon corridor specific studies for each of the 24 corridors that comprise the PCN. Improvements are generally identified as either nearterm (1-2 years) or long term (2+ years) for purposes of implementation. Improvements of the type (dedicated lanes, etc.) generally considered in master plans fall into the long term category. 19
23 WMATA has completed a corridor specific study for New Hampshire Avenue. The study recommends the introduction during the long term of frequent limited stop express service along New Hampshire Avenue between White Oak and the Fort Totten Metrorail station via the planned Takoma Langley Transit Center (a Purple Line station). Dedicated transit lanes (possibly peak period only) are recommended on New Hampshire Avenue between I-495 and the Takoma Langley Transit Center. As a first step toward implementation, a new limited stop K9 Metro Extra service was introduced in the New Hampshire Avenue corridor immediately south of the Plan area in late WMATA has not completed a corridor specific study of the US 29 corridor. Countywide Bus Rapid Transit (BRT) Study The Montgomery County Department of Transportation (MCDOT) completed a feasibility study in July 2011 of a network of BRT corridors that also included US 29/Columbia Pike/ Colesville Road and New Hampshire Avenue. The Countywide BRT Study also included a route on Randolph Road from White Flint Metrorail to Glenmont Metrorail. The study initially examined a route on Randolph Road/Cherry Hill Road that extended east of the Glenmont Metrorail to the Prince George s County line. This segment was not carried forward to the final set of routes evaluated in the hypothetical network because of the lower (relative to other areas) population and employment densities and resulting lower ridership forecast. The US 29 corridor recommendation included service from the Burtonsville Park and Ride Lot to the Silver Spring Metrorail station. Eleven potential station locations were identified. The station locations within or near the Plan area included the following: US 29 and Fairland Road US 29 and Tech Road White Oak Transit Center Lockwood Drive and Oak Leaf Drive US 29 and Hillwood Drive MCDOT s Countywide BRT Study was a feasibility study that examined the potential for a BRT network that would theoretically operate within the existing (i.e., not master planned ) right-of-way in each of the proposed corridors. Specific assumptions (concept level) on the typical sections and other features in the US 29 / Columbia Pike corridor within or near the Plan area included the following: Two way unguided median transitway (36 feet in width) from Fairland Road to Stewart Lane Potential queue jump opportunities (if curb lane operation)at Fairland Road and Tech Road Potential one way guided median transitway (15 feet in width) from Lockwood Drive to Southwood Avenue. 20
24 The New Hampshire Avenue corridor recommendation included service from the White Oak Transit Center to the Fort Totten Metrorail station. Nine potential station locations were identified. The station locations within the Plan area included the following: White Oak Transit Center New Hampshire Avenue and Schindler Drive/Mahan Road (FDA) New Hampshire Avenue and Powder Mill Road Specific assumptions (concept level) on the typical sections and other features in the New Hampshire Avenue corridor within or near the Plan area included the following: One way unguided median transitway (25 feet) from Lockwood Drive to Ruppert Road One way guided median transitway (15 feet) from Ruppert Road south to plan boundary at I-495. The Countywide BRT Study does not recommend (like the WMATA PCN Plan) dedicated transit lanes (within the existing right-of-way) between the White Oak Transit Center and the Takoma Langley Transit Center. It should also be noted that the concept of a Purple Line Connector between White Oak and the Takoma Langley Transit Center along the New Hampshire Avenue corridor has been included as one of the recommend transit projects in recent joint priority letters from the County Executive and County Council to the MDOT Secretary. The Countywide BRT Study included 2040 ridership forecasts along with assumptions related to the level of service needed to accommodate the forecasted ridership. 1 The US 29 /Columbia Pike/Colesville Road BRT forecast average weekday ridership was in the range of 13,700 to 17,100 a level requiring a service frequency of about 3 to 4 minutes during peak periods. The New Hampshire Avenue BRT forecast average weekday ridership was in the range of 9,400 to 11,700 a level requiring a service frequency of about 5 to 6 minutes during peak periods. The assumptions on service frequencies are based in part on assumptions related to bus size or capacity in this case 60 foot long articulated buses. 1 The ridership forecasts are based upon assumptions for the land uses in 2040 as contained in the COG Round 8.0 Cooperative Forecasts. The land use forecasts generally reflect development anticipated through 2040 under the zoning contained in adopted master plans. 21
25 County Executive s Rapid Transit Task Force and Accompanying Concept Plan The County Executive appointed a Rapid Transit Task Force in February 2011 to follow up on the work and eventual recommendations of the Countywide BRT Study. The Task Force developed a preliminary Concept Plan that included additional detail on the possible attributes or features of selected BRT corridors. This plan was largely (but not entirely) limited to what could be accomplished within the existing right-of-way especially within the running sections - or sections where there are no stations or intersecting streets. There was a general acknowledgment that additional right-of-way beyond the existing right-of-way would be needed to accommodate some station locations and at some of the major intersections where dedicated left turn lanes or a queue jump should be provided. There was also a recommendation that the Planning Department s Countywide Transit Corridors Functional Master Plan should assume 12 to 15 additional feet along each side of a road where it was assumed the bus was operating in a dedicated (for buses) curb lane, where auto lanes were eliminated in favor of dedicated curb lane operation, or where dedicated left turn lanes are eliminated or reversible lane systems are built. About nine miles of the 105 mile network in the Concept Plan involves reversible lane systems or segments. Another five miles of the network is identified as being in Business Access Transit (or BAT) lanes essentially a dedicated curb lane operation as described above. It therefore appears about 15% of the running way segments (i.e., excluding intersections and station locations) in the network would require an additional 12 to 15 feet in order to be implemented. Another 60% of the network is recommended to be in a reversible one-way median guideway that is 10.5 feet wide and adjacent to 10.0 foot wide general purpose travel or turn lanes. Multiple reviewing agencies (including the Planning Department staff) have questioned the assumption that this type of typical section is workable due to the narrow lane widths. Regardless, it is reasonable to assume that considerably more than15% of the running way segments in the network documented in the Concept Plan will require rightof-way beyond that which currently exists (i.e., more than the existing right-of-way but not necessarily more than the master planned right-of-way). Again, this is on running way segments and is therefore in addition to more right-of-way beyond the existing right-ofway that will be needed at intersections and station locations. The Concept Plan included recommendations related to three corridors within the Plan area US 29, New Hampshire Avenue (MD 650), and Randolph Road/Cherry Hill Road. In the Concept Plan, the Randolph Road/Cherry Hill Road segment extends east of the Glenmont Metrorail to FDA Boulevard. Specific recommendations in the Concept Plan for the US 29 corridor include the following: Service between the Silver Spring Transit Center and the Burtonsville Park and Ride Lot 22
26 From University Boulevard (MD 193) north to New Hampshire Avenue (MD 650) remove dedicated left turn lanes and construct a single lane guideway in the median. The concept plan running section width is 74.5 feet and includes one 10.5 foot wide transitway for peak direction travel, two 10 feet lanes in each direction, and one 12 foot curb lane in each direction. A significant portion of this segment has an existing right-of-way of 95 to 105 feet. The Master Plan right-of-way along this segment is 120 feet. From New Hampshire Avenue north to Spencerville/Sandy Spring Road (MD 198) construct a single guideway in the median and keep the left turns lanes. The concept plan running section for this segment is the same 74.5 foot section described above. The existing right-of-way in this section varies considerably as it includes not only Columbia Pike but also parallel Old Columbia Pike and Prosperity Drive to the northern Plan area boundary at East Randolph/Cherry Hill Road. The minimum existing right-of-way is effectively about 135 feet at the bridge crossing of Paint Branch. The widest section is north of Tech Road where the existing right of may exceed 250 feet. The Master Plan right-of-way in the segment from New Hampshire Avenue to Paint Branch is 200 feet. The Master Plan right-of-way from Paint Branch north to East Randolph/Cherry Hill Road varies from 100 to 200 feet. From Tech Road north to Sandy Spring Road (MD 198) it would be possible to initially construct a double guideway in the median. Station platforms or areas at the following locations: o University Boulevard (south of Plan area) o Columbia Pike at Oak Leaf Drive o Columbia Pike and Stewart Lane o Columbia Pike and Industrial Parkway o Briggs Chaney Road (north of Plan area) The Concept Plan recommends that the BRT service stay on Columbia Pike and not detour onto Lockwood Drive. The Countywide BRT study recommends a routing along Lockwood Drive and a station at the White Oak Transit Center located on Lockwood Drive near White Oak Shopping Center. Specific recommendations in the Concept Plan for the New Hampshire Avenue corridor include the following: Overall, service would be provided between the Takoma Langley Transit Center and the ICC with an acknowledgement that the corridor could be extended to the University of Maryland in College Park via Adelphi Road. From Adelphi Road north to Lockwood Drive operate in either mixed traffic in the curb lane or consider repurposing an existing general purpose lane and operate in a Business Access Transit (BAT) lane. The Concept Plan running section width is 80 23
27 feet and includes two 12 foot wide BAT lanes, two 10 feet general purpose lanes in each direction, and a 16 foot median that can accommodate a 10 foot left turn lane. A significant portion of this segment has an existing estimated right-of-way of 100 to 160 feet. The more narrow section is between Powder Mill Road and Chalmers Road. The Master Plan right-of-way along this segment (and all of New Hampshire Avenue within the Plan area) is 120 feet. From Lockwood Drive to Heartfields Drive/Quaint Acres Drive, operate in mixed traffic. The segment of New Hampshire Avenue north of US 29 is outside the Plan area. The recommendation for operation in mixed traffic is due to constraints at the interchange at US 29 (Columbia Pike). The segment of New Hampshire Avenue within the Plan area presents a challenge for accommodating any type of bus priority treatment in the near term due to the constrained existing right-of-way south of Chalmers Road, the interchanges at I-495 and US 29, traffic volumes along the segment (45,000 to 55,000 AADT), and the adjacent mix of commercial and single family residences. Redevelopment of the Hillandale Shopping Center and National Labor College sites, however, present a long term option for obtaining additional right-of-way at this station area. Station platforms or areas at the following locations: Adelphi Road (south of the Plan area) Hillandale Shopping Center at Powder Mill Road Schindler Road/Mahan Road at FDA entrance Lockwood Drive (not necessarily at existing Transit Center) Randolph Road (north of the Plan area) Specific recommendations in the Concept Plan for the Randolph Road/Cherry Hill Road corridor include the following: Service between the Park and Ride Lot at Rockville Pike (MD 355) and Montrose Parkway and FDA Boulevard at Cherry Hill Road. Service provided via a single lane guideway in the median for what is essentially the entire corridor. From Rockville Pike to Nebel Street the concept plan running section width is 74.5 feet and includes one 10.5 foot wide transitway for peak direction travel, two 10 feet lanes in each direction, and one 12 foot curb lane in each direction. This short segment has an existing right-of-way of 95 to 105 feet. The Master Plan right-ofway along this segment is 100 feet. Countywide Transit Corridors Functional Master Plan This Plan is an update of the County Master Plan of Highways and is being conducted by the Planning Department. The focus of the work effort is on identifying the master plan 24
28 minimum right-of-way necessary to implement BRT in selected corridors. The Planning Board draft of the Countywide Transit Corridors Functional Master Plan is expected to be transmitted to the County Council by August This schedule is roughly concurrent with that of the White Oak Science Gateway Master Plan, which is currently scheduled to be transmitted to the County Council in September It is reasonable to assume that at some point in the process the specific recommendations related to the BRT corridors in the White Oak Science Gateway Plan will be reconciled with the recommendations that eventually are forwarded in the Countywide Transit Corridors Functional Master Plan. The timing, extent of analysis, and need to consider the countywide network as a whole all suggest that, in the end, it will be the Countywide Transit Corridors Functional Master Plan that ultimately addresses the right-of-way requirements for the introduction of BRT in this and other Plan areas within the County. In summary, it is anticipated that the Countywide Transit Corridors Functional Master Plan will inform the ultimate recommendation for BRT in the White Oak Science Gateway Plan. Technical Approach for Recommendations Pertaining to BRT for the White Oak Science Gateway Master Plan The first step of Staff s approach to address this issue was to advance the work of the prior BRT studies by identifying segments within each corridor where exclusive or dedicated lanes might be provided without resulting in significant impact to properties adjacent to the respective roadways. The second step was to then develop a reasonable estimate of the average speed of the BRT service operating in each corridor and compare that speed to the speed assumed in the Countywide BRT Study and the BRT speed used in the Department s regional travel forecasting model, Travel/3. At this stage in the development of the Countywide Transit Corridors Functional Master Plan there are three primary technical papers that can be used to begin to inform the preliminary recommendations pertaining to BRT for the White Oak Science Gateway Master Plan: Network and Methodology Report (December 2011) BRT Corridor Function Assessment (DRAFT) (March 29, 2012) BRT Typical Sections Update (Final Draft) (April 18, 2012) These technical reports, along with the prior studies noted above form the basis for arriving at the preliminary recommendations for BRT for the White Oak Science Gateway Plan for the three corridors under consideration - US 29, New Hampshire Avenue, and Randolph Road/Cherry Hill Road. More specifically, the prior work helps identify the individual corridor characteristics (all three being commuter corridors characterized by significantly more travel in the peak direction) and also helps in arriving at a default right-of-way section (in this case 120 feet) that establishes the minimum envelope required to provide one (new) exclusive or dedicated lane for travel in the peak direction with three existing travel lanes in each direction for general purpose travel. 25
29 The specific preliminary recommendations resulting from this approach for each corridor are presented in the following tables. A summary narrative follows each table. Table 5 US 29 BRT Corridor Roadway From To MP ROW Existing ROW Recommended Distance (Mi.) Avg. Speed Min. US 29 Burtonsville P&R US 29 US 29 Randolph Rd / Cherry Hill Rd Paint Branch Stream Valley Randolph Rd / Cherry Hill Rd Paint Branch Stream Valley Reversible Median Reversible Median Lockwood Drive Reversible Median Lockwood Drive US 29 US Mixed Traffic US 29 US 29 Lockwood Drive NW Branch Stream Valley NW Branch Stream Valley Mixed Traffic University Blvd Mixed Traffic US 29 University Blvd. Sligo Creek Parkway Mixed Traffic US 29 Sligo Creek Parkway Spring Street Dedicated Existing Lane US 29 Spring Street Fenton Street Dedicated Existing Lane US 29 Fenton Street Georgia Ave Dedicated Existing Lane US 29 Georgia Ave SSTC Dedicated Existing Lane Total Mixed Traffic 3.4 Reversible Median 5.5 Dedicated Existing Lane 1.1 The above configuration for the US 29 corridor has an estimated average speed of 17 mph compared to 19 mph in the Countywide BRT Study and 21 mph in the regional model. The difference in speeds is relatively minor and therefore the potential to attract riders should be similar to the potential reflected in the model forecast results. The concept corridor profile in the table above for US 29 would result in new pavement within the existing right-of-way in the segment from the Burtonsville Park and Ride Lot to Lockwood Drive. BRT buses would operate in dedicated (existing lanes) from Sligo Creek Parkway to the Silver Spring Transit Center likely during peak period (in the peak direction) only. No right-of-way beyond the existing right-of-way would be required except at station locations and intersections. This (and the following) concept profile(s) should be viewed as representative examples developed for the purpose of determining whether it would be possible to introduce BRT along the entire corridor that would achieve the desired average speed without resulting in significant impacts on adjoining parcels. Any actual implementation of the concept would be preceded by detailed engineering that would determine the overall feasibility of the profile being implemented in any one, combination, or all segments. 26

30 Table 6 New Hampshire Avenue BRT Corridor The above configuration for the New Hampshire Avenue corridor has an estimated average speed of 16 mph compared to 12 mph in the Countywide BRT Study and 19 mph in the regional model. The concept corridor profile in the New Hampshire Avenue table above would require additional right-of-way of up to an estimated 20 feet in some segments (outside of the Plan area) from the Takoma Langley Transit Center south to Eastern Avenue excluding any additional right-of-way that may be required at station locations and intersections. Table 7 Randolph Road BRT Corridor Roadway From To MP ROW Existing ROW Recommended Randolph Road MD 355 Rockville Pike Distance (Mi.) Avg. Speed Rock Creek Mixed Traffic Randolph Road Rock Creek Judson Road Reversible Median Randolph Road Judson Road Randolph Road 400 ' W of Glenallan Ave. 400' W of Glenallan Ave Reversible Median Fairland Road Reversible Median Randolph Road Fairland Road US Mixed Traffic Min. Total Mixed Traffic 4.6 Reversible Median
31 The above configuration for the Randolph Road corridor has an estimated average speed of 16 mph compared to 14 mph in the Countywide BRT Study and 24 mph in the regional model. The concept corridor profile in the Randolph Road table above would require additional right-of-way (beyond the existing right-of-way) of up to an estimated 10 to 25 feet between Rock Creek and Judson Road and between a point just west of Glenallan Avenue to Fairland Road (both segments are outside of the Plan area) excluding any additional right-of-way that may be required at station locations and intersections. Summary BRT Network Recommendations The preliminary recommendation for the BRT Network to serve the White Oak Science Gateway Master Plan area consists of the following corridors largely within Montgomery County: US 29 New Hampshire Avenue Randolph Road Two other corridors complete the concept network and are largely within Prince George s County and are consistent with current Prince George s County concept level planning for a network of high capacity transit corridors: North White Oak/Cherry Hill Road Center to Konterra/Muirkirk MARC Station via Powder Mill Road/Ammendale Road Hillandale Center to Greenbelt Metro via I-495 A map depicting the BRT network is presented in Figure 18. Other Transit Service It is envisioned that the BRT network would be complemented by additional local, circulator and express service provided by Metrobus, Ride-On, Prince George s County The Bus, and MTA Commuter Service. In addition, these conventional providers could be joined by potential contracted local, circulator and/or shuttle service for specific markets and centers of higher density to assist in achieving non-auto driver mode share targets. 28

32 Figure 18 Bus Rapid Transit Conceptual Alignments and Station Locations 29

33 Pedestrian Network Existing Conditions The current sidewalk inventory completed for the Master Plan area is presented in Figure 19. General observations related to the current network taken from the information provided in Figure 19 include the following: There is an established sidewalk network in and around the commercial areas. There are gaps to connecting the commercial core - along Columbia Pike in particular. The majority of the areas where single family residences are located do not have sidewalks. A more detailed examination or inventory of the existing sidewalk network in the WOSG Master Plan Centers is provided below. Figure 19 Plan Area Sidewalk Inventory 30
34 Hillandale Community Lack of sidewalk along north side of Powder Mill Road from Green Forest Drive to the County Border. Lack of buffer between the road and sidewalk on south side of Powder Mill Road from New Hampshire Avenue to County border. No buffer along both sides of New Hampshire between Powder Mill Road and Cresthaven Drive/Fire & Rescue Station 12. No buffer along west side of New Hampshire Avenue between Cresthaven Drive and Ruppert Road. Limited buffer along both sides of New Hampshire Avenue between Lockwood Drive and US 29. White Oak/FDA Center Lack of buffer along sidewalk from Burnt Mills Road to Prelude Road (US 29). Lack of buffer along Old Columbia Pike between Stewart Lane and New Hampshire Avenue. North White Oak/Cherry Hill Road Center Limited buffer along South side of Tech Road from Old Columbia Pike to Broadbirch Road. Burnt Mills Shopping Center Lack of buffer along sidewalk south of Burnt Mills Shopping Center (US 29). Lack of buffer along sidewalk at US 29 and Northwest Branch. Lack of buffer along sidewalk from Lockwood to Burnt Mills Road (US 29). Transit-Oriented Development and Density There is a considerable amount of existing and evolving research on station area densities, pedestrian accessibility and connectivity, transit mode share, and other issues related to transit-oriented development (TOD). The Planning Department has reviewed available current material on this issue. One good representation is from Reconnecting America and the Center for Transit Oriented Development (see Figure 20). The matrix depicts how TOD can vary in size, scale, and context. For White Oak, the transportation analysis assumed a range of densities. The results (described below) indicated that a balance of the land use and transportation could be achieved at a point where the net density for the commercial sites within the mixed use activity centers would be in the FAR 1 to 2 range. 31

35 Figure 20 Characteristics of Mixed-Use Transit-Oriented Development Source: Station Area Planning, Reconnecting America and the Center for Transit-Oriented Development, February 2008, page 13. It is important to support the higher densities with improvements to pedestrian connectivity and access as well as enhancements to the street grid where possible. Another way of analyzing density around transit stations is to examine the station context and how it relates to other stations both existing and planned - around the three fixed transitways (the existing Metrorail Red Line, the planned Purple Line, and the Corridor Cities Transitway). Figures 21 and 22 present estimates of job and housing densities within ½ mile of the existing Metrorail and proposed CCT and Purple Line stations for years 2010 and The densities are gross densities i.e., this information represents an estimate that considers the total area (including land devoted to streets, parks, etc.) in the traffic zones within the half-mile radius of the station location. 2 2 The densities are arrived at by creating a ½ mile GIS buffer around each station and dividing the jobs and households in the applicable Traffic Analysis Zone (s) by the area of the TAZ(s) that falls within the ½ mile buffer. The total jobs and households forecast for the applicable TAZ s are adjusted (reduced) by a percentage equal to the amount of the area of the TAZ that is outside of the ½ mile buffer. As a result, the chart is more accurately characterized as an estimate of the gross densities within ½ mile of the transit stations. One general rule of thumb is that minimum gross densities of around 7-10 households per acre and jobs per acre are needed to support frequent high quality transit service e.g. LRT or BRT. 32

36 Figure 21 Transit Station Area Employment Densities Figure 22 Transit Station Area Household Densities 33
37 The following observations can be made regarding the densities along the corridors: As would be expected, there is an increase in the station area densities from 2010 to This is especially the case at some of the stations north of the beltway. Densities at stations in 2040 continue to vary along each transitway. In general, the station densities in White Oak would be expected to be less on average than those on the Purple Line, CCT and Red Line due to the area being further from the CBD s in the County and the DC core area. Another way of examining station area density is to look at jobs and household density together to see the extent to which stations begin to fall into different groups or types. Figures 23 and 24 present a scatter plot representing the job and household density for each station. Figure 23 depicts all of the stations and Figure 24 includes those stations that are lower in density. As noted before, TOD comes in different sizes. All three transit lines are comprised of station settings that vary both in density and the mix of uses. A transit line can be viable without all of the stations meeting what are generally accepted guidelines for minimum density thresholds necessary to support transit. The key is to have enough stations that exceed the minimum thresholds to make up the difference in effect balancing the transit supportive density requirements with the station area context and community vision. The scatter plot is based upon traffic zones and is therefore a rough estimate of the density within a half mile of the respective stations. Nevertheless, it is clear that about half of the neighborhood stations fall below five households per gross acre and all of the neighborhood stations are below the jobs per acre minimum threshold. The scatter plot charts also depict how the densities change (increase) based upon the land use scenarios tested in various master planning efforts now underway. In the case of the White Oak Science Gateway Master Plan, the most significant change in density is within the ½ mile radius around the Percontee/Site 2 station area (see Figure 24). 34
38 Figure 23 Transit Station Area Land Use Densities All Stations Figure 24 Transit Station Area Land Use Densities Low Density Stations 35
39 A summary of the land use/transportation scenarios evaluated during Plan development is presented in Table 8. Key differences among the scenarios include the following: The Base Future Year scenario represents the anticipated development profile in 2040 under the existing adopted master plans. The increase in development, relative to the Existing Conditions scenario, is largely commercial about 4.5 million additional square feet. The Alternative Master Plan scenario represents a significant change essentially doubling the amount of existing commercial space and residential units relative to the Base Future Year scenario. Table 8 Summary of Land Use/Transportation Scenarios Non-Auto Driver Mode Share Assumptions There is a considerable amount of recent research supporting the fact that well designed TOD generates fewer auto trips and higher rates of trip-making by transit, walking, and biking. This is especially the case in TOD settings with a mix of land uses, high quality transit within walking distance, well connected and pleasant pedestrian and bike facilities, a strong regional transit system, and a vibrant CBD core. 36
40 More recent research findings related to non-auto driver mode share (NADMS) in TOD settings is presented below. From the Transit Cooperative Research Program (TCRP Report 128) TOD transit mode share for commuter trips can vary from 5% to near 50%. Findings are similar for non-work trips. The wide range of percentages is because mode share is heavily influenced by relative travel times with automobiles and extensiveness of transit service which can vary by region. Transit share of journey to work trips in 16 selected TOD locations in the DC region averaged 30% in The walk / bike share accounted for an additional 14% - a total non-auto driver mode share for work trip by TOD residents of 44%. From the WMATA 2005 Development Related Ridership Survey: Transit mode share for all trips for high rise residents located inside the beltway, not within the DC CBD, and within ½ mile of a Metrorail station was 49%. The walk /bike share accounted for an additional 14% of all trips made on a typical weekday. Transit mode share for work trips by employees whose work location was inside the beltway, not within the DC CBD, and within ½ mile of a Metrorail station was 30%. The walk/bike share accounted for an additional 6% of the total work trips made. In addition to the research findings noted above, the 2005 Montgomery County Census Update includes the following information related to County residents: Nearly twenty two percent of the residents of the Fairland Planning Area commute to work in some manner other than as a driver of a single-occupant auto. The comparable percentages are 32% and 25% for residents of the Kemp Mill/Four Corners and Colesville/White Oak Planning Area, respectively. The comparable percentage for residents of the Silver Spring and Takoma Park Planning Areas are higher both at 43%. For employees within Transportation Management Districts (TMD) within the County, the most recent surveys indicate the following: The non-auto driver mode share for employees in the Bethesda Chevy Chase TMD is 36%. This is higher than White Flint (26%) and Wheaton (a relatively small survey sample indicating 30%) but less than Silver Spring (48%). The Plan s NADMS goal is based on a gradient of NADMS, as shown below, which is highest in the urban, down-county planning areas and lower farther from the region s urban core. 37

41 Transportation Policy Area Review (TPAR) Since the early 1980s, every master plan has considered the balance between land use and transportation using an assessment of area-wide conditions forecast for the plan s endstate conditions. TPAR is the current measure of area-wide transportation adequacy, introduced into the County Subdivision Staging Policy in It is similar in nature to the Policy Area Transportation Review measure that was an element of the Growth Policy from 2007 to TPAR is used to implement the Adequate Public Facilities Ordinance (APFO) to forecast conditions by considering the County s ten year forecast of development and transportation system improvements for which funding is anticipated during the next ten years. TPAR continues the County s long-standing policy that higher levels of roadway congestion are appropriate in areas with higher quality transit service. This provides multi-modal equity across the County and promotes the development of pedestrian-oriented, rather than auto-oriented, improvements in Metro Station Policy Areas. This Plan s Alternative Master Plan Scenario assumed a significantly higher level of development based on the land use contemplated in the Plan vision for the three major centers at White Oak/FDA, Hillandale, and North White Oak/Cherry Hill. It included all of the grade-separated interchanges and road improvements assumed in the 2040 scenario with the addition of rebuilding the Old Columbia Pike bridge over Paint Branch that parallels US 29. This scenario also assumed a BRT network. This Plan is within the Fairland/White Oak Policy Area, which covers most of the eastern County, and the traffic modeling analysis also included an estimation of roadway adequacy for the policy area using the Transportation Policy Area Review (TPAR) methodology. Land use and transportation infrastructure is forecasted to be out of balance in the Fairland/White Oak Policy Area at build-out of the alternative Master Plan scenario as measured by the Subdivision Staging Policy s TPAR roadway adequacy test. The TPAR test evaluates the forecasted speed of travel of each arterial road within the policy area in its peak direction of travel (as derived from the regional transportation demand model) against uncongested, free flow speed, and weight-averages the results of all arterials in a 38
42 policy area by vehicle miles of travel (VMT). The ratio of forecasted speed to uncongested speed is consistent with the type of analysis recommended by the Transportation Research Board s Highway Capacity Manual (HCM). The Subdivision Staging Policy s roadway adequacy standard for the Fairland/White Oak Policy Area is a minimum 45 percent ratio of forecast speed to uncongested speed (midpoint of Level of Service D ). A ratio that is lower than this standard is considered to be inadequate. For the Fairland/White Oak Policy Area, a TPAR analysis was performed assuming that the level of development in the Plan area reaches the build-out amounts in the Alternative Master Plan scenario (see Figure 25). This analysis assumed the implementation of a BRT network to serve the Plan area and the achievement of a 30 percent non-auto driver mode share (NADMS) for workers in the Plan area. The analysis also assumed that the unbuilt, master-planned interchanges are constructed along US 29 and the bridge over Old Columbia Pike is rebuilt and opened to traffic. These recommendations are supportive of approaching area-wide land use-transportation balance in the Fairland/White Oak Policy Area. However, the resulting policy area ratio of 38 percent of forecast speed relative to uncongested speed is well below the minimum 45 percent policy area adequacy standard. When analyzing whether a policy area is in balance for master planned land use and transportation, County policy explicitly excludes traffic associated with interstate highways (I-495, I-270, and I-370) from the area-wide transportation test in recognition of the high proportion of through and regional trips on these roads. US 29 functions, in part, as a limited access facility between the County line and New Hampshire Avenue. The corridor is also only one of three (I-495 and I-270 being the others) in the County that has seen an overall increase in Average Annual Daily Traffic (AADT) during the past seven years. This suggests that the corridor functions in a manner similar to I-495 and I-270 in that it has a higher percentage of through trips with longer than average trip length for the segment within the Fairland/White Oak area. The TPAR analysis performed in support of this Plan evaluated results assuming all traffic associated with US 29 between New Hampshire Avenue and MD 198 is excluded. This test was based on the assumption that when the remainder of the planned grade-separated interchanges along US 29 are built, the road will function as a limited access freeway (rather than as a major highway) through much of the Fairland/White Oak policy area. Another rationale for excluding this segment of US 29 from the analysis is in recognition that a significant amount of US 29 traffic is regional through travel, similar to the character of traffic on I-270 or I-495. As a result of this test, the TPAR analysis estimates the ratio of forecast speed to uncongested speed in the Fairland/White Oak policy area to be 42 percent, which is a significant improvement relative to the 38 percent ratio that included all US 29 traffic (see Figures 25 and 26, respectively). However, the resultant 42 percent policy area ratio of forecast speed to uncongested speed is still below the minimum 45 percent policy area roadway adequacy standard. It should be noted that if US 29 were to be considered a limited access highway in the context of TPAR and traffic on US 29 is excluded accordingly, the Local Area Transportation 39

43 Review element of the County s Adequate Public Facilities Ordinance (APFO) would still apply to future development proposals in the Fairland/White Oak Policy Area. At least three key factors contribute to the forecasted area-wide level-of-service conditions in the Fairland/White Oak Policy Area described above: Regional traffic, primarily from nearby Howard and adjacent Prince George s Counties, over which the County has little control, contributes significantly to traffic congestion in the area. Options to significantly expand local or regional roadway capacity are limited, due largely to existing development and environmental constraints. Travel within the Plan area represents a sub-set of the amount of travel in the Fairland/White Oak Policy Area. In general, Plan recommendations designed to be supportive of achieving adequate travel conditions in the Plan area (e.g., the achievement of aggressive non-auto driver mode share goals and the realization of transit-oriented development densities) are not applicable to the greater Fairland/White Oak Policy Area. Figure 25 Countywide TPAR Analysis Results 40

44 The TPAR Roadway Adequacy Analysis retains and accepts the classification of each Policy Area by its level of transit service: Urban (with Metrorail), Suburban and Rural. TPAR specifies the following acceptable levels of average roadway congestion levels in the peak traffic directions within each Policy Area, where the Adequacy Standard differs for Urban, Suburban, and Rural Policy Areas, as shown in the following table. Table 9 Standards of Acceptable Roadway Average Level of Service (LOS) The following notes should be used in support of interpreting the results provided in Figures 25 and 26. The vertical aqua blue/green-hatched bars show the range of the average of roadway speeds by direction of travel in relation to the free flow speed, or level of service (LOS), for each Policy Area in the PM peak period. The bottom of the bar shows the average speed LOS in the peak direction of travel. The top of the bar shows the average speed LOS in the non-peak direction. The measurement scale weighted average LOS, A through F, is shown on the left side of the chart. Each policy area is shown by an abbreviation of its name as described below: Damascus - DAM Clarksburg - CLK Potomac - POT Olney - OLY North Potomac - NP Cloverly - CLV Germantown East - GTE Aspen Hill - AH Montgomery Village/Airpark - MVA Germantown West - GTW Fairland/White Oak - FWO Gaithersburg - GBG R& D Village - RDV Derwood/Shady Grove - DER Rockville - RKV Bethesda/Chevy Chase - BCC Kensington/Wheaton - KW North Bethesda - NB Silver Spring/Takoma Park - SSTP 41

45 Horizontal dotted orange lines are shown to depict the roadway adequacy standards (LOS) for the Rural, Suburban and Urban with Metrorail Policy Areas, from left to right, which graphically corresponds to the Standards of Adequacy depicted in the table above. Figure 26 Countywide TPAR Analysis Results Excluding US 29 Traffic Local Area Transportation Review (LATR) As previously noted, the intersection analysis conducted in support of this Plan applies the Critical Lane Volume (CLV) methodology from the Department s Local Area Transportation Review (LATR) Guidelines. The CLV values are converted to a volume-to-capacity measurement, or V/C ratio, by dividing the current or forecasted CLV values by the applicable policy area congestion standard. As depicted in Figure 27 and shown in Table 10, the County s Subdivision Staging Policy establishes acceptable levels of congestion for different policy areas based on the degree to which alternative modes of transportation are available. In rural policy areas, where few alternatives to auto transport exist, the congestion standard is 1,350 CLV (which equates to the middle range of LOS D). In Metro Station Policy Areas, where multiple alternatives to auto transport are provided, the congestion standard is 1,800. Currently, intersections in the White Oak Science Gateway Plan area, which is located within the Fairland/White Oak 42

46 Policy Area, have a congestion standard of 1,475 CLV. Other Policy Areas with the same CLV standard are Aspen Hill and Derwood. Figure 27 Intersection Congestion Standards by Policy Area 43


47 Table 10 Intersection Congestion Standards by Policy Area Table 11 summarizes the results of the Local Area Model (LAM) analysis for the major intersections both within the Plan area and within the larger Master Plan study area for the Alternative Master Plan scenario. These results are also depicted graphically in Figure 28. When viewing this figure, level of service for the intersections evaluated is reflected by color-coded dots. The left half of the dot represents morning peak hour conditions. The right half of the dot represents evening peak hour conditions. The numbers displayed in the table are the volume/capacity ratios (or V/C) and are derived by dividing the CLV by 1600 (not 1475, the current Fairland/White Oak Policy Area CLV standard). The use of the higher CLV is consistent with the County s policy of accepting greater levels of roadway congestion in areas where high quality transit options (such as Bus Rapid Transit) are available. The Plan vision is for the mix and intensity of development in the area to change significantly and the 1600 CLV is more representative of areas in the County that are characterized by multiple activity centers with a mix of land uses and more options to use transit. Policy Areas in the County with a current CLV standard of 1600 include Bethesda/Chevy Chase, Kensington/Wheaton (which includes Four Corners), Silver Spring/Takoma Park, and Germantown Town Center. 44

 elements of these infrastructure improvements.")
48 The V/C ratios reported in Table 11 also assume a number of infrastructure improvements (as noted in the table) that are not programmed or funded. The planned, but unprogrammed, grade-separated interchanges along US 29 and the BRT network are important (but not the only) elements of these infrastructure improvements. Table 11 Intersection Analysis Alternative Master Plan Scenario with Planned US 29 interchanges and Full Complement of Additional Un-programmed Improvements 45

49 Figure 28 Intersection Analysis Alternative Master Plan Scenario with Planned US 29 Interchanges and Full Complement of Additional Un-programmed Improvements Table 12 and Figure 29 provide a comparable set of LAM results for the Alternative Master Plan Scenario, with planned US 29 interchanges, reopening the Old Columbia Pike bridge over the Paint Branch, extending Industrial Parkway to FDA Boulevard, and with BRT on US 29, New Hampshire Avenue, and Randolph Road. 46

50 Table 12 Intersection Analysis Alternative Master Plan Scenario with US 29 Interchanges and Selected Un-programmed Improvements 47
, including planned US 29 grade-separated interchanges, reopening the Old Columbia")
51 Figure 29 Intersection Analysis Alternative Master Plan Scenario with US 29 interchanges and Selected Un-programmed Improvements Key findings of the analysis of intersection performance assuming the Alternative Master Plan Development Scenario with the full complement of un-programmed improvements (see Table 11), including planned US 29 grade-separated interchanges, reopening the Old Columbia Pike bridge over the Paint Branch, extending Industrial Parkway to FDA Boulevard, selected geometric intersection improvements, and BRT on US 29, New Hampshire Avenue, and Randolph Road. Within the Plan area, the intersection of New Hampshire Avenue and Powder Mill Road is projected to operate above the recommended standard of 1600 CLV. Outside of the Plan area, but within the Montgomery County portion of the Master Plan study area, the following intersections are forecasted to operate above 1600 CLV: Old Columbia Pike and Musgrove Road US 29 and University Boulevard 48
52 Outside of the Plan area and within the Prince George s County portion of the study area the following intersections are forecasted to operate above 1600 CLV: Powder Mill Road and Cherry Hill Road Fairland Road and Briggs Chaney Road Powder Mill Road and Beltsville Road Powder Mill Road and Riggs Road Key findings of the analysis of intersection performance assuming the Alternative Master Plan Development Scenario with a selected subset of un-programmed improvements (see Table 12) including planned US 29 grade-separated interchanges, BRT on US 29, New Hampshire Avenue, and Randolph Road, reopening the Old Columbia Pike bridge over the Paint Branch, and an extension of Industrial Parkway to FDA Boulevard shows the following: Within the Plan area, the following intersections are projected to operate above the recommended standard of 1600 CLV: New Hampshire Avenue and Powder Mill Road New Hampshire Avenue and Mahan Road/Schindler Lane New Hampshire Avenue and Lockwood Drive Cherry Hill Road and Broadbirch Drive/Calverton Boulevard Cherry Hill Road and Plum Orchard Drive/Cloverpatch Drive Cherry Hill Road and FDA Boulevard Outside of the Plan area, but within the Montgomery County portion of the Master Plan study area, the following intersections are forecasted to operate above 1600 CLV: Old Columbia Pike and Musgrove Road US 29 and University Boulevard Outside of the Plan area and within the Prince George s County portion of the study area the following intersections are forecasted to operate above 1600 CLV: Powder Mill Road and Cherry Hill Road Fairland Road and Briggs Chaney Road Powder Mill Road and Beltsville Road Powder Mill Road and Riggs Road Another important finding of the analysis is that there are intersections outside of the Plan area that can reasonably be expected to exceed a CLV of 1600 regardless of whether the Plan vision is attained in the future. Figures 30 and 31 depict the CLVs for these key intersections over the range of the land use alternatives considered. 49


53 Figure 30 Powder Mill Road and Cherry Hill Road Figure 31 US 29 and University Boulevard 50
54 Cordon Line Analysis The cordon line analysis measures total traffic volumes entering or leaving an area. Vehicular Traffic Volumes Table 13 compares existing and forecast traffic volumes at the studied cordon line. In general, the cordon line serves as the boundary between the WOSG Master Plan area, where land uses are proposed to change as a result of this Plan, and elsewhere in the County, which is subject to other plans and/or is otherwise not forecast to change development densities as a result of this Plan. At the cordon line, the total traffic volume is forecasted to increase by about 8 percent, from 347,400 vehicles per day to 377,200 vehicles per day. The heaviest volumes are forecasted to occur on Columbia Pike (US 29), ranging between 64,400 to 67,000 vehicles per day. Table 13 Master Plan Cordon Line Traffic Volumes 51

55 It is important to note that a key characteristic of the travel patterns in and around the Plan area is the high percentage of through traffic. This is especially the case on US 29, Powder Mill Road and Cherry Hill Road. The transportation analysis suggests that the land use changes inherent in the plan vision will reduce the overall percentage of through trips entering and exiting the Plan area but the total number of trips will increase due to growth both outside and inside of the Plan area. The relationship among internal, internal/ external (or in/out ), and through trip making for various scenarios during the evening peak hour is shown in Figure 32. Figure 32 Changing Trip Profile with the Plan Vision Recommended Master Plan Roadway Network The Plan recommends the following roadway improvements to support the proposed level of development contemplated in the alternative Master Plan scenario (see Table 14 and Figure 33): Roadway improvements within the Plan boundaries: Old Columbia Pike bridge over the Paint Branch rebuilt and open to vehicular traffic Grade-separated interchange at US 29 and Stewart Lane Grade-separated interchange at US 29 and Industrial Parkway/Tech Road Roadway improvements outside the Plan boundaries: Grade-separated interchange at US 29 and Musgrove Road Grade-separated interchange at US 29 and Fairland Road Grade-separated interchange at US 29 and Greencastle Road Grade-separated interchange at US 29 and Blackburn Road 52

56 Internal Road Network: Extend Industrial Parkway through Site 2/Percontee to connect with FDA Boulevard and designate as a Business District Street. Reclassify roads in the North White Oak/Cherry Hill Road area from Industrial Roads to Business District Streets. Provide additional vehicular connections in the North White Oak/Cherry Hill Road area if redevelopment occurs. Table 14 Existing and Proposed Street and Highway Classifications 53
57 54

58 Figure 33 Street and Highway Classification Map 55
59 In addition to the roadway network recommendations described above, as well as the BRT network and bikeway facilities discussed previously, selected intersection improvements will likely be required to bring several intersections within the 1600 CLV standard that is recommended for the Plan area. The possible improvements involve additional turn lanes and in the case of New Hampshire Avenue and Powder Mill Road, could involve a reconfiguration of the intersection at the time of the redevelopment of either the National Labor College site and/or the Hillandale Shopping Center. The intersections in question include the following: New Hampshire Avenue and Powder Mill Road New Hampshire Avenue and Mahan Road/Schindler Lane New Hampshire Avenue and Lockwood Drive Cherry Hill Road and Broadbirch Drive/Calverton Boulevard Cherry Hill Road and Plum Orchard Drive/Cloverpatch Drive Cherry Hill Road and FDA Boulevard Travel Demand Forecasting Process and Assumptions The travel demand forecasting process uses three levels of analysis. The Department s regional travel demand forecasting model, TRAVEL/3, is used to develop forecast travel demand results for weekday travel and evening peak periods. TRAVEL/3 is a four-step model, consisting of: Trip generation: the number of person trips that are generated by given types and densities of land uses within each TAZ. Trip distribution: how many person trips generated by each TAZ will travel to each of the other TAZs within the metropolitan area. Mode split: which mode of travel the person trips will use, including single-occupant auto, multiple-occupant auto, transit, or a non-motorized mode such as walking or bicycling. Traffic assignment: the roadways that will be used for vehicular travel between TAZs. The TRAVEL/3 model incorporates land use and transportation assumptions for the metropolitan Washington region, using the same algorithms as applied by the Metropolitan Washington Council of Governments (MWCOG) for air quality conformity analysis. Figure 34 shows the relationship of Montgomery County in the regional travel demand network, featuring the coding of street network characteristics to reflect the general level of adjacent development density. 56

60 Figure 34 Travel Forecasting Network TRAVEL/3 provides system-level results that are used directly to obtain TPAR forecasts for the County s Policy Area Transportation Review. The system-level results are also used as inputs to the finer grain analytic tools described below. The second level of analysis consists of post processing techniques applied to the TRAVEL/3 forecasts, as described in NCHRP Report 255. These techniques include refining the morning and evening peak hour forecasts to reflect a finer grain of land use and network assumptions than included in the regional model, such as the location of local streets and localized travel demand management assumptions. The NCHRP 255 analyses are used to produce the cordon line analyses. The third level of analysis includes intersection congestion, using the Critical Lane Volume (CLV) methodology described in the Department s Transportation Policy Area Review / Local Area Transportation Review Guidelines (TPAR/LATR). Travel/3 Forecasting Assumptions The White Oak Science Gateway Plan forecasts assumed the following parameters: A 2040 horizon year. This is currently the most distant horizon year for which forecast land use and transportation system development is available. Regional growth per the MWCOG Cooperative Forecasting Process, using the most current round of Cooperative Forecasts. 57
Ownership Lots 17 & 18 (Part of Lot 14), Montgomery Auto Sales Park
, Montgomery Auto Sales Park") Traffic Impact Analysis Ownership Lots 17 & 18 (Part of Lot 14), Montgomery Auto Sales Park Silver Spring, MD Lot 17: Site Plan No. 821413 Lot 18: Site Plan No. 821414 Filing Number: 13-TS-1198527A Prepared
Traffic Impact Analysis Ownership Lots 17 & 18 (Part of Lot 14), Montgomery Auto Sales Park Silver Spring, MD Lot 17: Site Plan No. 821413 Lot 18: Site Plan No. 821414 Filing Number: 13-TS-1198527A Prepared
Countywide Transit Corridors Functional Master Plan
 Countywide Transit Corridors Functional Master Plan Makeover Montgomery II May 10, 2014 Master Plan Status Begun: August 2011 Planning Board Approved Draft Plan: July 2013 Council Approved Final Plan:
Presentation of Staff Draft March 18, 2013 COUNTYWIDE TRANSIT CORRIDORS FUNCTIONAL MASTER PLAN
 Presentation of Staff Draft March 18, 2013 COUNTYWIDE TRANSIT CORRIDORS FUNCTIONAL MASTER PLAN Public Outreach Fall 2011: Two community meetings/open houses Fall 2012: Three community meetings/open houses
December For more information, call the Area 2 Division at (301)
") December 2013 Appendix B: Transportation Analysis For more information, call the Area 2 Division at (301) 495-4500 GLENMONT SECTOR PLAN TRANSPORTATION APPENDIX November 8, 2013 1 Contents Purpose Transportation
December 2013 Appendix B: Transportation Analysis For more information, call the Area 2 Division at (301) 495-4500 GLENMONT SECTOR PLAN TRANSPORTATION APPENDIX November 8, 2013 1 Contents Purpose Transportation
MONTGOMERY COUNTY PLANNING DEPARTMENT THE MARYLAND-NATIONAL CAPITAL PARK AND PLANNING COMMISSION
 MONTGOMERY COUNTY PLANNING DEPARTMENT THE MARYLAND-NATIONAL CAPITAL PARK AND PLANNING COMMISSION SHA CTP Project No. MO891A21, US 29, Fairland Road to Musgrove Road Interchange Improvement, Design Review
US 29 Bus Rapid Transit Corridor Planning Study FINAL. Corridor Study Report From Silver Spring Transit Center. April 2017
 US 29 Bus Rapid Transit Corridor Planning Study Corridor Study Report From Silver Spring Transit Center to Burtonsville Park and Ride FINAL April 2017 APRIL 2017 Table of Contents page Executive Summary...
Preliminary Transportation Analysis
 Preliminary Transportation Analysis Goals of a Robust, Multimodal Transportation Network Safe Accessible/Connected Efficient Comfortable Context-Sensitive Motor Vehicle: Continue to analyze the data to
2014 Mobility Assessment Report Functional Planning & Policy Montgomery County Planning Department
 2014 Mobility Assessment Report Functional Planning & Policy Montgomery County Planning Department Travel Trends National & Local Travel Trends Multi-Modal Monitoring Pedestrian Bikes Bus Rail Future Efforts
MONTGOMERY COUNTY PLANNING DEPARTMENT THE MARYLAND-NATIONAL CAPITAL PARK AND PLANNING COMMISSION
 MONTGOMERY COUNTY PLANNING DEPARTMENT THE MARYLAND-NATIONAL CAPITAL PARK AND PLANNING COMMISSION MCPB Item No. 2 Date: 12-15-11 Network and Methodology Report - Countywide Transit Corridors Functional
Abstract. Source of Copies The Maryland-National Capital Park and Planning Commission 8787 Georgia Avenue Silver Spring, MD 20910
 1 Abstract This document contains an examination of and recommendations for transit, bicycle, and pedestrian infrastructure that will help create complete transportation options. With the approval and
City of Wayzata Comprehensive Plan 2030 Transportation Chapter: Appendix A
 A1. Functional Classification Table A-1 illustrates the Metropolitan Council s detailed criteria established for the functional classification of roadways within the Twin Cities Metropolitan Area. Table
Long Branch Sector Plan. Appendix 11 Transportation
 Long Branch Sector Plan Appendix 11 Transportation Plan Context and Initiatives The Long Branch Sector Plan presents a vision for the transition of the area to a neighborhood scale, transit-oriented, walkable
MONTGOMERY COUNTY PLANNING DEPARTMENT THE MARYLAND-NATIONAL CAPITAL PARK AND PLANNING COMMISSION
 MONTGOMERY COUNTY PLANNING DEPARTMENT THE MARYLAND-NATIONAL CAPITAL PARK AND PLANNING COMMISSION MCPB Item No. 3 Date: 01-19-12 Worksession: Countywide Transit Corridors Functional Master Plan Larry Cole,
Description of Planning Board Recommended Network
 I-270 Corridor Interchanges Frederick (MD 355) at Ridge (MD 1 27) New Interchange N/A N/A N/A X X n/a $ 66 2 I-270 at Clopper (MD 117) Upgrade Interchange, Include Park-and-Ride Lot N/A N/A N/A X X X n/a
RCCG Jesus House. Preliminary Plan # TRAFFIC STUDY. Prepared for: RCCG Jesus House Montgomery County, Maryland
 TRAFFIC STUDY Prepared for: Montgomery County, Maryland Prepared by: SSSTS Consulting (410) 718-8660(410) 718-8660 Table of Contents SECTION 1 - INTRODUCTION... 1 SECTION 2 - EXISTING CONDITIONS... 4 Public
APPENDIX 2 LAKESHORE ROAD TRANSPORTATION REVIEW STUDY EXECUTIVE SUMMARY
 APPENDIX 2 LAKESHORE ROAD TRANSPORTATION REVIEW STUDY EXECUTIVE SUMMARY Appendix 2 City of Mississauga Lakeshore Road FINAL REPORT Transportation Review Study December 2010 EXECUTIVE SUMMARY Study Purpose
Route 7 Corridor Study
 Route 7 Corridor Study Executive Summary Study Area The following report analyzes a segment of the Virginia State Route 7 corridor. The corridor study area, spanning over 5 miles in length, is a multi
Comments EXECUTIVE SUMMARY
 Comments 1. Under any Alternatives, MCDOT should provide better at-grade pedestrian crossing of Georgia Avenue and Forest Glen Road, including improved crosswalks with wider medians and adequate signal
MONTGOMERY COUNTY PLANNING DEPARTMENT THE MARYLAND-NATIONAL CAPITAL PARK AND PLANNING COMMISSION
 MONTGOMERY COUNTY PLANNING DEPARTMENT THE MARYLAND-NATIONAL CAPITAL PARK AND PLANNING COMMISSION MCPB Item No. 4 Date: 04-17-14 2014 Mobility Assessment Report José Dory, Senior Planner, Functional Planning
MOUNTAIN HOUSE SPECIFIC PLAN I 9.1 INTRODUCTION ASSUMPTIONS TRANSPORTATION FACILITIES TRANSPORTATION IMPROVEMENTS PHASING 9.
 CHAPTER NINE: TRANSPORTATION AND CIRCULATION 9.1 INTRODUCTION 9.1 9.2 ASSUMPTIONS 9.1 9.3 TRANSPORTATION FACILITIES 9.1 9.4 TRANSPORTATION IMPROVEMENTS PHASING 9.3 LIST OF FIGURES LIST OF TABLES Figure
State Road 54/56 Tampa Bay s Northern Loop. The Managed Lane Solution Linking I-75 to the Suncoast Parkway
 State Road 54/56 Tampa Bay s Northern Loop The Managed Lane Solution Linking I-75 to the Suncoast Parkway SUNCOAST PARKWAY Both I 75 and the Suncoast Parkway are planning, or in the process of constructing,
Proposed White Flint Separated Bike Lane Network September 2015
 Proposed White Flint Separated Bike Lane Network September 2015 Abstract This report includes a proposed separated bike lane network for the White Flint Sector Plan area. Separated bike lanes create a
TAKOMA METRO STATION
 TKOM METRO STTION Traffic nalysis Technical Memorandum Station Planning in Support of Joint evelopment Job No. 13-FQ165-LN-2 November 213 WSHINGTON METROPOLITN RE TRNSIT UTHORITY (WMT) Takoma Metro Station
Bikeway Elements. Study Area A: Needwood Road and Vicinity (Figures 3 and 4)
") B R I G G S C H A N E Y R O A D I N T E R C H A N G E The ROD includes a partial interchange at Briggs Chaney Road, which is not included in the Fairland Master Plan. This interchange includes ramps to
B R I G G S C H A N E Y R O A D I N T E R C H A N G E The ROD includes a partial interchange at Briggs Chaney Road, which is not included in the Fairland Master Plan. This interchange includes ramps to
Abstract. Source of Copies The Maryland-National Capital Park and Planning Commission 8787 Georgia Avenue Silver Spring, MD 20910
 1 Abstract This document contains an examination of and recommendations for transit, bicycle, and pedestrian infrastructure that will help create complete transportation options. With the approval and
4. ENVIRONMENTAL IMPACT ANALYSIS 9. TRANSPORTATION AND TRAFFIC
 4. ENVIRONMENTAL IMPACT ANALYSIS 9. TRANSPORTATION AND TRAFFIC 4.9.1 INTRODUCTION The following section addresses the Proposed Project s impact on transportation and traffic based on the Traffic Study
5858 N COLLEGE, LLC N College Avenue Traffic Impact Study
 5858 N COLLEGE, LLC nue Traffic Impact Study August 22, 2016 Contents Traffic Impact Study Page Preparer Qualifications... 1 Introduction... 2 Existing Roadway Conditions... 5 Existing Traffic Conditions...
Chapter 5 Future Transportation
 Chapter 5 Future Transportation The Future Land Use Plan identifies the desired land use designations. The land uses desired for Crozet depend, in large part, on the success of the transportation system,
Fitting Light Rail through Well-established Communities
 Fitting Light Rail through Well-established Communities San Francisco 2008 Michael D. Madden Chief, Project Development, Maryland Transit Administration Project Setting Located inside the Capital Beltway
CITY OF ALPHARETTA DOWNTOWN MASTER PLAN TRAFFIC EVALUATION
 CITY OF ALPHARETTA DOWNTOWN MASTER PLAN TRAFFIC EVALUATION June 2015 CITY OF ALPHARETTA DOWNTOWN MASTER PLAN TRAFFIC EVALUATION Introduction The Alpharetta Downtown Master Plan was developed in the fall
APPENDIX 14: CONNECTIONS: TRANSPORTATION ANALYSIS. Transportation Planning, Analysis
 APPENDIX 14: CONNECTIONS: TRANSPORTATION ANALYSIS Transportation Planning, 2008 Germantown has various options of transportation for citizens in the community. There are major highways, buses, MARC, bicycle
Sixth Line Development - Transit Facilities Plan
 Memorandum Date: November 13, 2012 To: From: c.c. Subject: Rob Freeman (Freeman Planning) Kevin Phillips Sixth Line Development - Transit Facilities Plan 33016631 This memo was prepared to review the transit
Arlington County 10-Year Transit Development Plan & Premium Transit Network Briefing. May 2016
 Arlington County 10-Year Transit Development Plan & Premium Transit Network Briefing May 2016 Overview 10-Year Transit Development Plan Premium Transit Network Columbia Pike service concept Premium amenities
Chapter 3 BUS IMPROVEMENT CONCEPTS
 Chapter 3 BUS IMPROVEMENT CONCEPTS The purpose of this chapter is to describe potential bus improvement strategies and potential impacts or implications associated with BRT implementation within the existing
MONTGOMERY COUNTY PLANNING DEPARTMENT
 MONTGOMERY COUNTY PLANNING DEPARTMENT THE MARYLAND-NATIONAL CAPITAL PARK AND PLANNING COMMISSION Veirs Mill Corridor Master Plan: Work Session #5 MCPB Item No. Date: 10/04/18 Jessica McVary, Planner Coordinator,
Title. Metropolitan Council Transportation Committee December 12, Brad Larson Metro District MnDOT
 Title Metropolitan Council Transportation Committee December 12, 2016 Evaluating the potential for Bus Rapid Transit and MnPASS Express Lanes in the southwest Metro Brad Larson Metro District MnDOT Background
Multimodal Approach to Planning & Implementation of Transit Signal Priority within Montgomery County Maryland
 Multimodal Approach to Planning & Implementation of Transit Signal Priority within Montgomery County Maryland A Path to Successful Implementation James Allday Bunch - Sabra, Wang & Associates, Inc. ITS
PERFORMANCE ANALYSIS of The Draft 2015 CLRP
 Item 9 PERFORMANCE ANALYSIS of The Draft CLRP Presentation to the Transportation Planning Board September 16, CLRP Performance Analysis 1 What is the Long-Range Transportation Plan (CLRP)? The CLRP identifies
Scottsdale Road/Rural Road Alternatives Analysis (AA) Study. Arizona ITE/IMSA Spring Conference March 7, 2012
 Study. Arizona ITE/IMSA Spring Conference March 7, 2012") Scottsdale Road/Rural Road Alternatives Analysis (AA) Study Arizona ITE/IMSA Spring Conference March 7, 2012 Study Location and Duration Primary Study Corridor (major focus of effort) Rural Road and Scottsdale
Scottsdale Road/Rural Road Alternatives Analysis (AA) Study Arizona ITE/IMSA Spring Conference March 7, 2012 Study Location and Duration Primary Study Corridor (major focus of effort) Rural Road and Scottsdale
3.0 Future Conditions
 3.0 Future Conditions In order to be able to recommend appropriate improvements to the transportation system of the Town, it is important to first understand the nature and volume of traffic that is expected
Arterial Transitway Corridors Study. Ave
 Arterial Transitway Corridors Study Ave January 2012 Arterial Transitway Corridors Study Overview Corridor Features and Demographics 11 study corridors, 95 route miles 86,000 daily rides and half of existing
TRANSPORTATION AND CIRCULATION
 TRANSPORTATION AND CIRCULATION The plan reinforces the City of College Park s vision for US 1 becoming a revitalized gateway boulevard. Emphasis has been placed on the pedestrian quality of a new streetscape
Downtown BRT Corridor Alternatives Review: 1 st, 2 nd, 3 rd and 4 th Avenue. Bus Rapid and Conventional Transit Planning and Design Services
 Downtown BRT Corridor Alternatives Review: 1 st, 2 nd, 3 rd and 4 th Avenue Bus Rapid and Conventional Transit Planning and Design Services City of Saskatoon February 2018 Project Team HDR Corporation
Chapter 6 Transportation Plan
 Chapter 6 Transportation Plan Transportation Plan Introduction Chapter 6 Transportation Plan Transportation Plan Introduction This chapter describes the components of Arvada s transportation system, comprised
TRANSPORTATION PLAN INTRODUCTION TRAVEL FORECASTING
 TRANSPORTATION PLAN INTRODUCTION Most of the Upper Rock Creek Planning Area is within one of the County s rural policy areas; only the Derwood section of the Planning Area is outside this rural classification.
MONTGOMERY COUNTY COUNCIL
 MONTGOMERY COUNTY COUNCIL R O C K V I L L E, M A R Y L A N D October 20, 2015 The Honorable Isiah Leggett Montgomery County Executive 101 Monroe Street, 2nd Floor Rockville, MD 20850 Dear County Executive
Southwest Bus Rapid Transit (SW BRT) Functional Planning Study - Executive Summary January 19 LPT ATTACHMENT 2.
 Functional Planning Study - Executive Summary January 19 LPT ATTACHMENT 2.") Southwest Bus Rapid Transit (SW BRT) Functional Planning Study - Executive Summary 2011 January 19 1 of 19 Introduction This executive summary presents the results of the Southwest Bus Rapid Transit (SW
Southwest Bus Rapid Transit (SW BRT) Functional Planning Study - Executive Summary 2011 January 19 1 of 19 Introduction This executive summary presents the results of the Southwest Bus Rapid Transit (SW
FY2006 Budget Board Budget Committee request for information. Board Request: Detailed information on bus route 5A DC-Dulless Airport
 Board Request: Detailed information on bus route 5A DC-Dulless Airport Tracking Number: 29 Assigned to Dept/Office: OPER Contact Person: Jim Hughes Metrobus Route 5A was established in December 2000 in
Agenda. Overview PRINCE GEORGE S PLAZA METRO AREA PEDESTRIAN PLAN
 PRINCE GEORGE S PLAZA METRO AREA PEDESTRIAN PLAN May 28, 2008 Agenda Welcome and introductions Project overview and issue identification Planning context and strengths Design challenges and initial recommendations
TRANSPORTATION ANALYSIS REPORT US Route 6 Huron, Erie County, Ohio
 TRANSPORTATION ANALYSIS REPORT US Route 6 Huron, Erie County, Ohio December 12, 2012 Prepared for: The City of Huron 417 Main Huron, OH 44839 Providing Practical Experience Technical Excellence and Client
SANTA CLARA COUNTYWIDE BICYCLE PLAN August 2008
 SANTA CLARA COUNTYWIDE BICYCLE PLAN August 2008 To assist VTA and Member Agencies in the planning, development and programming of bicycle improvements in Santa Clara County. Vision Statement To establish,
SECTION 1 - TRAFFIC PLANNING
 SECTION 1 - TRAFFIC PLANNING 1.1 TRAFFIC OPERATIONS 1.1.1 Roadway Functional Classification The Multnomah County Comprehensive Framework Plan s Policy 34: Trafficways and the Functional Classification
In station areas, new pedestrian links can increase network connectivity and provide direct access to stations.
 The Last Mile Planning for Pedestrians Planning around stations will put pedestrians first. Making walking to stations safe and easy is important; walking will be a part of every rapid transit Accessible
SETTINGS AND OPPORTUNITIES MOBILITY & ACCESS
 7 mobility & access how do people use el camino what is it like to drive on el camino/to park along el camino what is the pedestrian experience like what is the role of transit along the corridor what
MONTGOMERY COUNTY PLANNING DEPARTMENT THE MARYLAND-NATIONAL CAPITAL PARK AND PLANNING COMMISSION
 MONTGOMERY COUNTY PLANNING DEPARTMENT THE MARYLAND-NATIONAL CAPITAL PARK AND PLANNING COMMISSION MCPB Item No. 5 Date: 12/3/15 Draft White Flint Separated Bike Lanes Network David Anspacher, Functional
INNER LOOP EAST. AIA Rochester Annual Meeting November 13, 2013 TRANSFORMATION PROJECT. Bret Garwood, NBD Erik Frisch, DES
 INNER LOOP EAST TRANSFORMATION PROJECT AIA Rochester Annual Meeting November 13, 2013 Bret Garwood, NBD Erik Frisch, DES Why? We are building a city that encourages walking, biking and enjoying the outdoor
City of Hyattsville. Citywide Traffic Study and Transportation Plan. Sabra, Wang & Associates. February, 2010
 City of Hyattsville Citywide Traffic Study and Transportation Plan February, 2010 Outline Existing Conditions Recommendations Future Conditions Traffic Growth Development Capacity and Level of Service
M-58 HIGHWAY ACCESS MANAGEMENT STUDY Mullen Road to Bel-Ray Boulevard. Prepared for CITY OF BELTON. May 2016
 M-58 HIGHWAY ACCESS MANAGEMENT STUDY Prepared for CITY OF BELTON By May 2016 Introduction Missouri State Highway 58 (M-58 Highway) is a major commercial corridor in the City of Belton. As development has
Bus Rapid Transit Plans
 Twin Cities Region Bus Rapid Transit Plans ULI Minnesota Workshop Connecting Bus Rapid Transit to the Community December 15, 2009 John Levin Director of Service Development Metro Transit Metropolitan Area
Providence Downtown Transit Connector STAKEHOLDER MEETING #2. Stakeholder Meeting #1 October 24, 2016
 Providence Downtown Transit Connector STAKEHOLDER MEETING #2 Stakeholder Meeting #1 October 24, 2016 February 2017 1 AGENDA 1 DTC Goals and Expectations 2 Street Design Concepts 3 Potential Benefits and
Baseline Road Rapid Transit: Bayshore Station to Prince of Wales Drive
 Baseline Road Rapid Transit: Bayshore Station to Prince of Wales Drive Planning and Environmental Assessment Study Consultation Group Meetings May 2014 Presentation Agenda Study Overview Study Progress
Victoria Transit Priority Corridor Plan
 Options Evaluation Report This report is prepared for the sole use of BC Transit. No representations of any kind are made by Urban Systems Ltd. or its employees to any party with whom Urban Systems Ltd.
Countywide Bus Rapid Transit Study Consultant s Report (Final) July 2011 DEPARTMENT OF TRANSPORTATION. Barrier system (from TOA)
 July 2011 DEPARTMENT OF TRANSPORTATION. Barrier system (from TOA)") Countywide Bus Rapid Transit Study Consultant s Report (Final) July 2011 DEPARTMENT OF TRANSPORTATION Barrier system (from TOA) COUNTYWIDE BUS RAPID TRANSIT STUDY Consultant s Report (Final) July 2011
Countywide Bus Rapid Transit Study Consultant s Report (Final) July 2011 DEPARTMENT OF TRANSPORTATION Barrier system (from TOA) COUNTYWIDE BUS RAPID TRANSIT STUDY Consultant s Report (Final) July 2011
SANTA MONICA BOULEVARD CORRIDOR
 CIRCULATION ELEMENT WHITE PAPER NO. 3 SANTA MONICA BOULEVARD CORRIDOR INTRODUCTION From the 1930s to the beginning of Los Angeles freeway era, Santa Monica Boulevard, (previously Route 66, the Beverly
Appendix B: Forecasting and Traffic Operations Analysis Framework Document
 Existing Conditions Report - Appendix Appendix B: Forecasting and Traffic Operations Analysis Framework Document This document defines the methodology and assumptions that will be used in the traffic forecasting
WHITE PAPER: TRANSIT SERVICE FOR SOUTH SHAGANAPPI
 9/27/2012 TRANSIT PLANNING WHITE PAPER: TRANSIT SERVICE FOR SOUTH SHAGANAPPI 2012 Calgary Transit 1 Table of Contents Purpose... 3 Area of Change... 3 Background... 3 Access to destinations... 5 Connecting
Station Plan: Penn & 43rd Avenue
 Station Plan: Penn & 43rd Avenue This station will serve the northern portion of the Penn Avenue corridor, including the commercial node at 44th Avenue. Ridership and roadway geometry support station siting
Prepared For: Shieldbay Developments Inc. c/o Matson, McConnell Ltd. 2430A Bloor Street West Toronto, Ontario M6S 1P9.
 Prepared For: Shieldbay Developments Inc. c/o Matson, McConnell Ltd. 2430A Bloor Street West Toronto, Ontario M6S 1P9 Prepared By: URS Canada Inc. 4 th Floor, 30 Leek Crescent Richmond Hill, Ontario L4B
Transportation Corridor Studies: Summary of Recommendations
 Transportation Corridor Studies: Summary of Recommendations Route 4 Corridor Study: Route 10 Corridor Study: Route 44 Corridor Study: Route 175 Corridor Study: Route 5/15 Corridor Study: Rentschler Field
Multimodal Through Corridors and Placemaking Corridors
 68 Multimodal Through Corridors and Placemaking Corridors Corridors have different functions in a region. Some corridors are used to get smoothly and rapidly through a region or to get quickly to major
Roadways. Roadways III.
 Introduction 97 Roadway Design Principles 98 Safe Speeds 99 Optimizing of Street Space 00 Minimum Lane Widths in the City of Boston 02 Design Features that Reduce Operating Speeds 05 Travel Lanes Transit
Chapter 4 Traffic Analysis
 Chapter 4 Traffic Analysis PURPOSE The traffic analysis component of the K-68 Corridor Management Plan incorporates information on the existing transportation network, such as traffic volumes and intersection
Interim Transit Ridership Forecast Results Technical Memorandum
 Interim Transit Ridership 401 South Jackson Street Seattle, WA 98104-2826 September 2012 Table of Contents 1 INTRODUCTION... 1-1 1.1 Project Background... 1-1 2 RIDERSHIP FORECASTS... 2-1 2.1 System Ridership
PRINCE GEORGE S PLAZA METRO AREA PEDESTRIAN PLAN
 PRINCE GEORGE S PLAZA METRO AREA PEDESTRIAN PLAN May 28, 2008 Agenda Welcome and introductions Project overview and issue identification Planning context and strengths Design challenges and initial recommendations
Purpose + Need. Connect: Thrive: Develop: < Strengthen the spine of our regional transportation system
 Purpose + Need I-29 NW Barry Road 64/68/72 MAIN STREET Connect: < Strengthen the spine of our regional transportation system Leavenworth Road Parallel Parkway State Avenue 18th Street Expressway Shawnee
METHODOLOGY. Signalized Intersection Average Control Delay (sec/veh)
") Chapter 5 Traffic Analysis 5.1 SUMMARY US /West 6 th Street assumes a unique role in the Lawrence Douglas County transportation system. This principal arterial street currently conveys commuter traffic
Chapter 5 Traffic Analysis 5.1 SUMMARY US /West 6 th Street assumes a unique role in the Lawrence Douglas County transportation system. This principal arterial street currently conveys commuter traffic
1. Operate along freeways, either in regular traffic lanes, in high-occupancy vehicle (HOV) lanes, or along the shoulders.
 lanes, or along the shoulders.") Most decisions about whether or not to use transit involve time and cost, and most transit services are slower than travel by private vehicle. However, when transit is faster or nearly as fast as travel
Most decisions about whether or not to use transit involve time and cost, and most transit services are slower than travel by private vehicle. However, when transit is faster or nearly as fast as travel
BEAR CREEK PARK AND RIDE
 BEAR CREEK PARK AND RIDE 7760 178th Pl NE, Redmond, WA 98052 700 Average weekday transit boardings 283 Parking spaces Owned by King County Metro Served by Sound Transit and King County Metro Bear Creek
TRANSPORTATION & MOBILITY
 TRANSPORTATION & MOBILITY ROADWAY SYSTEM There are approximately 40 miles of roadways in Manitou Springs. For planning purposes, roadways are typically assigned a functional classification which defines
CITY OF COCOA BEACH 2025 COMPREHENSIVE PLAN. Section VIII Mobility Element Goals, Objectives, and Policies
 CITY OF COCOA BEACH 2025 COMPREHENSIVE PLAN Section VIII Mobility Element Goals, Objectives, and Policies Adopted August 6, 2015 by Ordinance No. 1591 VIII MOBILITY ELEMENT Table of Contents Page Number
PURPOSE AND NEED SUMMARY 54% Corridor Need 1. Corridor Need 2. Corridor Need 3. Corridor Need 4. Corridor Need 5
 SUMMARY PURPOSE AND NEED Chapel Hill Transit ridership has increased Buses operate every 4 minutes and have standing room only Exceeding seated capacity by 12% Corridor Need 1 by more than 20 percent between
Purpose and Need. Chapter Introduction. 2.2 Project Purpose and Need Project Purpose Project Need
 Chapter 2 Purpose and Need 2.1 Introduction The El Camino Real Bus Rapid Transit (BRT) Project (Project) would make transit and other transportation improvements along a 17.6-mile segment of the El Camino
APPENDIX E BIKEWAY PRIORITIZATION METHODOLOGY
 APPENDIX E BIKEWAY PRIORITIZATION METHODOLOGY INTRODUCTION The network of bikeways recommended in the Bicycle Master Plan is extensive and is likely to be only partially completed during the 25-year life
5.0 Roadway System Plan
 Southwest Boise Transportation Study Page 16 5.0 Roadway System Plan The Roadway System Plan outlines roadway improvements in the Initial Study Area. It forecasts future deficiencies on the arterial system,
Transportation Master Plan Advisory Task Force
 Transportation Master Plan Advisory Task Force Network Alternatives & Phasing Strategy February 2016 BACKGROUND Table of Contents BACKGROUND Purpose & Introduction 2 Linking the TMP to Key Council Approved
Rapid Transit in Montgomery County
 Rapid Transit in Montgomery County Montgomery County Department of Transportation Al Roshdieh, Acting Director 1 Background Corridors in Detail Corridor Cities Transitway MD 355 (Bethesda to Rockville
Regional Transportation Needs Within Southeastern Wisconsin
 Regional Transportation Needs Within Southeastern Wisconsin #118274 May 24, 2006 1 Introduction The Southeastern Wisconsin Regional Planning Commission (SEWRPC) is the official areawide planning agency
APPENDIX G: INTERSECTION NEEDS AT OKEECHOBEE BOULEVARD
 APPENDIX G: INTERSECTION NEEDS AT OKEECHOBEE BOULEVARD INTERSECTION NEEDS AT SR 7 and OKEECHOBEE BOULEVARD SR 7 Extension Project Development and Environment (PD&E) Study From Okeechobee Boulevard (SR
6.0 PEDESTRIAN AND BICYCLE FACILITIES 6.1 INTRODUCTION 6.2 BICYCLE DEMAND AND SUITABILITY Bicycle Demand
 6.0 PEDESTRIAN AND BICYCLE FACILITIES 6.1 INTRODUCTION Bicycle and pedestrian travel along and in the vicinity of the corridor is part of the vision of Somerset and Hunterdon counties and the integrated
Appendix C. NORTH METRO STATION AREA TRAFFIC IMPACT STATEMENT 88th Avenue Station
 Appendix C NORTH METRO STATION AREA TRAFFIC IMPACT STATEMENT 88th Avenue Station Prepared for: Regional Transportation Department and URS Corporation as part of the North Metro EIS David Evans and Associates,
prior master plan right-of-way width (minimum) minimum right-of-way width and/or area required for Purple Line and trail
 minimum right-of-way width and/or area required for Purple Line and trail") Table 10 CSX/WMATA/Right-of-Way to 16 th Street Station from to current right-of-way width prior master plan right-of-way width (minimum) minimum right-of-way width and/or area required for Purple Line
Table 10 CSX/WMATA/Right-of-Way to 16 th Street Station from to current right-of-way width prior master plan right-of-way width (minimum) minimum right-of-way width and/or area required for Purple Line
. ' motion. APPLtlDK.L - L"iLC_t1GLR 201b APPENDIX 7 TECHNICAL MEMOS
 . ' motion APPLtlDK.L - L"iLC_t1GLR 201b APPENDIX 7 TECHNICAL MEMOS The nmotion program will provide a large number of benefits for Middle Tennessee. This document presents selected benefits and other
2.0 LANE WIDTHS GUIDELINE
 2.0 LANE WIDTHS GUIDELINE Road Engineering Design Guidelines Version 2.0.1 May 2018 City of Toronto, Transportation Services City of Toronto Page 0 Background In early 2014, Transportation Services initiated
the Story of the 30s & 70s Bus Lines James Hamre - WMATA
 Evaluation of a Service Restructuring: the Story of the 30s & 70s Bus Lines James Hamre - WMATA Metrorail is the second largest rail transit system in the nation 230 million annual riders 780,000 weekday
Bradford s Landing. Preliminary Plan Abandonment AB753 & AB754 MONTGOMERY COUNTY PLANNING DEPARTMENT
 Bradford s Landing Preliminary Plan 120170060 Abandonment AB753 & AB754 1 Overview Staff recommends Approval of Preliminary Plan 120170060 with revised conditions and Adoption of the Resolution. 244 lots
Recommended Roadway Plan Section 2 - Land Development and Roadway Access
 Recommended Roadway Plan Section 2 - Land Development and Roadway Access SECTION 2 Land Development and Roadway Access 2.1 Land Use and Access Management The Federal Highway Administration (FHWA) defines
Highway 217 Corridor Study. Phase I Overview Report
 Highway 217 Corridor Study Phase I Overview Report November 3, 24 BACKGROUND AND OVERVIEW Study purpose The Highway 217 Corridor Study is developing multi-modal transportation solutions for traffic problems
Chapter 5 FUNCTIONAL CLASSIFICATION
 Chapter 5 FUNCTIONAL CLASSIFICATION Functional classification is a system by which streets and roadways may be distinguished by types according to their function within the entire transportation network.
Executive Summary BEYOND THE B-LINE: RAPID TRANSIT LINE PHASE II - COMMERCIAL DRIVE WEST. Final Draft December 13, Appendix B BROADWAY/LOUGHEED
 BEYOND THE B-LINE: BROADWAY/LOUGHEED RAPID TRANSIT LINE PHASE II - COMMERCIAL DRIVE WEST Appendix B Executive Summary Final Draft December 13, 1999 UMA Lloyd Lindley Davidson Yuen Simpson Architects BROADWAY/LOUGHEED
FINAL DESIGN TRAFFIC TECHNICAL MEMORANDUM
 FINAL DESIGN TRAFFIC TECHNICAL MEMORANDUM July 2014 FINAL (SR 43) Project Development and Environment Study From State Road 60 (Adamo Drive) to I-4 (SR 400) Hillsborough County, Florida Work Program Item