Paleoclimate analysis for Northern New Mexico from tree rings
|
|
|
- Cathleen Cannon
- 6 years ago
- Views:
Transcription

1 Paleoclimate analysis for Northern New Mexico from tree rings Dendroclimatology Class Summer Tree Ring School, Laboratory of Tree Ring Research, University of Arizona, May, 18 June,
2 Outline 1. Objectives 2. Site description 3. Methods, results, discussions: Group 1: Reconstruction of climate conditions using PCI of individual site chronologies Group 2: Reconstruction of PDSI using individual site chronologies Group 3: Reconstruction of climate conditions using regional chronology 4. Conclusions
3 General Objectives Extend existing tree ring chronologies for Northern New Mexico (Jemez Mts) Reconstruct climate conditions Analyze reconstructed climate conditions for extreme events, fire, atmospheric circulation patterns etc


4 Research area: New Mexico, USA

5 Research area: New Mexico, USA
6

7 Regional Annual Temperature and Precipitation Data Mean Monthly Temperature ( C) Mean Annual T 7.85¼ C J F M A M J J A S O N D Monthly PPT (mm) Mean Ann PPT J F M A M J J A S O N D
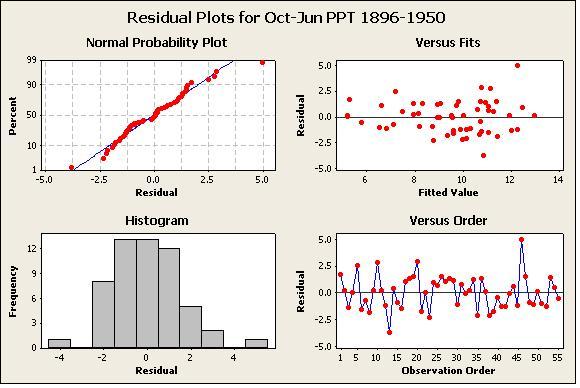
8 Group 1 Oct June PCA Precipitation Reconstruction for Northern New Mexico (NM2) Alana Belcon, Anna Coppola, Ellis Margolis, Liz Palchak
9 Standardization and Detrending PCG Data Variable PCG-15A PCG-15A_1 meanline Data Variable PCG-14A PCG-14A_1 meanline Data Variable PCG-13B PCG-13B_1 meanline Data Variable PCG-13A PCG-13A_1 meanline Data Variable PCG-11B PCG-11B_1 meanline Data Variable PCD-3A PCD-3A_1 meanline * 8 Chronologies * Removed incorrect value * Detrending: cubic smoothing spline 50% of the variance over 75%
10 Residual chronologies Residual New Mexico Crns Variable Data UL A75R meanline Variable Data ME A R meanline Variable Data EAU1 R meanline Variable Data BCM1 R meanline Variable Data AMPN_R meanline Variable Data PCG2 R meanline Variable Data FEN1 R meanline Variable Data BCW1 R meanline
11 Response Function Analysis October-June monthly PPT selected
12 Principal Component Analysis 6 Scree Plot of PC's derived from 8 chronologies 5 Eigenvalue Component Number PC1 accounts for the 75% of variance
13
14


15 Monthly Anomalies of 1941 from the Means
16

17 New Mexico Reconstruction Precipitation Values
18 Correlation 0.57 Reconstructed Precipitation and ENSO Index 10yr moving avg anomalies
19 Ten driest years (Oct - June precip, ) yr Instrumental (in.) rank yr Reconstructed (in.) rank Ten wettest years yr Instrumental rank yr Reconstructed rank


20 Composite 500mb geopotential height anomalies 10 driest yrs Tree ring reconstructed Oct Dec Jan Mar


21 Composite 500mb geopotential height anomalies 10 wettest yrs Tree ring reconstructed Oct Dec Apr Jun Jan Mar
22 Group 2 May July PDSI Reconstruction for Northern New Mexico (NM2) Gunnar Carnwath, Nancy Li, Stephanie McAfee & Lucy Mullin

23 What is PDSI? Dimensionless index of drought severity Function of temperature and precipitation in current and preceding months
24 Methods Chronology Development: ARSTAN Identify Climate Signal: RFA Develop Transfer Function: Multiple Linear Regression Reconstruct PDSI Model Assessment
25 Mean series length Mean sensitivity Chronology Statistics: Upper Los Alamos Mesa Alta Echo Amphitheater Rbar Variance due 11.8% 14.1% 13.6% to AR EPS > (3) 824 (3) 1367 (3)
26 Chronology Development: Standardize: 75% of series length spline EAU Residual Chronology EA U RWI Sample Depth 10 per. Mov. Avg. (EAU RWI) Ring Width Index Sample Depth (trees) Year MEA Residual Chronology MEA RWI Sample Depth 10 per. Mov. Avg. (MEA RWI) Ring Width Index Year Sample Depth (Trees)

27 Response Function Analysis (RFA)
28 RFA: Correlation Analysis
29 Develop Transfer Function: Calibration & Verification R 2 adj R 2 pred Correlation w/ Observed Correlation w/ Verification RE MEA, EAU, and ULA MJJ PDSI = EAU MEA ULA Transfer Function R 2 adj R 2 pred Correlation w/ Observed
30 Results: NM2 May July PDSI PR PDSI OB PDSI 11 yr sd Sample depth 11 per. Mov. Avg. (PR PDSI) 11 per. Mov. Avg. (OB PDSI) PDSI Year r = Sample Depth
31 Evaluating the Chronology PDSI Reconstruction Predicted PDSI R 2 = Observed PDSI OBSERVED PDSI PREDICTED PDSI Mean Standard Error Standard Deviation Kurtosis Skewness Minimum Maximum Confidence Level(95.0%)
32 Comparing the 10 driest years -2 Boxplot of Reconstructed, Instrumental -3 Data -4 PDSI -5-6 Reconstructed Instrumental


33 Differences in 10 driest years: May to July surface temperature Only in instrumental record Present in both Only in reconstruction 2003,1981, 1951, , 2000,1956, 1964, ,1950, 1971, 1989,1976

34 Group 3 Objective: Reconstruction of climate conditions using regional chronology Ekaterina Kuznetsova Giancarlo Marino Piotr Owczarek
35 The Northern New Mexico tree-ring chronology Index Year spline - 67% 10 per. Mov. Avg. (spline - 67%) Number of trees: 47 Number of radii: 82 PIST Pinus strobiformis PSME Pseudotsuga menziensii

36 Graphic of response function
37 Calibration and verification of the model (a) October - June PPT (inch) Calibration ( ) Adj R² = 0.62 Veryfication ( ) r = 0.79 RE = 0.57 October - June PPT (inch) Veryfication 1914( ) 1932 r = 0.79 RE = Year Calibration 1968( ) 1986 Adj R² = Year
38 Calibration and verification of the model (b) Time series plot of actual and reconstructed October-June precipitation October - June PPT (inch) Calibration ( ) Adj R² = 0.6 Cross-Validation = 0.59 Actual Estimated Year
39 14 Scatterplot of PRED vs OBS PRED OBS
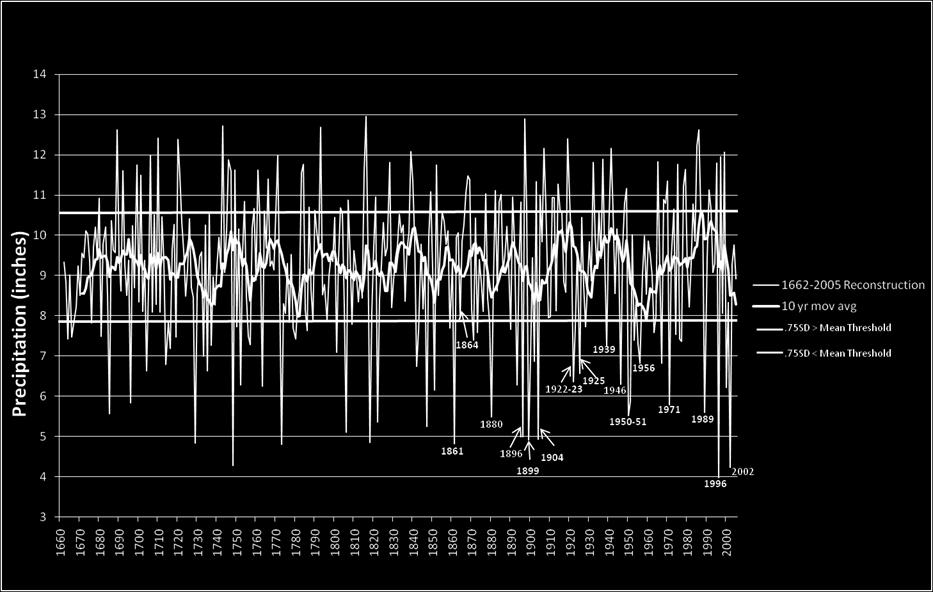
40 18 Time-series plot of reconstruction October June precipitation, AD in Threshold PPT (inch) PPT (inch) year 6.94 in Threshold SS of.75 attained 1021 to 2007 (I) with sample of 4 trees SS of.80 attained 1313 to 2007 (I) with sample of 5 trees SS of.85 attained 1380 to 2007 (C) with sample of 6 trees SS of.90 attained 1462 to 2007 (C) with sample of 10 trees year Estimated Actual


41 TW Swetnam, CD Allen and JL Betancourt, 1999, Applied historical ecology: using the past to manage for the future. Ecological Applications 9(4):
42 year PPT (inch) year Estimated Actual PPT (inch) SS of.75 attained 1021 to 2007 (I) with sample of 4 trees SS of.80 attained 1313 to 2007 (I) with sample of 5 trees SS of.85 attained 1380 to 2007 (C) with sample of 6 trees SS of.90 attained 1462 to 2007 (C) with sample of 10 trees in Threshold in Threshold ????????????

43 Conclusions Analyzed chronologies are responding to climate Primarily moisture sensitive for winter precipitation Tree rings reflecting patterns and processes at multiple scales: Regional Disturbance Regimes Sea surface and atmospheric circulation patterns Dendro is FUN!

44 Acknowledgements! Thanks to: Malcolm Hughes Ramzi Touchan Rex Adams Chris Baisan Ron Towner Tom Swetnam Lori Wilson All LTRR faculty and staff and all guest lecturers
COMPARISON OF FIXED & VARIABLE RATES (25 YEARS) CHARTERED BANK ADMINISTERED INTEREST RATES - PRIME BUSINESS*
 CHARTERED BANK ADMINISTERED INTEREST RATES - PRIME BUSINESS*") COMPARISON OF FIXED & VARIABLE RATES (25 YEARS) Fixed Rates Variable Rates FIXED RATES OF THE PAST 25 YEARS AVERAGE RESIDENTIAL MORTGAGE LENDING RATE - 5 YEAR* (Per cent) Year Jan Feb Mar Apr May Jun Jul
COMPARISON OF FIXED & VARIABLE RATES (25 YEARS) Fixed Rates Variable Rates FIXED RATES OF THE PAST 25 YEARS AVERAGE RESIDENTIAL MORTGAGE LENDING RATE - 5 YEAR* (Per cent) Year Jan Feb Mar Apr May Jun Jul
Supplement of Multi-century lake area changes in the Southern Altiplano: a tree-ringbased reconstruction
 Supplement of Clim. Past,, 9, http://www.clim-past.net//9// doi:.94/cp--9--supplement Author(s). CC Attribution. License. Supplement of Multi-century lake area changes in the Southern Altiplano: a tree-ringbased
GEOS 513 ENSO: Past, Present and Future
 GEOS 513 ENSO: Past, Present and Future Jessica Conroy Department of Geosciences Stephen W. Bieda, III Department of Atmospheric Sciences February 22, 2006: Regional Teleconnections (Observations) References:
Wildland fires in Southern California: climatic controls and future prediction
 Wildland fires in Southern California: climatic controls and future prediction Yufang Jin Department of Earth System Science University of California, Irvine SCSRA 6 th Annual Workshop May 3, 13 Large
CUPSIM Water Supply Variability Study All information subject to change.
 . 1 IN A NUTSHELL The CUP Water Supply Variability Study is an opportunistic, proactive example of responsible water system management The CUP is very complex and approaching full demand The study capitalizes
A high-resolution cellulose δ 18 O record of Pinus merkusii from Cambodia and its climate implications
 A high-resolution cellulose δ 18 O record of Pinus merkusii from Cambodia and its climate implications Mengfan Zhu, Lowell Stott University of Southern California Brendan Buckley LDEO, Columbia University
Variability in the tropical oceans - Monitoring and prediction of El Niño and La Niña -
 Variability in the tropical oceans - Monitoring and prediction of El Niño and La Niña - Jun ichi HIROSAWA Climate Prediction Division Japan Meteorological Agency SST anomaly in Nov. 1997 1 ( ) Outline
ENSO Cycle: Recent Evolution, Current Status and Predictions. Update prepared by Climate Prediction Center / NCEP 8 March 2010
 ENSO Cycle: Recent Evolution, Current Status and Predictions Update prepared by Climate Prediction Center / NCEP 8 March 2010 Outline Overview Recent Evolution and Current Conditions Oceanic Niño Index
An Overview of 20 th Century Warming and Climate Variability in the Western U.S.
 An Overview of 20 th Century Warming and Climate Variability in the Western U.S. Alan F. Hamlet, Philip W. Mote, Nate Mantua, Dennis P. Lettenmaier JISAO/CSES Climate Impacts Group Dept. of Civil and Environmental
El Niño as a drought-buster in Texas: How reliable is it, or what can we expect this winter? Are the September rains a sign of things to come?
 U.S. Drought Monitor Forum, Austin 8oct09 El Niño as a drought-buster in Texas: How reliable is it, or what can we expect this winter? Are the September rains a sign of things to come? Klaus Wolter (klaus.wolter@noaa.gov)
Hui Wang, Mike Young, and Liming Zhou School of Earth and Atmospheric Sciences Georgia Institute of Technology Atlanta, Georgia
 Water Cycle between Ocean and Land and Its Influence on Climate Variability over the South American-Atlantic Regions as Determined by SeaWinds Scatterometers Rong Fu Hui Wang, Mike Young, and Liming Zhou
Properties. terc.ucdavis.edu 8
 Physical Properties 8 Lake surface level Daily since 1900 The lowest lake level on record was 6,220.26 feet on Nov. 30, 1992. Since 1900, lake level has varied by more than 10 feet. Lake level typically
Drought and the Climate of the Ogallala Aquifer
 Drought and the Climate of the Ogallala Aquifer Nolan J. Doesken Colorado Climate Center Colorado State University Presented at Ogallala Symposium, Wray, Colorado February 20, 2006 Prepared by Odie Bliss
Tuesday, January 11, :11 AM (CST)
") Tuesday, January 11, 2011 11:11 AM (CST) -Assessment of current water conditions - Precipitation Forecast - Recommendations for Drought Monitor Upper Colorado Normal Precipitation Upper Colorado River
Tuesday, January 11, 2011 11:11 AM (CST) -Assessment of current water conditions - Precipitation Forecast - Recommendations for Drought Monitor Upper Colorado Normal Precipitation Upper Colorado River
APPENDIX B NOAA DROUGHT ANALYSIS 29 OCTOBER 2007
 APPENDIX B NOAA DROUGHT ANALYSIS 29 OCTOBER 2007 ENSO Cycle: Recent Evolution, Current Status and Predictions Update prepared by Climate Prediction Center / NCEP October 29, 2007 Outline Overview Recent
ENSO Cycle: Recent Evolution, Current Status and Predictions. Update prepared by Climate Prediction Center / NCEP 4 September 2012
 ENSO Cycle: Recent Evolution, Current Status and Predictions Update prepared by Climate Prediction Center / NCEP 4 September 2012 Outline Overview Recent Evolution and Current Conditions Oceanic Niño Index
STD-3-V1M4_1.7.1_AND_ /15/2015 page 1 of 6. TNI Standard. EL-V1M4 Sections and September 2015
 page 1 of 6 TNI Standard EL-V1M4 Sections 1.7.1 and 1.7.2 September 2015 Description This TNI Standard has been taken through all of the voting stages and has received consensus approval by the TNI membership.
Section I: Multiple Choice Select the best answer for each problem.
 Inference for Linear Regression Review Section I: Multiple Choice Select the best answer for each problem. 1. Which of the following is NOT one of the conditions that must be satisfied in order to perform
Intermountain West Climate Summary
 Intermountain West Climate Summary A product of The Western Water Assessment Issued October 2010 Vol. 6, Issue 6 ENSO and Intermountain West Water Supply: A Review of Water Year 2010 and Outlook for Water
Becky Bolinger NIDIS IMW Drought Early Warning System Webinar November 21, 2017
 NIDIS Intermountain West Dec-Feb Winter Outlook Becky Bolinger NIDIS IMW Drought Early Warning System Webinar November 21, 2017 COLORADO CLIMATE CENTER La Niña Advisory And associated impacts from La Niña
Decadal scale linkages between climate dynamics & fish production in Chesapeake Bay and beyond
 Decadal scale linkages between climate dynamics & fish production in Chesapeake Bay and beyond Co-authors: Ed Martino, Xinsheng Zhang, Jackie Johnson NOAA/NOS/NCCOS/Cooperative Oxford Lab Co-authors: Jackie
Drought! When Do We Know It s Over?
 Drought! When Do We Know It s Over? Nolan J. Doesken Colorado Climate Center Colorado State University http://ccc.atmos.colostate.edu Presented at the 2004 Peak to Prairie Landscape Symposium, February
Global Climate Change: Just the Facts
 Global Climate Change: Just the Facts Nolan Doesken State Climatologist, Colorado Climate Center Atmospheric Science Department Colorado State University Presented at Club 20 Fall Meeting, Grand Junction,
MnROAD Mainline IRI Data and Lane Ride Quality MnROAD Lessons Learned December 2006
 MnROAD Mainline IRI Data and Lane Ride Quality December 2006 Derek Tompkins, John Tweet, Prof. Lev Khazanovich University of Minnesota MnDOT Contacts: Bernard Izevbekhai, Tim Clyne 1 Abstract Since 1994,
GROWING SEASON TEMPERATURES
 Ag-Weather Update: Review of Summer Growing Season & Update on the Wet Forecast for Fall & Winter Paul W. Brown Extension Specialist, Biometeorology College of Agriculture & Life Sciences University of
Long-term warming trend over the Indian Ocean
 Long-term warming trend over the Indian Ocean RIO WIO 1. Western Indian Ocean experienced strong, monotonous warming during the last century 2. Links to asymmetry and skewness in ENSO forcing 3. Strong
Global Impacts of El Niño on Agriculture
 Global Impacts of El Niño on Agriculture Presented to the University of Arkansas Division of Agriculture s Food and Agribusiness Series Webinar Series Presented by: Mark Brusberg and Brian Morris USDA
Local vs. Remote SST Forcing in Shaping the Asian-Australian Monsoon Variability
 Local vs. Remote SST Forcing in Shaping the Asian-Australian Monsoon Variability Tim Li IPRC and Dept. of Meteorology, Univ. of Hawaii Acknowledgement. B. Wang, C.-P. Chang, P. Liu, X. Fu, Y. Zhang, Kug
Overview. Learning Goals. Prior Knowledge. UWHS Climate Science. Grade Level Time Required Part I 30 minutes Part II 2+ hours Part III
 Draft 2/2014 UWHS Climate Science Unit 3: Natural Variability Chapter 5 in Kump et al Nancy Flowers Overview This module provides a hands-on learning experience where students will analyze sea surface
Exploring relationships between regional climate and Atlantic Hurricanes Mark R. Jury
 Exploring relationships between regional climate and Atlantic Hurricanes Mark R. Jury Physics Department University of Puerto Rico - Mayagüez Mayaguez, PR, 00681 Data employed: hurricane index: 1850-2004
LONG- TERM CHANGE IN PRE- MONSOON THERMAL INDEX OVER CENTRAL INDIAN REGION AND SOUTH WEST MONSOON VARIABILITY
 LONG- TERM CHANGE IN PRE- MONSOON THERMAL INDEX OVER CENTRAL INDIAN REGION AND SOUTH WEST MONSOON VARIABILITY *S.S. Dugam Indian Institute of Tropical Meteorology, Pune-411008 *Author for Correspondence
The Child. Mean Annual SST Cycle 11/19/12
 Introduction to Climatology GEOGRAPHY 300 El Niño-Southern Oscillation Tom Giambelluca University of Hawai i at Mānoa and Pacific Decadal Oscillation ENSO: El Niño-Southern Oscillation PDO: Pacific Decadal
Indian Ocean Dipole - ENSO - monsoon connections and Overcoming coupled model systematic errors
 Indian Ocean Dipole - ENSO - monsoon connections and Overcoming coupled model systematic errors Hilary Spencer, Rowan Sutton and Julia Slingo CGAM, Reading University h.spencer@reading.ac.uk Monsoon -
Drought: What is the Status?
 Drought: What is the Status? Nolan J. Doesken Colorado Climate Center Colorado State University http://ccc.atmos.colostate.edu Presented at 2005 Peak to Prairie Landscape Symposium, February 11, 2005,
Reconciling disparate 20th Century Indo-Pacific ocean temperature trends in the instrumental record and in CMIP5
 Reconciling disparate 20th Century Indo-Pacific ocean temperature trends in the instrumental record and in CMIP5 Matt Newman and Amy Solomon CIRES/CDC, University of Colorado and NOAA/ESRL/PSD Solomon,
Monitoring and prediction of El Niño and La Niña
 Monitoring and prediction of El Niño and La Niña Akio NARUI El Niño Monitoring and Prediction Group Climate Prediction Division Japan Meteorological Agency Outline 1. Introduction of El Niño and La Niña
Novel empirical correlations for estimation of bubble point pressure, saturated viscosity and gas solubility of crude oils
 86 Pet.Sci.(29)6:86-9 DOI 1.17/s12182-9-16-x Novel empirical correlations for estimation of bubble point pressure, saturated viscosity and gas solubility of crude oils Ehsan Khamehchi 1, Fariborz Rashidi
The South American monsoon system and the 1970s climate transition L. M. V. Carvalho 1, C. Jones 1, B. Liebmann 2, A. Silva 3, P. L.
 The South American monsoon system and the 1970s climate transition L. M. V. Carvalho 1, C. Jones 1, B. Liebmann 2, A. Silva 3, P. L. Silva Dias 3 1 University of California Santa Barbara 2 CIRES, NOAA,
Rice Yield And Dangue Haemorrhagic Fever(DHF) Condition depend upon Climate Data
 Condition depend upon Climate Data") Rice Yield And Dangue Haemorrhagic Fever(DHF) Condition depend upon Climate Data Dr Lai Lai Aung, Assistant Director( Met Service) Dr Khaing Khaing Soe Assistant Director(Public Health) Dr Thin Nwe htwe
Rice Yield And Dangue Haemorrhagic Fever(DHF) Condition depend upon Climate Data Dr Lai Lai Aung, Assistant Director( Met Service) Dr Khaing Khaing Soe Assistant Director(Public Health) Dr Thin Nwe htwe
Climate briefing. Wellington region, February Alex Pezza and Mike Thompson Environmental Science Department
 Climate briefing Wellington region, February 2016 Alex Pezza and Mike Thompson Environmental Science Department For more information, contact the Greater Wellington Regional Council: Wellington PO Box
Monthly Webinar 12.07/2010
 Monthly Webinar 12.07/2010 -Assessment of current water conditions - Precipitation Forecast - Recommendations for Drought Monitor Upper Colorado Normal Precipitation Upper Colorado River Basin Normal
Dr. Vera Potop & Prof. Josef Soukup
 IMPACTS OF DROUGHT AT VARIOUS TIME SCALES ON THE PRODUCTIVITY OF AGRICULTURAL CROPS Czech University of Life Sciences Prague Česká zemědělská univerzita v Praze Acronym in Czech: ČZU Dr. Vera Potop & Prof.
National Weather Service
 National Weather Service The North American Monsoon Until the late 1970s, there was serious debate about whether a monsoon truly existed in North America. However, considerable research, which culminated
INFLUENCE OF ENVIRONMENTAL PARAMETERS ON FISHERY
 Chapter 5 INFLUENCE OF ENVIRONMENTAL PARAMETERS ON FISHERY 5. Introduction Environmental factors contribute to the population dynamics and abundance of marine fishery. The relationships between weather,
Chapter 12 Practice Test
 Chapter 12 Practice Test 1. Which of the following is not one of the conditions that must be satisfied in order to perform inference about the slope of a least-squares regression line? (a) For each value
Design Criteria Data
 TUCUMCARI NM Latitude = 35.18 N WMO No. 723676 Longitude =13.6 W Elevation = 465 feet Period of Record = 1973 to 1996 Average Pressure = 25.86 inches Hg Design Criteria Data Mean Coincident (Average) Values
Appendix ELP El Paso, Texas 2003 Annual Report on Freeway Mobility and Reliability
 (http://mobility.tamu.edu/mmp) Office of Operations, Federal Highway Administration Appendix ELP El Paso, Texas 2003 Annual Report on Freeway Mobility and Reliability This report is a supplement to: Monitoring
Climate variability and changes in the marginal Far-Eastern Seas
 PICES-26 November 2-3, 26 San Diego, USA Climate variability and changes in the marginal Far-Eastern Seas Elena I. Ustinova and Yury D. Sorokin Pacific Fisheries Research Centre (TINRO-Centre) 699 Shevchenko
The Great Paradox of Indian Monsoon Failure (Unraveling The Mystery of Indian Monsoon Failure During El Niño)
") The Great Paradox of Indian Monsoon Failure (Unraveling The Mystery of Indian Monsoon Failure During El Niño) K. Krishna Kumar, B. Rajagopalan, M. Hoerling, G. Bates and M. Cane Point-by-point response
The Great Paradox of Indian Monsoon Failure (Unraveling The Mystery of Indian Monsoon Failure During El Niño) K. Krishna Kumar, B. Rajagopalan, M. Hoerling, G. Bates and M. Cane Point-by-point response
Colorado Weather and Climate Update
 Colorado Weather and Climate Update Nolan J. Doesken State Climatologist Colorado Climate Center, Atmospheric Science Department, Colorado State University Presented to Colorado Livestock Association,
Indian Ocean warming its extent, and impact on the monsoon and marine productivity
 Indian Ocean warming its extent, and impact on the monsoon and marine productivity RIO WIO Indian Ocean warming: o Western Indian Ocean experienced strong, monotonous warming during the last century o
 A Brief Analysis of the Impact of the El Niño Southern Oscillation (ENSO) Cycle In specific areas around East Timor In the Climate Change section of Seeds of Life, we believe it would be beneficial for
Assessing salmon vulnerability to climate change
 Assessing salmon vulnerability to climate change Tim Beechie NW Fisheries Science Center Alisa Wade-Wilcox University of California, Santa Barbara The big question Will climate change negate salmon restoration
The State of the Climate Address
 The State of the Climate Address Nolan J. Doesken Colorado Climate Center, Atmospheric Science Dept, Colorado State University Presented to Colorado Water Officials Association, 2005 Annual Meeting, September
Chaim Garfinkel, Dennis Hartmann University of Washington, Department of Atmospheric Science. WACCM working group June 19, 2008
 The Different ENSO Teleconnections and Their Effects on the Stratospheric Polar Vortex Chaim Garfinkel, Dennis Hartmann University of Washington, Department of Atmospheric Science WACCM working group June
Influence of enhanced convection over Southeast Asia on blocking ridge and associated surface high over Siberia in winter
 5th Session of the East Asia winter Climate Outlook Forum (EASCOF-5), 8-10 November 2017, Tokyo, Japan Influence of enhanced convection over Southeast Asia on blocking ridge and associated surface high
Recent Atmospheric and Oceanic Circulation Changes Affecting Winter Weather in North America. Dr. Art Douglas Professor Emeritus Creighton University
 Recent Atmospheric and Oceanic Circulation Changes Affecting Winter Weather in North America Dr. Art Douglas Professor Emeritus Creighton University Outline 1. The 2018 El Nino: A Northern Hemisphere induced
Neighborhood Influences on Use of Urban Trails
 Neighborhood Influences on Use of Urban Trails Greg Lindsey, Yuling Han, Jeff Wilson Center for Urban Policy and the Environment Indiana University Purdue University Indianapolis Objectives Present new
Arizona Climate Summary September 2012
 Arizona Climate Summary September 2012 Summary of conditions for August 2012 August 2012 Temperature and Precipitation Summary August 1 st 15 th : During the month of August, at least one location received
Mechanistic links between the tropical Atlantic and the Indian monsoon in the absence of El Nino Southern Oscillation events
 Mechanistic links between the tropical Atlantic and the Indian monsoon in the absence of El Nino Southern Oscillation events Vijay Pottapinjara 1*, Roxy Mathew Koll2, Raghu Murtugudde3, Girish Kumar M
Nolan Doesken. Colorado Climate Center.
 Nolan Doesken Colorado Climate Center Presented to: Colorado Conservation Tillage Association, Greeley, CO, February 1-2, 1 2005 http://ccc.atmos.colostate.edu Prepared by Odie Bliss 1 Key Features of
Global Learning And Evidence Exchange (GLEE) Climate Smart Agriculture: Africa
 Climate Smart Agriculture: Africa") Tamuka Magadzire, FEWS NET Scientist, Southern Africa Gideon Galu, FEWS NET Scientist, East Africa tmagadzire@fews.net, ggalu@fews.net Global Learning And Evidence Exchange (GLEE) Climate Smart Agriculture:
Tamuka Magadzire, FEWS NET Scientist, Southern Africa Gideon Galu, FEWS NET Scientist, East Africa tmagadzire@fews.net, ggalu@fews.net Global Learning And Evidence Exchange (GLEE) Climate Smart Agriculture:
Origin of Inter-model uncertainty in ENSO amplitude change
 Origin of Inter-model uncertainty in ENSO amplitude change Shang-Ping Xie Scripps Institution of Oceanography, UCSD Zheng, X.T., S.-P. Xie, L.H. Lv, and Z.Q. Zhou, 2016: Intermodel uncertainty in ENSO
El Niño: what it is and what to expect in San Francisco Bay
 El Niño: what it is and what to expect in San Francisco Bay A. O Neill U.S. Geological Survey Pacific Coastal and Marine Science Center Santa Cruz Outline Tropical Ocean and El Niño Impacts beyond the
Climate Scale Interactions in the Indo-Pacfic Tropical Basins
 Climate Scale Interactions in the Indo-Pacfic Tropical Basins Jean-Philippe Boulanger, Albert Fischer, Julie Leloup, Matthieu Lengaigne and many co-auhors Role of an MJO event in the termination of the
GLMM standardisation of the commercial abalone CPUE for Zones A-D over the period
 GLMM standardisation of the commercial abalone for Zones A-D over the period 1980 2015 Anabela Brandão and Doug S. Butterworth Marine Resource Assessment & Management Group (MARAM) Department of Mathematics
Design Criteria Data
 MEMPHIS TN Latitude = 35.35 N WMO No. 723345 Longitude = 89.87 W Elevation = 322 feet Period of Record = 1973 to 1996 Average Pressure = 29.68 inches Hg Design Criteria Data Mean Coincident (Average) Values
Design Criteria Data
 FRESNO CA Latitude = 36.77 N WMO No. 72389 Longitude =119.7 W Elevation = 328 feet Period of Record = 1972 to 1996 Average Pressure = 29.62 inches Hg Design Criteria Data Mean Coincident (Average) Values
Lab 11: Introduction to Linear Regression
 Lab 11: Introduction to Linear Regression Batter up The movie Moneyball focuses on the quest for the secret of success in baseball. It follows a low-budget team, the Oakland Athletics, who believed that
Challenges in communicating uncertainty of production and timing forecasts to salmon fishery managers and the public
 Challenges in communicating uncertainty of production and timing forecasts to salmon fishery managers and the public Alaska Fisheries Science Center Joseph A. Orsi and Phillip R. Mundy Auke Bay Laboratories
CoCoRaHS goes to the Colorado Farm Show
 CoCoRaHS goes to the Colorado Farm Show Nolan J. Doesken Colorado Climate Center, Atmospheric Science Dept, Colorado State University Presented January 25, 2006, Greeley, CO Prepared by Odie Bliss The
Announcements. % College graduate vs. % Hispanic in LA. % College educated vs. % Hispanic in LA. Problem Set 10 Due Wednesday.
 Announcements Announcements UNIT 7: MULTIPLE LINEAR REGRESSION LECTURE 1: INTRODUCTION TO MLR STATISTICS 101 Problem Set 10 Due Wednesday Nicole Dalzell June 15, 2015 Statistics 101 (Nicole Dalzell) U7
Walker Circulation and El Niño / La Niña Sea Surface Temperature, Rainfall, and Zonal Wind
 Walker Circulation and El Niño / La Niña Sea Surface Temperature, Rainfall, and Zonal Wind David Halpern NASA / California Institute of Technology Jet Propulsion Laboratory Pasadena, CA 91109, USA Contents
Lower Coquitlam River Project Water Use Plan. Temperature Monitoring Lower Coquitlam River Project Year 2 Report
 Lower Coquitlam River Project Water Use Plan Temperature Monitoring Lower Coquitlam River Project Year 2 Report COQMON#6 Temperature Monitoring Study Lower Coquitlam River Study Period: Year 2-2007 Report
Precipitation Patterns in South Park
 Precipitation Patterns in South Park Nolan J. Doesken, State Climatologist Colorado Climate Center, Atmospheric Science Department, Colorado State University Presented at South Park Symposium, August 3,
Journal of Quantitative Analysis in Sports
 Journal of Quantitative Analysis in Sports Volume 1, Issue 1 2005 Article 5 Determinants of Success in the Olympic Decathlon: Some Statistical Evidence Ian Christopher Kenny Dan Sprevak Craig Sharp Colin
Nolan Doesken Colorado Climate Center
 Nolan Doesken Colorado Climate Center Presented to: Colorado Cattleman s s Association, Pueblo, CO, June 19, 2006 http://ccc.atmos.colostate.edu Prepared by Odie Bliss 1 Let s s Talk About Precipitation
Multidecadal Climate Variability
 Multidecadal Climate Variability Signal Propagation across the Northern Hemisphere 2012 Marcia Glaze Wyatt How Something is Viewed Determines What Can be Seen! P E R S P E C T I V E 2 How well can we understand
Inlet Specific and Seasonal Variation in Vessel Use Patterns: The case of the Northeast Florida Region
 Inlet Specific and Seasonal Variation in Vessel Use Patterns: The case of the Northeast Florida Region Nancy Montes Robert Swett University of Florida Automatic Identification System (AIS) Ships 300 or
Draft Kivalina Wind Resource Report
 Draft Kivalina Wind Resource Report Kivalina aerial photo by Doug Vaught, July 2011 May 31, 2012 Douglas Vaught, P.E. dvaught@v3energy.com V3 Energy, LLC Eagle River, Alaska Draft Kivalina Wind Resource
Coquitlam/Buntzen Project Water Use Plan
 Coquitlam/Buntzen Project Water Use Plan Temperature Monitoring Lower Coquitlam River Project Year 3 Report Reference: COQMON#6 Study Period: March 2008 April 2009 Report Date: April 2009 Trow Associates
WIND DATA REPORT. Mt. Tom
 WIND DATA REPORT Mt. Tom September 1, 2003 November 31, 2003 Prepared for Massachusetts Technology Collaborative 7 North Drive Westborough, MA 0181 by James F. Manwell Anthony F. Ellis Taylor Geer January
SEASONAL PRICES for TENNESSEE FEEDER CATTLE and COWS
 SEASONAL PRICES for TENNESSEE FEEDER CATTLE and COWS Tammy L. McKinley Extension Specialist Agricultural & Resource Economics economics.ag.utk.edu AE16-06 July 2016 TABLE OF CONTENTS Seasonal : Introduction...
CCoWS. Central Coast Watershed Studies. Summary of Precipitation and Streamflow for Potrero and San Clemente Creeks in 2010
 Central Coast Watershed Studies CCoWS Summary of Precipitation and Streamflow for Potrero and San Clemente Creeks in Water-Year 2010 Santa Lucia Preserve Monterey County, California Publication No. WI-2011-01
Analysis of the Non-linearity in the Pattern and Time Evolution of El Niño Southern Oscillation!
 2 3 Analysis of the Non-linearity in the Pattern and Time Evolution of El Niño Southern Oscillation! 4 DietmarDommenget *,TobiasBayr 2 andclaudiafrauen SchoolofMathematicalSciences,MonashUniversity,Clayton,Victoria,
Running head: DATA ANALYSIS AND INTERPRETATION 1
 Running head: DATA ANALYSIS AND INTERPRETATION 1 Data Analysis and Interpretation Final Project Vernon Tilly Jr. University of Central Oklahoma DATA ANALYSIS AND INTERPRETATION 2 Owners of the various
PREPARED BY: Marshall K. Cheung, Ph.D., Laboratory Director. REVISED BY: Marshall K. Cheung, Ph.D., Laboratory Director
 DOCUMENT TYPE: DOCUMENT CLASS: Standard Operating Procedure Physical Property Procedure TITLE: Conductivity, EPA 120.1 INSTRUMENTATON: HACH CO150 Conductivity Meter PREPARED BY: Marshall K. Cheung, Ph.D.,
Lecture 13 El Niño/La Niña Ocean-Atmosphere Interaction. Idealized 3-Cell Model of Wind Patterns on a Rotating Earth. Previous Lecture!
 Lecture 13 El Niño/La Niña Ocean-Atmosphere Interaction Previous Lecture! Global Winds General Circulation of winds at the surface and aloft Polar Jet Stream Subtropical Jet Stream Monsoons 1 2 Radiation
Differences in trends and anomalies of upper-air observations from GPS RO, AMSU, and radiosondes
 Differences in trends and anomalies of upper-air observations from GPS RO, AMSU, and radiosondes Florian Ladstädter Hallgeir Wilhelmsen Barbara Angerer Andrea K. Steiner Wegener Center and IGAM/Institute
Weather and Climate Impacts on Water Supply
 Weather and Climate Impacts on Water Supply Nolan Doesken Colorado Climate Center Atmospheric Science Department Colorado State University http://ccc.atmos.colostate.edu Presented at the South Platte Forum,
WIND DATA REPORT. Bourne Water District
 WIND DATA REPORT Bourne Water District July to September 2010 Prepared for Massachusetts Clean Energy Center 55 Summer Street, 9th Floor Boston, MA 02110 by Dylan Chase James F. Manwell Utama Abdulwahid
CS 7641 A (Machine Learning) Sethuraman K, Parameswaran Raman, Vijay Ramakrishnan
 Sethuraman K, Parameswaran Raman, Vijay Ramakrishnan") CS 7641 A (Machine Learning) Sethuraman K, Parameswaran Raman, Vijay Ramakrishnan Scenario 1: Team 1 scored 200 runs from their 50 overs, and then Team 2 reaches 146 for the loss of two wickets from their
CS 7641 A (Machine Learning) Sethuraman K, Parameswaran Raman, Vijay Ramakrishnan Scenario 1: Team 1 scored 200 runs from their 50 overs, and then Team 2 reaches 146 for the loss of two wickets from their
Simplistic predictions, confounding effects, and complex responses; climate tales from Archbold Biological Station
 Simplistic predictions, confounding effects, and complex responses; climate tales from Archbold Biological Station Hilary Swain 1, Nancy Deyrup 1, Kye Ewing 1, Evelyn Gaiser 2, Reed Bowman 1 & Eric Menges
Sample Final Exam MAT 128/SOC 251, Spring 2018
 Sample Final Exam MAT 128/SOC 251, Spring 2018 Name: Each question is worth 10 points. You are allowed one 8 1/2 x 11 sheet of paper with hand-written notes on both sides. 1. The CSV file citieshistpop.csv
Drought or Not? Nolan J. Doesken Colorado Climate Center Colorado State University
 Drought or Not? Nolan J. Doesken Colorado Climate Center Colorado State University http://ccc.atmos.colostate.edu Presented at Horticultural Art Society meeting, November 19, 2004, Colorado Springs, Colorado
Stadium Project - DP-70 Atlanta, GA, 9/30/2014
 Page 1 of 13 The enclosed report contains the data and analysis summary for the SoniCaliper shaft caliper, performed at Stadium Project (DP-70), Atlanta, GA on Tuesday, September 30, 2014 by Chris Kohlhof.
Trade winds How do they affect the tropical oceans? 10/9/13. Take away concepts and ideas. El Niño - Southern Oscillation (ENSO)
") El Niño - Southern Oscillation (ENSO) Ocean-atmosphere interactions Take away concepts and ideas What is El Niño, La Niña? Trade wind and Walker circulation. What is the Southern Oscillation? Tropical
El Niño - Southern Oscillation (ENSO) Ocean-atmosphere interactions Take away concepts and ideas What is El Niño, La Niña? Trade wind and Walker circulation. What is the Southern Oscillation? Tropical
Controls and Control Charting
 Controls and Control Charting Control Charts and Trend Analysis for ISO/IEC 17025:2005 www.aphl.org Abbreviation and Acronyms CRM-Certified Reference Materials RM-Reference Materials PT-Proficiency Test(ing)
Unit 6 Day 2 Notes Central Tendency from a Histogram; Box Plots
 AFM Unit 6 Day 2 Notes Central Tendency from a Histogram; Box Plots Name Date To find the mean, median and mode from a histogram, you first need to know how many data points were used. Use the frequency
NBA TEAM SYNERGY RESEARCH REPORT 1
 NBA TEAM SYNERGY RESEARCH REPORT 1 NBA Team Synergy and Style of Play Analysis Karrie Lopshire, Michael Avendano, Amy Lee Wang University of California Los Angeles June 3, 2016 NBA TEAM SYNERGY RESEARCH