Arizona Climate Summary September 2012
|
|
|
- Edward Rich
- 5 years ago
- Views:
Transcription


1 Arizona Climate Summary September 2012 Summary of conditions for August 2012 August 2012 Temperature and Precipitation Summary August 1 st 15 th : During the month of August, at least one location received rainfall each day of the month except August 2 nd. On the 1 st, the northeast and the high elevations of eastern Arizona received rainfall as high pressure moved over western Texas, creating a southerly flow of moist air. On the 2 nd the high moved further east, but both northern and southern Arizona had rain, and through the rest of that week showers occurred along the Mogollon Rim, as well as northern and southern Arizona. Only central and southwestern Arizona dried out. By the 6 th, the high pressure returned to western Texas bringing moisture briefly into central Arizona. From the 8 th through the 14 th, the high moved directly over Arizona, keeping the central counties dry, while scattered, light monsoon activity continued around the borders of the state. The dry conditions in central and southern Arizona allowed temperatures to rise to record levels. Phoenix set 4 high temperature records, and from the 6 th through the 14 th, daytime temperatures remained at or above 110 o F, much warmer than normal. The moisture returned statewide on the 15 th, as the high moved over New Mexico, then the Four Corners, then down over northern Mexico. August 16 th 31st: From the 16 th through the 24 th, dew points remained high statewide bringing rainfall across the state and lowering temperatures. On the 16 th, Bisbee had 1.80, Bellemont had 1.54 ; on the 17 th Petrified Forest had 1.22 ; on the 19 th Bowie had 1.08 ; on the 20 th Bisbee-Douglas AP had 1.11 ; on the 22 nd Casa Grande had 3.00, South Mountain had 1.43 and Seligman had 1.50 ; on the 23 rd Carefree had 1.80, Saint Johns had 1.48, Bellemont had 1.45 and Seligman had The peak temperature during this time was 110 o F at Bullhead City on the 19 th. During the last week of the month Bellemont had 1.17 on the 25 th and 1.66 of rain on the 26 th. Rainfall totals dropped below an inch after the 26 th, though activity continued in the southern, eastern, and northern counties. Humidity remained high, and temperatures rebounded above 110 o F through the end of the month. In This Issue: Overview of August, graphs of the August daily maximum and minimum temperatures, precipitation, mean daily dew points for Flagstaff, Phoenix, and Tucson; August climate statistics, maps of mean monthly maximum and minimum temperatures, precipitation, dew points, wind speeds for August; and graphs of the mean August temperature and precipitation for the period of record for Tucson, Phoenix, and Flagstaff, graphs of the cumulative precipitation for the calendar year for Flagstaff, Phoenix, and Tucson. Climate calendars for Flagstaff, Phoenix, Tucson, Prescott, Winslow and Yuma, including daily and monthly normals and extremes, for each month of the year, can be downloaded directly from the State Climate website. See p. 18 of this report for calendar abbreviations. Data are preliminary and are from the National Weather Service Forecast Offices in Flagstaff, Phoenix and Tucson. **Note: The discrepancy between the Statewide Temperature and Precipitation values for Phoenix, Flagstaff and Tucson and the daily values in their graphs are due to the reporting times. Statewide Temperature and Precipitation values are taken at 5pm, while official daily records at the airports are taken from Midnight to Midnight. State Climate Office Dr. Nancy J. Selover, State Climatologist Tel: Arizona State Climate Office 1 School of Geographical Sciences & Urban Planning Arizona State University Tempe, AZ Edited by Nancy J. Selover & Matt Salerno


2 August 2012 Daily Temperature, Precipitation, & Dew Point for Flagstaff, Phoenix, and Tucson 2


3 3
4 FLAGSTAFF CLIMATE STATISTICS August 2012 This August was tied for 18 th warmest on record and had no significant ranking for precipitation Avg Max Temp (F) 79.7 Normal 78.4 Avg Min Temp (F) 52.3 Normal 50.1 Avg Mean Temp (F) 66.0 Normal 64.2 Departure from Normal (F) +1.8 Highest Monthly Avg Temp (F) 67.5 in 1944 Lowest Monthly Avg Temp (F) 59.5 in 1968 Highest Temp this month (F): 88 on 10 th Lowest Temp this month (F): 48 on 25 th Record High (F): 93 on 08/02/1902 Record Low (F): 24 on 08/23/1968 Temperature or precipitation records this month: 18 th HiMin 57 tied, first set in st HiMin 56 tied, first set in 2008 Maximum Temp 85 o or higher 6 Heating Degree Days 18 Normal 56 Cooling Degree Days 58 Normal 33 Degree base 65 o F Total August Precipitation 2.59 Normal August Precipitation 3.11 Departure from normal Greatest 24-Hr Precipitation /22-23 Total Precipitation Year-to-Date Departure from Normal Number of Days: Clear 20 Partly Cloudy 11 Cloudy 0 Greatest August Precipitation 8.77 in 1904 Least August Precipitation 0.26 in 1962 Flagstaff Number of Days of: Minimum Temp 50 o or lower 7 Minimum Temp 55 o or higher 5 Maximum Temp 75 o or lower 5 Average Wind Speed Highest Peak Gust 3.7 mph 62 mph from 260 o on 30 th PHOENIX CLIMATE STATISTICS August 2012 This August was the 4 th warmest and 27 th wettest on record Avg Max Temp(F) Normal Avg Min Temp(F) 84.9 Normal 82.7 Avg Mean Temp (F) 95.3 Normal 93.6 Departure from Normal (F) +1.7 Highest Monthly Avg Temp (F) 98.3 in 2011 Lowest Monthly Avg Temp (F) 84.6 in 1918 Highest Temp this month (F): 116 on 8 th Lowest Temp this month (F): 73 on 23 rd Record High (F): 117 on 08/26/2011 Record Low (F): 58 on 08/20/1917 Temperature or precipitation records set this month: 7 th HiMax 112 tied, first set in th HiMin 90 set, previous record 89 in th HiMax 116 set, previous record 115 set in th HiMin 93 tied, first set in th HiMax 114 set, previous record 113 set in th HiMin 93 set, previous record 91 set in th HiMax 115 set, previous record 114 set in th HiMax 115 set, previous record 113 set in th HiMax 113 tied, first set in th HiMin 92 set, previous record 89 in st Precip 0.33 set, previous record 0.21 in rd Precip 0.80 set, previous record 0.56 in 1982 Phoenix Number of Days of: Minimum Temp 80 o or lower 4 Minimum Temp 90 o or higher 7 Maximum Temp 100 o or lower 7 Maximum Temp 110 o or higher 10 Heating Degree Days 0 Normal 0 Cooling Degree Days 948 Normal 885 Degree base 65 o F
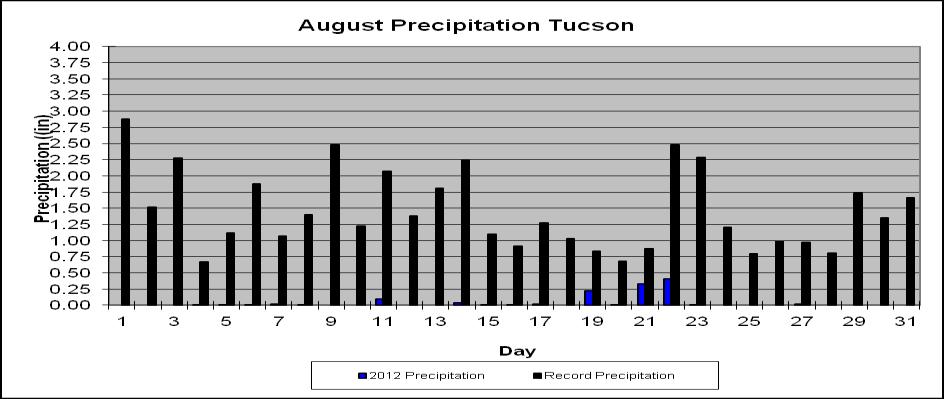
5 Total August Precipitation 1.45 Normal August Precipitation 1.00 Departure from normal Greatest 24-Hr Precipitation 0.80 on 8/23 Total Precipitation Year-to-Date 2.77 Departure from Normal Number of Days: Clear 6 Partly Cloudy 25 Cloudy 0 Greatest August Precipitation 5.33 in 1951 Least August Precipitation 0.00 in 1973, 1975, 2002 Average Wind Speed Highest Peak Gust 6.4 mph 44 mph from 160 o on 14 th TUCSON CLIMATE STATISTICS August 2012 This August was the 4 th warmest and 28 th driest on record. Avg Max Temp(F) Normal 97.4 Avg Min Temp(F) 75.8 Normal 73.3 Avg Mean Temp(F) 88.2 Normal 85.3 Departure from Normal (F) +2.9 Highest Monthly Avg Temp (F) 90.2 in 1994 Lowest Monthly Avg Temp (F) 80.8 in 1923 Highest Temp this month (F): Lowest Temp this month (F): Record High (F): 112 on 08/01/1993 Record Low (F): 55 on 08/20/ on 12 th, 13 th 71 on 22 nd Temperature or precipitation records this month: 8 th HiMax 108 set, previous record 107 in th HiMin 82 tied, first set in th HiMax 108 set, previous record 108 in th HiMax 109 set, previous record 106 in th HiMax 106 tied, first set in 1998 Greatest 24-Hr Precipitation 0.63 on 8/21-22 Total Precipitation Year-to-Date 6.32 Departure from Normal Greatest August Precipitation 7.93 in 1955 Least August Precipitation 0.08 in 1924 Number of Days: Clear 24 Partly Cloudy 3 Cloudy 4 Average Wind Speed Highest Peak Gust 5.9 mph 56 mph from 030 o on 22 nd Data are from the National Weather Service and the National Climatic Data Center and are preliminary. Tucson Number of Days of: Minimum Temp 70 o or lower 0 Minimum Temp 80 o or higher 6 Maximum Temp 95 o or lower 5 Maximum Temp 105 o or higher 9 Heating Degree Days 0 Normal 0 Cooling Degree Days 725 Normal 631 Degree base 65 o F Total August Precipitation 1.17 Normal August Precipitation 2.39 Departure from normal
6 Winds for August: Day Phoenix Flagstaff Tucson (mph) Avg Max Avg Max Avg Max Dew Points for August: Daily Average Dew Point ( o F): Day Phx Tuc Flg
 network operated by the Bureau of Land Management and Forest Service and the")
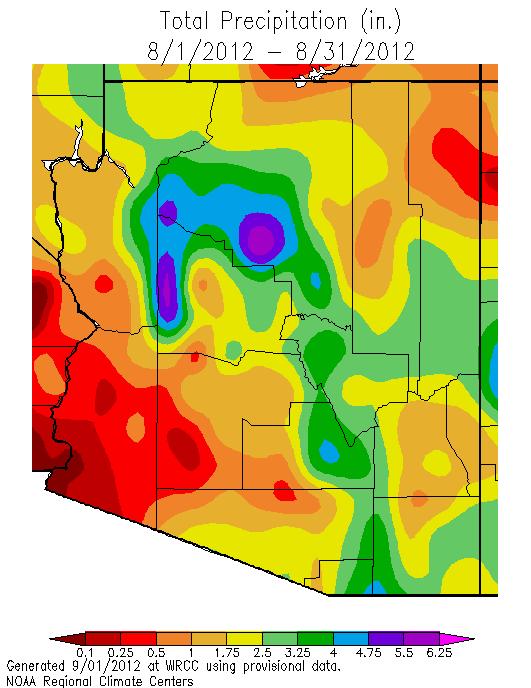
7 August 2012 Temperature, Dew Point, Wind Speed, and Precipitation Maps are based on preliminary data from the National Weather Service, the Arizona Meteorological Network (AZMet), operated by the University of Arizona College of Agriculture Cooperative Extension and the RAWS (Remote Automated Weather Station) network operated by the Bureau of Land Management and Forest Service and the CoCoRaHS (Community Collaborative Rain, Hail and Snow) Network. Average nighttime temperatures ranged from 40 o F at Columbine to 86 o F at Glendale Airport. Average daytime temperatures ranged from 76 o F at Bright Angel Ranger Station at the bottom of the Grand Canyon to 119 o F at Lake Havasu City. Precipitation values ranged from 0 to 8.37 at Sollers and 8.02 at Bellemont. 7
8 Average monthly dew points ranged from 75 o F at Parker 45 o F at Flagstaff, Piney Hill and Paria Point in northern Arizona. Average winds were light, with 10 mph as the highest average at Guthrie, Oatman, Hopkins and Kingman. The highest peak wind gust was 64 mph at Humbug Creek. 8
9 9


10 August minimum temperatures were 2 to 4 o F warmer than normal statewide, with very warm conditions in Gila County. Daytime temperatures were 1 to 4 o F warmer than normal in the eastern half of the state and near average or slightly cooler than average in the western counties. Precipitation for August was highly variable across the state. The northeast was much wetter than normal while southern and southeastern Arizona were much drier than normal. Pinal County was very wet in August, while northern Apache County had less than 50% of their normal August rainfall. 10

11 11


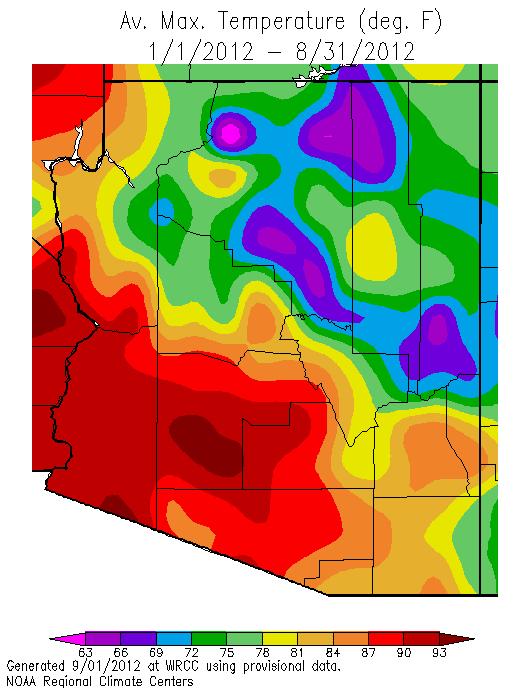
12 Calendar Year 2012 Since January, overnight temperatures continue to be within 2 o F of normal, with most of the state warmer than normal, and Gila County much warmer. Daytime temperatures have been 1-4 o F warmer than normal, with Pima and southern Mohave and Pinal counties slightly cooler than normal. Precipitation over the calendar year has been well below normal across most of the state, with exceptions near the borders of Coconino, Mohave and Yavapai counties and along the lower Colorado River valley. Graham and Navajo counties have received near average precipitation. 12

13 13


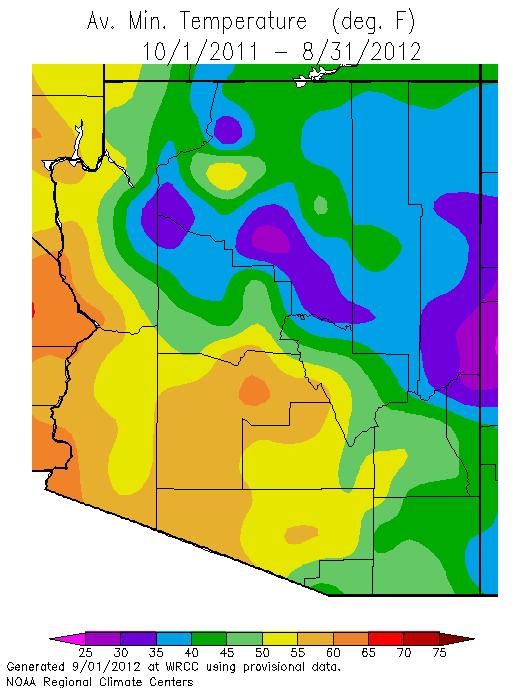
14 Water Year 2012 (Oct August 31, 2012) Nighttime temperatures have been within 2 o F of normal through the water year, with the warmer temperatures since January balancing out the colder temperatures that occurred between October 1 and the end of December. Daytime temperatures have generally been warmer than normal except in southern Pinal and central Pima counties where clouds and precipitation during the monsoon have kept temperatures 1-3 o F below normal. La Niña has held precipitation well below normal in the northeast and southwest. The northwest, including central Mohave and western Yavapai and Coconino counties, has been much wetter than normal, mostly due to recent monsoon precipitation. Western Pima County has also benefitted from significant monsoon rainfall. 14
15 Temperature (F) Temperature (F) Temperature (F) August Mean Temperature Graphs Flagstaff, Phoenix, and Tucson : Flagstaff Mean August Temperature (Median 64.1 o F) Year Phoenix Mean August Temperature (Median 89.9 o F) Year Tucson Mean AugustTemperature (Median 84.3 o F) Year 15
16 Precipitation (in) Precipitation (in) Precipitation (in) August Mean Precipitation Graphs Flagstaff, Phoenix, and Tucson : August Precipitation Flagstaff (Median 2.71") Year August Precipitation Phoenix (Median 0.74") Year August Precipitation Tucson (Median 2.00") Year 16


17 2012 Cumulative Precipitation Graphs Flagstaff, Phoenix and Tucson: Only Flagstaff is lagging behind last year s precipitation, and phoenix is well below normal. 17
18 The downloadable normals and extremes calendars use the following abbreviations: NORM = 30 year ( ) average value (degrees Fahrenheit (F)) OBS = The temperature observation for that day this year AVG = Average daily temperature HI MAX = Highest maximum temperature for that day (F) LO MAX = Lowest maximum temperature for that day (F) LO MIN = Lowest minimum temperature for that day (F) HI MIN = Highest minimum temperature for that day (F) Mx PCP = Maximum precipitation for that day (inches) Mx SNO = Maximum snowfall for that day (inches) 18
Arizona Climate Summary
 Arizona Climate Summary March 2012 Summary of conditions for February 2012 February 2012 Temperature and Precipitation Summary February 1 st 17 th : February continued where January left off with a high
Arizona Climate Summary December 2008
 Arizona Climate Summary December 28 Summary of conditions for November 28 November 28 Temperature and Precipitation Summary November 1 st - 11 th : November began with high pressure over the western U.S.,
Environmental Protection The answer my friend is blowing in the wind
 Environmental Protection The answer my friend is blowing in the wind Nolan Doesken Colorado Climate Center Colorado State University Presented at the Pesticide Conference, November 17, 2005, Denver, CO
Drought: What is the Status?
 Drought: What is the Status? Nolan J. Doesken Colorado Climate Center Colorado State University http://ccc.atmos.colostate.edu Presented at 2005 Peak to Prairie Landscape Symposium, February 11, 2005,
LAB H - ATMOSPHERE AND CLIMATE LAB II STABILITY AND PRECIPITATION PATTERNS
 Introduction LAB H - ATMOSPHERE AND CLIMATE LAB II STABILITY AND PRECIPITATION PATTERNS This lab will provide students with the opportunity to become familiar with the concepts of atmospheric stability
The Arkansas Basin Climate Report Part 1 -- Remembering where we ve come from
 The Arkansas Basin Climate Report Part 1 -- Remembering where we ve come from Nolan Doesken State Climatologist (retired) Colorado Climate Center / Colorado Water Institute Colorado State University Arkansas
Drought or Not? Nolan J. Doesken Colorado Climate Center Colorado State University
 Drought or Not? Nolan J. Doesken Colorado Climate Center Colorado State University http://ccc.atmos.colostate.edu Presented at Horticultural Art Society meeting, November 19, 2004, Colorado Springs, Colorado
Nolan Doesken. Colorado Climate Center.
 Nolan Doesken Colorado Climate Center Presented to: Colorado Conservation Tillage Association, Greeley, CO, February 1-2, 1 2005 http://ccc.atmos.colostate.edu Prepared by Odie Bliss 1 Key Features of
2. Study Setting. This section describes the study domain, major terrain features, land use, meteorology, and regional air quality and visibility.
 2. Study Setting This section describes the study domain, major terrain features, land use, meteorology, and regional air quality and visibility. 2.1 The Southwestern United States Figure 2-1 shows a terrain
The Awesome, Wonderful, Beautiful, Exciting and Terrible Climate of the West What a Hoot!
 The Awesome, Wonderful, Beautiful, Exciting and Terrible Climate of the West What a Hoot! Nolan J. Doesken, State Climatologist Colorado Climate Center Presented to Four States Irrigation Council, 54 th
Weather and Climate Impacts on Water Supply
 Weather and Climate Impacts on Water Supply Nolan Doesken Colorado Climate Center Atmospheric Science Department Colorado State University http://ccc.atmos.colostate.edu Presented at the South Platte Forum,
8/29/20098 SAHRA - Watershed Visualization
 Module 3 Narration Southwestern Water Cycle 001.wav 26 sec 002.wav 10 sec 003 wav 17 sec Water on Earth is constantly on the move. Water continually circulates between the surface of Earth and the atmosphere
Global Weather Patterns
 Global Weather Patterns AZ State Standards Concept 2: Energy in the Earth System (Both Internal and External) Understand the relationships between the Earth s land masses, oceans, and atmosphere. PO 2.
El Niño and the Winter Weather Outlook
 El Niño and the 2015-2016 Winter Weather Outlook 2015 NASEO Annual Meeting http://www.ospo.noaa.gov/products/ocean/sst/anomaly/ NWS Boston February 10, 2015 Jimmy Taeger Meteorologist National Weather
Global Climate Change: Just the Facts
 Global Climate Change: Just the Facts Nolan Doesken State Climatologist, Colorado Climate Center Atmospheric Science Department Colorado State University Presented at Club 20 Fall Meeting, Grand Junction,
Applied Earth Science Climate Exam Practice Questions Page 1
 Name: 1. Which combination of climate factors generally results in the coldest temperatures? A) low elevation and low latitude B) low elevation and high latitude C) high elevation and low latitude D) high
Weather EOG Review Questions
 Weather EOG Review Questions 1. Which statement best describes runoff? A Water vapor cools off and changes into water droplets. B Water in the form of rain, snow, sleet, or hail falls from clouds. C Precipitation
Drought! When Do We Know It s Over?
 Drought! When Do We Know It s Over? Nolan J. Doesken Colorado Climate Center Colorado State University http://ccc.atmos.colostate.edu Presented at the 2004 Peak to Prairie Landscape Symposium, February
Lecture 13 March 24, 2010, Wednesday. Atmospheric Pressure & Wind: Part 4
 Lecture 13 March 24, 2010, Wednesday Atmospheric Pressure & Wind: Part 4 Synoptic scale winds Mesoscale winds Microscale winds Air-sea interactions The largest synoptic scale wind. Monsoon: Arabic for
CoCoRaHS goes to the Colorado Farm Show
 CoCoRaHS goes to the Colorado Farm Show Nolan J. Doesken Colorado Climate Center, Atmospheric Science Dept, Colorado State University Presented January 25, 2006, Greeley, CO Prepared by Odie Bliss The
The State of the Climate Address
 The State of the Climate Address Nolan J. Doesken Colorado Climate Center, Atmospheric Science Dept, Colorado State University Presented to Colorado Water Officials Association, 2005 Annual Meeting, September
TEP-UNS Electric Load and Peak Demand Forecast Overview
 TEP-UNS Electric Load and Peak Demand Forecast Overview Jon M. Bowman Senior Supply-Side Planner TEP and UES Resource Planning Workshop 1 Objectives Provide an overview of the load and peak demand forecasts
Colorado Weather and Climate Update
 Colorado Weather and Climate Update Nolan J. Doesken State Climatologist Colorado Climate Center, Atmospheric Science Department, Colorado State University Presented to Colorado Livestock Association,
Nolan Doesken Colorado Climate Center
 Nolan Doesken Colorado Climate Center Presented to: Colorado Cattleman s s Association, Pueblo, CO, June 19, 2006 http://ccc.atmos.colostate.edu Prepared by Odie Bliss 1 Let s s Talk About Precipitation
Drought and the Climate of the Ogallala Aquifer
 Drought and the Climate of the Ogallala Aquifer Nolan J. Doesken Colorado Climate Center Colorado State University Presented at Ogallala Symposium, Wray, Colorado February 20, 2006 Prepared by Odie Bliss
CLIMATE OF WASHINGTON
 1 of 7 3/19/2008 11:37 AM CLIMATE OF WASHINGTON TOPOGRAPHIC FEATURES The location of the State of Washington on the windward coast in mid-latitudes is such that the climatic elements combine to produce
Air Masses and Fronts
 Air Masses and Fronts A huge body of air that has similar temperature, humidity, and air pressure at any given height is called an air mass. A single air mass may spread over millions of square kilometers
Cal Poly Lands located in San Luis Obispo County experience a collection of idyllic microclimates
 Climate Margot McDonald, College of Architecture and Environmental Design Cal Poly Lands located in San Luis Obispo County experience a collection of idyllic microclimates due to their geographical position
Tuesday, January 11, :11 AM (CST)
") Tuesday, January 11, 2011 11:11 AM (CST) -Assessment of current water conditions - Precipitation Forecast - Recommendations for Drought Monitor Upper Colorado Normal Precipitation Upper Colorado River
Tuesday, January 11, 2011 11:11 AM (CST) -Assessment of current water conditions - Precipitation Forecast - Recommendations for Drought Monitor Upper Colorado Normal Precipitation Upper Colorado River
Social Studies CHAPTER 2: PART 2 CLIMATE AND WEATHER
 Social Studies CHAPTER 2: PART 2 CLIMATE AND WEATHER Climate Weather and Identity Climate and weather have a large influence on how Canadians build their identity. We will study the factors that contribute
A Snapshot of Our Changing Climatology
 A Snapshot of Our Changing Climatology Dr. Kenneth ( Kenny ) Blumenfeld Sr. Climatologist DNR State Climatology Office 11/17/2018 1 Items to bear in mind 1. Climate news elsewhere may not apply here 2.
The change in temperature as air rises or descends d in the atmosphere. This change is measured by a lapse rate
 Adiabatics The change in temperature as air rises or descends d in the atmosphere. This change is measured by a lapse rate oftenplotted on an adiabatic chart. Such processes are closely connected to precipitation
Climate of Colorado. Climatography of the United States No. 60 (updated 1/2003) Prepared by
 Prepared by") Climate of Colorado Climatography of the United States No. 60 (updated 1/2003) Prepared by Nolan J. Doesken, Roger A. Pielke, Sr., and Odilia A.P. Bliss Colorado Climate Center, Atmospheric Science Department,
Climate of Colorado Climatography of the United States No. 60 (updated 1/2003) Prepared by Nolan J. Doesken, Roger A. Pielke, Sr., and Odilia A.P. Bliss Colorado Climate Center, Atmospheric Science Department,
Bell Work. Compare and contrast warm fronts and cold fronts. What type of weather is associated with a high pressure and low pressure systems?
 Daily Routine Sit in your appropriate seat quietly Have all necessary materials out All back packs on the floor All cell phones on silent and away in backpacks All music devices off and headphones out
Climate Issues A State s s Perspective
 Climate Issues A State s s Perspective Nolan J. Doesken Colorado State Climatologist, President Elect AASC Colorado Climate Center, Colorado State University FYO8 Central Regional MIC/HIC Conference, Kansas
The student will be expected to demonstrate an understanding of the cause of winds and how winds affect climate.
 The student will be expected to demonstrate an understanding of the cause of winds and how winds affect climate. In this lesson you will: 2.3.1 Define the term prevailing winds. (k) 2.3.3 State the impact
National Weather Service
 National Weather Service Gulf of California Moisture Surges Gulf of California moisture surges, or simply Gulf Surges, are one of the most researched components of the North American Monsoon. As early
MONSOONS. Summer Monsoon
 MONSOONS A monsoon is a seasonal change in the direction of the prevailing, or strongest, winds of a region. Monsoons cause wet and dry seasons throughout much of the tropics. Monsoons are most often associated
sulting NOAA Richmond NOAA Richmond Station
 NOAA Richmond NOAA Richmond Station This station is located at the Chevron pier and is operated by the NOAA. It provides wind data as well as tide data. The winds never reached 40 knots The winds did not
GEOS 513 ENSO: Past, Present and Future
 GEOS 513 ENSO: Past, Present and Future Jessica Conroy Department of Geosciences Stephen W. Bieda, III Department of Atmospheric Sciences February 22, 2006: Regional Teleconnections (Observations) References:
Historical and Current Climate in the Rio Grande National Forest Area. Peter Goble Nolan Doesken 10/19/2016
 Historical and Current Climate in the Rio Grande National Forest Area Peter Goble Nolan Doesken 10/19/2016 Geographic Orientation Geographic Orientation Geographic Orientation Rio Grande National Forest
THE RETREAT AT THE AERIE
 THE RETREAT AT THE AERIE EXCLUSIVE LISTING SEDONA, ARIZONA Capri Barney cbarney@landadvisors.com 4900 North Scottsdale Road, Suite 3000, Scottsdale, Arizona 85251 ph. 928.445.4457 www.landadvisors.com
THE RETREAT AT THE AERIE
 THE RETREAT AT THE AERIE EXCLUSIVE LISTING SEDONA, ARIZONA Capri Barney cbarney@landadvisors.com 4900 North Scottsdale Road, Suite 3000, Scottsdale, Arizona 85251 ph. 928.445.4457 www.landadvisors.com
Validation Study of the Lufft Ventus Wind Sensor
 Weather Forecasts Renewable Energies Air and Climate Environmental Information Technology METEOTEST Cooperative Fabrikstrasse 14, CH-3012 Bern Tel. +41 (0)31 307 26 26 Fax +41 (0)31 307 26 10 office@meteotest.ch,
9. The Earth's planetary winds are deflected as a result of the Earth's A) revolution around the Sun B) seasonal changes C) rotation on its axis D)
 revolution around the Sun B) seasonal changes C) rotation on its axis D)") 1. Which ocean current transports warm water away from Earth s equatorial region? A) Brazil Current B) Guinea Current C) Falkland Current D) California Current 2. The Gulf Stream and North Atlantic Current
1. Which ocean current transports warm water away from Earth s equatorial region? A) Brazil Current B) Guinea Current C) Falkland Current D) California Current 2. The Gulf Stream and North Atlantic Current
GROWING SEASON TEMPERATURES
 Ag-Weather Update: Review of Summer Growing Season & Update on the Wet Forecast for Fall & Winter Paul W. Brown Extension Specialist, Biometeorology College of Agriculture & Life Sciences University of
Final Report August 2005
 2.0 REGIONAL STUDY AREA 2.1 Regional Setting 2.1.1 Topography The Los Angeles Region is located within the western portion of the Transverse Ranges Geomorphic Province. The San Andreas transform fault
National Weather Service
 National Weather Service The North American Monsoon Until the late 1970s, there was serious debate about whether a monsoon truly existed in North America. However, considerable research, which culminated
Canada s Natural Systems. Canadian Geography 1202
 Canada s Natural Systems Canadian Geography 1202 Canada s Natural Systems Natural System: A system found in nature Here are the four natural systems that we will explore in the next few weeks 1. Canada
ALL TEMPERATURE VARIABLES MEGA PACKET
 NAME: MEGA PACKET 1. The map below shows a portion of the western United States and Canada. Two cities in Canada, Vancouver and Winnipeg, are labeled on the map. Which graph best represents the average
9-1: What Causes Climate. 6 th Grade Earth Science
 6 th Grade Earth Science What is Climate? 9-1: What Causes Climate Climate is the long-term average conditions of temperature, precipitation, winds, and clouds in an area. Examples of Climate The Mojave
Precipitation Patterns in South Park
 Precipitation Patterns in South Park Nolan J. Doesken, State Climatologist Colorado Climate Center, Atmospheric Science Department, Colorado State University Presented at South Park Symposium, August 3,
Hunters need to be attentive to the hunt area boundaries, as they are different in most cases from the unit boundaries.
 This Informational Handout for the 2017 Elk Over-the-Counter Nonpermit-tags is being provided for reference only to assist hunters in understanding this unique but limited and restricted hunting opportunity.
Design Criteria Data
 MEMPHIS TN Latitude = 35.35 N WMO No. 723345 Longitude = 89.87 W Elevation = 322 feet Period of Record = 1973 to 1996 Average Pressure = 29.68 inches Hg Design Criteria Data Mean Coincident (Average) Values
Design Criteria Data
 FRESNO CA Latitude = 36.77 N WMO No. 72389 Longitude =119.7 W Elevation = 328 feet Period of Record = 1972 to 1996 Average Pressure = 29.62 inches Hg Design Criteria Data Mean Coincident (Average) Values
Local Winds & Microclimates. Unit 2- Module 1
 Local Winds & Microclimates Unit 2- Module 1 Objectives Overview of local winds (sea & land breezes, valley winds) Overview of microclimates (valley, urban, woodland) Local Winds Local Winds Local winds
Intermountain West Climate Summary
 Intermountain West Climate Summary A product of The Western Water Assessment Issued October 2010 Vol. 6, Issue 6 ENSO and Intermountain West Water Supply: A Review of Water Year 2010 and Outlook for Water
Design Criteria Data
 TUCUMCARI NM Latitude = 35.18 N WMO No. 723676 Longitude =13.6 W Elevation = 465 feet Period of Record = 1973 to 1996 Average Pressure = 25.86 inches Hg Design Criteria Data Mean Coincident (Average) Values
Ecology. Professor Andrea Garrison Biology 3A Illustrations 2014 Cengage Learning unless otherwise noted
 Ecology Professor Andrea Garrison Biology 3A Illustrations 2014 Cengage Learning unless otherwise noted Ecology Ecology (oikos = house) is the study of where an organism lives and all the interactions
Your web browser (Safari 7) is out of date. For more security, comfort and the best experience on this site: Update your browser Ignore
 is out of date. For more security, comfort and the best experience on this site: Update your browser Ignore") Your web browser (Safari 7) is out of date. For more security, comfort and the best experience on this site: Update your browser Ignore L A NIÑA El Niño-Southern Oscillation (ENSO) For the complete encyclopedic
Your web browser (Safari 7) is out of date. For more security, comfort and the best experience on this site: Update your browser Ignore L A NIÑA El Niño-Southern Oscillation (ENSO) For the complete encyclopedic
 To: The Membership, An Overview of the Duties of the State Convention Committee: 1. Main Purpose; A. To secure a venue to accommodate rooms for 200+ guests for the 5 days of the Convention, at an affordable
Pacific Climate Variability
 Pacific Climate Variability Pacific Islands Climate Education Partnership You may have heard the term climate variability. What does the term climate variability mean? What are the causes and effects of
The student will be expected to demonstrate an understanding of the cause of winds and how winds affect climate.
 The student will be expected to demonstrate an understanding of the cause of winds and how winds affect climate. In this lesson you will: 2.3.1 Define the term prevailing winds. (k) 2.3.3 State the impact
Module 2 Narration What is a watershed?
 Module 2 Narration What is a watershed? Timing Key Narrative Snapshots a) 00:10 Every living thing relies on water to exist. But where does our water come from? The most natural place to look is upstream
Basketball (Girls) AIA Initial Division Placements , Appeal Deadline Monday, Feb. 2, 2015 at 2 p.m.
 AIA Initial Division Placements , Appeal Deadline Monday, Feb. 2, 2015 at 2 p.m.") Basketball (Girls) AIA Initial Division Placements 2015 2018, Appeal Deadline Monday, Feb. 2, 2015 at 2 p.m. The following pages show the initial division placements. To get an understanding of how the
Basketball (Girls) AIA Initial Division Placements 2015 2018, Appeal Deadline Monday, Feb. 2, 2015 at 2 p.m. The following pages show the initial division placements. To get an understanding of how the
Basketball (Boys) AIA Initial Division Placements , Appeal Deadline Monday, Feb. 2, 2015 at 2 p.m.
 AIA Initial Division Placements , Appeal Deadline Monday, Feb. 2, 2015 at 2 p.m.") Basketball (Boys) AIA Initial Division Placements 2015 2018, Appeal Deadline Monday, Feb. 2, 2015 at 2 p.m. The following pages show the initial division placements. To get an understanding of how the
Basketball (Boys) AIA Initial Division Placements 2015 2018, Appeal Deadline Monday, Feb. 2, 2015 at 2 p.m. The following pages show the initial division placements. To get an understanding of how the
Climate briefing. Wellington region, February Alex Pezza and Mike Thompson Environmental Science Department
 Climate briefing Wellington region, February 2016 Alex Pezza and Mike Thompson Environmental Science Department For more information, contact the Greater Wellington Regional Council: Wellington PO Box
Weather and Climate. Climate the situation of the atmosphere during a long period of time and a big surface.
 Weather and Climate Weather and Climate Weather the situation of the atmosphere during a short period of time and a small surface of the Earth. It is very irregular and changes a lot. Climate the situation
Meteorology of Monteverde, Costa Rica 2007
 Meteorology of Monteverde, Costa Rica 2007 Technical Report submitted to the Monteverde Institute Andrew J. Guswa, Associate Professor, Picker Engineering Program Amy L. Rhodes, Associate Professor, Department
Station 1: Ocean Currents Use the ocean currents map copied from page 4 of the ESRT and the passage to answer the questions that follow.
 Station 1: Ocean Currents Use the ocean currents map copied from page 4 of the ESRT and the passage to answer the questions that follow. The Map: Questions: 1. Name the cool current off the West coast
Arizona Department of Transportation
 Arizona Department of Transportation Transportation Planning Division 206 S. 17 th Avenue Mail Drop 3B Phoenix, Arizona 85007.3212 Jane Dee Hull Governor Mary E. Peters Director Mary Lynn Tischer Division
Notepack 41. Aim: What factors determine the climate of a certain area? Do Now: What is the difference between weather and climate?
 Notepack 41 Aim: What factors determine the climate of a certain area? Do Now: What is the difference between weather and climate? WEATHER VS. CLIMATE Weather atmospheric conditions at a certain location
Record-breaking La Niña events
 Record-breaking La Niña events An analysis of the La Niña life cycle and the impacts and significance of the 2010 11 and 2011 12 La Niña events in Australia Contents Introduction At a glance: the impact
Latitude Altitude (Elevation) Proximity to large bodies of water Ocean Currents. larger. concentrated. direct. heating. heating.
 Proximity to large bodies of water Ocean Currents. larger. concentrated. direct. heating. heating.") Climographs Climographs Climographs Roles of Temperature and Precipitation on Climate Roles of Temperature and Precipitation on Climate : Altitude (Elevation) Proximity to large bodies of water Ocean Currents
Climographs Climographs Climographs Roles of Temperature and Precipitation on Climate Roles of Temperature and Precipitation on Climate : Altitude (Elevation) Proximity to large bodies of water Ocean Currents
Vets & Military Support. State Delegate Dues. Inspection Report
 As of: 8/3/2016 QM Bond Trustee Audit Buddy Poppy AZ Cottage Vets & Military Support Inspection Report State Delegate Dues QM Bond Trustee Audit Buddy Poppy AZ Cottage Vets & Military Support Inspection
Tropical Pacific Ocean remains on track for El Niño in 2014
 1 of 10 3/06/2014 3:33 PM ENSO Wrap-Up Current state of the Pacific and Indian Ocean Tropical Pacific Ocean remains on track for El Niño in 2014 Issued on Tuesday 3 June 2014 Product Code IDCKGEWWOO The
The Summer of 2007: A Look at Niagara
 The Summer of 27: A Look at Niagara By Wayne Heinen (maps generated by Piper McKinnon) OVERVIEW The summer of 27 was yet another challenging growing season. One look at the inch-wide cracks in the soil,
Wind is caused by differences in air pressure created by changes in temperature and water vapor content.
 Topic 8: Weather Notes, Continued Workbook Chapter 8 Wind is caused by differences in air pressure created by changes in temperature and water vapor content. Wind blows from high pressure areas to low
Reading and Vocabulary Study Guide
 Reading and Vocabulary Study Guide Boston, Massachusetts Upper Saddle River, New Jersey The map on page 20 is based on a map by DK Cartography. Copyright by Pearson Education, Inc., publishing as Pearson
D) water having a higher specific heat than land B) B C) expansion, cooling to the dewpoint, and condesation
 water having a higher specific heat than land B) B C) expansion, cooling to the dewpoint, and condesation") Base your answers to questions 1 through 4 on the map and the passage below and on your knowledge of Earth science. The map shows four different locations in India, labeled, A, B, C, and D, where vertical
Base your answers to questions 1 through 4 on the map and the passage below and on your knowledge of Earth science. The map shows four different locations in India, labeled, A, B, C, and D, where vertical
You Can Die Here PRACTICE Regents Exam Questions
 You Can Die Here PRACTICE Regents Exam Questions 1. Which diagram best illustrates how air rising over a mountain produces precipitation? (1) (3) (2) (4) 2. As a parcel of air rises, its temperature will
Length of day for a full year. Ocean Gyres. Wet. Adiabatic. lapse rate, starts at. dewpoint Dry Adiabatic lapse rate
 Vernal Equinox March 20, 11:57 AM, CDT Sun will rise exactly in the east and set exactly in the west. All latitudes get 12 hours of day and 12 hours of dark. Length of day for a full year Wet Adiabatic
Weather drivers in Victoria
 August 2008 Weather drivers in Victoria Key facts Major weather drivers in Victoria are: El Niño - Southern Oscillation frontal systems cut-off lows blocking highs Southern Annular Mode cloudbands Figure
Recent changes in temperature and rainfall trends and variability over Bangladesh
 Recent changes in temperature and rainfall trends and variability over Bangladesh Authors: Dewan Abdul Quadir; Catharien Terwisscha van Scheltinga; Fulco Ludwig Bangladesh Delta Plan Project & Toma Rani
1.3: CLIMATE GEOGRAPHY. pgs
 1.3: CLIMATE GEOGRAPHY pgs. 76-89 INTRODUCTION WEATHER: Is the combination of temperature, precipitation, cloud cover and wind that we experience EACH DAY. Example: 22 0 C and clear skies. CLIMATE: The
Monsoon. Arabic word mausim means season. Loose definition: a wind/precipitation pattern that shifts seasonally
 Monsoon Arabic word mausim means season Loose definition: a wind/precipitation pattern that shifts seasonally Classical criteria (Ramage 1971) Prevailing wind shifts 120 o between Jan & July Average frequency
 RECORD WARM AND COLD, WET AND DRY WEATHER January, 1901-1982 Cold periods (Criterion =< Threshold) Warm periods (Criterion => Threshold) (F) days day Year!F) days day Year 10 3 8 1968 30 31 1 1932 20 12
SESSION THREE: FACTORS THAT INFLUENCE WEATHER IN SOUTH AFRICA
 SESSION THREE: FACTORS THAT INFLUENCE WEATHER IN SOUTH AFRICA KEY CONCEPTS: In this section we will focus on the following aspects: Factors determining the weather of South Africa Influence of the oceans
PerformanceTrak News December 2013 and Year End Results January 30, 2014
 PerformanceTrak News December 2013 and Year End Results January 30, 2014 Executive Summary Rounds played concluded down 4.8% for 2013 while the number of days open finished down 6.9% as compared to 2012.
LAB H - ATMOSPHERE AND CLIMATE LAB II STABILITY AND PRECIPITATION PATTERNS
 Introduction LAB H - ATMOSPHERE AND CLIMATE LAB II STABILITY AND PRECIPITATION PATTERNS This lab will provide students with the opportunity to become familiar with the concepts of atmospheric stability
Water Budget I: Precipitation Inputs
 Water Budget I: Precipitation Inputs Forest Cover Global Mean Annual Precipitation (MAP) Biomes and Rainfall Forests won t grow where P < 15 / yr Forest type depends strongly on rainfall quantity, type
Name: Date: Day/Period: CGC1P1: Interactions in the Physical Environment. Factors that Affect Climate
 Name: Date: Day/Period: CGC1P1: Interactions in the Physical Environment PART A: Weather and Climate Factors that Affect Climate 1. The words weather and climate are often incorrectly used interchangeably.
2018 U.S. Senior Open Championship Golf Course Setup Notes Round 1 (Thursday, June 28) Prepared by Ben Kimball, USGA
 Prepared by Ben Kimball, USGA") 2018 U.S. Senior Open Championship Golf Course Setup Notes Round 1 (Thursday, June 28) Prepared by Ben Kimball, USGA Green Speeds approximately 11 feet 7 inches on the Stimpmeter. We achieved this speed
2018 U.S. Senior Open Championship Golf Course Setup Notes Round 1 (Thursday, June 28) Prepared by Ben Kimball, USGA Green Speeds approximately 11 feet 7 inches on the Stimpmeter. We achieved this speed
Water Budget I: Precipitation Inputs
 Water Budget I: Precipitation Inputs Forest Cover Forests and Rainfall Forests won t grow where P < 15 / yr Forest type depends strongly on rainfall quantity, type (snow, rain) and timing (summer, winter)
Cyprus Climate Change Risk Assessment (CCRA)
") Cyprus Climate Change Risk Assessment (CCRA) Αναλυτική περιγραφή των σεναρίων κλιματικής αλλαγής: Αποτελέσματα Δρ. Απόστολος Βουλγαράκης (Imperial College London) & Δρ. Χρήστος Γιαννακόπουλος (Εθνικό Αστεροσκοπείο
Cyprus Climate Change Risk Assessment (CCRA) Αναλυτική περιγραφή των σεναρίων κλιματικής αλλαγής: Αποτελέσματα Δρ. Απόστολος Βουλγαράκης (Imperial College London) & Δρ. Χρήστος Γιαννακόπουλος (Εθνικό Αστεροσκοπείο
Understanding Weather
 Understanding Weather Images Graphic of the atmosphere. Enlarge Cirrus clouds. Enlarge Air masses Air masses are parcels of air that bring distinctive weather features to the country. An air mass is a
March 30, %, Daily were up. open are up. 24.4%, foodd &
 PerformanceTrak News February 20122 Results March 30, 2012 Executive Summary February 2012 rounds were up 14.5% and days open were up 26.8% compared to February 2011, based on paired data. Again this month,
Becky Bolinger NIDIS IMW Drought Early Warning System Webinar November 21, 2017
 NIDIS Intermountain West Dec-Feb Winter Outlook Becky Bolinger NIDIS IMW Drought Early Warning System Webinar November 21, 2017 COLORADO CLIMATE CENTER La Niña Advisory And associated impacts from La Niña
and the Link between Oceans, Atmosphere, and Weather
 Geography Worksheet Instructions Using a map, atlas, or any other materials your teacher suggests, label the following on the blank map provided. 1. Label East, West, North, and South. 2. Label the following
REVIEW AND APPROVAL STATEMENT
 1 REVIEW AND APPROVAL STATEMENT AFCCC/CCD-04/006, National Training Center (NTC), Fort Irwin, California A Full-Year Climatology,has been reviewed and is approved for public release. There is no objection