Arizona Climate Summary
|
|
|
- Ashlie Blair
- 6 years ago
- Views:
Transcription


1 Arizona Climate Summary March 2012 Summary of conditions for February 2012 February 2012 Temperature and Precipitation Summary February 1 st 17 th : February continued where January left off with a high pressure system over the state, and another low pressure system along the Oregon, northern California coast. On the 2 nd, the low pressure system moved across northern Utah, dropping some rain and snow in Utah as well as northern Arizona on the 2 nd and 3 rd. Snow totals were small with 1.2 at Bellemont, 1.0 at the north rim of the Grand Canyon, 1.2 at Canyon de Chelly and 1 at Show Low. Elsewhere in the state temperatures remained near normal. From the 4 th through the 6 th the system was cut-off, over the central plains, and Navajo National Monument got another 1.5 of snow. By the 7 th, high pressure started to build again, but was short-lived as another low pressure system moved inland across northern Mexico. This brought a small pulse of moisture into the southern part of the state, but only Sierra Vista reported rainfall, and they only had 0.03, on the 8 th. Clear skies did prevail from the 9 th through the 11 th as temperatures rose to 5-10 degrees warmer than normal ahead of another low pressure system that moved slowly across the southwest on the 12 th through the 17 th. That system brought widespread rain and snow to the state, though central Arizona missed out on most of it. Safford had 0.87 total, Kingman had 0.52, Casa Grande had 0.36, Bowie had 0.42, Gila Bend had 0.33, Phoenix had zero, Tucson had 0.08, north rim of the Grand Canyon had 7 of snow, Alpine had 2, Heber had 4.5, Flagstaff had 5, and Navajo National Monument had 5.6. All the totals were well below normal for February precipitation. The system kept temperatures down a few degrees below normal. February 18 th 29 th On the 18 th, high pressure started to build over the southwest, but yet another storm system started moving down through Nevada and Utah, with the southern end sweeping across northern Arizona, dropping another 3 of snow in Flagstaff and 5 at the north rim of the Grand Canyon. By the 20 th, the southern end of that system became cut-off off the Baja Coast and ran out of moisture. Clear skies and dry conditions returned as that cut-off low spun out across Mexico, with all precipitation staying well south of Arizona. Over the next five days temperature climbed back to 5-8 degrees above normal statewide. The month finally ended when another strong low pressure system swung through the Pacific Northwest and northern California, across Nevada into Utah and finally across Arizona. This system brought widespread precipitation, but small amounts in most places. Again Phoenix remained dry, though some outlying cities had small amounts of rain. Pinnacle Peak, Picacho Peak, Maricopa, and Payson had 0.01, while Carefree had The north rim of the Grand Canyon had 14 of snow, while Flagstaff had 4.6 and Alpine had 1.5. The storm also brought high winds to all parts of the state. Even though numerous storm systems passed over Arizona, very little precipitation fell except across the northern counties. In This Issue: Overview of February, graphs of the February daily maximum and minimum temperatures, precipitation, mean daily dew points for Flagstaff, Phoenix, and Tucson; February climate statistics, maps of mean monthly maximum and minimum temperatures, precipitation, dew points, wind speeds for February; and graphs of the mean February temperature and precipitation for the period of record for Tucson, Phoenix, and Flagstaff, graphs of the cumulative precipitation for the calendar year for Flagstaff, Phoenix, and Tucson. Climate calendars for Flagstaff, Phoenix, Tucson, Prescott, Winslow and Yuma, including daily and monthly normals and extremes, for each month of the year, can be downloaded directly from the State Climate website. See p. 18 of this report for calendar abbreviations. State Climate Office Dr. Nancy J. Selover, State Climatologist Tel: Arizona State Climate Office School of Geographical Sciences & Urban Planning Arizona State University Tempe, AZ Edited by Nancy J. Selover & Matt Salerno 1
2 Data are preliminary and are from the National Weather Service Forecast Offices in Flagstaff, Phoenix and Tucson. **Note: The discrepancy between the Statewide Temperature and Precipitation values for Phoenix, Flagstaff and Tucson and the daily values in their graphs are due to the reporting times. Statewide Temperature and Precipitation values are taken at 5pm, while official icial daily records at the airports are taken from Midnight to Midnight. February 2012 Daily Temperature, Precipitation, Precipitation & Dew Point for Flagstaff, Phoenix, and Tucson 2
3 3
4 FLAGSTAFF CLIMATE STATISTICS February 2012 February had no significant ranking for temperature and was the 29 th driest on record. Avg Max Temp (F) 44.7 Normal 44.8 Avg Min Temp (F) 19.1 Normal 19.3 Avg Mean Temp (F) 31.9 Normal 32.1 Departure from Normal (F) -0.2 Highest Monthly Avg Temp (F) 38.2 in 1947 Lowest Monthly Avg Temp (F) 19.5 in 1939 Highest Temp this month (F): 57 on 10 th, 22 nd Lowest Temp this month (F): 8 on 16 th, 29 th Record High (F): 71 on 2/26/1986 Record Low (F): -23 on 2/01/1985 No daily temperature or precipitation records this month: Flagstaff Number of Days of: Minimum Temp 10 o or lower 3 Minimum Temp 30 o or higher 2 Maximum Temp 40 o or lower 11 Maximum Temp 50 o or higher 10 Heating Degree Days 954 Normal 923 Cooling Degree Days 0 Normal 0 Degree base 65 o F Total February Precipitation 0.99 Normal February Precipitation 2.16 Departure from normal Greatest 24-Hr Precipitation 0.42 on 2/13-14 Total Precipitation Year-to-Date 1.41 Departure from Normal Number of Days: Clear 19 Partly Cloudy 5 Cloudy 5 Greatest February Precipitation in 1993 Least February Precipitation in 1967 Average Wind Speed Highest Peak Gust 7.0 mph 55 mph from 220 o on 27 th PHOENIX CLIMATE STATISTICS February 2012 February was tied for 20 th warmest and was the 12 th driest on record Avg Max Temp(F) 72.5 Normal 70.7 Avg Min Temp(F) 48.1 Normal 48.7 Avg Mean Temp (F) 60.3 Normal 59.7 Departure from Normal (F) +0.6 Highest Monthly Avg Temp (F) 66.0 in 1991 Lowest Monthly Avg Temp (F) 48.5 in 1939 Highest Temp this month (F): 81 on 11 th, 24 th, 26 th Lowest Temp this month (F): 42 on 15 th Record High (F): 92 on 2/27/1986 2/25/1921 Record Low (F): 24 on 2/08/1933 2/07/ No temperature or precipitation records set this month: Phoenix Number of Days of: Minimum Temp 40 o or lower 0 Minimum Temp 50 o or higher 11 Maximum Temp 70 o or lower 15 Maximum Temp 80 o or higher 4 Heating Degree Days 138 Normal 163 Cooling Degree Days 9 Normal 15 Degree base 65 o F Total February Precipitation Normal February Precipitation 0.92 Departure from normal Greatest 24-Hr Precipitation on 2/27-28
5 Total Precipitation Year-to-Date Departure from Normal Number of Days: Clear 14 Partly Cloudy 15 Cloudy 4 Least February Precipitation 0.00 in 1902, 1910, 1912, 1924, 1967, 1972, 1984, 1989, 2000, 2002, and 2006 Average Wind Speed 5.2 mph Highest Peak Gust 38 mph from 250 o on 28 th Greatest February Precipitation 4.64 in 1962 TUCSON CLIMATE STATISTICS February 2012 February had no significant ranking for temperature and was tied for the 17 th driest on record Avg Max Temp(F) 69.9 Normal 68.5 Avg Min Temp(F) 41.3 Normal 42.2 Avg Mean Temp(F) 55.6 Normal 55.3 Departure from Normal (F) +0.3 Highest Monthly Avg Temp (F) 61.1 in 1957 Lowest Monthly Avg Temp (F) 45.3 in 1903 Highest Temp this month (F): 80 on 11 th Lowest Temp this month (F): 34 on 3 rd Record High (F): 92 on 2/14/1957 Record Low (F): 17 on 2/07/1899 No temperature or precipitation records set this month: Tucson Number of Days of: Minimum Temp 40 o or lower 13 Minimum Temp 50 o or higher 3 Maximum Temp 60 o or lower 3 Maximum Temp 80 o or higher 1 Heating Degree Days 265 Normal 273 Cooling Degree Days 0 Normal 0 Degree base 65 o F Total February Precipitation 0.08 Normal February Precipitation 0.86 Departure from normal Greatest 24-Hr Precipitation 0.07 on 2/13-14 Total Precipitation Year-to-Date 0.22 Departure from Normal Greatest February Precipitation 4.15 in 1905 Least February Precipitation 0.00 in 1895, 1902, 1903, 1910, 1924, 1935, 1972, 1974, 1984, 2006 Number of Days: Clear 25 Partly Cloudy 2 Cloudy 2 Average Wind Speed Highest Peak Gust 6.5 mph 39 mph from 190 o on 27 th Data are from the National Weather Service and the National Climatic Data Center and are preliminary. 5
6 Winds for February: Day Phoenix Flagstaff Tucson (mph) Avg Max Avg Max Avg Max Dew Points for February: Daily Average Dew Point ( o F): Day Phx Tuc Flg
 network operated by the Bureau of Land Management and Forest Service and the")
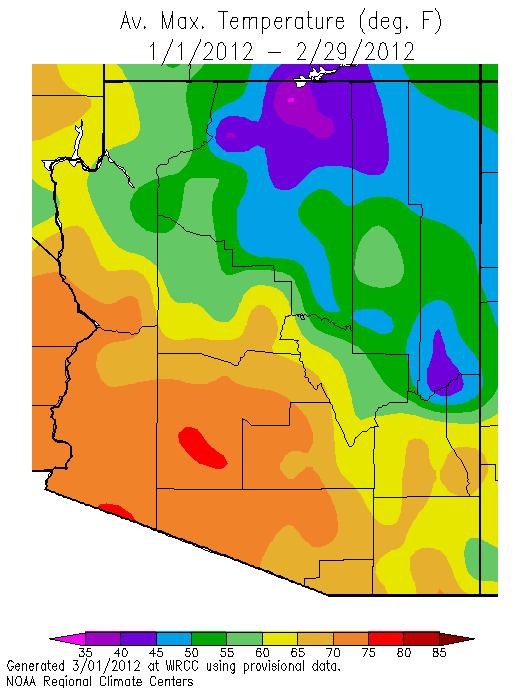
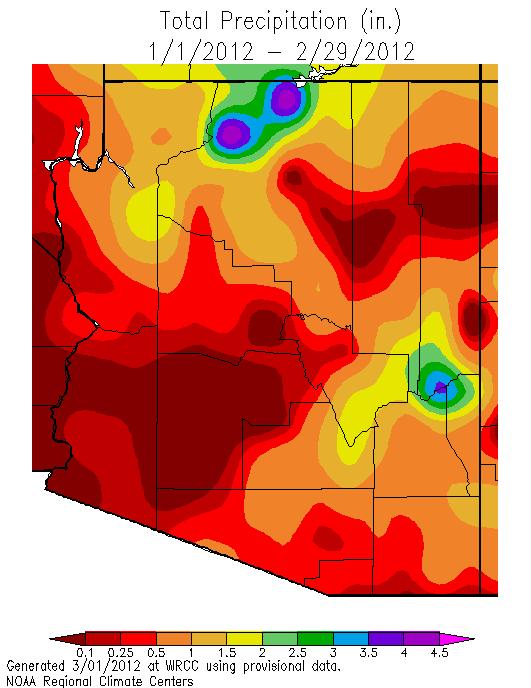
7 February 2012 Temperature, Dew Point, Wind Speed, and Precipitation Maps are based on preliminary data from the National Weather Service, the Arizona Meteorological Network (AZMet), operated by the University of Arizona College of Agriculture Cooperative Extension and the RAWS (Remote Automated Weather Station) network operated by the Bureau of Land Management and Forest Service and the CoCoRaHS (Community Collaborative Rain, Hail and Snow) Network. Average nighttime temperatures ranged from 11 o F at Sunrise Mountain in east central Arizona to 51 o F at Oatman in west central Arizona. Average daytime temperatures ranged from 35 o F at Bright Angel Ranger Station at bottom of the Grand Canyon, to 77 o F at Paloma in the southwest desert. Precipitation values ranged from 0 in many places in the southwest deserts and along the lower Colorado River to 4.29 at Mountain Lion in the White mountains of southern Apache County and 2.62 at Bright Angel. Most of the precipitation fell between the 12 th and 14 th when our major winter storm passed through. 7
8 Average monthly dew points ranged from -15 o F at Bright Angel in the Grand Canyon, to 34 o F at Paloma. Average winds were light, with 13 mph as the highest average at Laughlin-Bullhead City. The highest peak wind gust was 63 mph at Guthrie near the eastern border. This month we have wind barbs to represent the peak winds. The barbs are like arrows with feathers at the end to show the wind speed. The end with the feathers is pointing in the direction the winds blow from, as they blow into the station. One half barb is 5 mph, a full barb is 10 mph, and a pennant is 50 mph. So Guthrie will have one pennant and one full and one half barbs. 8
9 9


10 February minimum temperatures were 0-4 o F warmer than average across much of western and northern Arizona, as well as Pima, Santa Cruz, and western Cochise and Graham counties. Gila, Pinal and eastern Maricopa counties were 0 to 2 degrees warmer than average, as were the White Mountains, western Cochise County and the Flagstaff area. Daytime temperatures were 0 to 2 degrees warmer than average across southern Arizona, as well as the eastern counties and Yuma, La Paz and southern Mohave County. Pockets of colder than normal daytime temperatures covered Coconino County, and southern Yavapai and northwestern Maricopa, and southern Navajo County. Precipitation in February continued to be well below average statewide, with wet exceptions along the northern border and along the southern New Mexico border where precipitation actually reached over 100% of average. 10
11 11


12 Calendar Year 2012 Nighttime temperatures were quite variable around the state with cooler than normal conditions in Yavapai, Mohave, central Navajo and Apache counties, and warmer than normal temperatures in eastern Maricopa, Pinal, Coconino, and Greenlee counties. Daytime temperatures have been warmer than average everywhere except northwestern Maricopa County, northern Coconino County, Greenlee County, and southern Navajo County. Precipitation for the calendar year has been non-existent (less than 25% of average) for most of Arizona, with only the northeast corner of the state receiving more than 70% of average. 12
13 13


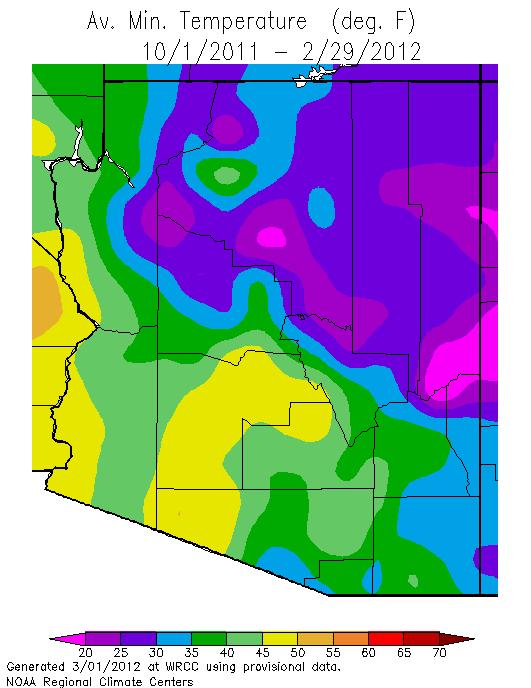
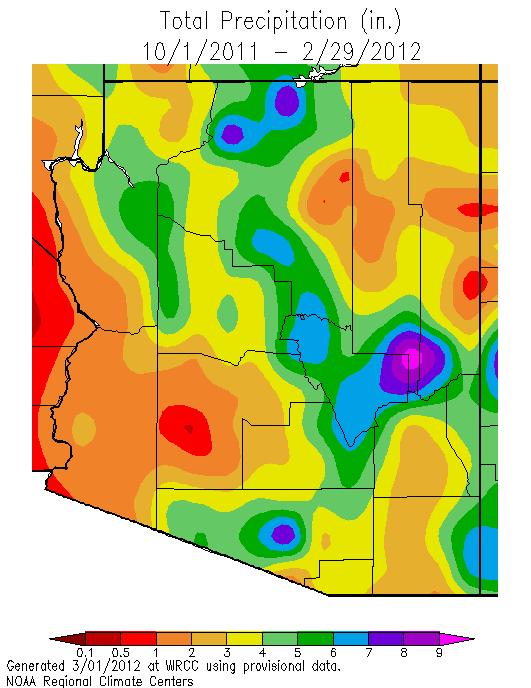
14 Water Year 2012 (Oct Sep ) The new water year, 2012, which began October 1 st, combines the cold, wet conditions of November and December with the warm and dry conditions of January and February. The nighttime lows have been within 2 o F of average across most areas of the state, with much warmer conditions in Maricopa, Pinal, and Gila counties, and moderately warmer in most of Coconino County. Northwestern Mohave and western Yavapai counties have been much colder than normal at night. Daytime high temperatures have been within 2 o F of average, with colder conditions in northwestern Maricopa, southwestern Yavapai, and northern Coconino counties, and warmer conditions in the northeastern and southeastern corners of Arizona. Precipitation for the water year has fallen well below average everywhere except western Pima County and the Yuma area. Most of the state has received less than 70% of average precipitation and northern Apache and western Maricopa counties are below 50% of average. The wet conditions of November and December have given way to very dry conditions since the first of the calendar year. La Niña is weakening and dissipating, so the outlook is for above average temperatures over the next 3 months, but there is no strong indication as to whether precipitation will be below average, average, or above average. 14
15 Temperature (F) February Mean Temperature Graphs Flagstaff, Phoenix, and Tucson : Flagstaff Mean February Temperature (Median 31.4 o F) Year Temperature (F) Phoenix Mean FebruaryTemperature (Median 56.9 o F) Year Temperature (F) Tucson Mean FebruaryTemperature (Median 53.7 o F) Year 15
16 Precipitation (in) Precipitation (in) Precipitation (in) February Mean Precipitation Graphs Flagstaff, Phoenix, and Tucson : February Precipitation Flagstaff (Median 1.63") Year February Precipitation Phoenix (Median 0.56") Year February Precipitation Tucson (Median 0.54") Year 16
17 2012 Cumulative Precipitation Graphs Flagstaff, Phoenix and Tucson: Precipitation is well below average in central and southern Arizona, and slightly drier than average in Flagstaff. 17
18 The downloadable normals and extremes calendars use the following abbreviations: NORM = 30 year ( ) average value (degrees Fahrenheit (F)) OBS = The temperature observation for that day this year AVG = Average daily temperature HI MAX = Highest maximum temperature for that day (F) LO MAX = Lowest maximum temperature for that day (F) LO MIN = Lowest minimum temperature for that day (F) HI MIN = Highest minimum temperature for that day (F) Mx PCP = Maximum precipitation for that day (inches) Mx SNO = Maximum snowfall for that day (inches) 18
Arizona Climate Summary September 2012
 Arizona Climate Summary September 2012 Summary of conditions for August 2012 August 2012 Temperature and Precipitation Summary August 1 st 15 th : During the month of August, at least one location received
Arizona Climate Summary December 2008
 Arizona Climate Summary December 28 Summary of conditions for November 28 November 28 Temperature and Precipitation Summary November 1 st - 11 th : November began with high pressure over the western U.S.,
Environmental Protection The answer my friend is blowing in the wind
 Environmental Protection The answer my friend is blowing in the wind Nolan Doesken Colorado Climate Center Colorado State University Presented at the Pesticide Conference, November 17, 2005, Denver, CO
Drought: What is the Status?
 Drought: What is the Status? Nolan J. Doesken Colorado Climate Center Colorado State University http://ccc.atmos.colostate.edu Presented at 2005 Peak to Prairie Landscape Symposium, February 11, 2005,
Applied Earth Science Climate Exam Practice Questions Page 1
 Name: 1. Which combination of climate factors generally results in the coldest temperatures? A) low elevation and low latitude B) low elevation and high latitude C) high elevation and low latitude D) high
El Niño and the Winter Weather Outlook
 El Niño and the 2015-2016 Winter Weather Outlook 2015 NASEO Annual Meeting http://www.ospo.noaa.gov/products/ocean/sst/anomaly/ NWS Boston February 10, 2015 Jimmy Taeger Meteorologist National Weather
Nolan Doesken. Colorado Climate Center.
 Nolan Doesken Colorado Climate Center Presented to: Colorado Conservation Tillage Association, Greeley, CO, February 1-2, 1 2005 http://ccc.atmos.colostate.edu Prepared by Odie Bliss 1 Key Features of
LAB H - ATMOSPHERE AND CLIMATE LAB II STABILITY AND PRECIPITATION PATTERNS
 Introduction LAB H - ATMOSPHERE AND CLIMATE LAB II STABILITY AND PRECIPITATION PATTERNS This lab will provide students with the opportunity to become familiar with the concepts of atmospheric stability
2. Study Setting. This section describes the study domain, major terrain features, land use, meteorology, and regional air quality and visibility.
 2. Study Setting This section describes the study domain, major terrain features, land use, meteorology, and regional air quality and visibility. 2.1 The Southwestern United States Figure 2-1 shows a terrain
Drought or Not? Nolan J. Doesken Colorado Climate Center Colorado State University
 Drought or Not? Nolan J. Doesken Colorado Climate Center Colorado State University http://ccc.atmos.colostate.edu Presented at Horticultural Art Society meeting, November 19, 2004, Colorado Springs, Colorado
Drought and the Climate of the Ogallala Aquifer
 Drought and the Climate of the Ogallala Aquifer Nolan J. Doesken Colorado Climate Center Colorado State University Presented at Ogallala Symposium, Wray, Colorado February 20, 2006 Prepared by Odie Bliss
The Arkansas Basin Climate Report Part 1 -- Remembering where we ve come from
 The Arkansas Basin Climate Report Part 1 -- Remembering where we ve come from Nolan Doesken State Climatologist (retired) Colorado Climate Center / Colorado Water Institute Colorado State University Arkansas
The Awesome, Wonderful, Beautiful, Exciting and Terrible Climate of the West What a Hoot!
 The Awesome, Wonderful, Beautiful, Exciting and Terrible Climate of the West What a Hoot! Nolan J. Doesken, State Climatologist Colorado Climate Center Presented to Four States Irrigation Council, 54 th
Air Masses and Fronts
 Air Masses and Fronts A huge body of air that has similar temperature, humidity, and air pressure at any given height is called an air mass. A single air mass may spread over millions of square kilometers
Station 1: Ocean Currents Use the ocean currents map copied from page 4 of the ESRT and the passage to answer the questions that follow.
 Station 1: Ocean Currents Use the ocean currents map copied from page 4 of the ESRT and the passage to answer the questions that follow. The Map: Questions: 1. Name the cool current off the West coast
Weather and Climate Impacts on Water Supply
 Weather and Climate Impacts on Water Supply Nolan Doesken Colorado Climate Center Atmospheric Science Department Colorado State University http://ccc.atmos.colostate.edu Presented at the South Platte Forum,
You Can Die Here PRACTICE Regents Exam Questions
 You Can Die Here PRACTICE Regents Exam Questions 1. Which diagram best illustrates how air rising over a mountain produces precipitation? (1) (3) (2) (4) 2. As a parcel of air rises, its temperature will
MONSOONS. Summer Monsoon
 MONSOONS A monsoon is a seasonal change in the direction of the prevailing, or strongest, winds of a region. Monsoons cause wet and dry seasons throughout much of the tropics. Monsoons are most often associated
TEP-UNS Electric Load and Peak Demand Forecast Overview
 TEP-UNS Electric Load and Peak Demand Forecast Overview Jon M. Bowman Senior Supply-Side Planner TEP and UES Resource Planning Workshop 1 Objectives Provide an overview of the load and peak demand forecasts
The State of the Climate Address
 The State of the Climate Address Nolan J. Doesken Colorado Climate Center, Atmospheric Science Dept, Colorado State University Presented to Colorado Water Officials Association, 2005 Annual Meeting, September
CoCoRaHS goes to the Colorado Farm Show
 CoCoRaHS goes to the Colorado Farm Show Nolan J. Doesken Colorado Climate Center, Atmospheric Science Dept, Colorado State University Presented January 25, 2006, Greeley, CO Prepared by Odie Bliss The
Ecology. Professor Andrea Garrison Biology 3A Illustrations 2014 Cengage Learning unless otherwise noted
 Ecology Professor Andrea Garrison Biology 3A Illustrations 2014 Cengage Learning unless otherwise noted Ecology Ecology (oikos = house) is the study of where an organism lives and all the interactions
Weather EOG Review Questions
 Weather EOG Review Questions 1. Which statement best describes runoff? A Water vapor cools off and changes into water droplets. B Water in the form of rain, snow, sleet, or hail falls from clouds. C Precipitation
GROWING SEASON TEMPERATURES
 Ag-Weather Update: Review of Summer Growing Season & Update on the Wet Forecast for Fall & Winter Paul W. Brown Extension Specialist, Biometeorology College of Agriculture & Life Sciences University of
Validation Study of the Lufft Ventus Wind Sensor
 Weather Forecasts Renewable Energies Air and Climate Environmental Information Technology METEOTEST Cooperative Fabrikstrasse 14, CH-3012 Bern Tel. +41 (0)31 307 26 26 Fax +41 (0)31 307 26 10 office@meteotest.ch,
Global Climate Change: Just the Facts
 Global Climate Change: Just the Facts Nolan Doesken State Climatologist, Colorado Climate Center Atmospheric Science Department Colorado State University Presented at Club 20 Fall Meeting, Grand Junction,
9. The Earth's planetary winds are deflected as a result of the Earth's A) revolution around the Sun B) seasonal changes C) rotation on its axis D)
 revolution around the Sun B) seasonal changes C) rotation on its axis D)") 1. Which ocean current transports warm water away from Earth s equatorial region? A) Brazil Current B) Guinea Current C) Falkland Current D) California Current 2. The Gulf Stream and North Atlantic Current
1. Which ocean current transports warm water away from Earth s equatorial region? A) Brazil Current B) Guinea Current C) Falkland Current D) California Current 2. The Gulf Stream and North Atlantic Current
Global Weather Patterns
 Global Weather Patterns AZ State Standards Concept 2: Energy in the Earth System (Both Internal and External) Understand the relationships between the Earth s land masses, oceans, and atmosphere. PO 2.
National Weather Service
 National Weather Service Gulf of California Moisture Surges Gulf of California moisture surges, or simply Gulf Surges, are one of the most researched components of the North American Monsoon. As early
What Causes Different Weather?
 What Causes Different Weather? Table of Contents What causes weather?...3 What causes it to rain or snow?...4 What causes flooding?...5 What causes hail?...6 What causes the seasons?...7-8 What causes
Canada s Natural Systems. Canadian Geography 1202
 Canada s Natural Systems Canadian Geography 1202 Canada s Natural Systems Natural System: A system found in nature Here are the four natural systems that we will explore in the next few weeks 1. Canada
Arizona Department of Transportation
 Arizona Department of Transportation Transportation Planning Division 206 S. 17 th Avenue Mail Drop 3B Phoenix, Arizona 85007.3212 Jane Dee Hull Governor Mary E. Peters Director Mary Lynn Tischer Division
Tuesday, January 11, :11 AM (CST)
") Tuesday, January 11, 2011 11:11 AM (CST) -Assessment of current water conditions - Precipitation Forecast - Recommendations for Drought Monitor Upper Colorado Normal Precipitation Upper Colorado River
Tuesday, January 11, 2011 11:11 AM (CST) -Assessment of current water conditions - Precipitation Forecast - Recommendations for Drought Monitor Upper Colorado Normal Precipitation Upper Colorado River
Colorado Weather and Climate Update
 Colorado Weather and Climate Update Nolan J. Doesken State Climatologist Colorado Climate Center, Atmospheric Science Department, Colorado State University Presented to Colorado Livestock Association,
Nolan Doesken Colorado Climate Center
 Nolan Doesken Colorado Climate Center Presented to: Colorado Cattleman s s Association, Pueblo, CO, June 19, 2006 http://ccc.atmos.colostate.edu Prepared by Odie Bliss 1 Let s s Talk About Precipitation
Name Date L.O: SWBAT explain what breezes, planetary winds, ocean currents & monsoons are.
 Name Date L.O: SWBAT explain what breezes, planetary winds, ocean currents & monsoons are. 1. A cool breeze is blowing toward the land from the ocean on a warm, cloudless summer day. This condition is
Recent Atmospheric and Oceanic Circulation Changes Affecting Winter Weather in North America. Dr. Art Douglas Professor Emeritus Creighton University
 Recent Atmospheric and Oceanic Circulation Changes Affecting Winter Weather in North America Dr. Art Douglas Professor Emeritus Creighton University Outline 1. The 2018 El Nino: A Northern Hemisphere induced
Cal Poly Lands located in San Luis Obispo County experience a collection of idyllic microclimates
 Climate Margot McDonald, College of Architecture and Environmental Design Cal Poly Lands located in San Luis Obispo County experience a collection of idyllic microclimates due to their geographical position
8/29/20098 SAHRA - Watershed Visualization
 Module 3 Narration Southwestern Water Cycle 001.wav 26 sec 002.wav 10 sec 003 wav 17 sec Water on Earth is constantly on the move. Water continually circulates between the surface of Earth and the atmosphere
D) water having a higher specific heat than land B) B C) expansion, cooling to the dewpoint, and condesation
 water having a higher specific heat than land B) B C) expansion, cooling to the dewpoint, and condesation") Base your answers to questions 1 through 4 on the map and the passage below and on your knowledge of Earth science. The map shows four different locations in India, labeled, A, B, C, and D, where vertical
Base your answers to questions 1 through 4 on the map and the passage below and on your knowledge of Earth science. The map shows four different locations in India, labeled, A, B, C, and D, where vertical
Climate of Colorado. Climatography of the United States No. 60 (updated 1/2003) Prepared by
 Prepared by") Climate of Colorado Climatography of the United States No. 60 (updated 1/2003) Prepared by Nolan J. Doesken, Roger A. Pielke, Sr., and Odilia A.P. Bliss Colorado Climate Center, Atmospheric Science Department,
Climate of Colorado Climatography of the United States No. 60 (updated 1/2003) Prepared by Nolan J. Doesken, Roger A. Pielke, Sr., and Odilia A.P. Bliss Colorado Climate Center, Atmospheric Science Department,
CLIMATE OF WASHINGTON
 1 of 7 3/19/2008 11:37 AM CLIMATE OF WASHINGTON TOPOGRAPHIC FEATURES The location of the State of Washington on the windward coast in mid-latitudes is such that the climatic elements combine to produce
GEOS 513 ENSO: Past, Present and Future
 GEOS 513 ENSO: Past, Present and Future Jessica Conroy Department of Geosciences Stephen W. Bieda, III Department of Atmospheric Sciences February 22, 2006: Regional Teleconnections (Observations) References:
Tropical Pacific Ocean remains on track for El Niño in 2014
 1 of 10 3/06/2014 3:33 PM ENSO Wrap-Up Current state of the Pacific and Indian Ocean Tropical Pacific Ocean remains on track for El Niño in 2014 Issued on Tuesday 3 June 2014 Product Code IDCKGEWWOO The
Lecture 13 March 24, 2010, Wednesday. Atmospheric Pressure & Wind: Part 4
 Lecture 13 March 24, 2010, Wednesday Atmospheric Pressure & Wind: Part 4 Synoptic scale winds Mesoscale winds Microscale winds Air-sea interactions The largest synoptic scale wind. Monsoon: Arabic for
National Weather Service
 National Weather Service The North American Monsoon Until the late 1970s, there was serious debate about whether a monsoon truly existed in North America. However, considerable research, which culminated
Basketball (Girls) AIA Initial Division Placements , Appeal Deadline Monday, Feb. 2, 2015 at 2 p.m.
 AIA Initial Division Placements , Appeal Deadline Monday, Feb. 2, 2015 at 2 p.m.") Basketball (Girls) AIA Initial Division Placements 2015 2018, Appeal Deadline Monday, Feb. 2, 2015 at 2 p.m. The following pages show the initial division placements. To get an understanding of how the
Basketball (Girls) AIA Initial Division Placements 2015 2018, Appeal Deadline Monday, Feb. 2, 2015 at 2 p.m. The following pages show the initial division placements. To get an understanding of how the
First of all, you should know that weather and climate are not the same thing.
 First of all, you should know that weather and climate are not the same thing. WEATHER IS: Short term Limited area Can change rapidly Difficult to predict WEATHER is what s happening outside your window
A Snapshot of Our Changing Climatology
 A Snapshot of Our Changing Climatology Dr. Kenneth ( Kenny ) Blumenfeld Sr. Climatologist DNR State Climatology Office 11/17/2018 1 Items to bear in mind 1. Climate news elsewhere may not apply here 2.
Becky Bolinger NIDIS IMW Drought Early Warning System Webinar November 21, 2017
 NIDIS Intermountain West Dec-Feb Winter Outlook Becky Bolinger NIDIS IMW Drought Early Warning System Webinar November 21, 2017 COLORADO CLIMATE CENTER La Niña Advisory And associated impacts from La Niña
Bell Work. Compare and contrast warm fronts and cold fronts. What type of weather is associated with a high pressure and low pressure systems?
 Daily Routine Sit in your appropriate seat quietly Have all necessary materials out All back packs on the floor All cell phones on silent and away in backpacks All music devices off and headphones out
Climate briefing. Wellington region, February Alex Pezza and Mike Thompson Environmental Science Department
 Climate briefing Wellington region, February 2016 Alex Pezza and Mike Thompson Environmental Science Department For more information, contact the Greater Wellington Regional Council: Wellington PO Box
ALL TEMPERATURE VARIABLES MEGA PACKET
 NAME: MEGA PACKET 1. The map below shows a portion of the western United States and Canada. Two cities in Canada, Vancouver and Winnipeg, are labeled on the map. Which graph best represents the average
Fluid Circulation (Student Mastery Objectives) -The most frequent type of heat transfer of energy in the atmosphere is convection.
 -The most frequent type of heat transfer of energy in the atmosphere is convection.") Fluid Circulation (Student Mastery Objectives) -The most frequent type of heat transfer of energy in the atmosphere is convection. -Differences in density affect the circulation of fluids. Cold air is
Fluid Circulation (Student Mastery Objectives) -The most frequent type of heat transfer of energy in the atmosphere is convection. -Differences in density affect the circulation of fluids. Cold air is
Name: Date: Day/Period: CGC1P1: Interactions in the Physical Environment. Factors that Affect Climate
 Name: Date: Day/Period: CGC1P1: Interactions in the Physical Environment PART A: Weather and Climate Factors that Affect Climate 1. The words weather and climate are often incorrectly used interchangeably.
Basketball (Boys) AIA Initial Division Placements , Appeal Deadline Monday, Feb. 2, 2015 at 2 p.m.
 AIA Initial Division Placements , Appeal Deadline Monday, Feb. 2, 2015 at 2 p.m.") Basketball (Boys) AIA Initial Division Placements 2015 2018, Appeal Deadline Monday, Feb. 2, 2015 at 2 p.m. The following pages show the initial division placements. To get an understanding of how the
Basketball (Boys) AIA Initial Division Placements 2015 2018, Appeal Deadline Monday, Feb. 2, 2015 at 2 p.m. The following pages show the initial division placements. To get an understanding of how the
sulting NOAA Richmond NOAA Richmond Station
 NOAA Richmond NOAA Richmond Station This station is located at the Chevron pier and is operated by the NOAA. It provides wind data as well as tide data. The winds never reached 40 knots The winds did not
Module 2 Narration What is a watershed?
 Module 2 Narration What is a watershed? Timing Key Narrative Snapshots a) 00:10 Every living thing relies on water to exist. But where does our water come from? The most natural place to look is upstream
THE RETREAT AT THE AERIE
 THE RETREAT AT THE AERIE EXCLUSIVE LISTING SEDONA, ARIZONA Capri Barney cbarney@landadvisors.com 4900 North Scottsdale Road, Suite 3000, Scottsdale, Arizona 85251 ph. 928.445.4457 www.landadvisors.com
1.3: CLIMATE GEOGRAPHY. pgs
 1.3: CLIMATE GEOGRAPHY pgs. 76-89 INTRODUCTION WEATHER: Is the combination of temperature, precipitation, cloud cover and wind that we experience EACH DAY. Example: 22 0 C and clear skies. CLIMATE: The
THE RETREAT AT THE AERIE
 THE RETREAT AT THE AERIE EXCLUSIVE LISTING SEDONA, ARIZONA Capri Barney cbarney@landadvisors.com 4900 North Scottsdale Road, Suite 3000, Scottsdale, Arizona 85251 ph. 928.445.4457 www.landadvisors.com
Intermountain West Climate Summary
 Intermountain West Climate Summary A product of The Western Water Assessment Issued October 2010 Vol. 6, Issue 6 ENSO and Intermountain West Water Supply: A Review of Water Year 2010 and Outlook for Water
Monsoon. Arabic word mausim means season. Loose definition: a wind/precipitation pattern that shifts seasonally
 Monsoon Arabic word mausim means season Loose definition: a wind/precipitation pattern that shifts seasonally Classical criteria (Ramage 1971) Prevailing wind shifts 120 o between Jan & July Average frequency
Latitude Altitude (Elevation) Proximity to large bodies of water Ocean Currents. larger. concentrated. direct. heating. heating.
 Proximity to large bodies of water Ocean Currents. larger. concentrated. direct. heating. heating.") Climographs Climographs Climographs Roles of Temperature and Precipitation on Climate Roles of Temperature and Precipitation on Climate : Altitude (Elevation) Proximity to large bodies of water Ocean Currents
Climographs Climographs Climographs Roles of Temperature and Precipitation on Climate Roles of Temperature and Precipitation on Climate : Altitude (Elevation) Proximity to large bodies of water Ocean Currents
and the Link between Oceans, Atmosphere, and Weather
 Geography Worksheet Instructions Using a map, atlas, or any other materials your teacher suggests, label the following on the blank map provided. 1. Label East, West, North, and South. 2. Label the following
Climate Issues A State s s Perspective
 Climate Issues A State s s Perspective Nolan J. Doesken Colorado State Climatologist, President Elect AASC Colorado Climate Center, Colorado State University FYO8 Central Regional MIC/HIC Conference, Kansas
COASTAL UPWELLING - MONTEREY BAY CALIFORNIA (modified from The Maury Project, AMS)
") Name: Date: Per: COASTAL UPWELLING - MONTEREY BAY CALIFORNIA (modified from The Maury Project, AMS) The ocean is composed of 3 distinct layers: the shallow surface mixed zone, the transition zone, and
Name: Date: Per: COASTAL UPWELLING - MONTEREY BAY CALIFORNIA (modified from The Maury Project, AMS) The ocean is composed of 3 distinct layers: the shallow surface mixed zone, the transition zone, and
Final Report August 2005
 2.0 REGIONAL STUDY AREA 2.1 Regional Setting 2.1.1 Topography The Los Angeles Region is located within the western portion of the Transverse Ranges Geomorphic Province. The San Andreas transform fault
9-1: What Causes Climate. 6 th Grade Earth Science
 6 th Grade Earth Science What is Climate? 9-1: What Causes Climate Climate is the long-term average conditions of temperature, precipitation, winds, and clouds in an area. Examples of Climate The Mojave
REVIEW AND APPROVAL STATEMENT
 1 REVIEW AND APPROVAL STATEMENT AFCCC/CCD-04/006, National Training Center (NTC), Fort Irwin, California A Full-Year Climatology,has been reviewed and is approved for public release. There is no objection
REMINDERS: UPCOMING REVIEW SESSIONS: - Thursday, Feb 27, 6:30-8:00pm in HSS 1330
 REMINDERS: Midterm 2: Friday, February 28 - lecture material covering chapters 6, 7, and 15 (since first midterm and through Wed lecture) - same Format as first midterm UPCOMING REVIEW SESSIONS: - Thursday,
WEATHER SYSTEMS OF MIDDLE LATITUDES
 CHAPTER 10 WEATHER SYSTEMS OF MIDDLE LATITUDES MULTIPLE CHOICE QUESTIONS 1. In equal volumes, which one of the following air masses exerts the highest surface air pressure? a. cp *b. A c. mp d. ct e. mt
 A Brief Analysis of the Impact of the El Niño Southern Oscillation (ENSO) Cycle In specific areas around East Timor In the Climate Change section of Seeds of Life, we believe it would be beneficial for
ELA & Science Grades 4 nd to 9 th Created by Piyush & Ilaxi
 ELA & Science Grades 4 nd to 9 th Created by Piyush & Ilaxi 2014 Brilliant Classes by Piyush Page 1 Directions to use Climate Scavenger Hunt Purpose : At the end of this scavenger hunt on climate students
LAB H - ATMOSPHERE AND CLIMATE LAB II STABILITY AND PRECIPITATION PATTERNS
 Introduction LAB H - ATMOSPHERE AND CLIMATE LAB II STABILITY AND PRECIPITATION PATTERNS This lab will provide students with the opportunity to become familiar with the concepts of atmospheric stability
Chart Discussion: Fri-15-Jun-2018 Rainfall Last Week
 Chart Discussion: Fri-15-Jun-2018 Rainfall Last Week 1 Last Week s Charts 2 Last Week s Melbourne Wind Forecasts Forecast 3 PM WIND for 1,2,3,4,5,6,7,8,9,10 Days Ahead [ACCESS model] 1- Jun- 18 SSE SSE
Social Studies CHAPTER 2: PART 2 CLIMATE AND WEATHER
 Social Studies CHAPTER 2: PART 2 CLIMATE AND WEATHER Climate Weather and Identity Climate and weather have a large influence on how Canadians build their identity. We will study the factors that contribute
Drought! When Do We Know It s Over?
 Drought! When Do We Know It s Over? Nolan J. Doesken Colorado Climate Center Colorado State University http://ccc.atmos.colostate.edu Presented at the 2004 Peak to Prairie Landscape Symposium, February
ENSO Wrap-Up. Current state of the Pacific and Indian Ocean
 18-11-2014 ENSO Wrap-Up Current state of the Pacific and Indian Ocean Tropical Pacific Ocean moves closer to El Niño The Pacific Ocean has shown some renewed signs of El Niño development in recent weeks.
 To: The Membership, An Overview of the Duties of the State Convention Committee: 1. Main Purpose; A. To secure a venue to accommodate rooms for 200+ guests for the 5 days of the Convention, at an affordable
Local Winds & Microclimates. Unit 2- Module 1
 Local Winds & Microclimates Unit 2- Module 1 Objectives Overview of local winds (sea & land breezes, valley winds) Overview of microclimates (valley, urban, woodland) Local Winds Local Winds Local winds
Weather drivers in Victoria
 August 2008 Weather drivers in Victoria Key facts Major weather drivers in Victoria are: El Niño - Southern Oscillation frontal systems cut-off lows blocking highs Southern Annular Mode cloudbands Figure
Your web browser (Safari 7) is out of date. For more security, comfort and the best experience on this site: Update your browser Ignore
 is out of date. For more security, comfort and the best experience on this site: Update your browser Ignore") Your web browser (Safari 7) is out of date. For more security, comfort and the best experience on this site: Update your browser Ignore L A NIÑA El Niño-Southern Oscillation (ENSO) For the complete encyclopedic
Your web browser (Safari 7) is out of date. For more security, comfort and the best experience on this site: Update your browser Ignore L A NIÑA El Niño-Southern Oscillation (ENSO) For the complete encyclopedic
Table of Contents. LETTER TO THE GOVERNOR ARIZONA RACING COMMISSION 1 DEPARTMENT OF RACING Department Organization Chart 2
 ARIZONA DEPARTMENT OF RACING ANNUAL REPORT FY-2009 Table of Contents LETTER TO THE GOVERNOR ARIZONA RACING COMMISSION 1 DEPARTMENT OF RACING Department Organization Chart 2 RACING REGULATION Investigations
California By Michael Stahl
 California California By Michael Stahl California is the third largest state in America. Only Texas and Alaska have greater areas of landmass than California. However, the Golden State, as it is sometimes
Climate Scavenger Hunt
 Climate Scavenger Hunt ELA & Science Grades 4nd to 9th Created by Piyush & Ilaxi Directions to use Climate Scavenger Hunt Purpose : At the end of this scavenger hunt on climate students will be able to
Historical and Current Climate in the Rio Grande National Forest Area. Peter Goble Nolan Doesken 10/19/2016
 Historical and Current Climate in the Rio Grande National Forest Area Peter Goble Nolan Doesken 10/19/2016 Geographic Orientation Geographic Orientation Geographic Orientation Rio Grande National Forest
The student will be expected to demonstrate an understanding of the cause of winds and how winds affect climate.
 The student will be expected to demonstrate an understanding of the cause of winds and how winds affect climate. In this lesson you will: 2.3.1 Define the term prevailing winds. (k) 2.3.3 State the impact
Equatorial upwelling. Example of regional winds of small scale
 Example of regional winds of small scale Sea and land breezes Note on Fig. 8.11. Shows the case for southern hemisphere! Coastal upwelling and downwelling. Upwelling is caused by along shore winds, that
Record-breaking La Niña events
 Record-breaking La Niña events An analysis of the La Niña life cycle and the impacts and significance of the 2010 11 and 2011 12 La Niña events in Australia Contents Introduction At a glance: the impact
Pacific Climate Variability
 Pacific Climate Variability Pacific Islands Climate Education Partnership You may have heard the term climate variability. What does the term climate variability mean? What are the causes and effects of
Kodiak, Alaska Site 1 Wind Resource Report
 Kodiak, Alaska Site 1 Wind Resource Report Report written by: Douglas Vaught, P.E., V3 Energy LLC, Eagle River, AK Date of report: March 16, 2007 Photo by Doug Vaught, V3 Energy LLC Summary Information
UPDATE OF REGIONAL WEATHER AND SMOKE HAZE NOVEMBER 2015
 UPDATE OF REGIONAL WEATHER AND SMOKE HAZE NOVEMBER 2015 1. Review of Regional Weather Conditions in October 2015 1.1 The Southwest Monsoon conditions continued to prevail for most of October 2015 before
Design Criteria Data
 MEMPHIS TN Latitude = 35.35 N WMO No. 723345 Longitude = 89.87 W Elevation = 322 feet Period of Record = 1973 to 1996 Average Pressure = 29.68 inches Hg Design Criteria Data Mean Coincident (Average) Values
Design Criteria Data
 FRESNO CA Latitude = 36.77 N WMO No. 72389 Longitude =119.7 W Elevation = 328 feet Period of Record = 1972 to 1996 Average Pressure = 29.62 inches Hg Design Criteria Data Mean Coincident (Average) Values
The Summer of 2007: A Look at Niagara
 The Summer of 27: A Look at Niagara By Wayne Heinen (maps generated by Piper McKinnon) OVERVIEW The summer of 27 was yet another challenging growing season. One look at the inch-wide cracks in the soil,
Chapter 8 Air Masses
 Chapter 8 Air Masses Air Masses - 1 1. An Air Mass is a large body of air usually about 1500 km across and several km thick, that has homogeneous physical properties. 2. The important physical properties
Meteorology of Monteverde, Costa Rica 2007
 Meteorology of Monteverde, Costa Rica 2007 Technical Report submitted to the Monteverde Institute Andrew J. Guswa, Associate Professor, Picker Engineering Program Amy L. Rhodes, Associate Professor, Department
V. SEA and LAND BREEZES:
 V. SEA and LAND BREEZES: A. Pressure largely reflects the weight of overlying air, owing to gravity, and is proportional to mass. Therefore pressure decreases with height. 1. Remember, surface pressure
Subject Property SOUTHWEST. Mohave Crossroads. Approximate alignment of proposed Road and new Bridge. y a. w P e u
 Approximate alignment of proposed Road and new Bridge y a w ark P ad e llh u B Subject Property Mohave Crossroads Commercial Center Bed Bath & Beyond 99 Ross Pet Smart Target Kohl s CVS Starbuck s Bullhead