T Table of Contents Crash Summary by Year and Condition Existing Travel Demand Characteristics... 43
|
|
|
- Gwenda Stewart
- 5 years ago
- Views:
Transcription
1
2 T Table of Contents Introduction Report Purpose... 1 Existing Conditions Introduction to the Study Corridor Summary of Transportation Plans Land Use Existing Land Use Future Land Use Population and Demographics Existing Transportation Infrastructure Roadway Characteristics Right-of-Way Typical Section Intersection Geometry Bicycle and Pedestrian Infrastructure Signage, Markings, Design & Posted Speed, Traffic Volumes, & School Zones Spot Speed Study Lighting Transit Service and Infrastructure Overview of LYNX Transit Service Transit Stops Transit Stop Infrastructure Safety and Crash Analysis Crash Summary by Year and Condition Existing Travel Demand Characteristics Existing Traffic Volumes Pedestrian and Bicycle Traffic Volumes Existing Corridor Operations Summary Access Management Next Steps June 2016 Table of Contents i
3 Table No. Description Page Table 1: Population Characteristics... 6 Table 2: Socioeconomic Characteristics... 7 Table 3: Condition of Pedestrian Facilities Table 4: Crosswalk Locations Table 5: AM Gap-Size Study Summary Table 6: PM Gap-Size Study Summary Table 7: Spot Speed Study Summary Table 8: Summary of Luminosity Measurements at Signalized Intersections Table 9: Summary of Luminosity Measurements at Midblock Crossings Table 10: Summary of Luminosity Measurements at Bus Stops Table 11: LYNX Routes Summary Table 12: LYNX Bus Stops Ridership Summary Table 13: LYNX Bus Stops Features Table 14: Crash Data Summary by Year (Jan 2013 Dec 2015) Table 15: Summary of Crashes by Harmful Event Table 16: Summary of Ped/Bike Crashes (Jan Dec 2015) Table 17: Summary of Crashes by Age Table 18: 72-Hour Traffic Volumes Counts Table 19: Pedestrian and Bicycle Traffic Volumes at Midblock Crossings Table 20: Pedestrian and Bicycle Traffic Volumes at Signalized Intersections Table 21: Pedestrian and Bicycle Counts Table 22: Existing Intersection Multimodal LOS - AM Peak Hour Table 23: Existing Intersection Multimodal LOS Mid-day Peak Hour Table 24: Existing Intersection Multimodal LOS PM Peak Hour Table 25: Pedestrian LOS at Mid-block Crossing Locations Figure No. Description Page Figure 1: Project Location Map... 2 Figure 2: Future Land Use Map... 5 Figure 3: Corridor Features... 9 Figure 4: Typical Sections Figure 5: Intersection Geometry Figure 6: Signage and Markings Figure 7: Luminosity Measurement Locations Figure 8: Bus Routes and Stops Figure 9: Bus Stops Boarding and Alighting Figure 10: Crash Locations and Types Figure 11: Traffic Count Locations Figure 12: Turning Movement Counts Figure 13: Pedestrian and Bicycle Counts Figure 14: Existing 2016 Intersection Operations Figure 15: Driveway Spacing Figure 16: Intersection and Median Spacing ii Table of Contents
4 List of Appendices Appendix A: SW Trails Map Appendix B: Signage Inventory Appendix C: Detailed Transit Routes Appendix D: Field Review Photos Appendix E: Crash Data Appendix F: Traffic, Bicycle and Pedestrian Volume Counts Appendix G: Synchro Reports Appendix H: Signal Timings and Seasonal Factors Table of Contents iii
5 1 Introduction 1.1 Report Purpose Orange County is conducting a Pedestrian/Bicycle Safety Study along Oak Ridge Road from Millenia Boulevard to Orange Blossom Trail (US 441). Figure 1 illustrates the project corridor study limits. This corridor is located within Orange County Commissioner Victoria P. Siplin s District 6, and has been identified as a roadway with a significant number of pedestrian and bicycle crashes. In addition, there are a variety of land uses along the corridor including multiple schools, residential, retail, religious and office land uses, as well as heavily used transit routes, which necessitate that the corridor be truly accessible by all travel modes. The Oak Ridge Road Pedestrian/Bicycle Safety Study is a comprehensive review of the Oak Ridge Road corridor conducted to provide a safe integration of walking and riding bicycles with other modes of transportation. A major component of the study will be to update the previous Pedestrian/Bicycle Study for Oak Ridge Road (completed in August 2013), for the conversion of the corridor to a divided roadway with a raised center median. The study includes detailed data collection, analysis of the data, public outreach, cost estimates, and recommended improvements. The purpose of this Existing Conditions Report is to document the existing facilities, conditions, and previous studies conducted relevant to Oak Ridge Road. Existing Conditions 1

6 \\vhb\proj\orlando\ OC Oak Ridge BikePecf\graphics\FIGURES... - Study Corridor ~.. o:hb ~". rj ORANGE COUN'IY GOVERNMENT FLORI D A Figure 1 Project Location Mop Oak Ridge Road Pedestrian/ Bicycle Safety Study Existing Conditions Report source: Google Maps
7 2 Existing Conditions 2.1 Introduction to the Study Corridor The Oak Ridge Road study corridor is a 3 mile section, beginning at Millenia Boulevard at the western end and terminating at Orange Blossom Trail (US 441) to the east. Oak Ridge Road serves as a major east west route between the International Drive area and eastern Orlando. The corridor provides relief, and can serve as an alternative, to Sand Lake Road and Conroy Road. Oak Ridge Road is generally a five lane arterial with two travel lanes in each direction, separated by either a two way left turn lane (TWLTL) along the majority of the corridor and a raised median at the pedestrian midblock crossings. There are 18 pedestrian crossing locations along the corridor, including seven signalized intersections and 11 mid block locations. The character of the corridor is residential and commercial in nature. The eastern end of the corridor contains primarily commercial and industrial uses with some residential. The middle and western sections of the corridor are primarily residential, with some supportive commercial and religious/institutional uses throughout. In terms of multi modal facilities, there are continuous sidewalks along both sides of the corridor and no marked bicycle lanes. Transit is managed by LYNX, which operates four routes along the corridor, and two routes that pass through the John Young Parkway intersection. Transit stops are typically identified with signage, and in many cases, include shelters and benches. The remainder of this chapter covers the following topics: Summary of Transportation Plans Land Use Population and Demographics Existing Transportation Infrastructure (Roadway, Bike/Pedestrian, Transit) Transit Service and Infrastructure Safety and Crash Analysis Existing Travel Demand Characteristics Access Management Existing Conditions 3
8 2.2 Summary of Transportation Plans A review of various transportation plans was performed to identify planned improvements throughout the study area. The results of the review are included in a separate Technical Memorandum #2 (TM #2). 2.3 Land Use Existing and future land use patterns along the Oak Ridge Road corridor are important factors to consider when evaluating transportation improvements. This section documents the analysis of the land uses within the Oak Ridge Road study area, supplemented by field visits Existing Land Use Oak Ridge Road traverses a highly urban environment with significant pedestrian generators along the study corridor, including numerous single and multi family residential developments, interspersed with religious institutions, educational facilities and businesses, including commercial enterprises, shops, convenience stores and gas stations at the major signalized intersections. There are also several schools and three major churches within three miles of each other that greatly contribute to the pedestrian activity along the corridor, including the following: Sadler Elementary School, which is located on Oak Ridge Road at Kingsgate Drive Westridge Middle School, which is located on Oak Ridge Road at PGA Boulevard, approximately 1,500 east of Sadler Elementary School Shingle Creek Elementary School, which is located at the end of Harcourt Avenue, slightly less than one mile northwest of Sadler Elementary School Palmetto Elementary School, which is located approximately a half mile north of Oak Ridge Road east of Texas Avenue Oak Ridge High School, which is located on Oak Ridge Road at Winegard Road, approximately half mile east of Orange Blossom Trail Assembly of God Church, which is located east of Shingle Creek on Oak Ridge Road Iglesia El Calvario, which is located east of Chancellor Drive on Oak Ridge Road BAPS Shri Swaminarayan Mandir (Hindu Church), which is located west of Orange Blossom Trail on the north side of Oak Ridge Road Another significant pedestrian generator is the Orange Technical College Mid Florida Campus, which is located at the southeast corner of John Young Parkway, on the south side of Oak Ridge Road Future Land Use The Future Land Uses (FLUs) assigned to the study area are generally consistent with the existing land uses, and are depicted in Figure 2. The FLU pattern is generally residential, with some commercial and institutional, and a large industrial area south of the corridor. 4 Existing Conditions
9 Oak \\vhb\proj\orlando\ OC Oak Ridge BikePed\graphics\FIGURES City of Edgewood Millenia Blvd. Harcourt Ave. Fairlawn Dr. Kingsgate Dr. Wingate Dr. John Young Pkwy. Dr. Manor Hill Harcourt Ave. Chancellor Dr. Texas Ave. Rio Grande Ave. Orange Blossom Trail Makoma Dr. Tomoka Dr. Ave. Brookgreen Lake Ellenor Dr. Oak Ridge Road Study Area - Future Land Use Map Corridor Study Area Industrial Office OrlandoCityLimits Water Bodies Conservation Institutional Planned Development Commercial Mixed Use Corridor Public/Recreational & Institutional (City) Low Density Residential Medium Density Residential ± Figure 2 Future Land Use Map Oak Ridge Road Pedestrian/Bicycle Safety Study Existing Conditions Report Source: Orange County Property Appraiser City of Orlando
10 2.4 Population and Demographics This section provides an overview of the transportation related demographics using data collected from the 2010 US Census and the 2014 American Community Survey. As detailed in the following sections, significant portions of the study area are characterized by low income and transit dependent households that rely on other modes of travel besides personal automobile. The demographic information presented is for the Oak Ridge Census Designated Place (CDP) Population Characteristics An overview of the Oak Ridge Road study area population characteristics is provided in Table 1. Table 1: Population Characteristics Population Characteristic Study Area Total Population 22,685 Population Density (Persons per Acre) 9.56 Total Households 7,379 Average Household Size 3.07 Household Density (Households per Acre) 3.12 Households with Children Under Age % Median Age 31 Population Over % White 38.8% Black or African American 40.0% Asian 4.3% Other 12.9% Two or More Races 4.7% Hispanic or Latino (of any race) 44.0% Language at Home English Only 36.2% Spanish 37.7% Other Indo European languages % Asian and Pacific Islander 3.0% Other languages 0.2% School Enrollment (Age 3 and Over Enrolled) 5,477 Nursery School 4.4% Kindergarten 3.8% Elementary/Middle School 42.3% (grades 1 8) High School (grades 9 12) 23.4% 6 Existing Conditions
11 Population Characteristic Study Area College or graduate 26.1% Percent Population with a Disability Total Population 10.2% Under 18 Years 3.6% 18 to 65 Years 8.7% 65 years and over 46.3% Source: 2010 U.S. Census and American Community Survey 5 Year Estimates 1. Includes Creole languages Key highlights from Table 1 include the following: There is a high percentage of households with children under the age of 18 (over 43%) Greater than 10% of the population in the Oak Ridge area has some form of disability o This percentage rises to 46.3% for adults age 65 or over There is a large Hispanic population (44%) with Spanish as the primary language spoken at home (37.7%) Socioeconomic Data Socioeconomic (SE) data was obtained from the 2010 US Census and the 2014 American Community Survey. Table 2 provides an overview of the SE characteristics. Table 2: Socioeconomic Characteristics SE Characteristic Study Area Median Household Income $30,679 Households Below Poverty Level 28.0% Total Housing Units 8,201 Owner Occupied 31.0% Renter Occupied 59.0% Vacant 10.0% Households with No Vehicles 14.1% Source: American Community Survey 5 Year Estimates The low median household income and high poverty rate (28%), indicate that there may be a high percentage of the population that rely on public transportation, walking and bicycling as a primary mode of transportation. Consistent with this, there is a significant percentage of households that do not own a vehicle (greater than 14%). Existing Conditions 7
12 2.5 Existing Transportation Infrastructure This section includes an evaluation of the physical conditions of the corridor. Figure 3 Illustrates the overall corridor features and pedestrian facilities along the study corridor. The existing physical features were collected through field inspection, aerial photography, data provided by Orange County and previous plans/studies. This information is intended to identify current roadway design issues and aid in identifying study area roadway segments and intersections requiring closer examination as part of the future recommendations for the corridor. This section also documents transit, bicycle and pedestrian mobility along the study area corridor. 8 Existing Conditions
![\\vhb\proj\orlando\62529.24 OC Oak Ridge BikePed\graphics\FIGURES g -Driveway Access [I I] g -Midblock Crosswalk C -Sidewalk -Signalized lntersetion -Lighting cc LI.I z... ::c u!;( ::e cc LI.](/docs-images/85/92244114/images/13-0.jpg "I z :::; ::c u!;( ::e co LI.I z :::; ::c u!;( ::e ~thb.")
13 \\vhb\proj\orlando\ OC Oak Ridge BikePed\graphics\FIGURES g -Driveway Access [I I] g -Midblock Crosswalk C -Sidewalk -Signalized lntersetion -Lighting cc LI.I z... ::c u!;( ::e cc LI.I z :::; ::c u!;( ::e co LI.I z :::; ::c u!;( ::e ~thb. rj ORANGE COUN'IY GOVERNMENT FLORI D A Figure 3-1 Corridor Features and Pedestrian Facilities Oak Ridge Road Pedestrian/ Bicycle Safety Study Existing Conditions Report Source: FDOT Aerial Pwhoto Look-Up System/ Field Observat ions by VH B

14 \\vhb\proj\orlando\ OC Oak Ridge BikePed\graphics\FIGURES g C -Driveway Access [I I) -Midblock Crosswa lk ~ - Lighting -Sidewalk - Signalized lntersetion u w z :::i ::c u ~ :.:!!: c w z :::i ::c u ~ :.:!!: C ORANGE ~thb. Co~rr GOVERNMENT fl L 0 R I ll A Figure 3-2 Corridor Features and Pedestrian Facilities Oak Ridge Road Pedestrian/ Bicycle Safety Study Existing Conditions Report Source: FDOT Aerial Phot o Look-Up System/ Field Observations by VH B
![\\vhb\proj\orlando\62529.24 OC Oak Ridge BikePed\graphics\FJGURES g a -Sidewalk -Driveway Access [I I] -Midblock Crosswalk ~ - Lighting - Signalized lntersetion ~thb.](/docs-images/85/92244114/images/15-0.jpg "OORANGE COUNTI' GOVERNMENT I' L 0 R I ll A Rgure3-3 Corridor Features and Pedestrian Facilities Oak Ridge Road Pedestrian/ Bicycle Safety Study Existing Conditions Report Source: FDOT Aerial Photo")
15 \\vhb\proj\orlando\ OC Oak Ridge BikePed\graphics\FJGURES g a -Sidewalk -Driveway Access [I I] -Midblock Crosswalk ~ - Lighting - Signalized lntersetion ~thb. OORANGE COUNTI' GOVERNMENT I' L 0 R I ll A Rgure3-3 Corridor Features and Pedestrian Facilities Oak Ridge Road Pedestrian/ Bicycle Safety Study Existing Conditions Report Source: FDOT Aerial Photo Look-Up System/ Field Observations by VHB
 from Millenia Boulevard to Ridge Club Loop, and 40 mph for the remainder of the corridor. 2.5.2 Right of Way The roadway right of way (ROW) for the study area corridor was obtained using available property appraiser parcel data.")
16 2.5.1 Roadway Characteristics Oak Ridge Road from Millenia Boulevard to Orange Blossom Trail is classified as an Urban Major Collector and is owned and maintained by Orange County. The posted speed limit on the corridor is 35 miles per hour (mph) from Millenia Boulevard to Ridge Club Loop, and 40 mph for the remainder of the corridor Right of Way The roadway right of way (ROW) for the study area corridor was obtained using available property appraiser parcel data. The ROW varies along the corridor ranging from feet. No additional rightof way is expected to be impacted as a result of this study Typical Section Generally, there are two typical sections along the study area corridor. Both typical sections consist of four 11 foot travel lanes (two in each direction), 2 foot curb and gutters, grass buffer strips and 5 foot sidewalks on both sides of the roadway. The first typical section includes an 11 foot two way left turn lane (TWLTL), and the second typical section includes an 11 foot raised median. The raised medians are generally located at midblock crossing locations. Figure 4 illustrates the two typical sections. Figure 4: Typical Sections Typical Section #1 TWLTL 11 TWLTL Typical Section #2 Median Source: Streetmix.net 11 Median 12 Existing Conditions
17 2.5.4 Intersection Geometry Figure 5 illustrates the year 2016 intersection geometries for the following study area intersections Millenia Boulevard (signalized) Susie Way/Ridge Club Loop Fairlawn Drive Harcourt Avenue (signalized) Brookgreen Avenue Harbor Chase Circle Singing Creek Lane Kingsgate Drive/Sadler Elementary School ((signalized) Bonnie Brook Boulevard Wingate Drive/Casa del Rey Circle Double Eagle Drive/Westridge Middle School PGA Boulevard/Magic Way John Young Parkway (signalized) Oak Hill Manor Drive Chancellor Drive Texas Avenue (signalized) Tampa Avenue Lake Ellenor Drive/Pathways School Rio Grande Avenue (signalized) Orange Blossom Trail (signalized) Dedicated turn lanes are generally provided at major signalized intersections. Orange County is responsible for the operation and maintenance of six of the seven traffic signals within the study area corridor; the signal at Millenia Boulevard is maintained by the City of Orlando. Figure 5 illustrates the corridor intersection geometry for signalized and non signalized intersections. Existing Conditions 13

18 \\vhb\proj\orlando\ OC Oak Ridge BikePecf\graphics\FIGURES L -Lane Configuration m -Signalized Intersection ~thb. rj ORANGE COUN'IY GOVERNMENT FLORI D A Figures Existing Intersection Geometry Oak Ridge Road Pedestrian/Bicycle Safety Study Existing Conditions Report Source: FDOT Aer ial Phot o Look-Up System/ VHB
19 2.5.5 Bicycle and Pedestrian Infrastructure Bicycle and pedestrian connectivity plays an important role within the study area given the number of destinations, such as schools and shopping centers, which are within a short distance of existing residential development. This subsection details the existing bicycle and pedestrian network in the study area Bicycle Lanes An inventory of bicycle lanes was completed for the study corridor utilizing the latest Google Earth aerial photography and field visits. No bicycle lanes were identified along Oak Ridge Road. As a result, bicyclists either ride in the outside vehicle travel lane, or on the adjacent sidewalks Pedestrian Facilities Similar to the bicycle lane inventory, an inventory of pedestrian facilities was completed for the study area utilizing the latest Google Earth aerial photography and field visits Sidewalks Pedestrian facilities along the corridor consist of sidewalks and pedestrian crossings. There are continuous sidewalks on both sides of the roadway. The sidewalk width along the corridor is consistent throughout at 5 feet. Sidewalks shaded by trees are found sporadically throughout the corridor, however the majority of sidewalks are without shade. Street furniture is limited to transit infrastructure. No other sidewalk amenities and enhancements were identified along the corridor. Pedestrian facilities and sidewalks are in good condition along the corridor, however, it was observed that grass or landscaping create obstructions to pedestrians in some areas by narrowing their effective width. Table 3 lists the issues observed at each intersection, which include a utility pole that encroaches into the crosswalk at Apache Plaza, located between Chancellor Drive and Texas Avenue. In general, curb ramps without detectable warnings are prevalent throughout the corridor. Existing Conditions 15
20 Table 3: Condition of Pedestrian Facilities Intersection (at Oak Ridge Road) Millenia Boulevard Ridge Club Loop Fairlawn Drive Harcourt Avenue Brookgreen Avenue Harbor Chase Circle Singing Creek Lane Kingsgate Drive Wingate Drive Double Eagle Drive PGA Boulevard John Young Parkway Oak Hill Manor Drive Chancellor Drive Texas Avenue Lake Ellenor Drive Rio Grande Avenue Orange Blossom Trail Observed Continuity Issues Worn out crosswalk striping Missing Crosswalk marking at the south leg Missing Crosswalk marking at the south leg Missing detectable warnings Missing northbound stop bar Missing Crosswalk marking at the north and south legs Missing southbound stop bar Missing Crosswalk marking at the north leg Missing Crosswalk marking at the north leg Missing detectable warnings Missing Crosswalk marking at the north and south legs Missing northbound stop bar Missing Crosswalk marking at the north and south legs Missing northbound and southbound stop bars Missing Crosswalk marking at the north leg Missing southbound stop bar Push buttons located more than 10 feet from curb ramps Skewed crosswalk alignment Missing detectable warnings Missing Crosswalk marking at the north leg Missing southbound stop bar Missing Crosswalk marking at the south leg Skewed crosswalk alignment Missing northeast curb ramp Missing detectable warnings Median obstructing east/westbound crosswalk Push buttons at northwest corner located more than 10 feet from curb ramp to cross Texas Avenue Missing Crosswalk marking at the south leg Missing detectable warnings Skewed crosswalks alignment No access to push button at southeast corner for crossing Oak Ridge Road Missing detectable warnings Trails In addition to sidewalks and bicycle lanes, existing and planned regional trails that cross through the study area were also inventoried. Trails are multi use paths that are used by runners, bicyclists and other non motorized users. Currently, there is one trail adjacent to the study area, the Shingle Creek Trail (with a portion north of Oak Ridge Road planned by the City of Orlando), and an additional regional trail, the Pine Hills Trail, further north which connects to the Shingle Creek Trail. The City of Orlando SW Trails Map is included as Appendix A. 16 Existing Conditions
21 Crossing Locations In terms of pedestrian crossings, there are eighteen marked pedestrian crosswalks, including eleven midblock and seven at signalized intersections. The pedestrian crossings are listed in Table 4. # Table 4 also includes the distance between pedestrian crossings, which vary from approximately 260 feet to 1,820 feet. The longest distance without either a pedestrian crossing or a midblock crosswalk is approximately 1,820 feet between crossings 6 and 7 (Harcourt Avenue to Kingsgate Drive). Crosswalk Location (along Oak Ridge Road) Table 4: Crosswalk Locations Traffic Control Warning Type Spacing (ft.) between Crosswalks Crossing Distance (ft.) Median /Refuge Island Median Width (ft.) 1 at Millenia Boulevard Signal School 0 76 None 2 ~400 ft. east of Millenia Boulevard None Pedestrian Raised 10 3 ~300 ft. west of Susie Way/Ridge Club Loop None Pedestrian Raised 10 4 ~100 ft. west of Fairlawn Drive None Pedestrian Raised 10 5 ~350 ft. west of Harcourt Avenue None Pedestrian Raised 10 6 at Harcourt Avenue Signal School None 7 ~380 ft. east of Harcourt Avenue None Pedestrian Raised 10 8 at Kingsgate Drive Signal School 1, None 9 ~68 ft. east of Wingate Drive None Pedestrian Raised ~100 ft. west of Double Eagle Drive None School None ~280 ft. west of PGA Boulevard None Pedestrian Raised at John Young Parkway Signal School 1, None 13 ~300 ft. west of Oak Hill Manor Drive None Pedestrian Raised feet east of Oak Hill Manor Drive None Pedestrian Raised N/A 15 ~200 ft. west of Tampa Avenue None Pedestrian Raised at Texas Avenue Signal N/A 1, None 17 at Rio Grande Avenue Signal N/A 1, None 18 at Orange Blossom Trail Signal N/A 1, None Note: The highlighted cells represent the signalized intersections along the corridor Vehicle Gap Size Study As part of the existing conditions analysis, a vehicle gap size study was conducted to determine the size and the number of gaps in the vehicular traffic stream for pedestrians crossing Oak Ridge Road. In order for pedestrians to utilize midblock crossings or attempt to cross Oak Ridge Road at undesignated locations, a certain vehicle gap size has to be available. Vehicle gap studies were conducted at four (4) locations along the Oak Ridge Road corridor during the AM peak hours and Existing Conditions 17
22 PM peak hours. Two scenarios were considered for the studies; pedestrians cross one direction at a time, and pedestrians cross the full pavement width. For the first scenario, pedestrians were observed crossing Oak Ridge Road one direction at a time with an intermediate stop to take refuge in the TWLTL or the median island. As such, the vehicle gap sizes were tabulated separately in the eastbound and westbound directions. Based on a conservative walking speed of 3.0 feet per second (fps), which is lower than the average walking speed of 3.5 fps, and a crossing distance of 30 feet to the center turn lane refuge, the minimum gap interval was calculated to be 13 seconds (30 feet/3.0 fps + 3 second reaction time). The number of simultaneous gaps that occurred across two lanes, and in each direction of the traffic stream, which were greater than 13 seconds were tabulated. The summary of the AM peak hour and PM peak hour gaps greater than or equal to 13.0 seconds is provided in Table 5 and Table 6. For the second screening, vehicle gap sizes using the full 60 width of pavement with no intermediate stop at the median were tabulated. The minimum gap size was calculated to be 23 seconds (60 feet/3.0 fps + 3 sec reaction time). The number of simultaneous gaps at 23 seconds or greater, across all travel lanes on Oak Ridge Road, was significantly reduced, and is also included in Table 5 and Table 6. Table 5: AM Gap Size Study Summary Location at Oak Ridge Road Time Period Number of Gaps 13 Seconds Number of Gaps 23 Seconds EB WB Both Directions Assembly of God 7:00 AM 9:00 AM El Calvario Christian Academy 7:00 AM 9:00 AM ' West of Rio Grande Avenue 7:00 AM 9:00 AM ' East of Rio Grande Avenue 7:00 AM 9:00 AM Table 6: PM Gap Size Study Summary Location at Oak Ridge Road Time Period Number of Gaps 13 Seconds Number of Gaps 23 Seconds EB WB Both Directions Assembly of God 4:00 PM 6:00 PM El Calvario Christian Academy 4:00 PM 6:00 PM ' West of Rio Grande Avenue 4:00 PM 6:00 PM ' East of Rio Grande Avenue 4:00 PM 6:00 PM The results of the gap size study indicate that there are adequate gaps in the traffic stream to accommodate the pedestrians crossing Oak Ridge Road one direction at a time. Under the full pavement width crossing scenario, the number of adequate gaps greater than 23 seconds is reduced, and significantly lower than the pedestrian crossing demand. 18 Existing Conditions
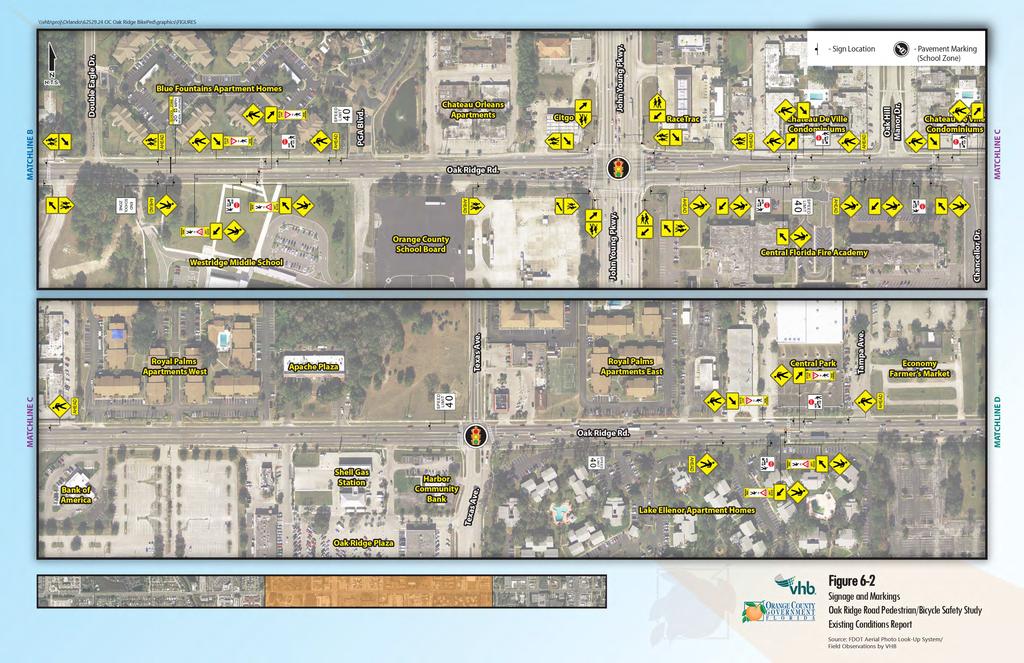
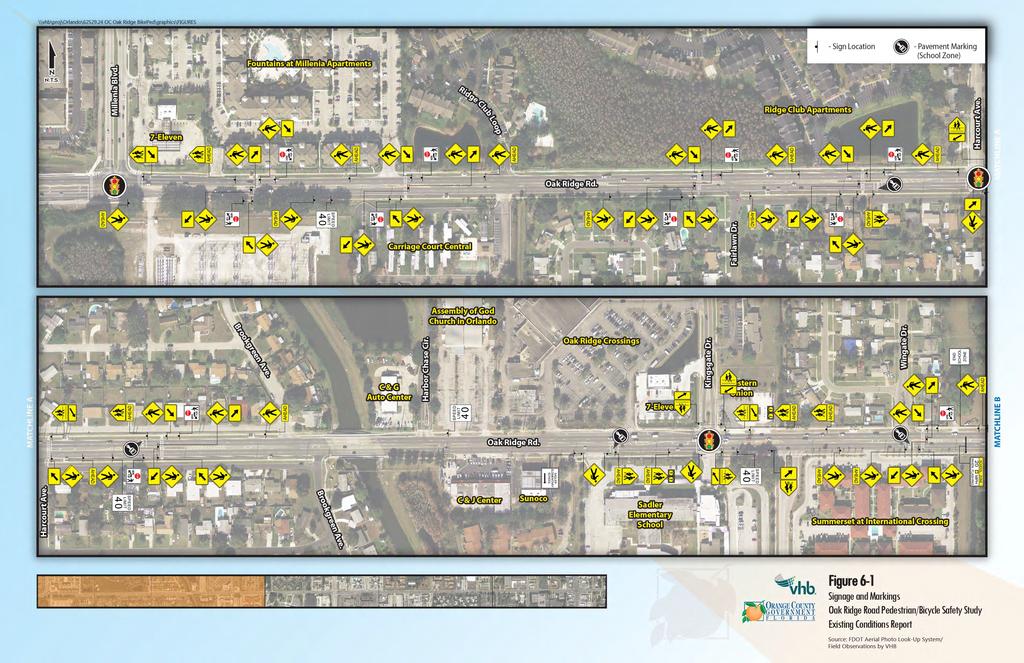
23 2.5.6 Signage, Markings, Design Speed, Posted Speed, Traffic Volumes, and School Zones This section summarizes the signage and pavement markings along the study corridor Signage for Pedestrians, Bicyclists and at School Crossings The pedestrian, bicycle and school crossing signage along the corridor is illustrated in Figure 6. A detailed sign inventory supplementing Figure 6 is included as Appendix B. A summary of the signage along the corridor includes the following: There are eighteen marked pedestrian crosswalks o Eleven of these crosswalks are midblock crosswalks o The remaining seven are at signalized intersections o Five of the crosswalks are signed with school warning signs o Ten are signed with pedestrian warning signs o The three remaining crosswalks at Texas Avenue, Rio Grande Avenue and Orange Blossom Trail are not signed All of the school and pedestrian crosswalk warning signs (S1 1 and W11 2, respectively) are supplemented by downward diagonal arrow plaques (W16 7) and have advance school and pedestrian crosswalk warning signs which are supplemented with Ahead (W 16 9p) plaques There is one designated school zone within the project limits which is located in front of the western driveway of the Westridge Middle School o Overhead cantilever school zone signs are supplemented with flashing beacons, to establish the beginning of the school zone, in both directions The midblock crosswalk in front of Orange Technical College Mid Florida Campus has pedestrian actuated flashing warning signs The crossing at Kingsgate Drive in front of Sadler Elementary School has flashing warning signs in advance of the crosswalk State Law Yield To Pedestrians Within Crosswalk signs, (R1 6), Yield Here To Pedestrians signs (R1 5) and yield line pavement markings have been installed to supplement the existing signing at Midblock Crosswalk #8, which is in front of Westridge Middle School, and Midblock Crosswalk #11, which is approximately 1,000 east of Texas Avenue School zones (begin and end points) School zones exist throughout the corridor by Harcourt Avenue, Kingsgate Drive, midblock crossing 100 feet west of Double Eagle Drive, and John Young Parkway. School zone locations are shown in Figure 6. Educational institutions and schools that exist along the corridor or in the vicinity of the corridor study area include Shingle Creek Elementary School, Westridge Middle School, Sadler Elementary School, Southwest Learning Community, Pathways Private School, Palmetto Elementary School, South Orlando Christian Academy, St John Vianney Catholic School, Oak Ridge High School, Palm Beach Atlantic University, Orange Technical College, Florida College of Integrative Medicine, and American College for Medical Careers. Existing Conditions 19
24
25
26
27 2.5.7 Spot Speed Study To analyze the approaching speeds at crossings and along the corridor, spot speed studies were performed to collect speed data. Spot speed studies were conducted during a non peak period from 10:00 AM to 10:30 AM at two different locations along the Oak Ridge Road corridor; between Bonnie Brook Boulevard and Kingsgate Drive and between Texas Avenue and Tampa Avenue. The studies were performed utilizing the methods prescribed in the Manual on Uniform Traffic Studies (MUTS) and the FDOT Manual on Speed Zoning for Highways, Roads and Streets. Several statistical measures are used to determine the basis for establishing the regulatory speed limit on a roadway, including the following: 85 th Percentile Speed: The speed at which 85% of the free flowing vehicles along the corridor do not exceed 50 th Percentile Speed: The speed at which 50% of the free flowing vehicles along the corridor do not exceed Pace: A 10 mph range that includes the highest number of vehicles observed Generally, the 85 th percentile speed and the 10 miles per hour (mph) pace represent the speed range recorded by the highest number of vehicles along the corridor, which are the basis for setting the posted speed limit on a road segment. Table 7 includes a summary of the spot speed studies. Table 7: Spot Speed Study Summary Location (Posted Speed) between Bonnie Brook Blvd. and Kingsgate Dr. (40 mph) between Texas Ave. and Tampa Ave. (40 mph) Direction 85 th Percentile 50 th Percentile Speed Speed Pace EB WB Combined EB WB Combined The posted speed limit along the study corridor is 35 mph from Millenia Boulevard to Susie Way/Ridge Club Loop, and 40 mph for the remainder of the corridor. The 85 th percentile speed data reveals that eastbound and westbound traffic travel above the posted speed limit at both of the studied locations. The 50 th percentile speed data indicates that half of the vehicles exceeded the posted speed limit by one mile per hour or more throughout the corridor. The 10 mph pace data shows that the majority of vehicles traveled with a speed in the range of 36 mph and 46 mph. In addition, more than half of the 10 mph pace vehicles exceeded the posted speed limit Lighting Street lighting has been installed along the south side of the roadway throughout the length of the corridor, and a small segment has been installed on the north side of the corridor, east of Texas Avenue. The street lights are jointly mounted on utility poles from Chancellor Drive to Orange Blossom Trail. The street lights on the south side of the roadway from Millenia Boulevard to Chancellor Drive are on their own separate poles. Existing Conditions 23
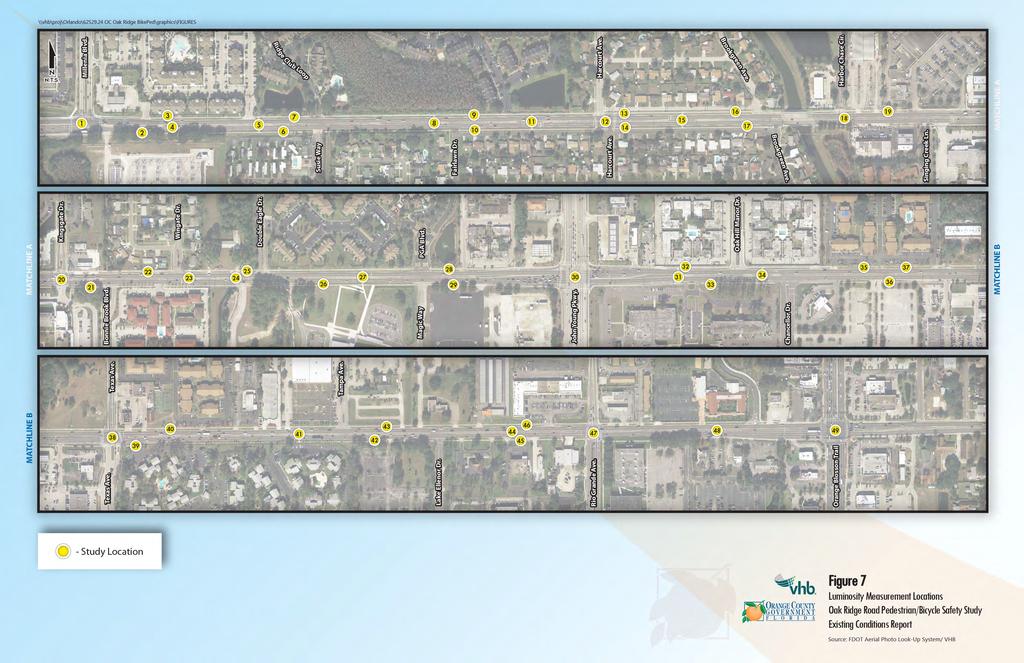
28 Lighting/Luminosity Measurements A lighting inventory and luminosity measurements were conducted along the corridor on March 30 th, 2016, between the hours of 10 PM and 3 AM. The luminosity measurements were taken at signalized intersection crosswalks, pedestrian midblock crossings, and transit stops along the study corridor. The locations where the luminosity was measured are illustrated in Figure 7. At each signalized intersection, the luminosity measurements for each crosswalk exhibited a pattern in which the lighting intensity decreased as the pedestrian or bicyclist approached the middle of the road, and then increase again as they approached the other side of the crosswalk. Based on the 2016 Florida Plans Preparation Manual (PPM), a standard Lux value of 30 is required for signalized intersections. The lighting at a majority of the signalized intersection crosswalks failed to meet the standard. The Lux values measured in the field are summarized in Table 8. The intersections with substandard lighting conditions at crosswalks include Harcourt Avenue, at Kingsgate Drive, Texas Avenue, and Orange Blossom Trail. Table 8: Summary of Luminosity Measurements at Signalized Intersections Luminosity Signalized Measured Lux Standard Sample # Intersection Northbound Eastbound Southbound Westbound Lux 1 Millenia Blvd N/A Harcourt Ave Kingsgate Dr John Young Pkwy Texas Ave Rio Grande Ave Orange Blossom Tr Note: Standard Lux based on 2016 FDOT PPM The highlighted cells represent the Lux values that are below the standard Lux value. Source: VHB Based on the 2016 FDOT PPM, a standard Lux value of 25 is required for midblock crossings. The majority of the midblock crossings failed to meet the standard. The Lux values measured in the field are summarized in Table 9. The values lower than the standard Lux are highlighted in Table 9. In addition, the four potential midblock crossing locations fail to meet the standard Lux value. Table 9: Summary of Luminosity Measurements at Midblock Crossings Luminosity Midblock Measured Lux Standard Sample # Crossing Eastbound Median Westbound Lux 4 Midblock # Midblock # Midblock # Midblock # Midblock # Potential Midblock # Midblock # Existing Conditions
29 Luminosity Midblock Measured Lux Standard Sample # Crossing Eastbound Median Westbound Lux 24 Midblock # Midblock # Midblock # Midblock # Potential Midblock # Midblock # Potential Midblock # Potential Midblock # Note: Standard Lux based on 2016 FDOT PPM The highlighted cells represent the Lux values that are below the standard Lux value. Source: VHB The FDOT PPM does not provide minimum standards for transit lighting, therefore a standard Lux value of 20 was assumed, based on the signalized intersection and midblock crossing standards. Only three out of the 13 eastbound bus stops and four out of the 14 westbound bus stops were found to have sufficient lighting conditions. The values measured in the field are summarized in Table 10 and are highlighted for reference. It should be noted that the majority of bus stops were found with non operational lighting. Table 10: Summary of Luminosity Measurements at Bus Stops Luminosity Eastbound Luminosity Westbound Assumed Sample # Bus Stop # Measured Lux Sample # Bus Stop # Measured Lux Lux 2 1 N.O.L N.O.L N.O.L N.O.L N.O.L ** N.O.L ** N.O.L * * N.O.L N.O.L ** N.O.L ** N.O.L N.O.L N.O.L N.O.L. 20 Note: Lux value was assumed based on 2016 FDOT PPM Standards The highlighted cells represent the Lux values that are below the standard Lux value. N.O.L. = Non operational Lighting * = One bulb not functioning ** = No Transit Lighting present Source: VHB Existing Conditions 25
30 In addition, the Accessing Transit Design Handbook for Florida Bus Passenger Facilities states that when lighting at the stop is not provided by the transit agency at night, local stops without shelter should be located within 30 feet, but not closer than 15 feet, to overhead light source. Based on this requirement, there are two bus stops without shelter that do not meet the standard; eastbound bus stop #11 which is 34 feet from the nearest lighting source and westbound bus stop #19 which is approximately 30 feet from the nearest source. 26 Existing Conditions
31
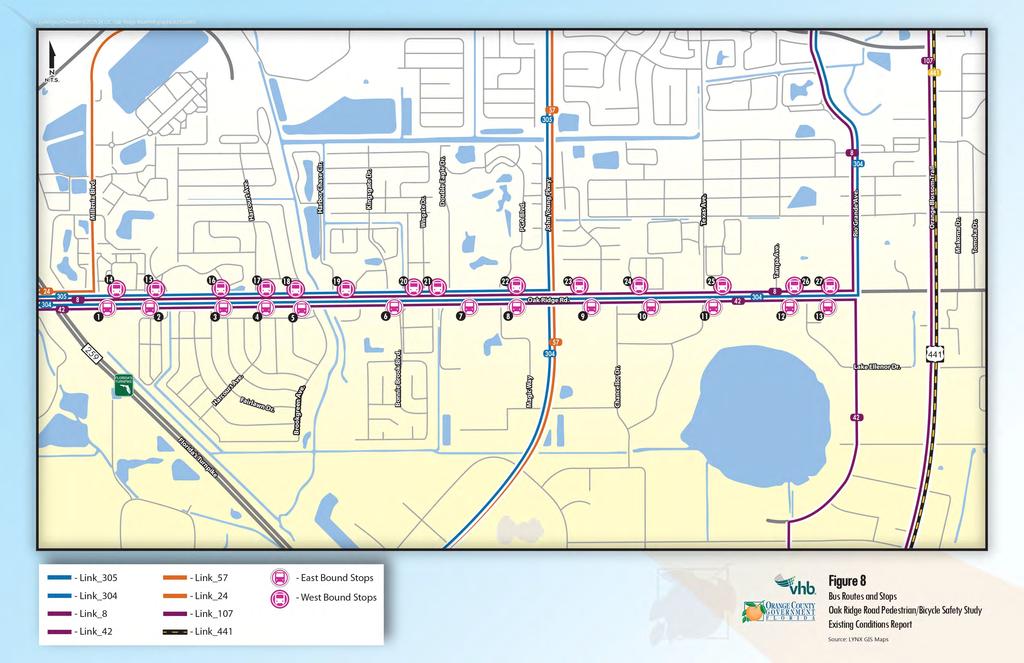
32 2.6 Transit Service and Infrastructure Existing transit service in the study area is provided by LYNX, the regional transit provider for Orange, Seminole and Osceola counties. Establishing the baseline transit service along the study area corridor is a critical initial step to help identify system deficiencies, shortcomings or needs for developing transit related recommendations Overview of LYNX LYNX s service area covers more than 2,500 square miles extending through Orange, Seminole and Osceola Counties and serving over 1.8 million residents. LYNX also offers shuttle service to special events; commuter assistance with vanpools and carpools; special door to door transportation for customers who cannot use the regular bus service; and special fares for students, physically and mentally challenged customers and riders aged 65 and older. Throughout Orange, Seminole, Osceola, Lake, and Polk counties, there are 4,402 bus stops available from which 3,334 bus stops are located in Orange County. A total number of 1,108 Active Shelters are provided from which 771 shelters are located in Orange County. The following sections summarizes the transit service, ridership and infrastructure along the study corridor Transit Service Four LYNX routes service Oak Ridge Road between Millenia Boulevard and Orange Blossom Trail. Figure 8 shows the four existing LYNX bus routes and bus stops serving the study area corridor. The LYNX fixedroutes located along Oak Ridge Road include Routes 8, 42, 304, and 305. Routes that intersect Oak Ridge Road but do not extend along the corridor are Routes 24, 57, 107 and 441.The following is a description of the four routes serving the study area: Route 8 (W. Oak Ridge Road/Int l Drive) This route serves Orlando Premium Outlet, Orange County Convention Center, and I Drive. The outbound route runs from LYNX Central Station to Orlando Premium Outlets via Vineland Avenue. The first inbound route runs from Orlando Premium Outlets to LYNX Central Station via International Drive, and the second inbound route runs from Orlando Premium Outlets to LYNX Central Station via Vineland Avenue. Route 42 (Intl. Drive/Orlando Intl. Airport) This route serves Florida Mall SuperStop, Orlando International Airport, and SunRail at Sand Lake Road. The first eastbound route runs from Orlando Premium Outlets via International Drive to Orlando International Airport, and the second eastbound route runs from Destination Parkway Superstop to Orlando International Airport. The first westbound route runs from Florida Mall to Destination Parkway SuperStop, and the second westbound route runs from Orlando International Airport to Destination Parkway SuperStop. Route 304 (Rio Grande Avenue/Vistana Resort) This route serves LYNX Central Station, and Disney Area. The northbound route runs from SR 535 and Meadow Creek Drive inbound to Orange Blossom Trail and Anderson Street. The southbound route runs from LYNX Central Station outbound to Caribe Royale Resort. The afternoon service route runs from Orange Blossom Trail and Anderson Street outbound to Caribe Royale Resort. Route 305 (Disney Springs Direct) This route serves Disney Area. The only outbound route runs from Kirkman Road and Raleigh Street to Disney s All Star Sports Resort. 28 Existing Conditions
33
34 LYNX service in the study area is provided on weekdays, Saturdays, and Sundays/Holidays. The earliest route begins at 4:45 AM and the latest route ends at 3:05 AM. Frequencies vary by route, time of day, and day of the week. Table 11 presents the span of service, frequency, and ridership for each of the routes in the study area. The detailed route schedules and information are included in Appendix C. The frequencies presented in the table represents the typical range for the service. Table 11: LYNX Routes Summary Route Route Description Span of Service Service FY 2015 Annual Frequency Ridership 8 4:45 AM to 3:05 AM Weekdays 10/15 Min W. Oak Ridge 4:45 AM to 1:20 AM Saturday 20/35 Min Road/Int l Drive 4:45 AM to 10:05 PM Sunday/Holidays 15/30 Min 2,368, Intl. Drive/ Orlando Intl. 4:48 AM to 12:30 AM 4:50 AM to 12:26 AM Weekdays Saturday 20/30 Min 30/60 Min 944,194 Airport 5:05 AM to 10:57 PM Sunday/Holidays 60 Min 304 Rio Grande Avenue/Vistana Resort 6:00 AM to 6:25 PM 6:00 AM to 6:25 PM 6:00 AM to 6:25 PM Weekday Saturday Sunday/Holidays 3 trips 3 trips 3 trips 31, :09 AM to 7:19 AM Weekday 1 trip Disney Springs 6:09 AM to 7:19 AM Saturday 1 trip Direct 6:09 AM to 7:19 AM Sunday/Holidays 1 trip 66,349 Source: LYNX Routes and Schedules (golynx.com). LYNX Transit Service Route Ridership GFI and Stop Ridership Summary APC Transit Stops As illustrated in Figure 8 there are 27 transit stops along the Oak Ridge Road study corridor to accommodate the LYNX routes servicing the area, including 13 stops in the eastbound direction and 14 stops in the westbound direction. The average spacing between stops is approximately 875 feet. None of the 27 bus stops include a bus bay, nor are there any dedicated transit lanes. The average daily ridership along the corridor is based on the latest four month service period. The boarding and alighting information is an average daily estimate based on sampled ridership data during the last service change (bid) period, which occurs three times per year. Table 12 presents the ridership summary and features, respectively, for each of the bus stops along the corridor. Figure 9 illustrates the same information. 30 Existing Conditions
35 Table 12: LYNX Bus Stops Ridership Summary Eastbound Direction Westbound Direction No. Bus Stop ID Avg. Daily On Avg. Daily Off Total No. Bus Stop ID Avg. Daily On Avg. Daily Off Total Existing Conditions 31
36
37 2.6.4 Transit Stop Infrastructure A review was performed using current aerial footage, supplemented with field visits, to assess the bus stop infrastructure within the study area. Amenities for the existing transit stops include availability of landing pad, shelter, seating, lighting, and recycling receptacles. Table 13 presents the transit infrastructure at each stop location. The corresponding stop numbers can be found on Figure 8. Table 13: LYNX Bus Stops Features Eastbound No. Bus Stop ID Landing Pad Shelter Seating Lighting Condition Available Available Available Available Fair Available Available Available Available Good Available Available Available Available Good Available Available Available Available Fair Available Available Available Available Good Available Available Available Available Good Available Available Available Available Good Available Available Available Available Fair Available Available Available Available Good Available Available Available Available Good Available N/A Available N/A Poor Available Available Available N/A Fair Available Available Available Available Good Westbound No. Bus Stop ID Landing Pad Shelter Seating Lighting Condition Available Available Available Available Good Available Available Available Available Good Available Available Available Available Good Available Available Available Available Good Available Available Available Available N/A Good Available N/A Available N/A Poor Available Available Available Available Good Available Available Available Available Good Available Available Available Available Fair Available Available Available Available Good Available Available Available Available Good Available Available Available Available Good Available Available Available Available Good Available Available Available Available Good Source: VHB Two transit stops along the project corridor do not have shelter or lighting, and two additional do not have lighting. A collection of photographs taken by VHB staff in the field is located in Appendix D and below. Only one transit stop was observed as a potential obstruction to pedestrians using the adjacent crosswalk; the westbound transit stop, approximately 580 east of John Young Parkway. As pedestrians exit the bus at the stop location, they cross Oak Ridge Road at the midblock crosswalk approximately 12 feet west of the transit stop. The vision of pedestrians crossing at this location is obstructed by the bus; they do not see the vehicles in the inside westbound travel lane. In addition, vehicles travelling in the inside westbound travel lane do not see pedestrians crossing in front of the bus. Vehicles were observed evasively changing lanes approaching the transit stop, to avoid stopping behind the bus, creating conflict at the midblock crosswalk. Existing Conditions 33


38 Bus Stop Shelter East of John Young Pkwy (Eastbound Direction) Source: Image by VHB taken in the field. The following photographs (taken in the field and from LYNX) highlight key transit features along the corridor. Bus Stop Shelter at Midblock Crosswalk East of Millenia Boulevard Source: Image obtained from LYNX GIS Web Site The majority of bus stops are located in areas where there is an existing sidewalk. Landing pads, which provide a connection from the sidewalk to the bus doors, are found at most of the bus stop locations. There are two locations where the transit stop did not provide overhead shelter or lighting, and a third location without lighting. 34 Existing Conditions
 2.")


 along the Oak Ridge Road project limits.")
39 Bus Stop without a shelter (West of Singing Creek Lane) Bus Stop without a shelter (East of S Texas Avenue) 2.7 Safety and Crash Analysis A historical crash review was performed for the project corridor to identify the pedestrian/bicycle crash patterns and hotspots within the corridor. To identify crash patterns along the corridor, crash data was obtained from the Orange County Traffic Engineering Division for the previous three years (January 01, 2013 to December 31, 2015) along the Oak Ridge Road project limits. Crash data provided by the County contained only the crashes that involved pedestrians or bicycles. Orange County Traffic Engineering Division provided Existing Conditions 35
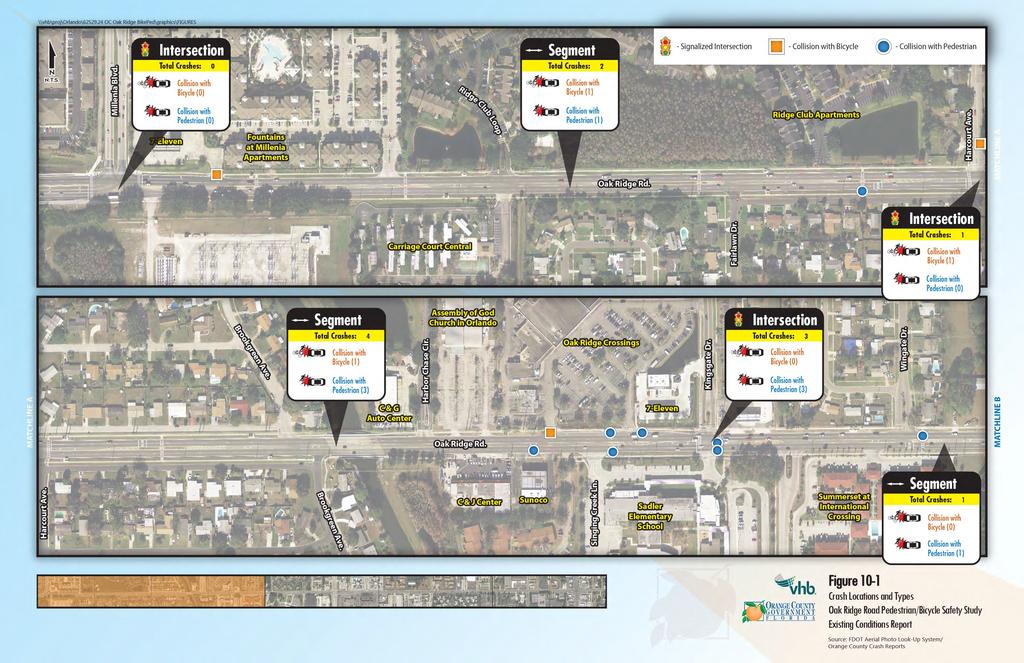
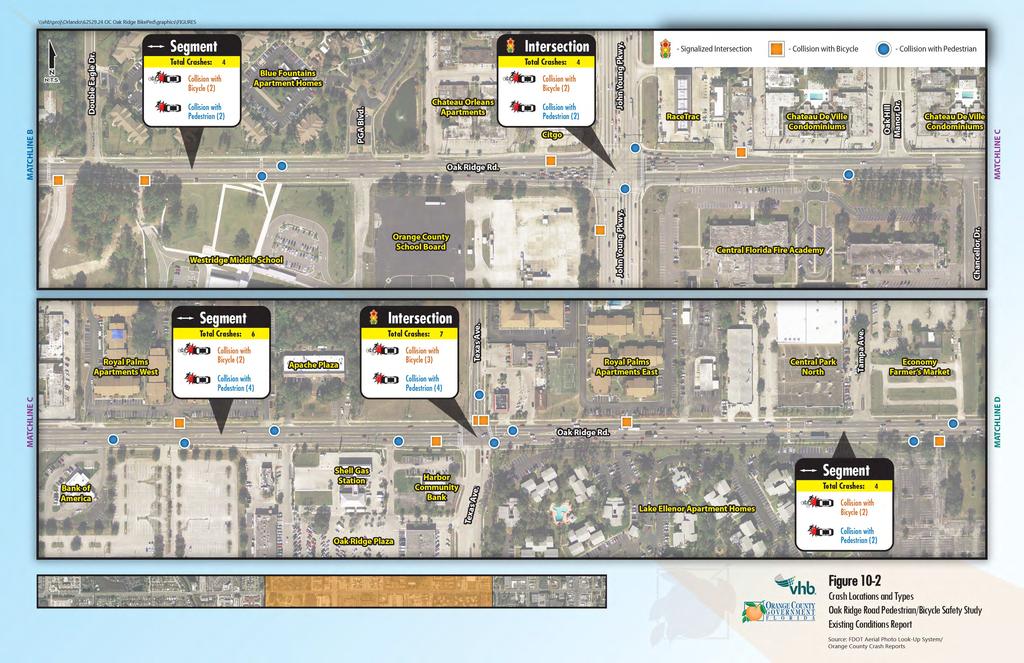
40 long and short form crash reports for the pedestrian and bicycle related crashes for the project corridor. A detailed summary of the crash data is included in Appendix E Crash Summary by Year and Condition Table 14 shows the summary of the pedestrian and bicycle crashes from January 2013 to December Based on the crash data, a total of 56 crashes were recorded within the study corridor during the period. Out of these 56 crashes, three crashes occurred in parking lots and one crash occurred outside of Oak Ridge Road. Therefore, these four crashes were removed from the analysis, for a new total of 52 crashes. Out of these 52 crashes, 31 were reported as pedestrian crashes and 21 as crashes involving bicycles. According to the police reports, the contributing cause for 51 crashes (98% of total) were reported as failing to yield right of way with one cited for reckless driving. Table 14: Crash Data Summary by Year (Jan 2013 Dec 2015) Year Total Number of Crashes Number of Injury Crashes Number of Fatal Crashes Number of Night Crashes Number of Wet Crashes Annual Avg Percent 88.4% 1.9% 36.5% 7.7% Based on severity, the crashes can be divided into three categories: fatal, injury, and property damage only (PDO). According to the police reports, 46 (88% of total) crashes resulted in some type of injury and one crash resulted in a fatality. The other five crashes (10% of total) were reported as PDO. Based on the pavement conditions mentioned in the police reports, four out of the 52 crashes (8% of total) occurred on wet pavement conditions. Also, the demography of the persons involved in these crashes showed that 15 out of 52 crashes (29% of total) involved minors. Crash Diagrams showing the locations and numbers of crashes are provided in Figure 10. Table 15 summarizes the number of crashes by types (pedestrian/bicycle) of crashes along the Oak Ridge Road corridor. The predominant crash type was pedestrian related (31 of the 52, 59.6% of total). 36 Existing Conditions
41 Table 15: Summary of Crashes by Harmful Event Crash Type Average per Year Percent Pedestrian % Bicyclist % Total % Crash Summary Table 16 includes a summary of the bicycle and pedestrian crashes by signalized intersection and roadway segment within the project corridor for the three year crash history, including the distribution of crashes along the corridor. Figure 10 illustrates the locations of these crashes. The table shows the crash frequency, crash type (pedestrian/bicycle) and number of injuries that resulted from the crashes within the intersections and segments. According to the table, the following intersections and segments can be identified as pedestrian/bicycle crash clusters based on the number of crashes. These signalized intersections or roadway segments have five or more crashes in the three year crash history. They are: Oak Ridge Road at Orange Blossom Trail (signalized intersection) 11 pedestrian/bicycle related crashes East of John Young Parkway to west of Texas Avenue (segment) seven pedestrian/bicycle related crashes Oak Ridge Road at Texas Avenue (signalized intersection) six pedestrian/bicycle related crashes Oak Ridge Road at Orange Blossom Trail: A total of 11 pedestrian/bicycle related crashes were reported at this intersection. The only fatal crash within the project corridor occurred at the intersection of Oak Ridge Road and Orange Blossom Trail where a southbound vehicle approaching Oak Ridge Road crashed into a pedestrian crossing the north leg of Orange Blossom Trail without designated crossing. In addition, four bicycle related and six pedestrian related crashes were reported at this intersection, resulting in injuries in all 10 crashes. Majority of the crashes were reported at the north leg of this intersection. East of John Young Parkway to west of Texas Avenue: A total of six pedestrian/bicycle related crashes were reported at this segment. Two were bicycle related and four were pedestrian related crashes; resulting in injuries in all six crashes. Oak Ridge Road at Texas Avenue: A total of seven pedestrian/bicycle related crashes were reported at this intersection. Three were bicycle related and four were pedestrian related crashes; resulting in injuries in all seven crashes. Within the segment crashes, three were reported to have occurred at marked midblock crosswalks where oncoming vehicles failed to yield the right of way to crossing pedestrians. Also, one crash occurred when a pedestrian was standing on the shoulder of Oak Ridge Road too close to the travel lanes and was struck by a vehicle. Existing Conditions 37
42 Table 16: Summary of Ped/Bike Crashes (Jan 2013 Dec 2015) Segment/Intersection Description Number of Crashes Crash Type Millenia Boulevard to Harcourt Avenue Segment 2 1 Ped, 1 Bike Oak Ridge Road at Harcourt Avenue Signalized Intersection 1 1 Bike Harcourt Avenue to Kingsgate Drive Segment 4 3 Ped, 1 Bike Oak Ridge Road at Kingsgate Drive Signalized Intersection 3 3 Ped Kingsgate Drive to Double Eagle Drive Segment 1 1 Ped Double Eagle Drive to John Young Parkway Segment 4 2 Ped, 2 Bike Oak Ridge Road at S. John Young Parkway Signalized Intersection 4 2 Ped, 2 Bike John Young Parkway to Texas Avenue Segment 6 4 Ped, 2 Bike Oak Ridge Road at Texas Avenue Signalized Intersection 7 4 Ped, 3 Bike Texas Avenue to Rio Grande Avenue Segment 4 2 Ped, 2 Bike Oak Ridge Road at Rio Grande Avenue Signalized Intersection 3 1 Ped, 2 Bike Rio Grande Avenue to Orange Blossom Trail Segment 2 1 Ped, 1 Bike Oak Ridge Road at S. Orange Blossom Trail Signalized Intersection 11 7 Ped, 4 Bike Total Ped, 21 Bike Crash Summary by Other Factors The crash reports provided contributing factors for the crashes within the project corridor. A total of three crashes were influenced by alcohol use. Crashes caused by distractions were six in total, and the driver was reported to be at fault in five crashes. Table 17 shows a summary of the persons involved in the crash by age group. 38 Existing Conditions
43 Table 17: Summary of Crashes by Age Crash Factor Average per Year Percent Ped Age < % Ped Age % Ped Age > % Unknown % Total Ped 31 Bike Age < % Bike Age % Unknown % Total Bike 21 Based on the summary in Table 17, 61.3% of the pedestrian relates crashes and 57% of the bicycle related crashes involved people between 18 to 60 years of age. Existing Conditions 39
44
45
46
47 2.8 Existing Travel Demand Characteristics To gain a better understanding of the travel demand characteristics along the study area corridor, daily and hourly traffic volumes data were collected and reviewed. This section quantifies the existing traffic volumes along the study area corridor for vehicular traffic, as well as bicyclists and pedestrians Existing Traffic Volumes Weekday daily and hourly traffic volumes along the study corridor were collected by VHB and supplemented from Florida Transportation Information (FTI). These counts included the following: 72 hour bidirectional volume counts (18 locations) 24 hour classification counts (2 locations) 6 hour turning movement counts from 7:00 9:00 AM, 11:00 1:00 PM and 4:00 6:00 PM; at 15 intersections 8 hour turning movement counts from 7:00 9:00 AM, 11:00 1:00 PM and 2:00 6:00 PM; at 5 intersections Major driveway counts at 37 locations Midblock crossing pedestrian and bicycle counts at 11 locations The counts were collected in February Following is a detailed list of each count location, by count type: A. 72 hour Bi Directional Volume Counts: 1. Millenia Boulevard north of Oak Ridge Road 2. Oak Ridge Road east of Millenia Boulevard 3. Oak Ridge Road west of John Young Parkway 4. Oak Ridge Road between John Young Parkway and Texas Avenue 5. Oak Ridge Road between Texas Avenue and Orange Blossom Trail 6. Harcourt Avenue north of Oak Ridge Road 7. Harcourt Avenue south of Oak Ridge Road 8. Kingsgate Drive north of Oak Ridge Road 9. Bonnie Brook Boulevard south of Oak Ridge Road 10. John Young Parkway north of Oak Ridge Road 11. John Young Parkway south of Oak Ridge Road 12. Chancellor Drive south of Oak Ridge Road 13. Texas Avenue north of Oak Ridge Road 14. Texas Avenue south of Oak Ridge Road 15. Rio Grande Avenue north of Oak Ridge Road 16. Rio Grande Avenue south of Oak Ridge Road 17. Orange Blossom Trail north of Oak Ridge Road 18. Orange Blossom Trail south of Oak Ridge Road Existing Conditions 43
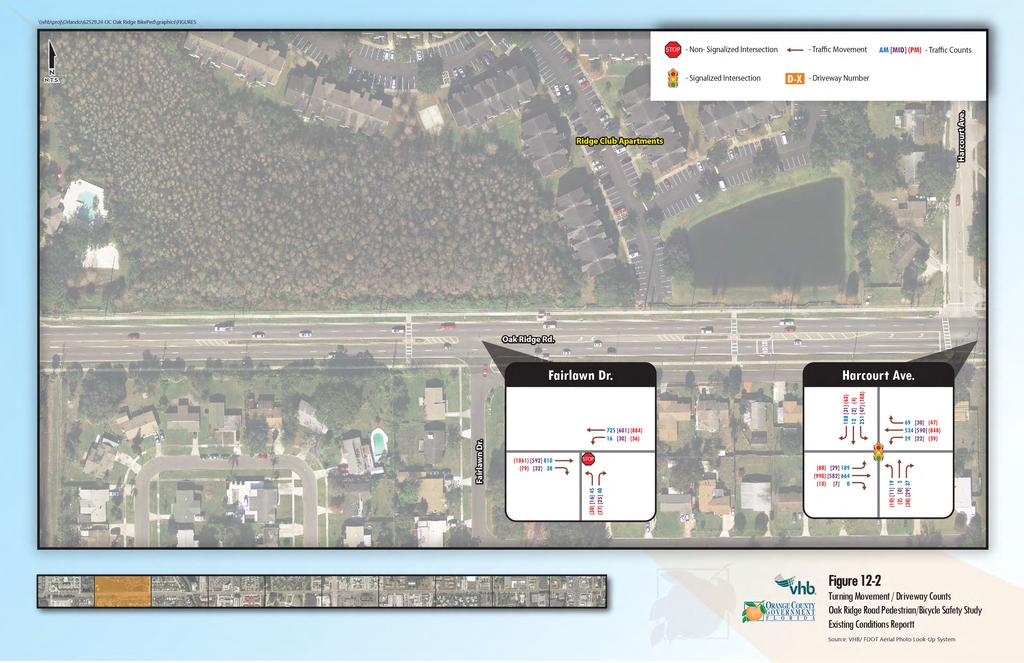
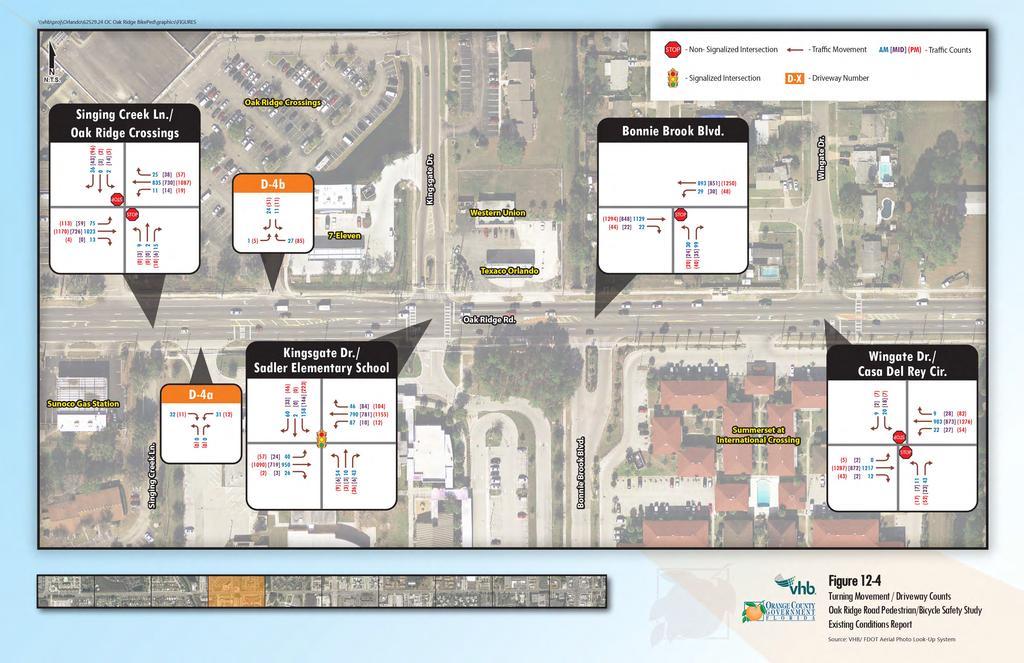
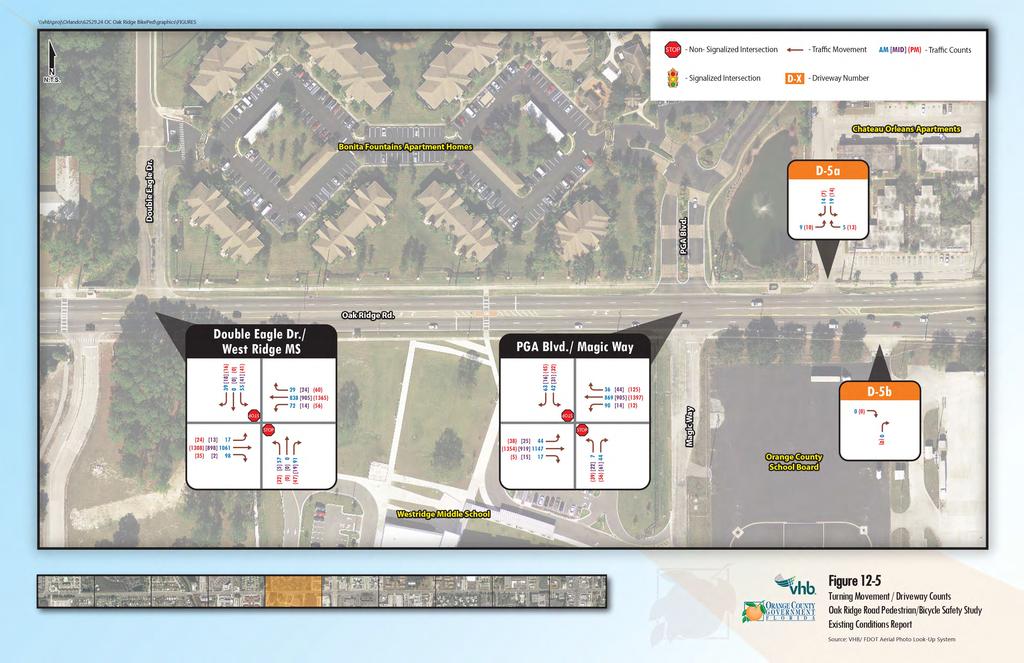
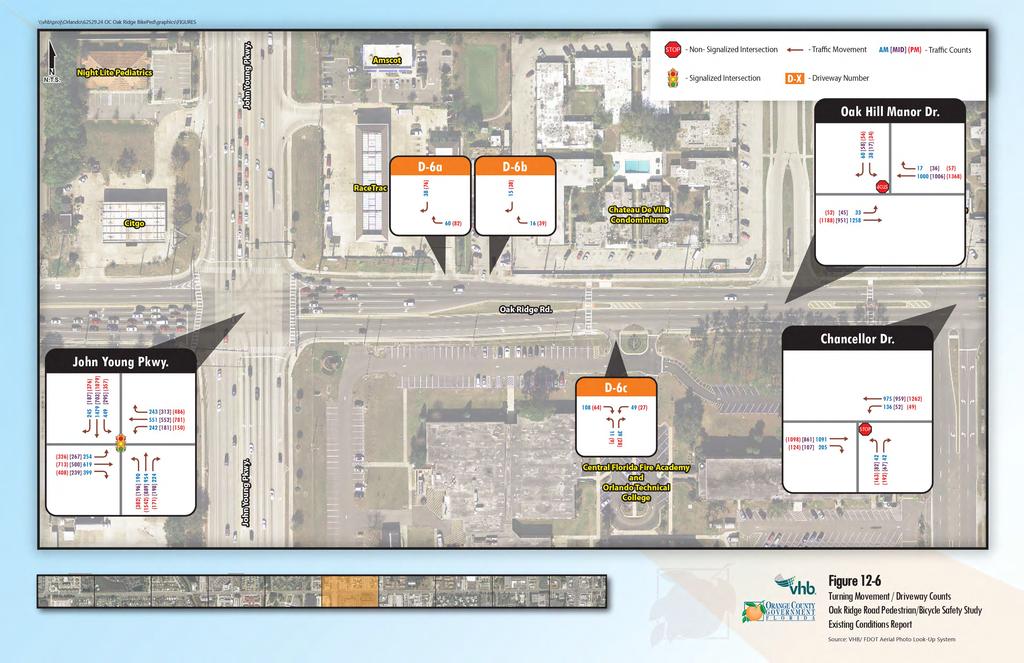
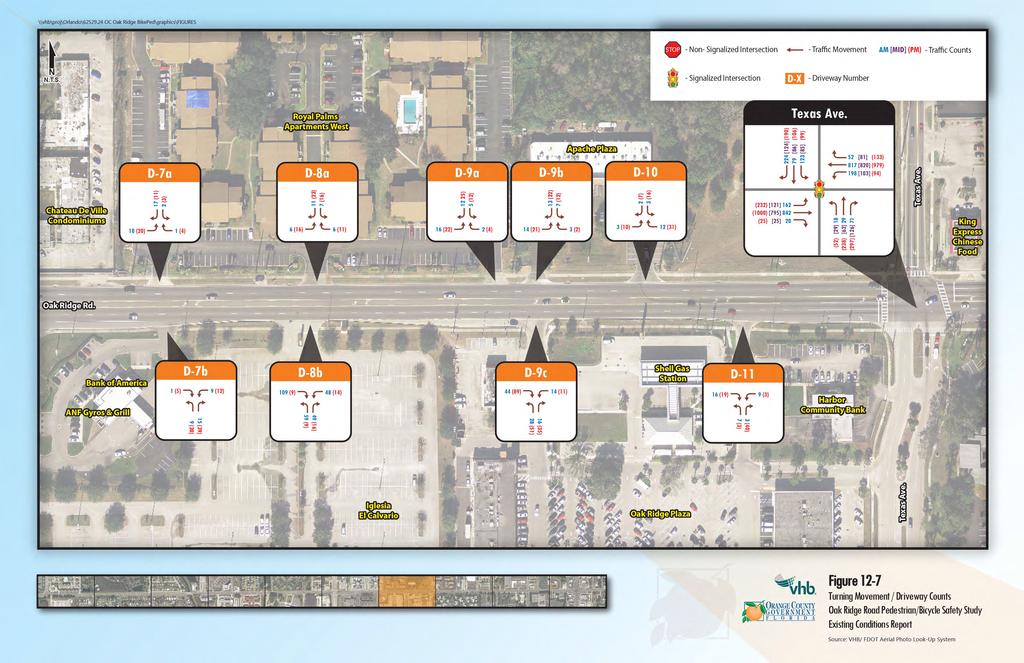
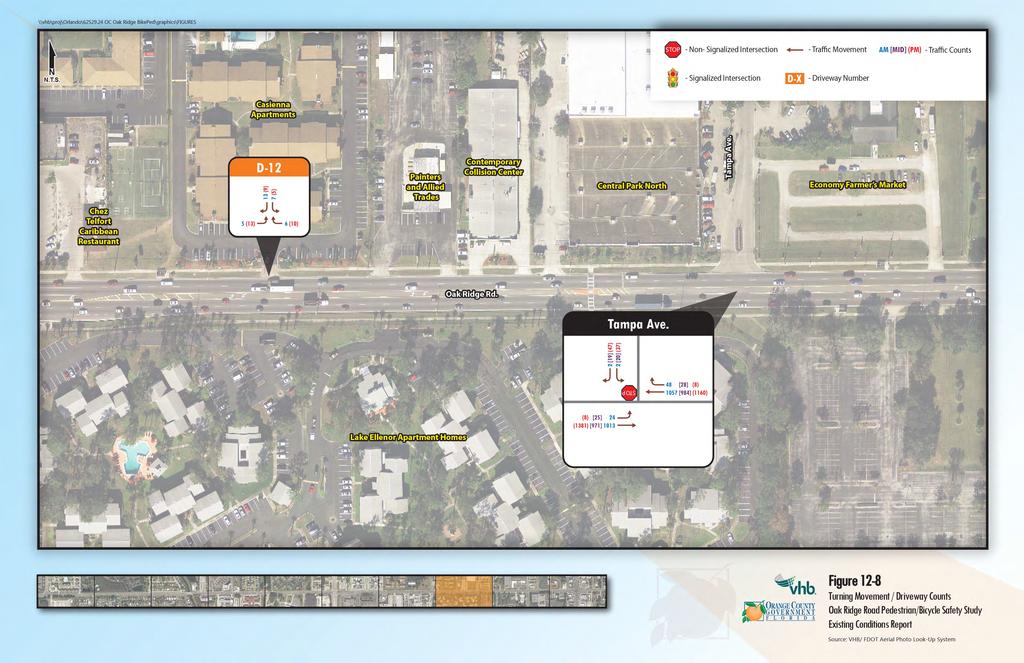
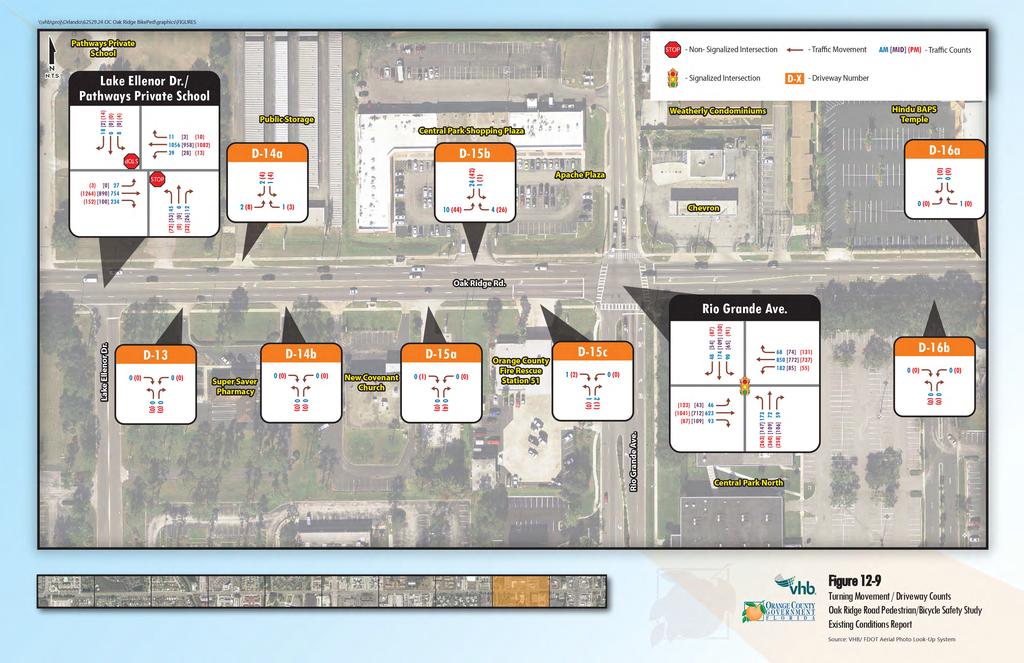
48 B. 24 hour Vehicle Classification Counts: 1. Oak Ridge Road east of Susie Way 2. Oak Ridge Road east of Rio Grande Avenue C. Intersection Turning Movement Counts (at Oak Ridge Road): 1. Millenia Boulevard 11. Double Eagle Drive/Westridge Middle School 2. Susie Way/Ridge Club Loop 12. PGA Boulevard/Magic Way 3. Fairlawn Drive 13. S John Young Parkway 4. Harcourt Avenue 14. Oak Hill Manor Drive 5. Brookgreen Avenue 15. Chancellor Drive 6. Harbor Chase Circle 16. S Texas Avenue 7. Singing Creek Lane 17. S Tampa Avenue 8. Kingsgate Drive/Sadler Elementary School 18. Lake Ellenor Drive/Pathway Private School 19. Rio Grande Avenue 9. Bonnie Brook Boulevard 20. S Orange Blossom Trail 10. Wingate Drive/Case Del Rey Circle D. Driveway Counts (at Oak Ridge Road): 1. 7 Eleven East of Millenia Boulevard (D 1) 2. Fountains Apartments (D 2) 3. Assembly of God Church northeast driveway (D 3a) 4. Assembly of God Church northwest driveway (D 3b) 5. C&J Center southeast driveway (D 3c) 6. C&J Center southwest driveway (D 3d) 7. Sadler Elementary School west driveway (D 4a) 8. Oak Ridge Crossings east driveway(d 4b) 9. Chateau Orleans Apartments (D 5a) 10. Orange County School Board (D 5b) 11. Race Trac Gas Station (D 6a) 12. MI Bandera Market (D 6b) 13. Orange Technical College Mid Florida Campus (D 6c) 14. Royal Palms Apartments west driveway (D 7a) 15. Bank of America (D 7b) 16. Royal Palms Apartments center driveway (D 8a) 17. Iglesia El Calvario (D 8b) 18. Royal Palms Apartments east driveway (D 9a) 19. Apache Plaza west driveway (D 9b) 20. Oak Ridge Plaza west driveway (D 9c) 21. Apache Plaza east driveway (D 10) 22. Oak Ridge Plaza east driveway (D 11) 23. Casienna Apartments (D 12) 24. Super Saver Pharmacy west driveway (D 13) 25. Public Storage (D 14a) 26. Super Saver Pharmacy east driveway (D 14b) 27. Panderia Y Taqueria (D 15a) 28. Central Park Center (D 15b) 29. Orange County Fire Station (D 15c) 30. BAPS Hindu Temple (D 16a) 31. Southern College (D 16b) 32. Medical Village (D 17a) 33. Korean Restaurant west driveway (D 17b) 34. Korean Restaurant east driveway (D 17c) 35. Walmart (D 17d) 36. Vet Hospital west driveway (D 17e) 37. Vet Hospital east driveway (D 17f) 44 Existing Conditions
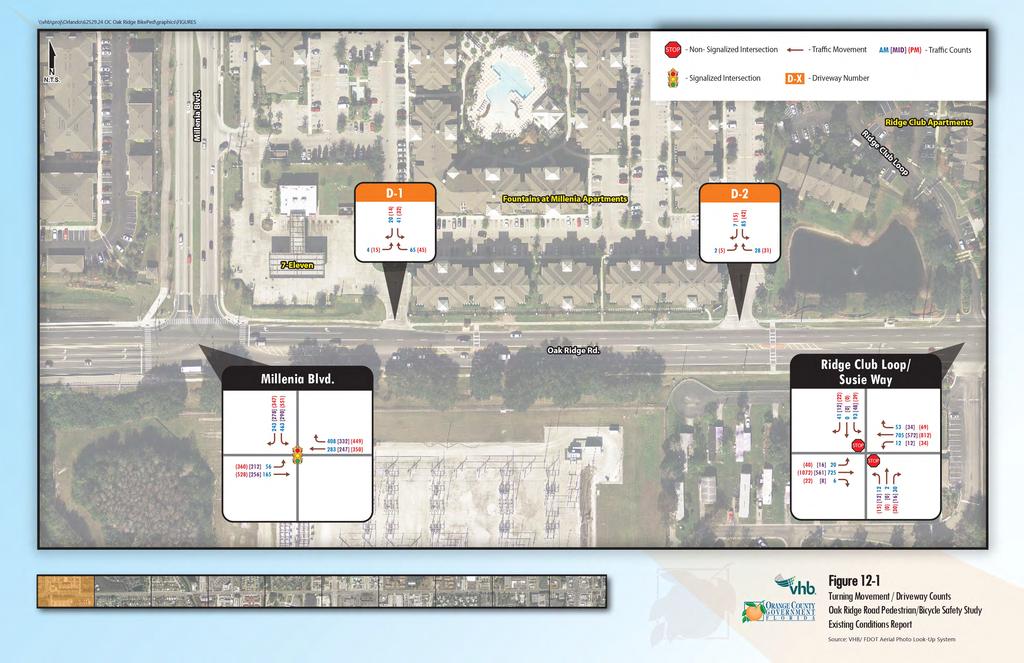
49 E. Midblock Crossings Pedestrian and Bicycle Counts (from Oak Ridge Rd): ft. east of Millenia Boulevard ft. west of Susie Way/Ridge Club Loop ft. west of Fairlawn Drive ft. west of Harcourt Avenue ft. east of Harcourt Avenue ft. east of Wingate Drive ft. west of Double Eagle Drive ft. west of Pga Boulevard ft. west of Oak Hill Manor Drive ft. east of Oak Hill Manor Drive (data collected as part of intersection counts 14 and 15) 11. between Iglesia El Calvario and Royal Palm Apartment west driveway (potential crossing location) ft. west of Tampa Avenue 13. between Lake Ellenor Drive and Rio Grande Avenue (potential crossing location) 14. between Hindu Temple and WalMart Driveway (potential crossing location) All traffic count data collected was adjusted utilizing the latest Orange County axle factor (where applicable) and seasonal adjustment factors (provided by FDOT), to provide annual average conditions. All collected traffic counts, axle and seasonal factors are provided in Appendix F. Figure 11 illustrates the traffic count locations and Figure 12 illustrates the peak hour turning movement counts along the study area corridor. The peak hour counts represent the counts taken during the highest hour of the peak periods, averaged over a three day period. Based on the 72 hour volume counts, the annual average daily traffic (AADT) along the Oak Ridge Road study corridor ranges from approximately 22,399 daily trips east of Millenia Parkway up to 38,056 daily trips west of John Young Parkway. The AADTs are summarized in Table 18. The percentage of truck volumes along the corridor range from approximately 3.5% of the AADT near Susie Way and 5.3% of the AADT near Rio Grande Avenue. Existing Conditions 45
50 Roadway/Segment Millenia Blvd N of Oak Ridge Rd Oak Ridge Rd E of Millenia Blvd Oak Ridge Rd W of John Young Pkwy Oak Ridge Rd b/n John Young Pkwy and Texas Ave Oak Ridge Rd b/n Texas Ave and Orange Blossom Tr Harcourt Ave N of Oak Ridge Rd Harcourt Ave S of Oak Ridge Rd Kingsgate Dr N of Oak Ridge Rd Bonnie Brook Blvd S of Oak Ridge Rd John Young Pkwy N of Oak Ridge Rd John Young Pkwy S of Oak Ridge Rd Chancellor Dr S of Oak Ridge Rd Texas Ave N of Oak Ridge Rd Texas Ave S of Oak Ridge Rd Rio Grande Ave N of Oak Ridge Rd Rio Grande Ave S of Oak Ridge Rd Orange Blossom Tr N of Oak Ridge Rd Orange Blossom Tr S of Oak Ridge Rd Oak Ridge Rd E of Susie Way Oak Ridge Rd E of S Rio Grande Ave Source: VHB 1 FDOT 2014 Florida Transportation Information DVD Traffic Count Date 02/16/2016 to 02/19/ /02/2016 to 02/05/ /02/2016 to 02/05/ /02/2016 to 02/05/ /02/2016 to 02/05/ /02/2016 to 02/05/ /01/2016 to 03/05/ /01/2016 to 03/05/ /01/2016 to 03/05/ /02/2016 to 02/05/ /02/2016 to 02/05/ /02/2016 to 02/05/ /02/2016 to 02/05/ /02/2016 to 02/05/ /02/2016 to 02/05/ /02/2016 to 02/05/ /02/2016 to 02/05/ /02/2016 to 02/05/ /02/2016 to 02/03/ /02/2016 to 02/03/2016 Type of Count 72 Hour Volume Count 72 Hour Volume Count 72 Hour Volume Count 72 Hour Volume Count 72 Hour Volume Count 72 Hour Volume Count 72 Hour Volume Count 72 Hour Volume Count 72 Hour Volume Count 72 Hour Volume Count 72 Hour Volume Count 72 Hour Volume Count 72 Hour Volume Count 72 Hour Volume Count 72 Hour Volume Count 72 Hour Volume Count 72 Hour Volume Count 72 Hour Volume Count 24 Hour Classification 24 Hour Classification ADT Table 18: 72 Hour Traffic Volumes Counts Peak Hour Total NB/EB Volume Measured Characteristics Adjustment Factors 1 Adjusted SB/WB Volume Peak Time "K" "D" "T 24 " Axle Seasonal AADT 22,105 1, :00 6:00 PM 7.94% 50.10% ,447 22,629 1,842 1, :45 5:45 PM 8.14% 56.50% ,399 38,448 3,119 1,404 1,715 5:15 6:15 PM 8.11% 55.00% ,056 33,306 2,511 1,273 1,238 5:15 6:15 PM 7.54% 50.70% ,967 33,772 2,672 1,506 1,166 4:30 5:30 PM 7.91% 56.40% ,428 4, :30 8:30 AM 14.39% 60.00% ,245 1, :15 7:15 PM 8.46% 53.10% ,297 5, :45 6:45 PM 8.53% 53.30% ,360 2, :45 8:45 AM 9.09% 69.10% ,317 55,638 4,223 2,269 1,954 5:00 6:00 PM 7.59% 53.70% ,071 51,417 3,683 2,020 1,663 4:30 5:30 PM 7.16% 54.90% ,893 4, :45 5:45 PM 10.80% 76.70% ,611 11, :45 5:45 PM 8.97% 66.80% ,946 6, :45 5:45 PM 11.52% 68.80% ,532 8, :45 5:45 PM 10.24% 67.50% ,484 10,313 1, :30 5:30 PM 9.89% 73.70% ,208 57,409 3,864 1,940 1,924 5:15 6:15 PM 6.73% 50.20% ,824 54,520 3,552 1,746 1,806 12:15 1:15 PM 6.52% 50.80% ,964 24,122 1,945 1, :00 6:00 PM 8.10% 56.20% 3.50% ,364 27,678 1,928 1, :30 5:30 PM 7.00% 58.60% 5.30% , Existing Conditions

51 \\vhb\proj\orlando\ OC Oak Ridge BikePed\graphics\FIGURES N V-7 A v e. V-9 2,317 V-3 V-11 V-13 10,946 56,824 V-15 8,484 33,428 27,955 32,967 V-12 50,893 4,611 Tomoka Dr. V-17 Makoma Dr. Orange Blossom Trail Rio Grande Ave. Tampa Ave. O ak Texas Ave. anor D r. ll M i H John Young Pkwy. PGA Blvd. Wingate Dr. Kingsgate Dr. Harbor Chase Cir. Double Eagle Dr. V-4 38,056 Oak Ridge Rd. ee n Ha rc ou rt Av e Fairlawn Dr. V-2 1,297 24,364 5,360 55,071 Chancellor Dr. 22,399 V-8 V-6 V-10 Magic Way 4,245 Bonnie Brook Blvd. C-1 21,447 Bro ok gr V-1 rt Ave. Harcou Millenia Blvd. N.T.S. V-14 6,532 V-5 C-2 V-16 10,208 53,964 V-18 Lake Ellenor Dr. 441 e ik np r Tu a s rid o Fl V - XX - 72 Hour Volume Count C - XX - 24 Hour Classification Count Annual Average Daily Traffic Volume Figure 11 Volume and Class Count Locations Oak Ridge Road Pedestrian/Bicycle Safety Study Existing Conditions Report Source: Google Maps
52
53

54
55
56
57
58
59
60

61
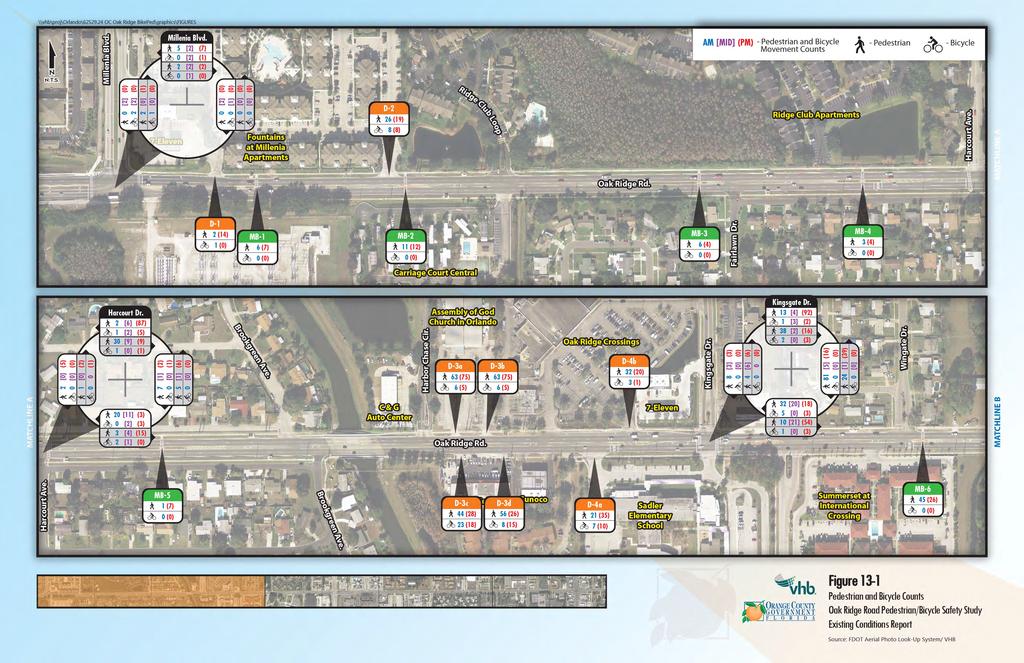
62 MB# Pedestrian and Bicycle Traffic Volumes As presented in an earlier section, crosswalks are provided at midblock crossings, signalized intersections and driveways. Pedestrian and bicycle counts were collected over a three day period (from 7:00 to 9:00 AM and 4:00 to 6:00 PM) along the corridor at midblock crossing locations. The two hour and peak hour peak counts are summarized in Table 19 and include pedestrians and bicyclists within approximately 25 feet of the crosswalk. Pedestrian and bicycle counts were collected at signalized intersections during AM, mid day and PM peak periods. The peak hour counts are summarized in Table 20. Driveway pedestrian and bicycle counts were collected for the AM period (7:30 to 8:30) and PM period (5:00 to 6:00) for pedestrians and bicyclists crossing each driveway. The peak hour results are summarized in Table 21. Table 19: Pedestrian and Bicycle Traffic Volumes at Midblock Crossings Pedestrian and Bicycle Crossing Location 1. Pedestrian Volumes represent the average of 3 day counts 2. Pedestrian Volumes represent 1 day counts during the peak hour 3. Midblock Crossing is planned to be removed by the County due to the addition of a traffic signal 4. Counts taken at potential midblock crossing locations Pedestrian Volumes 1 2 Hour Peak Bicycle Volumes 1 Pedestrian Volumes 1 Peak Hour Bicycle Volumes 1 AM PM AM PM AM PM AM PM ft. east of Millenia Boulevard ft. west of Susie Way/Ridge Club Loop ft. west of Fairlawn Drive ft. west of Harcourt Avenue ft. east of Harcourt Avenue ft. east of Wingate Drive ft. west of Double Eagle Drive ft. west of PGA Boulevard ft. west of Oak Hill Manor Drive ft. east of Oak Hill Manor Drive ft. west of Tampa Avenue between Iglesia El Calvario and Royal Palm Apartment between Lake Ellenor Drive and Rio Grande Avenue between Hindu Temple and WalMart Driveway Existing Conditions
63 Table 20: Pedestrian and Bicycle Traffic Volumes at Signalized Intersections Pedestrian and Bicycle Crossing Location Pedestrian Volumes Bicycle Volumes AM Mid PM AM Mid PM Oak Ridge Road at Millenia Boulevard Oak Ridge Road at Harcourt Avenue Oak Ridge Road at Kingsgate Drive Oak Ridge Road at S John Young Parkway Oak Ridge Road at S Texas Avenue Oak Ridge Road at Rio Grande Avenue Oak Ridge Road at S Orange Blossom Trail The highest pedestrian and bicycle traffic volumes for mid block crossings were observed at the two (2) mid block crossings west of Double Eagle Drive and West of PGA Boulevard during PM hours, as shown in Table 19. It was observed that Westside Middle School, Orange County School Board, Chateau Orleans Apartments, and Sadler Elementary School generate the high volumes of pedestrian and bicycle in that area. At the signalized intersections along the study area corridor, the highest pedestrian and bicycle traffic volumes were observed at three intersections as shown in Table 20; Harcourt Avenue, Kingsgate Drive, and John Young Parkway during PM hours. Existing Conditions 59
64 Table 21: Pedestrian and Bicycle Counts *Pedestrian *Bicycle # Driveway Location Volumes Volumes AM PM AM PM 1 7 eleven East of Millenia Boulevard Fountains Apartments a Assembly of God Church northwest drive b Assembly of God Church northeast drive c C&J Center southwest driveway d C&J Center southeast driveway a Sadler Elementary School b Oak Ridge Crossings east driveway a Chateau Orleans Apartments north driveway b Orange County School Board a Race Trac Gas Station b M I Bandera Market c Orange Technical College Mid Florida Campus a Royal Palms Apartments west driveway b Bank of America a Royal Palms Apartments center driveway b Iglesia El Calvario a Royal Palms Apartments east driveway b Apache Plaza west driveway c Oak Ridge Plaza west driveway Apache Plaza east driveway Oak Ridge Plaza east driveway Casienna Apartments Super Saver Pharmacy west driveway a Public Storage Drive b Super Saver Pharmacy east driveway a Panaderia Taqueria Casas b Central Park Plaza c Orange County Fire Station a Hindu Temple b Southern College a Medical Village b Korean Restaurant west driveway c Korean Restaurant east driveway d WalMart e Veterinary Hospital west driveway f Veterinary Hospital east driveway *Volumes are based on 1 AM peak hour and 1 PM peak hour Pedestrian and Bicycle counts Figure 13 illustrates the pedestrian and bicycle counts at midblock crossings, signalized intersections, and driveways during the peak hour for each of the AM, mid day and PM periods. 60 Existing Conditions
65
66
67
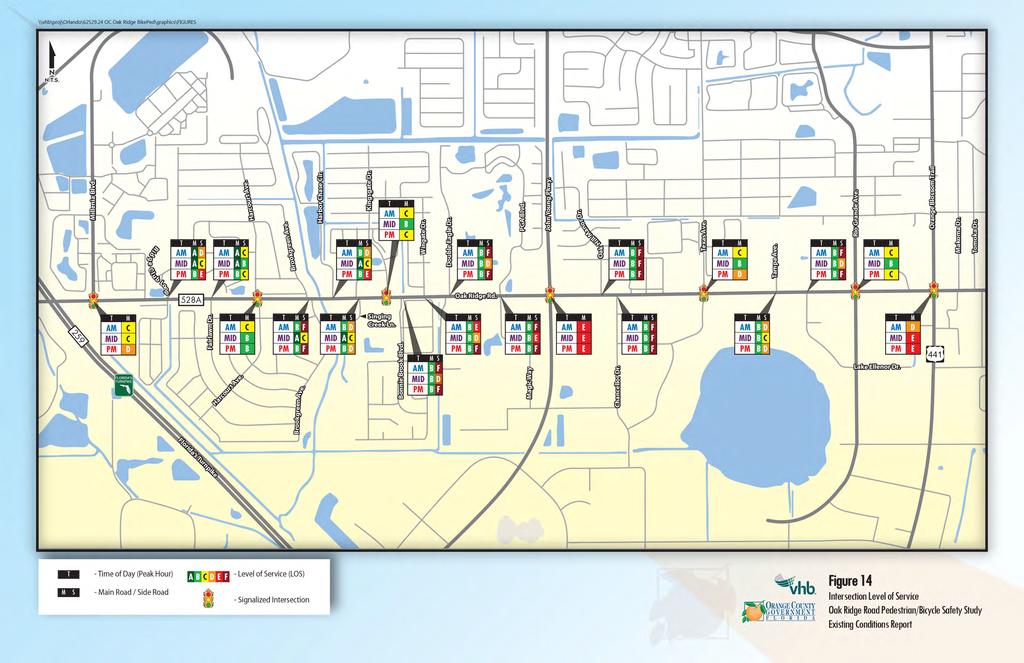
68 2.8.3 Existing Corridor Operations Summary The existing (2016) operational analysis was conducted to determine the Level of Service (LOS) for the study area intersections. The LOS for the study area intersections were determined using the procedures as outlined in the Highway Capacity Manual (HCM 2010) using Synchro Software (version 9.0) for both signalized and unsignalized intersections. The traffic signal timings used for the analysis were provided by Orange County and City of Orlando (for Oak Ridge Road and Millennia Boulevard). In addition to the LOS for the automotive mode, the LOS for bicycle and pedestrian modes was also evaluated for the crosswalks at the signalized intersections. There is no dedicated bicycle facility along Oak Ridge Road within the project limits. Automotive LOS A summary of the multimodal LOS results for the AM, mid day and PM peak hours are shown Table 22 thru Table 24, respectively, and in Figure 14. Based on the AM peak hour results for the automotive LOS, all the signalized intersections along Oak Ridge Road corridor, with the exception of Oak Ridge Road/John Young Parkway intersection, are observed to operate at LOS D or better in the AM peak hour. With the exception of the minor street approaches at Ridge Club Loop Road/Susie Way, Fairlawn Drive, Harbor Chase Circle, Singing Creek Lane and Tampa Avenue, all the other unsignalized intersections minor street approaches are observed to operate at LOS E or worse. During the mid day peak hour, the analysis results show that all the signalized intersections along Oak Ridge Road corridor, with the exception of Oak Ridge Road/John Young Parkway and Oak Ridge Road/Orange Blossom Trail intersections, operate at LOS D or better. For the unsignalized intersections along Oak Ridge Road, with the exception of the minor street approaches at PGA Boulevard at/magic Way, Oak Hill Manor Drive and Chancellor Drive, all the other unsignalized intersections are currently operating at LOS D or better. During the PM peak hour, the analysis results show that all the signalized intersections along Oak Ridge Road corridor, with the exception of Oak Ridge Road/John Young Parkway and Oak Ridge Road/Orange Blossom Trail intersections, operate at LOS D or better. For the unsignalized intersections along Oak Ridge Road, except the minor street approaches at Fairlawn Drive, Singing Creek Lane and Tampa Avenue, all the other unsignalized intersections are currently operating at LOS E or worse. PM peak hour had the higher traffic volumes and thereby higher delays among the three analysis peak periods. It is important to note that HCM 2010 Unsignalized Intersections module of Synchro may provide a delay estimate for the minor approaches at unsignalized intersections that may not reflect the short gap acceptance behavior of drivers wanting to cross Oak Ridge Road. Pedestrian/Bicycle LOS A summary of the multimodal LOS results for the AM, mid day and PM peak hours are also shown in Table 22 thru Table 24, respectively, and in Figure 14. Based on the AM peak hour results, the pedestrian/bicycle LOS at all the signalized intersections along the Oak Ridge Road corridor are observed at LOS D or better, with the exception of the Oak Ridge Road/John Young Parkway intersection, where the bicyclists crossing towards the eastbound and southbound directions operate at LOS E. During the mid day peak hour, the pedestrian/bicycle LOS results show LOS D or better at all the signalized intersections along Oak Ridge Road corridor. 64 Existing Conditions
69 During the PM peak hour, the pedestrian/bicycle LOS results show LOS D or better at the majority of the signalized intersections along Oak Ridge Road corridor, with a few exceptions. The bicycle LOS for a) the southbound approach at Oak Ridge Road/Millenia Blvd, b) the eastbound and westbound approaches at Oak Ridge Road/John Young Parkway and c) the eastbound approach at Oak Ridge Road/Orange Blossom Trail are observed to operate at LOS E during the PM peak hour conditions. Because there are no pedestrian refuge areas, the pedestrian/biclcyle LOS at the unsignalized stop locations all operate at LOS F. The absensce of pedestrian refuge areas at these locations result in pedestrians/bicyclists having to cross the five-lane section in one stage, versus the two-stages made possible with a mid-block crossing location. In terms of mi-block crossings, Table 25 shows the Level of Service and Delay during AM and PM peak periods at the existing mid block crossings along Oak Ridge Road in the study area. Pedestrian LOS (based on HCM 2010 methodology) at unsignalized crossings (including mid-block crossings) is determined by pedestrian delay. The pedestrian delay is largely based on vehicle volumes, speeds, and different crossing treatments that make drivers more likely to yield to pedestrians. For the Oak Ridge study, a median refuge in combination with high visibility signs and markings were observed at the majority of the mid-block crosswalks. The existing mid block crossings operate adversely during the AM and PM peak periods. Appendix G includes the Synchro reports for the AM, Mid-day and PM peak period analysis, and Appendix H includes the signal timings and seasonal factors used in the analysis. Existing Conditions 65
70 Table 22: Existing Intersection Multimodal LOS AM Peak Hour No Intersection Control Type Automobile Pedestrian Mode LOS Bicycle Mode LOS Delay (sec/veh) LOS EB WB NB SB EB WB NB SB 1 Oak Ridge Road and Millenia Boulevard Signal 33.7 C B B B C C D 2 Oak Ridge Road and Ridge Club Loop/Susie Way Stop 9.4/30.7 A/D 3 Oak Ridge Road and Fairlawn Drive Stop 9.8/18.5 A/C 4 Oak Ridge Road and Harcourt Avenue Signal 23.0 C C C A B C B C C 5 Oak Ridge Road and Brookgreen Avenue Stop 11.4/61.4 B/F 6 Oak Ridge Road and Harbor Chase Circle Stop 10.3/28.2 B/D 7 Oak Ridge Road and Singing Creek Lane Stop 10.7/26.6 B/D 8 Oak Ridge Road and Kingsgate Drive/Saddler School Signal 20.9 C C C A A C C A C 9 Oak Ridge Road and Bonnie Brook Boulevard Stop 11.8/67.1 B/F 10 Oak Ridge Road and Wingate Drive/Casa Del Ray Circle Stop 12.6/40.4 B/E 11 Oak Ridge Road and Double Eagle Drive Stop 12.6/75.3 B/F 12 Oak Ridge Road and PGA Boulevard/Magic Way Stop 12.8/89.4 B/F 13 Oak Ridge Road and John Young Parkway Signal 60.4 E C C C D E D D E 14 Oak Ridge Road and Oak Hill Manor Drive Stop 11.0/198.8 B/F 15 Oak Ridge Road and Chancellor Drive Stop 13.7/>300 B/F 16 Oak Ridge Road and Texas Avenue Signal 21.7 C C C B B C C B C 17 Oak Ridge Road and Tampa Avenue Stop 11.5/25.7 B/D 18 Oak Ridge Road and Lake Ellenor Drive Stop 11.1/214.3 B/F 19 Oak Ridge Road and Rio Grande Avenue Signal 29.8 C C C B B C C C C 20 Oak Ridge Road and Orange Blossom Trail Signal 52.5 D C C C C D D C D Note: Unsignalized intersection delay and LOS are reported for major street/minor street. Worst condition delay and LOS are reported for the major/minor street. 66 Existing Conditions
71 Table 23: Existing Intersection Multimodal LOS Mid day Peak Hour No Intersection Control Type Automobile Pedestrian Mode LOS Bicycle Mode LOS Delay (sec/veh) LOS EB WB NB SB EB WB NB SB 1 Oak Ridge Road and Millenia Boulevard Signal 28.5 C B B B C C D 2 Oak Ridge Road and Ridge Club Loop/Susie Way Stop 9.1/18.8 A/C 3 Oak Ridge Road and Fairlawn Drive Stop 9.1/13.7 A/B 4 Oak Ridge Road and Harcourt Avenue Signal 13.7 B B B A B B B C B 5 Oak Ridge Road and Brookgreen Avenue Stop 9.4/21.5 A/C 6 Oak Ridge Road and Harbor Chase Circle Stop 9.4/18.3 A/C 7 Oak Ridge Road and Singing Creek Lane Stop 9.8/17.7 A/C 8 Oak Ridge Road and Kingsgate Drive/Saddler School Signal 12.8 B C C A A B C A C 9 Oak Ridge Road and Bonnie Brook Boulevard Stop 10.1/29.2 B/D 10 Oak Ridge Road and Wingate Drive/Casa Del Ray Circle Stop 10.2/25.6 B/D 11 Oak Ridge Road and Double Eagle Drive Stop 10.2/27.6 B/D 12 Oak Ridge Road and PGA Boulevard/Magic Way Stop 10.9/37.4 B/E 13 Oak Ridge Road and John Young Parkway Signal 61.2 E C C C C D D D D 14 Oak Ridge Road and Oak Hill Manor Drive Stop 11.0/66.2 B/F 15 Oak Ridge Road and Chancellor Drive Stop 10.4/147.2 B/F 16 Oak Ridge Road and Texas Avenue Signal 15.2 B C C B B C C C C 17 Oak Ridge Road and Tampa Avenue Stop 10.4/22.7 B/C 18 Oak Ridge Road and Lake Ellenor Drive Stop 10.6/29.6 B/D 19 Oak Ridge Road and Rio Grande Avenue Signal 16.8 B C C B B C C C C 20 Oak Ridge Road and Orange Blossom Trail Signal 57.0 E C C C C D D C D Note: Unsignalized intersection delay and LOS are reported for major street/minor street. Worst condition delay and LOS are reported for the major/minor street. Existing Conditions 67
72 Table 24: Existing Intersection Multimodal LOS PM Peak Hour No Intersection Control Type Automobile Pedestrian Mode LOS Bicycle Mode LOS Delay (sec/veh) LOS EB WB NB SB EB WB NB SB 1 Oak Ridge Road and Millenia Boulevard Signal 48.8 D C C B C C E 2 Oak Ridge Road and Ridge Club Loop/Susie Way Stop 11.3/41.2 B/E 3 Oak Ridge Road and Fairlawn Drive Stop 11.7/24.5 B/C 4 Oak Ridge Road and Harcourt Avenue Signal 15.6 B C C A B C C C C 5 Oak Ridge Road and Brookgreen Avenue Stop 13.2/61.3 B/F 6 Oak Ridge Road and Harbor Chase Circle Stop 12.1/39.7 B/E 7 Oak Ridge Road and Singing Creek Lane Stop 12.4/27.0 B/D 8 Oak Ridge Road and Kingsgate Drive/Saddler School Signal 33.8 C C C A A C C A C 9 Oak Ridge Road and Bonnie Brook Boulevard Stop 13.1/227.2 B/F 10 Oak Ridge Road and Wingate Drive/Casa Del Ray Circle Stop 13.5/89.4 B/F 11 Oak Ridge Road and Double Eagle Drive Stop 13.6/>300 B/F 12 Oak Ridge Road and PGA Boulevard/Magic Way Stop 14.8/283.2 B/F 13 Oak Ridge Road and John Young Parkway Signal 78.6 E C C D D E E D D 14 Oak Ridge Road and Oak Hill Manor Drive Stop 14.0/>300 B/F 15 Oak Ridge Road and Chancellor Drive Stop 12.0/>300 B/F 16 Oak Ridge Road and Texas Avenue Signal 45.0 D C C B B D C C C 17 Oak Ridge Road and Tampa Avenue Stop 11.2/32.3 B/D 18 Oak Ridge Road and Lake Ellenor Drive Stop 12.8/78.2 B/F 19 Oak Ridge Road and Rio Grande Avenue Signal 28.0 C C C B B D C D C 20 Oak Ridge Road and Orange Blossom Trail Signal 67.9 E C C C C E D D D Note: Unsignalized intersection delay and LOS are reported for major street/minor street. Worst condition delay and LOS are reported for the major/minor street. 68 Existing Conditions
73 Table 25: Pedestrian LOS at Mid block Crossing Locations AM 2016 Existing PM 2016 Existing Intersection Midblock Location Delay Delay LOS LOS (sec/veh) (sec/veh) Oak Ridge Road at MB ft. east of Millenia Boulevard 41.4 E 94.0 F Oak Ridge Road at MB ft. west of Susie Way/Ridge Club Loop 41.4 E 69.0 F Oak Ridge Road at MB ft. west of Fairlawn Drive 46.6 F 71.2 F Oak Ridge Road at MB ft. west of Harcourt Avenue 45.6 F 68.0 F Oak Ridge Road at MB ft. east of Harcourt Avenue 46.5 F 74.1 F Oak Ridge Road at MB 6 68 ft. east of Wingate Drive 85.0 F F Oak Ridge Road at MB ft. west of Double Eagle Drive 85.0 F F Oak Ridge Road at MB ft. west of Pga Boulevard 78.0 F F Oak Ridge Road at MB ft. west of Oak Hill Manor Drive F F 1 Oak Ridge Road at MB ft. east of Oak Hill Manor Drive N/A N/A N/A N/A Oak Ridge Road at MB ft. west of Tampa Avenue 73.4 F F VHB, Inc. 1 Midblock Crossing is planned to be removed by the County due to the addition of a traffic signal Existing Conditions 69

74
75 2.9 Access Management Oak Ridge Road serves many abutting land uses, as discussed previously in Section 2.3. The presence of closely spaced driveways along an arterial and the entering and exiting vehicle movements creates conflict points for vehicles, pedestrians and bicyclists. While necessary to provide access to abutting land uses, there are instances where consolidation of driveways, and the management of median openings and signal spacing, are recommended to mitigate the conflict points to improve mobility and safety. For this reason, a survey of the driveway/connection, median opening, and signal spacing along the study area corridor was completed. Figure 15 through Figure 16 illustrate the existing driveway, intersection and median spacing along the corridor. Existing Conditions 71
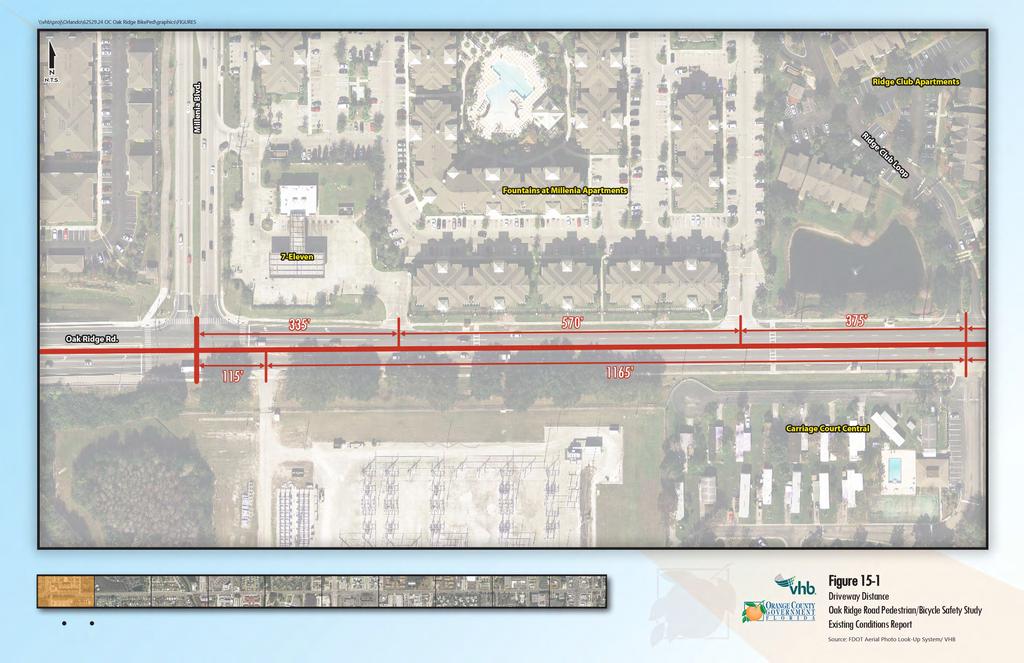
76

77
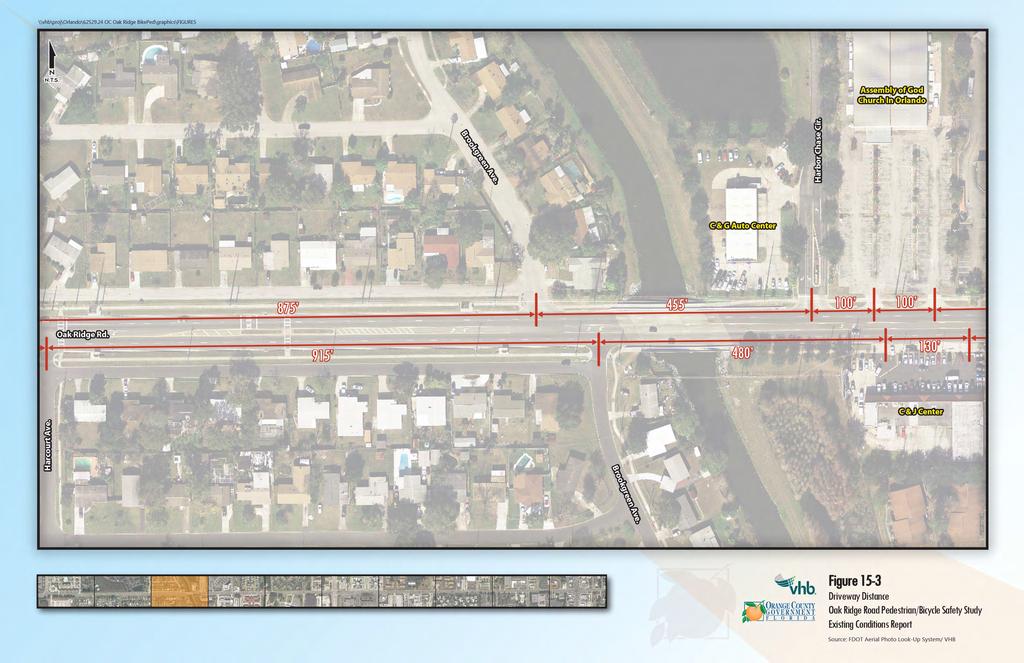
78
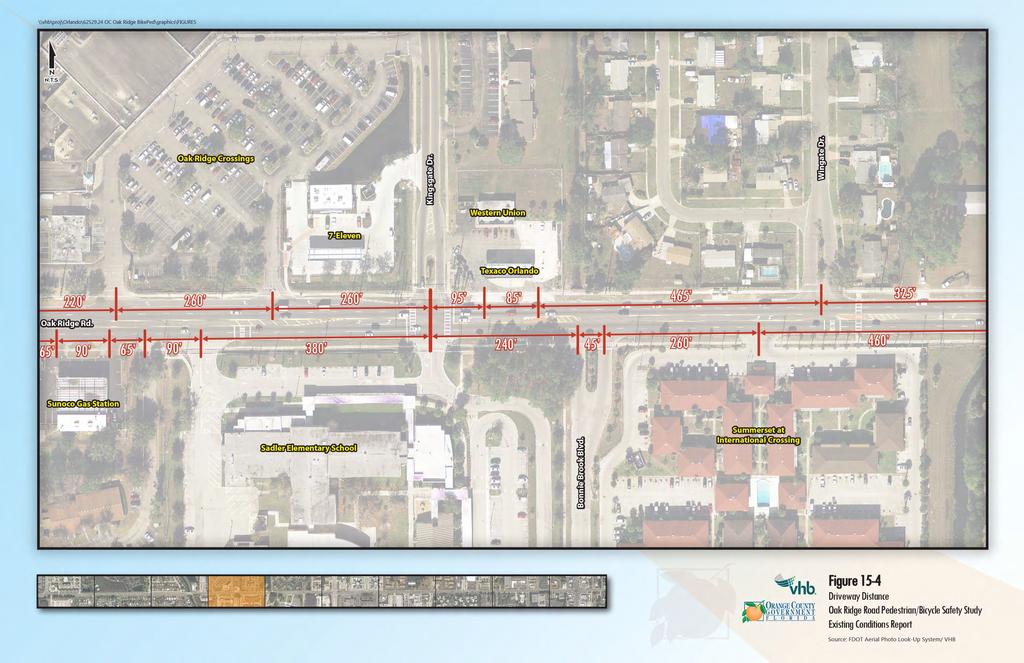
79
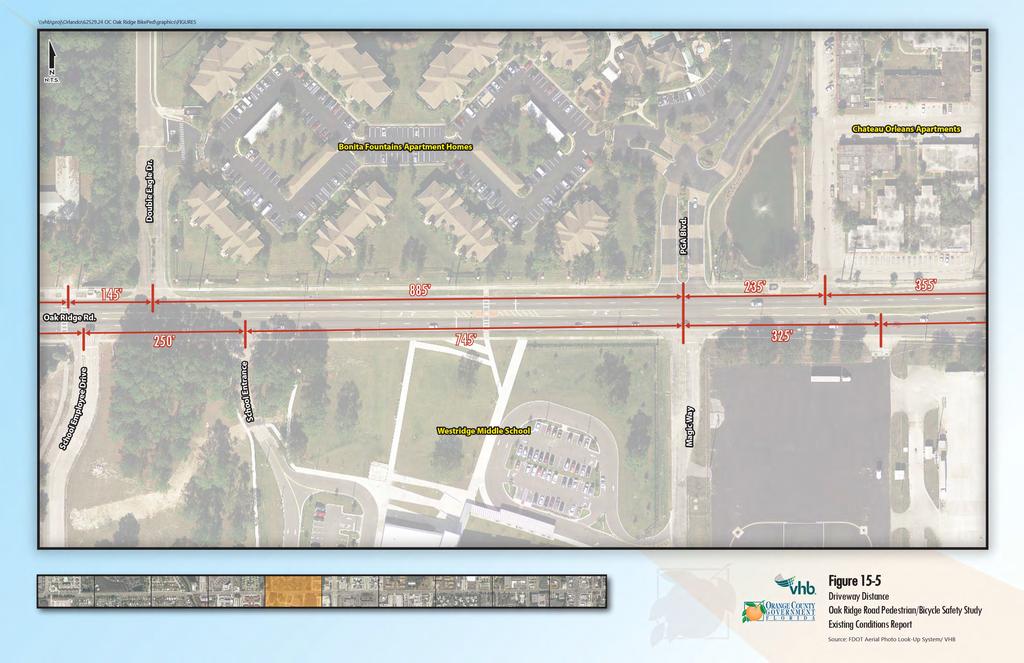
80

81
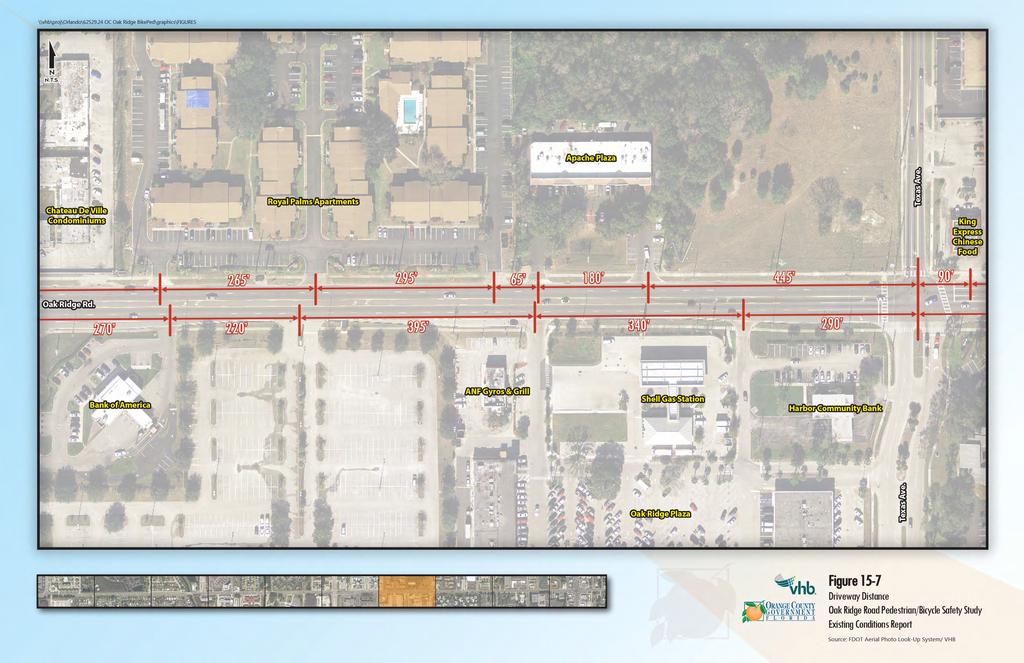
82
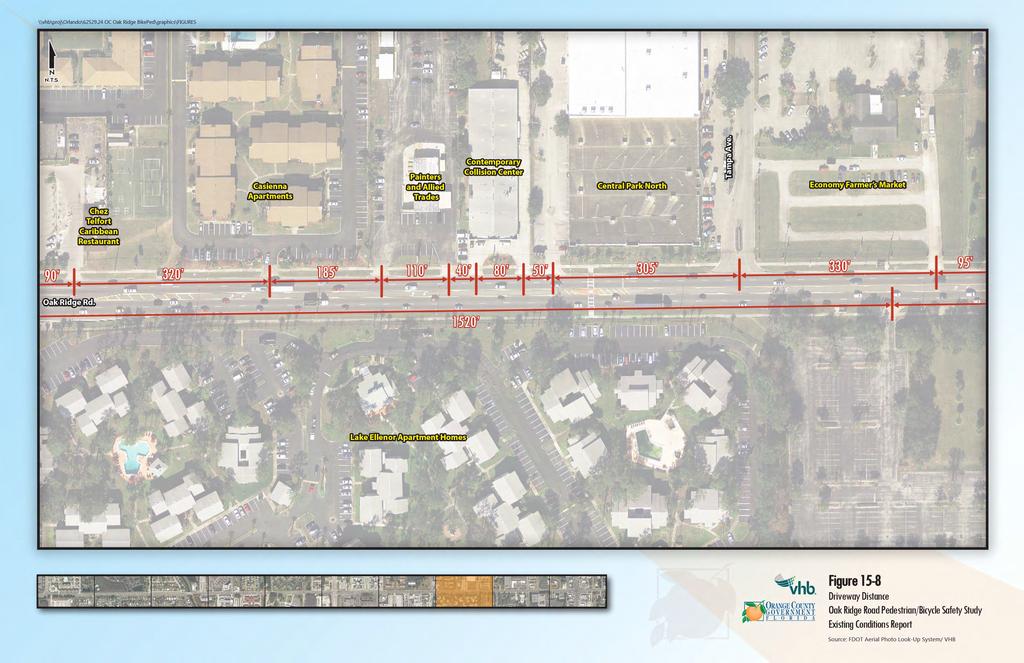
83

84
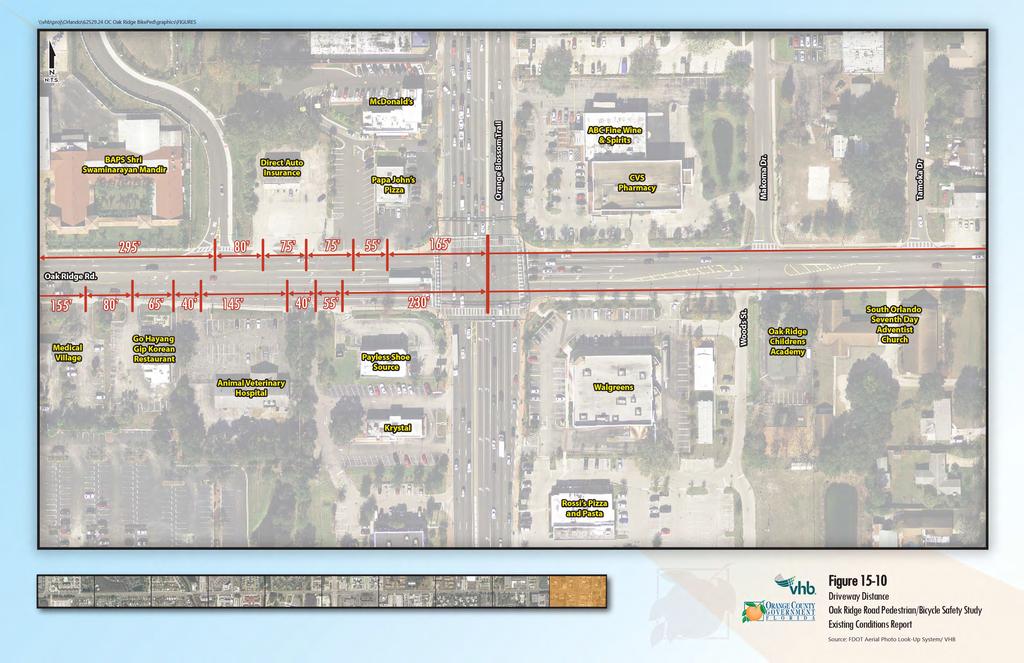
85
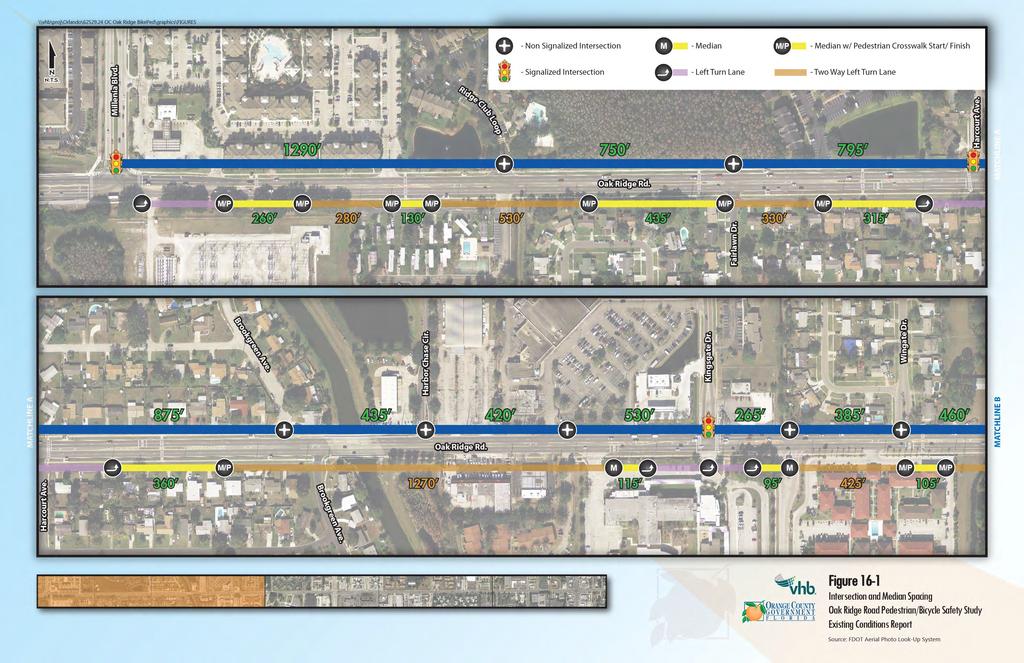
86
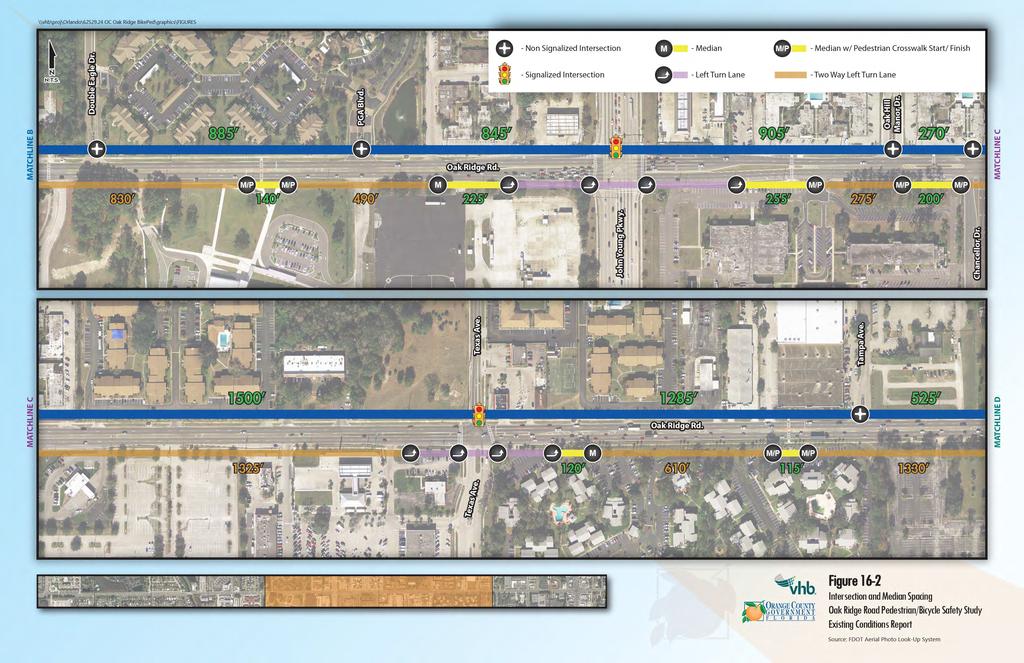
87
Orange Center Elementary School
 Drag and drop pic and stretch/crop to the limits of the blue rectangle (delete this text box) Orange Center Elementary School Drag and drop pic and stretch/crop to the limits of the blue rectangle (delete
Hidden Oaks Elementary School
 Hidden Oaks Elementary School SCHOOL ROUTE PLAN For HIDDEN OAKS ELEMENTARY SCHOOL LOCATION 13 ORANGE COUNTY Prepared for: ORANGE COUNTY SCHOOL ASSESSMENT PROGRAM ORANGE COUNTY PUBLIC WORKS Traffic Engineering
Waterford Lakes Small Area Study
 Waterford Lakes Small Area Study Existing Traffic Conditions PREPARED FOR: ORANGE COUNTY PUBLIC WORKS DEPARTMENT TRAFFIC ENGINEERING DIVISION ORLANDO, FLORIDA PREPARED WITH: INWOOD CONSULTING ENGINEERS
Windy Ridge Elementary School
 Windy Ridge Elementary School SCHOOL ROUTE PLAN For WINDY RIDGE ELEMENTARY SCHOOL LOCATION 54 ORANGE COUNTY Prepared for: ORANGE COUNTY SCHOOL ASSESSMENT PROGRAM ORANGE COUNTY PUBLIC WORKS Traffic Engineering
Pine Hills Road Pedestrian/Bicycle Safety Study Community Meeting #1
 Pine Hills Road Pedestrian/Bicycle Safety Study Community Meeting #1 June 8, 2017 Meeting Agenda Study Overview Community Survey Existing Conditions Access Management Potential Safety Countermeasures Potential
Meadow Woods Elementary School
 Drag and drop pic and stretch/crop to the limits of the blue rectangle (delete this text box) Meadow Woods Elementary School Drag and drop pic and stretch/crop to the limits of the blue rectangle (delete
Drag and drop pic and stretch/crop to the limits of the blue rectangle (delete this text box) Maxey Elementary School
 Maxey Elementary School") Drag and drop pic and stretch/crop to the limits of the blue rectangle (delete this text box) Maxey Elementary School SCHOOL ROUTE PLAN For MAXEY ELEMENTARY SCHOOL LOCATION 33 ORANGE COUNTY Prepared for:
Drag and drop pic and stretch/crop to the limits of the blue rectangle (delete this text box) Maxey Elementary School SCHOOL ROUTE PLAN For MAXEY ELEMENTARY SCHOOL LOCATION 33 ORANGE COUNTY Prepared for:
APPENDIX A: Complete Streets Checklist DRAFT NOVEMBER 2016
 APPENDIX A: Complete Streets Checklist DRAFT NOVEMBER 2016 Complete Streets Checklist MetroPlan Orlando s Complete Streets Checklist is an internal planning tool for staff to further implementation of
Pine Hills Road Pedestrian/Bicycle Safety Study Final Report APPENDIX C TECHNICAL MEMORANDUM 3: EXISTING CONDITIONS REPORT
 Final Report APPENDIX C TECHNICAL MEMORANDUM 3: EXISTING CONDITIONS REPORT Draft March 2017 On behalf of Orange County Mayor Teresa Jacobs, District 2 Commissioner Bryan Nelson and District 6 Commissioner
Complete Street Analysis of a Road Diet: Orange Grove Boulevard, Pasadena, CA
 Complete Street Analysis of a Road Diet: Orange Grove Boulevard, Pasadena, CA Aaron Elias, Bill Cisco Abstract As part of evaluating the feasibility of a road diet on Orange Grove Boulevard in Pasadena,
Durrance Elementary School
 Durrance Elementary School SCHOOL ROUTE PLAN For DURRANCE ELEMENTARY SCHOOL LOCATION 9 ORANGE COUNTY Prepared for: ORANGE COUNTY SCHOOL ASSESSMENT PROGRAM ORANGE COUNTY PUBLIC WORKS Traffic Engineering
Transportation Planning Division
 Transportation Planning Division Presentation Outline Study Tasks Recap of Previous Meetings Data Collected Focus Areas within Study Limits Design Principles Tool Box Recommended Concepts Schedule Moving
FLORIDA DEPARTMENT OF TRANSPORTATION DISTRICT 7 DISTRICT WIDE BICYCLE/PEDESTRIAN ACCESS TO TRANSIT SAFETY ASSESSMENT AND IMPROVEMENT PLAN
 FLORIDA DEPARTMENT OF TRANSPORTATION DISTRICT 7 DISTRICT WIDE BICYCLE/PEDESTRIAN ACCESS TO TRANSIT SAFETY ASSESSMENT AND IMPROVEMENT PLAN TRANSIT SAFETY ASSESSMENT SR 55/US 19 AT 80 TH AVE N DRAFT JUNE
MEMORANDUM. Charlotte Fleetwood, Transportation Planner
 MEMORANDUM Date: Updated August 22, 2017 To: Organization: Charlotte Fleetwood, Transportation Planner Boston Transportation Department From: Jason DeGray, P.E., PTOE, Regional Director of Engineering
APPENDIX G: INTERSECTION NEEDS AT OKEECHOBEE BOULEVARD
 APPENDIX G: INTERSECTION NEEDS AT OKEECHOBEE BOULEVARD INTERSECTION NEEDS AT SR 7 and OKEECHOBEE BOULEVARD SR 7 Extension Project Development and Environment (PD&E) Study From Okeechobee Boulevard (SR
City of Gainesville Transportation/Roadway Needs PROJECT SUMMARY
 A1 Roadway Resurfacing $23,846,000 TYPE: Preservation of existing system Roadway resurfacing A2 Signal Replacement $6,000,000 TYPE: Preservation of existing system Replace traffic signals. B1 W 6th St
FINAL DESIGN TRAFFIC TECHNICAL MEMORANDUM
 FINAL DESIGN TRAFFIC TECHNICAL MEMORANDUM July 2014 FINAL (SR 43) Project Development and Environment Study From State Road 60 (Adamo Drive) to I-4 (SR 400) Hillsborough County, Florida Work Program Item
TRANSPORTATION ANALYSIS REPORT US Route 6 Huron, Erie County, Ohio
 TRANSPORTATION ANALYSIS REPORT US Route 6 Huron, Erie County, Ohio December 12, 2012 Prepared for: The City of Huron 417 Main Huron, OH 44839 Providing Practical Experience Technical Excellence and Client
Lake Whitney Elementary School
 Lake Whitney Elementary School SCHOOL ROUTE PLAN For LAKE WHITNEY ELEMENTARY SCHOOL LOCATION 18 ORANGE COUNTY Prepared for: ORANGE COUNTY SCHOOL ASSESSMENT PROGRAM ORANGE COUNTY PUBLIC WORKS Traffic Engineering
NJDOT Complete Streets Checklist
 Background The New Jersey Department of Transportation s Complete Streets Policy promotes a comprehensive, integrated, connected multi-modal network by providing connections to bicycling and walking trip
SCHOOL ROUTE PLAN. For HUNTER S CREEK ELEMENTARY SCHOOL LOCATION 14 ORANGE COUNTY. Prepared for:
 SCHOOL ROUTE PLAN For HUNTER S CREEK ELEMENTARY SCHOOL LOCATION 14 ORANGE COUNTY Prepared for: ORANGE COUNTY SCHOOL ASSESSMENT PROGRAM ORANGE COUNTY PUBLIC WORKS Traffic Engineering Division 42 South John
Pine Hills Road Pedestrian/Bicycle Safety Study Board of County Commissioners Work Session
 Pine Hills Road Pedestrian/Bicycle Safety Study Board of County Commissioners Work Session February 20, 2018 Meeting Agenda Study Overview Existing Conditions Access Management Potential Gateway Features
ALLEY 24 TRAFFIC STUDY
 ALLEY 24 TRAFFIC STUDY in City of Frostburg, Maryland January 2013 3566 Teays Valley Road Hurricane, WV Office: (304) 397-5508 www.denniscorporation.com Alley 24 Traffic Study January 2013 Frostburg, Maryland
5 CIRCULATION AND STREET DESIGN
 5 CIRCULATION AND STREET DESIGN This chapter describes circulation and streetscape improvements proposed for the Northwest Chico Specific Plan Area. It includes detailed design specifications for existing
The current document is revised based on the comments received on:
 General Overview 1 Introduction Over the last several years, the Waterford Lakes area has experienced increased congestion due to a substantial increase in residential and commercial development. The current
Traffic Impact Study. Westlake Elementary School Westlake, Ohio. TMS Engineers, Inc. June 5, 2017
 TMS Engineers, Inc. Traffic Impact Study Westlake Elementary School Westlake, Ohio June 5, 2017 Prepared for: Westlake City Schools - Board of Education 27200 Hilliard Boulevard Westlake, OH 44145 TRAFFIC
Multi-Modal Traffic Analysis. Parisi and Associates
 Mill Valley to Corte Madera Bicycle and Pedestrian Corridor Study Appendix D: Multi-Modal Traffic Analysis Prepared by Parisi and Associates August 2009 Appendix D - Multi-Modal Traffic Analysis Table
6.0 PEDESTRIAN AND BICYCLE FACILITIES 6.1 INTRODUCTION 6.2 BICYCLE DEMAND AND SUITABILITY Bicycle Demand
 6.0 PEDESTRIAN AND BICYCLE FACILITIES 6.1 INTRODUCTION Bicycle and pedestrian travel along and in the vicinity of the corridor is part of the vision of Somerset and Hunterdon counties and the integrated
Multimodal Through Corridors and Placemaking Corridors
 68 Multimodal Through Corridors and Placemaking Corridors Corridors have different functions in a region. Some corridors are used to get smoothly and rapidly through a region or to get quickly to major
TRAFFIC IMPACT ANALYSIS
 TRAFFIC IMPACT ANALYSIS FOR THE CHAMPAIGN UNIT#4 SCHOOL DISTRICT PROPOSED HIGH SCHOOL (SPALDING PARK SITE) IN THE CITY OF CHAMPAIGN Final Report Champaign Urbana Urbanized Area Transportation Study 6/24/2014
Overview. Existing Conditions. Corridor Description. Assessment
 Overview A study of the 23 rd Street corridor was undertaken to document the existing conditions, analyze traffic operations, and recommend remedies for deficient situations Although 23 rd Street is frequently
5858 N COLLEGE, LLC N College Avenue Traffic Impact Study
 5858 N COLLEGE, LLC nue Traffic Impact Study August 22, 2016 Contents Traffic Impact Study Page Preparer Qualifications... 1 Introduction... 2 Existing Roadway Conditions... 5 Existing Traffic Conditions...
Transportation Impact Study for Abington Terrace
 Transportation Impact Study for Abington Terrace Abington Township, Montgomery County, PA Sandy A. Koza, P.E., PTOE PA PE License Number PE059911 Prepared by McMahon Associates, Inc. 425 Commerce Drive,
Final Sidewalk Feasibility Study
 Garfield Drive From Anastasia Drive to Elizabeth Place City of South Daytona July 23, 2009 Final Sidewalk Feasibility Study Prepared for: Prepared by: Final Sidewalk Feasibility Study Garfield Drive 2
US 41 COMPLETE STREETS CORRIDOR PLANNING STUDY from University Parkway to Whitfield Avenue
 41 US 41 COMPLETE STREETS CORRIDOR PLANNING STUDY from University Parkway to Whitfield Avenue EXECUTIVE SUMMARY DRAFT FEBRUARY 2019 Project Overview The US 41 Complete Streets Corridor Planning Study,
CITY OF COCOA BEACH 2025 COMPREHENSIVE PLAN. Section VIII Mobility Element Goals, Objectives, and Policies
 CITY OF COCOA BEACH 2025 COMPREHENSIVE PLAN Section VIII Mobility Element Goals, Objectives, and Policies Adopted August 6, 2015 by Ordinance No. 1591 VIII MOBILITY ELEMENT Table of Contents Page Number
CURBSIDE ACTIVITY DESIGN
 5 CURBSIDE ACTIVITY DESIGN This chapter provides design guidance for separated bike lanes adjacent to curbside activities including parking, loading and bus stops. Typical configurations are presented
Waterford Lakes Small Area Study
 Over the last several years, the Waterford Lakes area has experienced increased congestion due to a substantial increase in residential and commercial development. The current Existing and Future Conditions
Date: April 4, Project #: Re: A Street/Binford Street Traffic/Intersection Assessment
 To: Peter Cavanaugh General Electric From: David Bohn, PE Ryan White, PE Date: April 4, 217 Project #: 13421. Re: / Traffic/Intersection Assessment Consistent with the Cooperation Agreement between the
West Dimond Blvd Upgrade Jodhpur Street to Sand Lake Road
 West Dimond Blvd Jodhpur St to Sand Lake CSS Transportation Project Summary Municipality of Anchorage Project # 05 005 Project Manager: John Smith, P.E. (MOA PM&E) Project Administrator: Julie Makela,
Draft North Industrial Area-Wide Traffic Plan
 Summary of North Industrial and Hudson Bay Industrial Recommended Improvements Table 1. Summary of s Item Location 1 2 3 4 5 6 7 8 9 10 11 12 Millar Ave north of 51st St Super 8 Motel back lane 400 Block
HENDERSON DEVELOPMENT 213, 217, 221, 221 ½, 223 HENDERSON AVENUE and 65 TEMPLETON STREET OTTAWA, ONTARIO TRANSPORTATION OVERVIEW.
 HENDERSON DEVELOPMENT 213, 217, 221, 221 ½, 223 HENDERSON AVENUE and 65 TEMPLETON STREET OTTAWA, ONTARIO TRANSPORTATION OVERVIEW Prepared for: 2294170 Ontario Inc. February 2, 2017 117-652 Report_1.doc
CITY OF WEST LAKE HILLS. Forest View Neighborhood Traffic Calming Study
 CITY OF WEST LAKE HILLS 901 South Mopac Expressway Building V, Suite 220 Austin, Texas 78746 Texas P.E. Firm Registration No. F-929 Klotz Associates Final Report Submittal: March 20, 2015 Revised Final
Active Transportation Facility Glossary
 Active Transportation Facility Glossary This document defines different active transportation facilities and suggests appropriate corridor types. Click on a facility type to jump to its definition. Bike
1609 E. FRANKLIN STREET HOTEL TRAFFIC IMPACT STUDY EXECUTIVE SUMMARY
 1609 E. FRANKLIN STREET HOTEL TRAFFIC IMPACT STUDY EXECUTIVE SUMMARY Prepared for: The Town of Chapel Hill Public Works Department Traffic Engineering Division Prepared by: HNTB North Carolina, PC 343
Transportation Planning Division
 Transportation Planning Division Presentation Outline Study Tasks Recap of Previous Meeting Stakeholder Interviews Data Collection Design Principles Tool Box Recommendations Schedule Moving Forward North
Traffic Impact Memorandum. May 22, 2018
 BISHOP PROFESSIONAL DEVELOPMENT BUILDING Proposed Land-use Change & Parking Modification 3601 SW 31st Street Topeka, Kansas 66614 CFS Project No. 185077 Traffic Impact Memorandum May 22, 2018 Prepared
OTTAWA TRAIN YARDS PHASE 3 DEVELOPMENT CITY OF OTTAWA TRANSPORTATION IMPACT STUDY. Prepared for:
 OTTAWA TRAIN YARDS PHASE 3 DEVELOPMENT CITY OF OTTAWA TRANSPORTATION IMPACT STUDY Prepared for: The Ottawa Train Yards Inc. 223 Colonnade Road South, Suite 212 Nepean, Ontario K2E 7K3 January 17, 2012
Anne Arundel County BICYCLE, PEDESTRIAN, TRANSIT ASSESSMENT GUIDELINES
 Anne Arundel County BICYCLE, PEDESTRIAN, TRANSIT ASSESSMENT GUIDELINES December 2018 TABLE OF CONTENTS I. Executive Summary 3 II. When Is A Bicycle Pedestrian Transit Assessment (BPTA) Required? 4 III.
Duwamish Way-finding and CTR Report
 V. North Tukwila When the North Tukwila Manufacturing and Industrial Center was designated in 1992 as part of the region s land use and transportation plan, the plan called for the area to set a light-rail
Comments EXECUTIVE SUMMARY
 Comments 1. Under any Alternatives, MCDOT should provide better at-grade pedestrian crossing of Georgia Avenue and Forest Glen Road, including improved crosswalks with wider medians and adequate signal
Pine Hills Road Pedestrian/Bicycle Safety Study Final Report
 4.6.2 Pedestrian and Bicycle Traffic Volumes As presented in an earlier section, crosswalks are provided at mid-block crossings, signalized intersections, unsignalized intersections and at major driveways.
Route 7 Corridor Study
 Route 7 Corridor Study Executive Summary Study Area The following report analyzes a segment of the Virginia State Route 7 corridor. The corridor study area, spanning over 5 miles in length, is a multi
Traffic Impact Study for Rolling Ridge Redevelopment
 Traffic Impact Study for Rolling Ridge Redevelopment Webster Groves, Missouri October 19, 2018 Prepared For: Gershman Commercial Real Estate 150 North Meramec Avenue Suite 500 St. Louis, Missouri 63105
Traffic Impact Statement
 Traffic Impact Statement Mixed Use Development, US 41 and Old Trail Drive aka Tide-Starbucks 4900 9 th Street North General Development Site Plan (GDSP) Collier County, FL 10/6/2015 Prepared for: Prepared
Traffic Impact Analysis Chatham County Grocery Chatham County, NC
 Chatham County Grocery Chatham County, NC TABLE OF CONTENTS 1. INTRODUCTION... 1 1.1. Location and Study Area... 1 1.2. Proposed Land Use and Access... 2 1.3. Adjacent Land Uses... 2 1.4. Existing ways...
Off-road Trails. Guidance
 Off-road Trails Off-road trails are shared use paths located on an independent alignment that provide two-way travel for people walking, bicycling, and other non-motorized users. Trails specifically along
BICYCLE LEVEL OF SERVICE for URBAN STREETS. Prepared by Ben Matters and Mike Cechvala. 4/16/14 Page 1
 BICYCLE LEVEL OF SERVICE for URBAN STREETS Prepared by Ben Matters and Mike Cechvala 4/16/14 Page 1 Introduction The methodology used for the Bicycle (BLOS) analysis is from the Highway Capacity Manual
What Is a Complete Street?
 Session 5 Charleen Zimmer, AICP, Zan Associates May 5-7, 2010 What Is a Complete Street? May 2010 5-1 Not a Complete Street More of a Complete Street May 2010 5-2 Benefits of Complete Streets Safety for
Waterford Lakes Small Area Study Report
 Waterford Lakes Small Area Study Report Orange County District 4 Prepared for: Orange County Public Works Department Traffic Engineering Division 4200 S. John Young Parkway Orlando, FL 32839-9205 Prepared
Henderson Avenue Mixed-Use Development
 Zoning Case: Z145-3 Traffic Impact Analysis Henderson Avenue Mixed-Use Development Dallas, TX October 26 th, 216 Kimley-Horn and Associates, Inc. Dallas, Texas Project #644827 Registered Firm F-928 Traffic
THIS PAGE LEFT BLANK INTENTIONALLY
 GA SR 25 Spur at Canal Road Transportation Impact Analysis PREPARED FOR GLYNN COUNTY, GEORGIA 1725 Reynolds Street, Suite 300 Brunswick, Georgia 31520 PREPARED BY 217 Arrowhead Boulevard Suite 26 Jonesboro,
Appendix C. NORTH METRO STATION AREA TRAFFIC IMPACT STATEMENT 88th Avenue Station
 Appendix C NORTH METRO STATION AREA TRAFFIC IMPACT STATEMENT 88th Avenue Station Prepared for: Regional Transportation Department and URS Corporation as part of the North Metro EIS David Evans and Associates,
TOWN OF IRONDEQUOIT ACTIVE TRANSPORTATION PLAN
 TOWN OF IRONDEQUOIT March 2017 FINAL DRAFT: EXECUTIVE SUMMARY PREPARED FOR SUBMITTED BY IN ASSOCIATION WITH Town of Barton & Loguidice, DPC Sprinkle Consulting, Inc. 1280 Titus Avenue Rochester, New York
Feasibility Study of Pedestrian Crossings Along Route 7, East of Cascades Parkway and West of Dranesville Road. October 3, 2017
 Feasibility Study of Pedestrian Crossings Along Route 7, East of Cascades Parkway and West of Dranesville Road October 3, 2017 Study Area (area within a ¼-mile radius of the study intersections) Route
This page intentionally left blank.
 This page intentionally left blank. COMMUNITY Coweta Community Overview Coweta Coweta, a residential community located in Wagoner County, is a suburb of Tulsa situated southeast of the metropolitan area
Appendix A: Crosswalk Policy
 Appendix A: Crosswalk Policy Appendix A: Crosswalk Policy Introduction This citywide Crosswalk Policy is aimed at improving pedestrian safety and enhancing pedestrian mobility by providing a framework
Bicycle and Pedestrian Facilities Toolbox (Excerpt from Figure 3.1)
") Appendix B Neighborhood Connections Summaries This Appendix is a supplement to the information presented in Chapter 3 Connect People. The Appendix includes a summary or profile for each of the proposed
Appendix B Neighborhood Connections Summaries This Appendix is a supplement to the information presented in Chapter 3 Connect People. The Appendix includes a summary or profile for each of the proposed
SETTINGS AND OPPORTUNITIES MOBILITY & ACCESS
 7 mobility & access how do people use el camino what is it like to drive on el camino/to park along el camino what is the pedestrian experience like what is the role of transit along the corridor what
Ottawa Beach Road Study
 Ottawa Beach Road Study Prepared For: Park Township September 30, 2014 Project No. G140303 OTTAWA BEACH ROAD STUDY PREPARED FOR: PARK TOWNSHIP SEPTEMBER 30, 2014 PROJECT NO. G140303 TABLE OF CONTENTS 1.0
Proposed Action, Purpose and Need Technical Memorandum
 Proposed Action, Purpose and Need Technical Memorandum MoPac (State Loop 1) Intersections, Austin District From North of Slaughter Lane to South of La Crosse Avenue CSJ: 3136-01-015 Travis County, Texas
List of Exhibits...ii
 One Brickell Traffic Study TABLE OF CONTENTS List of Exhibits...ii EXECUTIVE SUMMARY...1 1. INTRODUCTION...2 1.1 Study Area...2 1.2 Study Objective...5 2. EXISTING TRAFFIC CONDITIONS...6 2.1 Data Collection...6
Planning Study SR 976. Project Advisory Team Meeting May 24, 2017
 ` SR 976 BIRD ROAD/SW 40TH STREET FROM SR 821/HEFT TO SR 5/US-1 Miami-Dade County, Florida FPID No.: 434845-4-22-01 Planning Study Project Advisory Team Meeting May 24, 2017 1 Agenda Introductions Project
Public Involvement Meeting Tuesday, June 13, Albany Shaker Road Corridor Study
 Public Involvement Meeting Tuesday, June 13, 2017 Albany Shaker Road Corridor Study Agenda / Meeting Outline 1. Introduce the project 2. Complete Streets 3. Share/confirm our findings 4. Your Opinion 5.
o n - m o t o r i z e d transportation is an overlooked element that can greatly enhance the overall quality of life for the community s residents.
 N o n - m o t o r i z e d transportation is an overlooked element that can greatly enhance the overall quality of life for the community s residents. 84 Transportation CHAPTER 11 INTRODUCTION Transportation
CAPITOL DRIVE & FOND DU LAC AVENUE INTERSECTION ANALYSIS. Urban Planning 772 SARAH BREGANT, RYAN PETERSON, & MATT WERDERITCH
 CAPITOL DRIVE & FOND DU LAC AVENUE INTERSECTION ANALYSIS Urban Planning 772 SARAH BREGANT, RYAN PETERSON, & MATT WERDERITCH OVERVIEW N 51 ST BOULEVARD N 51 ST BOULEVARD 12,100 44,700 W CAPITOL DRIVE 52,600
METHODOLOGY. Signalized Intersection Average Control Delay (sec/veh)
") Chapter 5 Traffic Analysis 5.1 SUMMARY US /West 6 th Street assumes a unique role in the Lawrence Douglas County transportation system. This principal arterial street currently conveys commuter traffic
Chapter 5 Traffic Analysis 5.1 SUMMARY US /West 6 th Street assumes a unique role in the Lawrence Douglas County transportation system. This principal arterial street currently conveys commuter traffic
C C C
 C-012-001 Thank you for your support for the creation of new public space and nonmotorized access between downtown and the waterfront through the Overlook Walk, the East-West Connections, and the Promenade.
SAFE ROUTES TO SCHOOL
 SAFE ROUTES TO SCHOOL Forest Ridge Elementary School Existing Conditions and ACTION PLAN > Oak Creek - Franklin Joint School District Table of Contents CONTEXT Enrollment Boundaries
SECTION 1 - TRAFFIC PLANNING
 SECTION 1 - TRAFFIC PLANNING 1.1 TRAFFIC OPERATIONS 1.1.1 Roadway Functional Classification The Multnomah County Comprehensive Framework Plan s Policy 34: Trafficways and the Functional Classification
J Street and Folsom Boulevard Lane Conversion Project (T ) Before and After Traffic Evaluation
 Before and After Traffic Evaluation") J Street and Folsom Boulevard Lane Conversion Project (T15125400) Before and After Traffic Evaluation Prepared by Transportation Division June 2014 Executive Summary On February 12, 2013, the City of Sacramento
J Street and Folsom Boulevard Lane Conversion Project (T15125400) Before and After Traffic Evaluation Prepared by Transportation Division June 2014 Executive Summary On February 12, 2013, the City of Sacramento
TRAFFIC IMPACT STUDY And A TRAFFIC SIGNAL WARRANT ANALYSIS FOR A SENIOR LIVING AND APARTMENT DEVELOPMENT
 TRAFFIC IMPACT STUDY And A TRAFFIC SIGNAL WARRANT ANALYSIS FOR A SENIOR LIVING AND APARTMENT DEVELOPMENT DEERFIELD TOWNSHIP, WARREN COUNTY, OHIO Nantucket Circle and Montgomery Road () Prepared for: ODLE
AGENDA ITEM 6 D THOMASVILLE ROAD (HERMITAGE BOULEVARD TO LIVE OAK PLANTATION ROAD) ROADWAY SAFETY AUDIT
 ROADWAY SAFETY AUDIT") May 15, 2018 AGENDA ITEM 6 D THOMASVILLE ROAD (HERMITAGE BOULEVARD TO LIVE OAK PLANTATION ROAD) ROADWAY SAFETY AUDIT TYPE OF ITEM: Discussion STATEMENT OF ISSUE The Florida Department of Transportation
May 15, 2018 AGENDA ITEM 6 D THOMASVILLE ROAD (HERMITAGE BOULEVARD TO LIVE OAK PLANTATION ROAD) ROADWAY SAFETY AUDIT TYPE OF ITEM: Discussion STATEMENT OF ISSUE The Florida Department of Transportation
SR 907 (Alton Road) between Barry Street and 41 st Street
 between Barry Street and 41 st Street") TWO 20 Pedestrian Safety Study SR 907 (Alton Road) between Barry Street and 41 st Street Miami Beach, Miami-Dade County DRAFT Florida Department of Transportation District VI June 2014 TWO 20 Pedestrian
TWO 20 Pedestrian Safety Study SR 907 (Alton Road) between Barry Street and 41 st Street Miami Beach, Miami-Dade County DRAFT Florida Department of Transportation District VI June 2014 TWO 20 Pedestrian
Chapter 4 Traffic Analysis
 Chapter 4 Traffic Analysis PURPOSE The traffic analysis component of the K-68 Corridor Management Plan incorporates information on the existing transportation network, such as traffic volumes and intersection
DEPARTMENT OF ENVIRONMENTAL SERVICES. North Harrison Street (Lee Highway to Little Falls Road) Comparative Analysis. Prepared for:
 Comparative Analysis. Prepared for:") DEPARTMENT OF ENVIRONMENTAL SERVICES North Harrison Street (Lee Highway to Little Falls Road) Comparative Analysis Prepared for: Arlington County Department of Environmental Services 2100 Clarendon Boulevard,
DEPARTMENT OF ENVIRONMENTAL SERVICES North Harrison Street (Lee Highway to Little Falls Road) Comparative Analysis Prepared for: Arlington County Department of Environmental Services 2100 Clarendon Boulevard,
PEDESTRIAN SAFETY STUDY
 PEDESTRIAN SAFETY STUDY SR 699 (BLIND PASS RD/GULF BLVD) FROM 93 RD AVENUE TO PINELLAS BAYWAY PINELLAS COUNTY SECTION NO.: 15100 MILEPOST: 0.111 3.569 STUDY LIMITS Prepared For: Florida Department of Transportation
Agenda. Overview PRINCE GEORGE S PLAZA METRO AREA PEDESTRIAN PLAN
 PRINCE GEORGE S PLAZA METRO AREA PEDESTRIAN PLAN May 28, 2008 Agenda Welcome and introductions Project overview and issue identification Planning context and strengths Design challenges and initial recommendations
54 th Avenue North Complete Streets Concept Plan
 54 th Avenue North Complete Streets Concept Plan June 2018 TABLE OF CONTENTS Introduction and Purpose...1 Existing Conditions...5 Stakeholder and Public Outreach...15 Preferred Options West Segment...19
Appendix B. Environmental Resource Technical Memorandum. Assessment on Travel Pattern and Access Impacts
 Appendix B Environmental Resource Technical Memorandum Assessment on Travel Pattern and Access Impacts TECHNICAL MEMORANDUM ENVIRONMENTAL RE-EVALUATION FOR UNION STATION TO OAK CLIFF DALLAS STREETCAR To:
City of Albert Lea Policy and Procedure Manual 4.10 ALBERT LEA CROSSWALK POLICY
 4.10 ALBERT LEA CROSSWALK POLICY PURPOSE: Pedestrian crosswalks are an integral part of our transportation infrastructure. To be effective and promote safety, marked crosswalks must be installed after
This chapter describes the proposed circulation system and transportation alternatives associated with
 5.0 Circulation 5.1 OVERVIEW This chapter describes the proposed circulation system and transportation alternatives associated with West Landing, and summarize the information contained in the Existing
INDUSTRIAL BUILDING 3009 HAWTHORNE ROAD CITY OF OTTAWA TRANSPORTATION OVERVIEW REVISED. Prepared for: Canada Inc.
 INDUSTRIAL BUILDING 3009 HAWTHORNE ROAD CITY OF OTTAWA TRANSPORTATION OVERVIEW REVISED Prepared for: 7849648 Canada Inc. Octiober 1, 2015 114-598 Overview_2.doc D. J. Halpenny & Associates Ltd. Consulting
July 5, Arthur R. Ware, Jr. Elementary School 2017 Safe Routes to School Walkabout Report
 July 5, 2017 Arthur R. Ware, Jr. Elementary School 2017 Safe Routes to School Walkabout Report 1 Walkabout Report Introduction On April 28, 2017, City, School, and SAWMPO staff met to conduct a Safe Routes
APPENDIX E: Transportation Technical Report
 New Jersey Pennsylvania Lackawanna Cut-Off Passenger Rail Service Reston Project Environmental Assessment APPENDIX E: Transportation Technical Report E.1 Introduction As part of the overall environmental
COMMUNITY MEETING AGENDA
 COMMUNITY MEETING AGENDA Welcome and Introductions SAFE Presentation Project Presentation Priorities Feedback Next Steps Q&A Santa Cruz Avenue Corridor Study 1 Santa Cruz Avenue Corridor Study Community
Harrah s Station Square Casino
 Transportation Analysis Harrah s Station Square Casino Pittsburgh, Pennsylvania Submitted To: City of Pittsburgh and Pennsylvania Gaming Control Board Prepared By: DKS Associates GAI Consultants December
PEDESTRIAN ACTION PLAN
 ATTACHMENT 2 CITY OF SANTA MONICA PEDESTRIAN ACTION PLAN CITY OF SANTA MONICA PEDESTRIAN ACTION PLAN This page intentionally left blank EXECUTIVE SUMMARY CHAPTER 1 EXECUTIVE SUMMARY Setting the Stage
Chapter 6 Transportation Plan
 Chapter 6 Transportation Plan Transportation Plan Introduction Chapter 6 Transportation Plan Transportation Plan Introduction This chapter describes the components of Arvada s transportation system, comprised
MAG Town of Cave Creek Bike Study Task 6 Executive Summary and Regional Significance Report
 Page 1 MAG Town of Cave Creek Bike Study Task 6 Executive Summary and Regional Significance Report August 1, 2012 MAG Project #481 Page 2 Task 6 Executive Summary and Regional Significance Report Introduction