SAMRAND DEVELOPMENT (PTY) LTD C2562/01TIA FEBRUARY 2019
|
|
|
- Naomi Goodwin
- 5 years ago
- Views:
Transcription

1 SAMRAND DEVELOPMENT (PTY) LTD C2562/1TIA PROPOSED MIXED-USE DEVELOPMENT TO BE LOCATED ON ERVEN 1 AND 2, KOSMOSDAL EXTENSION 14 CENTURION, PRETORIA TRAFFIC IMPACT ASSESSMENT FEBRUARY 219
 LTD PROJECT TEAM: MM GOUNDEN TRAFFIC ENGINEER WA KHAN TECHNOLOGIST Copy Date Done By Checked Approved V1 DRAFT 1 11/2/219 WA KHAN MM Gounden MM Gounden V1 DRAFT 2 14/2/219 WA")
2 REPORT SHEET PROJECT TITLE: PROPOSED MIXED-USE DEVELOPMENT ON ERVEN 1 AND 2 KOSMOSDAL EXTENSION 14, CENTURION, PRETORIA TRAFFIC IMPACT STUDY PREPARED FOR: SAMRAND DEVELOPMENT (PTY) LTD PREPARED BY: CIVIL CONCEPTS (PTY) LTD PROJECT TEAM: MM GOUNDEN TRAFFIC ENGINEER WA KHAN TECHNOLOGIST Copy Date Done By Checked Approved V1 DRAFT 1 11/2/219 WA KHAN MM Gounden MM Gounden V1 DRAFT 2 14/2/219 WA KHAN MM Gounden MM Gounden V1 DRAFT 3 22/2/219 WA KHAN MM Gounden MM Gounden V1 25/2/219 WA KHAN MM Gounden MM Gounden DECLARATION I certify that this study has been prepared under my immediate supervision and that I have experience and training in the field of traffic and transportation engineering. Signed: Name: Qualification: MM Gounden BSc Eng (Civil) Registration Number: ECSA DISCLAIMER This report has been prepared on the basis of information available at the date of publication. Civil Concepts (Pty) Ltd will not be liable for any loss, damage, cost or expense incurred or arising by reason of any person relying on information in this report. Reproduction of this report or any part (drawings, plans, models, data etc.) is not permitted without prior written consent of Civil Concepts (Pty) Ltd.
3 TABLE OF CONTENTS PAGE EXECUTIVE SUMMARY 1. INTRODUCTION Background Location Definitions Peak Hour Factor (PHF) and Base Saturation flow Time Horizons Determination of Road Upgrading PROPOSED LAND USE RIGHTS AND TRIP GENERATION Introduction Land Use Rights Trip Generation Trip Distribution and Assignment TRAFFIC AND THE ROAD NETWORK Traffic Counts Traffic Volumes Latent Rights Background Traffic Background and Development Traffic Road Network... 11
4 3.7 Proposed Upgrading of the Road Network EXISTING TRAFFIC OPERATIONS AND CONDITIONS Introduction Modes of Transport Traffic Operations TRAFFIC OPERATIONS Introduction Capacity Analysis Comparison ACCESS Introduction Marginal Access off Samrand Avenue Full Access off Rooihuiskraal Road (M37) PARKING PROVISION AND INTERNAL CIRCULATION Parking Provision Internal Circulation PUBLIC TRANSPORT AND NON-MOTORISED TRANSPORT FACILITIES Existing Public Transport Facilities and Non Motorised Transport Facilities Proposed Public Transport and Non Motorised Transport Facilities SUMMARY OF ROAD UPGRADES FINANCE AND COST ESTIMATES Introduction Improvement Costs - External Road Upgrades CONCLUSIONS... 34
5 11.1 Conclusions Recommendations REFERENCES FIGURES Figures 2.1 and 2.2 Figures 3.1 and 3.2 Figures 3.3 and 3.4 Figures 3.5 and 3.6 Figures 3.7 and 3.8 Figures 3.9 and 3.1 Figures 3.11 and 3.12 Figures 3.13 and 3.14 Figures 3.15 and 3.16 Figures 3.17 and 3.18 Figures 3.19 and 3.2 ANNEXURES The weekday morning and afternoon peak hour development Trips The 218 weekday morning and afternoon peak hour traffic Counts (PCUs) The 218 weekday morning and afternoon peak flow rate Traffic volumes 218 weekday morning and afternoon balanced peak flow Volumes The 219 weekday morning and afternoon peak hour traffic volumes The 224 weekday morning and afternoon peak hour traffic volumes The weekday morning and afternoon peak hour latent trips (Kosmosdal Extensions 9 and 91) developments The 219 weekday morning and afternoon peak hour background traffic volumes The 224 weekday morning and afternoon peak hour background traffic volumes The 219 weekday morning and afternoon peak hour background and development traffic volumes The 224 weekday morning and afternoon peak hour background and development traffic volumes ANNEXURE A ANNEXURE B ANNEXURE C ANNEXURE D ANNEXURE E Site Layout Plan Draft Annexure T City of Tshwane Road Masterplan Future Road Network Capacity Calculation Results
6 ANNEXURE F1 City of Tshwane existing traffic signal timing plans ANNEXURE F2 Detailed phasing and timings of the traffic signal ANNEXURE G Line of Sight Plan
7 EXECUTIVE SUMMARY Civil Concepts (Pty) Ltd was appointed by Samrand Development (Pty) Ltd to prepare a Traffic Impact Assessment (TIA) for a proposed mixed use development to be located in the north-western quadrant of the Samrand Avenue / Rooihuiskraal Road (M37) junction, on Erven 1 & 2 Kosmosdal Extension 12, Centurion, Pretoria. The proposed development will consist of a filling station, 49 m 2 GLA fast food and either a car wash facility (1 stalls) or 82 m 2 GLA vehicle fitment centre development. The proposed development consisting of a fast food and car wash facility was analysed, since it will generate the most trips. The fast food and a car wash facility / vehicle fitment centre will be built as ancillary components to the proposed filling station. This Traffic Impact Assessment (TIA) was prepared for the proposed development to determine the impact of the development trips on the surrounding road network and road upgrades required. This study was done in accordance with the Committee of Transport Officials (COTO) TMH 17 Trip Data Manual, (COTO) TRH26 South African Road Classification and Access Management Manual, (COTO) THM16 Volume 2 Traffic Impact and Site Traffic Assessment Standards and Requirements Manual and the Highway Capacity Manual (21), The Department of Transport s Manual for Traffic Impact Studies (Document RR 93/635) and the trip rates prescribed in the Institute if Transportation Engineers common trip generation rates for a Car Wash. It is anticipated that the development will generate 221 trips during the weekday morning and 3 trips during the afternoon peak hours, respectively. The base year (219) and five year horizon (224) are analysed as part of this study. The proposed mixed-use development will be serviced by two (2) accesses: A proposed marginal access (left-in, left-out only) off Samrand Avenue; and A proposed full access off Rooihuiskraal Road (M37). A topographical survey was conducted on Rooihuiskraal Road (M37) to check the sight distance, in order to warrant a full access to the proposed development site. Survey results concluded that the minimum requirements for sight distance are met, as prescribed in the UTG 1 Guidelines for the Geometric Design of Urban Arterial Roads (1986). There are no fixed obstructions that will hamper the sight distance from the development access. The design of the access and internal roads of the site are geometrically sound.
8 The peak hour development trips from the following Traffic Impact Study was considered as latent rights and the upgrades proposed were taken into account in this study: Proposed development on Part of the Remainder of Portion 2 of the Farm Olievenhoutbosch 389-JR, Kosmosdal Extensions 9 and 91 (previously Kosmosdal Extension 15) Addendum to the Traffic Impact Study (TIS2) done by Civil Concepts (Pty) Ltd, dated June 215 (report no. C239/1TIS2). The peak hour development trips from Proposed mixed use development on the Remainder of Portion 2 of the Farm Olievenhoutbosch 389-JR, Samrand Phase 3 (Kosmosdal Extensions 92) Addendum to the Traffic Impact Study (TIS2) done by Civil Concepts (Pty) Ltd, dated May 216 (report no. C233/2TIS2), were not considered as latent rights in this study as it may take 7-1 years for this development to be completed. A 3% annual growth rate was used to escalate the traffic counts to account for any unknown latent rights within the vicinity of the proposed development and accommodate an increase in vehicle ownership. No trip reductions were applied in this study. Five (5) junctions including accesses were analysed in this study. The capacity analyses show that some of the junctions will require upgrades to operate satisfactorily. Incremental road upgrades have been proposed at the problematic junctions to mitigate the effect of the proposed development. The capacity analysis results for the 219 and 224 background and development traffic volumes show that the analysed junctions will operate the same or better when compared to the 219 and 224 background traffic volumes. Parking will be provided within the site in accordance with the current Tshwane Town Planning Scheme 28 (Revised November 214). This Traffic Impact Assessment will be submitted to the City of Tshwane (CoT) for evaluation and approval.
9 1. INTRODUCTION 1.1 Background Civil Concepts (Pty) Ltd was appointed by Samrand Development (Pty) Ltd to prepare a Traffic Impact Assessment (TIA) for a proposed mixed use development to be located in the north-western quadrant of the Samrand Avenue / Rooihuiskraal Road (M37) junction, on Erven 1 & 2 Kosmosdal Extension 12, Centurion, Pretoria. The proposed development will consist of a filling station, 49 m 2 GLA fast food and either a car wash facility (1 stalls) or 82 m 2 GLA vehicle fitment centre development. The proposed development consisting of a fast food and car wash facility was analysed, since it will generate the most trips. The fast food and a car wash facility / vehicle fitment centre will be built as an ancillary components to the proposed filling station. The extent of the study area was determined in consultation with the City of Tshwane officials, by identifying the junctions within the vicinity of the development site on which the traffic to be generated by the proposed mixed-use development may have a significant impact. The objective of this study is to determine the impact of the proposed development trips on the adjacent road network. The proposed land use rights and trip generation are described first. This is followed by a description of the existing and proposed traffic volumes and the road network. The traffic operations at the junctions are calculated and upgrading proposals are made. The conclusions and recommendations are made at the end of the report. 1.2 Location The proposed development will be located in the north-western quadrant of the Samrand Avenue / Rooihuiskraal Road (M37) junction and it is bordered be bordered by Samrand Avenue to the south and Rooihuiskraal Road (M37) to the east as shown in Figure
")

10 KOSMOSDAL EXT 9 & 91 Proposed Marginal Access (Left-In, Left-Out Only) Proposed Full Access Proposed Mixed-Use Development Site Figure 1.1: Locality Plan 2
11 1.3 Definitions The following definitions from the 21 Highway Capacity Manual are applicable to this report: Capacity The maximum hourly rate at which vehicles can reasonably be expected to traverse a lane or roadway during a given period under prevailing roadway, traffic and control conditions. Volume The hourly rate (v/h), the actual flow rate for an approach or lane. Volume to capacity ratio (V/C) The ratio of flow to capacity. Level of Service (LOS) Level of Service is defined in terms of delay. Delay is a measure of driver discomfort, frustration, fuel consumption and lost travel time. The Levels of Service for junctions as defined in the 21 Highway Capacity Manual are shown in Table 1.1. TABLE 1.1: LEVEL OF SERVICE DEFINITIONS Control delay per vehicle (s/veh) Level of Service Signalised junctions Unsignalised junctions A < 1 < 1 B 1 to 2 1 to 15 C 2 to to 25 D 35 to to 35 E 55 to 8 35 to 5 F > 8 > Peak Hour Factor (PHF) and Base Saturation flow Peak Hour Factor (PHF) Peak rates of flow are related to hourly volumes using the Peak-Hour Factor (PHF). This factor is defined as the ratio of total hourly volume to the peak rate of flow within the hour: PHF = Total Hourly Volume/ (4 x Highest 15 min. volume) 3
12 The peak hour factors per approach were however calculated at the junctions analysed as shown in Figures 3.3 and 3.4. These PHF were used to calibrate the SIDRA model for the junctions analysed. Model calibration is the adjustment of constants and other model parameters in estimated or asserted models to make the models replicate observed data for a base year or otherwise produce more reasonable results Basic Saturation Flow The base saturation flow is a very important road traffic performance measure of the maximum rate of flow of traffic. The base saturation flow rates considered in this traffic study are shown in Table 1.2 below. TABLE 1.2: BASE SATURATION FLOW RATES Base Saturation Flow Approach Lanes (per lane) Rates (PCU/hr/ln) Through lanes 25 Right-turn, left-turn and shared lanes 16 Slip lanes (give-way/signalised) Time Horizons The base year (219) and the horizon year (224) are analysed as part of this study. A 5-year horizon (224) was analysed as part of this (TIA) to determine transportation improvements that are required to accommodate the proposed development as prescribed in in the Committee of Transport Officials (COTO) TMH 16, Volume 1 South African Traffic Impact and Site Traffic Assessment Manual, Version 1. (dated August 212). The weekday morning and afternoon peak hours are analysed. 1.6 Determination of Road Upgrading The Department of Transport s Manual for Traffic Impact Studies (Document RR 93/635) states: The recommended criteria that should be used to measure the level of upgrading/ improvement required, is the LOS and the v/c ratio. In urban areas, it is recommended that either of the following two LOS be used to determine whether a junction should be upgraded, on condition that the contribution of the proposed 4
13 development is at least 2% of the sum of the critical volume on a lane basis of the junction assessed: All elements of a junction should operate at LOS D or better and a v/c ratio less than.95 during the peak hour of the roadway system. In areas where the baseline LOS is E or worse, or the v/c ratio is greater than.95, this baseline (i.e. prior to development) LOS must be maintained or improved for the situation with the development included. The baseline LOS includes all committed (funded) road improvements and all non-site traffic (including existing site traffic) but exclude the additional traffic that will be generated by the proposed development. It should, however, be debated whether an application should be approved if the baseline LOS is E or worse and it is not practical to upgrade the junction any further. Engineering judgement should further be used in the case of the LOS of specifically right turning movements across high opposing traffic volumes at signalised junctions, due to the number of vehicles that are turning during the intergreen period / typically between 1 to 4 vehicles per cycle, depending on the junction layout. It is not realistic to upgrade a junction if a small number of right turning vehicles experience a LOS E or F. The same is also true if a level of service E/F is experienced by a small number of vehicles entering a major road from a minor road. The determination of the necessary upgrading and improvement to the road infrastructure needs to be determined for the with and without-development scenarios for the opening year and the horizon year(s). The following procedure should be followed to determine the necessary road upgrading: Calculate the LOS, v/c ratios and the site traffic as a percentage of the critical flows at the junction for every scenario. If the LOS is worse than LOS D for the with-development scenario but not for the withoutdevelopment scenario, the developer is responsible for all the required road upgrading. If the LOS is worse than D for the with- and without-development scenarios, the developer is only responsible for the incremental upgrading to obtain the same LOS and v/c ratio as for the without-development scenario. Although in many instances the professional judgement of the traffic engineer is needed to determine the required road upgrading by the developer, the basic principles as laid down above must be adhered to. 5
14 2. PROPOSED LAND USE RIGHTS AND TRIP GENERATION 2.1 Introduction The proposed land use rights of the site are described first. This is followed by the trip generation of the proposed rights. Trip assignments and distributions are then provided. 2.2 Land Use Rights The proposed land use rights are shown in Table 2.1. TABLE 2.1: PROPOSED LAND USE RIGHTS Erven Land-Use Extent (GLA) 1 & 2 Special for the purpose of a Filling Station - 1 & 2 Fast Food 49m 2 1 & 2 Car Wash or Vehicle Fitment Centre 1 Stalls or 82m 2 Site layout plan is included in ANNEXURE A. A copy of the Conditions of Establishment (Draft Annexure T) for the proposed land-use rights is included in ANNEXURE B. 2.3 Trip Generation Introduction The trip rates prescribed in the Committee of Transport Officials (COTO) TMH 17 - Trip Data Manual, Version 1. (dated September 213) and Institute of Transportation Engineers Common Trip Generation Rates (for a Car Wash), were used to calculate the development trips. A trip rate of 45 trips per 1 m 2 for weekday morning and a trip rate of 5 trips per 1 m 2 for the weekday afternoon peak hour, were used for the trip generation calculations for the fast food component. There are no trip rates for Saturday in the COTO manual, for a fast food. A trip rate of 5.54 trips per Stall is used for the weekday afternoon trip generation calculations for the car wash facility. There are no trip rates for weekday morning and Saturday in the Institute of Transportation Engineers Common Trip Generation Rates manual, for a car wash facility Trip Reductions No trip reductions were applied in this traffic study. 6
15 2.3.3 Trip Generation The proposed filling station will not generate new trips. It will intercept traffic from the adjacent street network. The filling station component of the proposed development will generate a negligible number of new trips. The weekday morning and afternoon peak hour trip generations for the proposed mixed-use development are shown in Tables 2.2 and 2.3, respectively. TABLE 2.3: WEEKDAY MORNING PEAK HOUR TRIP GENERATION Land-Use Split Peak Hour Trips Extent Trip Rate Rights In Out In Out Total Proposed Fast Food 49 m / 1 m 2 55% 45% Car Wash 1 Stalls TOTAL TRIPS GENERATED TABLE 2.4: WEEKDAY AFTERNOON PEAK HOUR TRIP GENERATION Land-Use Split Peak Hour Trips Extent Trip Rate Rights In Out In Out Total Proposed Fast Food 49 m 2 5. / 1 m 2 55% 45% Car Wash 1 Stalls 5.54 / Stall 5% 5% TOTAL TRIPS GENERATED Trip Distribution and Assignment The proposed mixed-use development trips were distributed and assigned to the adjacent road network based on the expected origins and destinations to and from the site. The road network, trip distribution assignment and the development framework information of the study area are shown on schematic diagrams as required in TMH 16 South African Traffic Impact and Site Traffic Assessment Manual, Version 1., August 212 (refer to Figures 2.1 and 2.2 and 3.1 to 3.2 for the schematic plans). The weekday morning and afternoon peak hour trip distributions and assignments are shown in Figures 2.1 and 2.2, respectively. 7
16 3. TRAFFIC AND THE ROAD NETWORK 3.1 Traffic Counts A weekday 24 hour classified traffic count survey was carried out on 9 October 218 at the Rooihuiskraal Road (M37) / Samrand Avenue junction. Weekday morning and afternoon peak hour classified traffic count surveys were conducted by Trafsol on 22 November 218 at the following junctions: Rooihuiskraal Road (M37) / Waterberg Road; Rooihuiskraal Road (M37) / Rietspruit Road; Samrand Avenue / Rietspruit Road; and Samrand Avenue / Watercress / Coqui Francolin. The classified traffic counts were converted to Passenger Car Units (PCUs) using the following factors: 1 for a car; 1.5 for a taxi; and 3 for heavies (buses and trucks). The weekday morning and afternoon peak hour traffic counts (PCUs) are shown in Figures 3.1 and 3.2, respectively. The 219 weekday morning and afternoon peak hour traffic volumes are shown in Figures 3.3 and 3.4, respectively. The weekday morning and afternoon peak hour peak flow rates are shown in Figures 3.3 and 3.4, respectively. The 218 peak hour flow rate traffic volumes were then balanced to eliminate discrepancies in the traffic flows between the Samrand Avenue / Watercress / Coqui Francolin, Rooihuiskraal Road (M37) / Samrand Avenue and Rooihuiskraal Road (M37) / Forest White junctions. The 218 weekday morning and afternoon peak hour balanced flow rate traffic volumes are shown in Figures 3.5 and 3.6, respectively. 8
17 3.2 Traffic Volumes Traffic Volumes The 218 weekday morning and afternoon peak hour traffic counts (PCUs) were escalated at a 3% annual growth rate over 1 year to obtain the 219 peak hour traffic volumes. The 3% annual growth rate was used to account for an increase in private vehicle ownership and any unknown latent rights within the vicinity of the proposed development site. The 219 weekday morning and afternoon peak hour traffic volumes are shown in Figures 3.7 and 3.8, respectively Traffic Volumes The 218 weekday morning and afternoon peak hour traffic counts (PCUs) were escalated at a 3% annual growth rate over 6 years to obtain the 224 peak hour traffic volumes. The 224 weekday morning and afternoon peak hour traffic volumes are shown in Figures 3.9 and 3.1, respectively. 3.3 Latent Rights The peak hour development trips from the following Traffic Impact Study or development was considered as latent rights and the upgrades proposed were taken into account in this study: Proposed development on Part of the Remainder of Portion 2 of the Farm Olievenhoutbosch 389-JR, Kosmosdal Extensions 9 and 91 (previously Kosmosdal Extension 15) Addendum to the Traffic Impact Study (TIS2) done by Civil Concepts (Pty) Ltd, dated June 215 (report no. C239/1TIS2). The peak hour development trips from Proposed mixed use development on the Remainder of Portion 2 of the Farm Olievenhoutbosch 389-JR, Samrand Phase 3 (Kosmosdal Extensions 92) Addendum to the Traffic Impact Study (TIS2) done by Civil Concepts (Pty) Ltd, dated May 216 (report no. C233/2TIS2), were not considered as latent rights in this study as it may take 7-1 years for this development to be completed. The Kosmosdal Extensions 9 and 91 weekday morning and afternoon peak hour latent development trips are shown in Figures 3.11 and 3.12, respectively. 9
18 3.4 Background Traffic Background Traffic Volumes The weekday morning and afternoon peak hour latent trips were added to the 219 weekday morning and afternoon peak hour traffic volumes to obtain the 219 peak hour background traffic volumes. The 219 weekday morning and afternoon peak hour background traffic volumes are shown in Figures 3.13 and 3.14, respectively Background Traffic Volumes The weekday morning and afternoon peak hour latent trips were added to the 224 weekday morning and afternoon peak hour traffic volumes to obtain the 224 peak hour background traffic volumes. The 224 weekday morning and afternoon peak hour background traffic volumes are shown in Figures 3.15 and 3.16, respectively. 3.5 Background and Development Traffic Background and Development Traffic Volumes The weekday morning and afternoon peak hour development trips were added to the 219 background peak hour volumes to obtain the 219 background and development peak hour traffic volumes. The 219 weekday morning and afternoon peak hour background and development traffic volumes are shown in Figures 3.17 and 3.18, respectively Background and Development Traffic Volumes The weekday morning and afternoon peak hour development trips were added to the 224 background peak hour volumes to obtain the 224 background and development peak hour traffic volumes. The 224 weekday morning and afternoon peak hour background and development traffic volumes are shown in Figures 3.19 and 3.2, respectively. 1
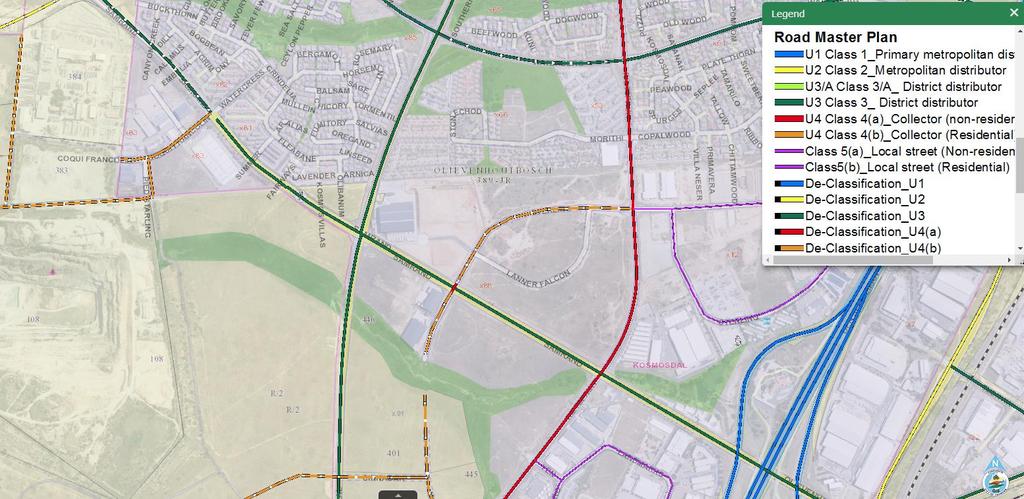
19 3.6 Road Network Existing Road Network - According to the City of Tshwane s 215 Road Masterplan prepared by Tolplan (February 215) and the Gauteng Department of Roads and Transport Strategic Road Network Masterplan, (August 21) (refer to ANNEXURE C for the extract from the City of Tshwane Road Master Plan). N1 freeway is a class 1 road that lies to the east of the proposed development site. It runs in a north-south direction and serves an important mobility function to Centurion and Midrand. Samrand Avenue is a class 3 road that runs in an east-west direction to the north of the proposed development site. This road intersects with Rooihuiskraal Road, Rietspruit Road in the form of signalised junctions and the N1 freeway ramp terminals. This road will serve a marginal access to the proposed development. Rietspruit Road is a class 4a road that lies to east of the proposed development site. It intersects with Rooihuiskraal Road to the south and Samrand Avenue to the north. Access to the development will be off Rietspruit Road. Rooihuiskraal Road (M37) is a class 3 road that lies to the west of the proposed development site and runs in a north-south direction. A partial access to the proposed development will be off Rooihuiskraal Road. Waterberg Road is a class 3 road that links up with Rooihuiskraal Road (M37) to form a signalized T-junction. This road is located to the north of the proposed development site. Watercress is a class 4b road which intersects with Samrand Avenue and Coqui Francolin to form a 4-leggd priority controlled junction. This road serves as an access to Kosmosdal Extension 81 residential development. Coqui Francolin is class 4a road which intersects with Samrand Avenue and Watercress to form a 4-legged priority controlled junction Future Road Network (refer to ANNEXURE D for the Future Road Network). Lever Road (K27), Rietspruit Road and Samrand Avenue will in future be extended towards the west to intersect with the future K71 and K73. There are planned provincial roads (K54 and K71) to the west of the proposed development site and both run in a north-south direction. These roads will intersect with the extensions of Rietspruit Road and Samrand Avenue. 11
20 3.7 Proposed Upgrading of the Road Network Incremental upgrading were proposed for the background and development traffic scenarios at the problematic junctions where the LOS was worse than D or with a degree of Saturation or (v/c ratio) higher than 95% than the background traffic scenario (refer to Section 9 of this report for the schematic SIDRA upgrade layouts). 12
21 4. EXISTING TRAFFIC OPERATIONS AND CONDITIONS 4.1 Introduction A site visit was done on 22 November 218 to obtain the existing lane configurations of the junctions to be analysed and observe the existing traffic operations within the subject area. The information regarding the site investigation is provided below. The public transport and Non-Motorised facilities are addressed in Section 8 of this report. 4.2 Modes of Transport Rooihuiskraal Road (M37) and Samrand Avenue are main roads that serve an important mobility function within the Kosmosdal, Centurion area. These roads are used by all modes of transport (public and private transport) to commute to and from Kosmosdal and the surrounding suburban areas within the City of Tshwane. 4.3 Traffic Operations Online Traffic Operation Information An online traffic analysis was done using Google map live traffic application over the three days period during the weekday morning and afternoon peak hours, at the following junctions: Samrand Avenue / Rooihuiskraal Road (M37); Rooihuiskraal Road (M37) / Waterberg Road; Rooihuiskraal Road (M37) / Rietspruit Road; Samrand Avenue / Rietspruit Road; and Samrand Avenue / Watercress / Coqui Francolin. Table 5.1 shows live traffic analysis recorded from each approach for the weekday morning and afternoon peak hours, respectively. 13
22 TABLE 5.1: WEEKDAY MORNING AND AFTERNOON PEAK HOUR AVERAGE QUEUE LENGTH JUNCTION Samrand Avenue / Rooihuiskraal Road (M37); APPROACH AM PEAK HOUR QUEUE LENGTH PM PEAK HOUR QUEUE LENGTH SOUTH Free Flow Free Flow EAST Free Flow Free Flow NORTH Free Flow Free Flow WEST Free Flow Free Flow SOUTH Free Flow Free Flow Rooihuiskraal Road (M37) / Waterberg Road EAST NORTH Free Flow Poor Progression WEST Free Flow Free Flow SOUTH Free Flow Free Flow Rooihuiskraal Road (M37) / Rietspruit Road EAST Poor Progression Congestion Observed Approx. 5m NORTH Poor Progression Free Flow WEST Poor Progression Free Flow Samrand Avenue / Rietspruit Road Samrand Avenue / Watercress / Coqui Francolin SOUTH Congestion Observed Approx. 4m Free Flow EAST Free Flow Free Flow NORTH WEST Congestion Observed Approx. 5m Congestion Observed Approx. 6m Poor Progression Free Flow SOUTH Free Flow Free Flow EAST Free Flow Free Flow NORTH Free Flow Free Flow WEST Free Flow Free Flow Site Traffic Observation Major delays and traffic queues were observed at the Samrand Avenue / Rietspruit Road and Rooihuiskraal Road (M37) / Rietspruit Road signalised junctions, during the morning and afternoon peak hours. Samrand Avenue is the only road that serves an access to N1 on-ramps / off-ramps in the Kosmosdal area, therefore majority of the drivers use this road to get on and 14
23 off the N1 freeway. This results in major congestions during the weekday morning and afternoon peak hours on the Samrand Avenue / Rietspruit Road junction Existing Infrastructure Samrand Avenue / Watercress / Coqui Francolin is currently a priority controlled junction. There are existing street lights and pedestrian walk ways provided at this junction and along Samrand Avenue. Following junctions are currently signalized: Rooihuiskraal Road (M37) / Samrand Avenue; Rooihuiskraal Road (M37) / Waterberg Road; Rooihuiskraal Road (M37) / Rietspruit Road; and Samrand Avenue / Rietspruit Road. There are existing street lights and pedestrian walk ways provided at these junctions, along Rooihuiskraal Road (M37) and Samrand Avenue Road Conditions The road surface conditions are in a fair condition along all roads. The road markings are visible at all approaches to all the junctions. The photos (Figures 4.1 to 4.4) illustrate that the roads are in a fair to good condition, with sufficient stopping sight distances and the road markings are visible to both pedestrian and motorists at all junctions. 15

")
24 FIGURE 4.1: SAMRAND AVENUE / WATERCRESS / COQUI FRANCOLIN FIGURE 4.2: ROOIHUISKRAAL ROAD (M37) / WATERBERG ROAD 16
")
 /")
25 FIGURE 4.3: ROOIHUISKRAAL ROAD (M37) / RIETSPRUIT ROAD FIGURE 4.4: ROOIHUISKRAAL ROAD (M37) / RIETSPRUIT ROAD 17
26 5. TRAFFIC OPERATIONS 5.1 Introduction The SIDRA Intersection 5. and AUTO J (Automated Junction Analysis) software programs were used for the capacity analysis calculations. The following junctions were analysed as part of the study: Rooihuiskraal Road (M37) / Waterberg Road; Rooihuiskraal Road (M37) / Samrand Avenue; Rooihuiskraal Road (M37) / Rietspruit Road; Samrand Avenue / Rietspruit Road; Samrand Avenue / Watercress / Coqui Francolin; and Rooihuiskraal Road (M37) / Full Access. The signalised, roundabout, priority-controlled and yield priority-controlled junctions were analysed using SIDRA whilst the all-way stop junctions controlled were analysed using AUTO J. AUTO J does not have an option to specify the User Given Phase Times (allow user to program times and replicate the existing or observed timings on site). AUTO J is a program which simulates and optimizes intersection design. It compares 25 types of intersection control devices simultaneously, including two-way Stop streets ( main road not stopped), all-way stop streets, roundabouts and mini-circles, two stage traffic signals, three stage signals, lagging and leading (six possibilities), four stage signals, lagging, leading and combinations (nine possibilities) and separate split stage signals and combinations (five possibilities). The average capacity results per junction is given in this section, however in accordance with Section of the TMH16 Volume 2 South African Traffic Impact and Site Traffic Assessment Standards and Requirements Manual (Version 1., August 212) as published by the Committee of Transport Officials (COTO), detailed capacity analysis results for all individual movements of the junctions are provided in ANNEXURE E of this report. The existing traffic signal timing plans were obtained from the City of Tshwane (CoT), were used when analysing the background scenario (refer to ANNEXURE F1). Detailed phasings and timings of the traffic signals are included in ANNEXURE F2. 18
27 5.2 Capacity Analysis Comparison The capacity analysis results per approach for the background and background with development traffic volumes are shown in Table 5.1 below. TABLE 5.1: BACKGROUND AND BACKGROUND WITH DEVELOPMENT CAPACITY ANALYSIS COMPARISON FOR MORNING AND AFTERNOON PEAK HOUR JUNCTION APPROAC H TRAFFIC CONTROL CONDITION Background AM PEAK HOUR PM PEAK HOUR AM PEAK HOUR PM PEAK HOUR Background + Development Background Background + Development Background Background + Development Background Background + Development v/c ratio SOUTH delay (sec) LOS B C C D B C C D v/c ratio EAST delay (sec) SAMRAND AVENUE / ROOISHUISKRAAL ROAD M37 LOS C C C C C C C C v/c ratio NORTH delay (sec) LOS E C D E F D E E v/c ratio WEST delay (sec) LOS D D D E D D D E v/c ratio SOUTH delay (sec) WATERBERG ROAD / ROOIHUISKRAAL ROAD (M37) NORTH WEST LOS A A B B A A B B v/c ratio delay (sec) LOS B B A A B B B B v/c ratio delay (sec) LOS D D D D E E D D 19
28 TABLE 5.1: (CONTINUED) JUNCTION APPROACH SOUTH TRAFFIC CONTROL CONDITION Background AM PEAK HOUR PM PEAK HOUR AM PEAK HOUR PM PEAK HOUR Background + Development Background Background + Development Background Background + Development Background Background + Development v/c ratio delay (sec) LOS F F F F F F F F v/c ratio EAST delay (sec) SAMRAND AVENUE / RIETSPRUIT ROAD LOS C C F F C C F F v/c ratio NORTH delay (sec) LOS B B B B B B B B v/c ratio WEST delay (sec) LOS C C D D C C D D v/c ratio SOUTH delay (sec) LOS C C B B E E B B v/c ratio EAST delay (sec) ROOIHUISKRAAL ROAD (M37) / RIETSPRUIT ROAD LOS C C C C C C C C v/c ratio NORTH delay (sec) LOS C C C C C C C C v/c ratio WEST delay (sec) LOS D D C C D D C C 2
29 TABLE 5.1: (CONTINUED) JUNCTION APPROACH SOUTH TRAFFIC CONTROL CONDITION Background AM PEAK HOUR PM PEAK HOUR AM PEAK HOUR PM PEAK HOUR Background + Development Background Background + Development Background Background + Development Background Background + Development v/c ratio N/A delay (sec) N/A LOS A A F F N/A A F F v/c ratio EAST delay (sec) WATERCRESS ROAD / SAMRAND AVENUE LOS A A B B A A B B v/c ratio NORTH delay (sec) LOS B B A A B B A A v/c ratio WEST delay (sec) LOS A A A A A A A A Legend: V/C ratio - Volume to capacity ratio LOS - Level of Service N/A - The average junction delay is not a good LOS measure for a priority control junction due to zero delays associated with major road movements. The Samrand Avenue / Rietspruit Road junction will experience delay and capacity problems for the 219 and 224 weekday morning and afternoon peak hour background traffic scenarios (without development trips). Less than 75 development trips are expected to be added to the critical lanes of this junction, therefore no upgrades are proposed at this junction for background with development traffic scenarios. The Watercress Road / Samrand Avenue / Coqui Francolin junction is currently not signalised and will experience delay and capacity problems for the 219 and 224 weekday afternoon peak hour background traffic scenarios (without development trips). Less than 75 development trips are expected to be added to the critical lanes of this junction. It is proposed that this junction be signalised by the Kosmosdal Extension 81 existing residential development. 21
30 The capacity analysis results per approach for the background with development traffic volumes at the Rooihuiskraal Road (M37) / Full Access junction are shown in Table 5.2 below. TABLE 5.2: BACKGROUND WITH DEVELOPMENT CAPACITY ANALYSIS RESULTS FOR MORNING AND AFTERNOON PEAK HOUR TRAFFIC CONTROL JUNCTION APPROACH AM PEAK HOUR PM PEAK HOUR AM PEAK HOUR PM PEAK HOUR CONDITION Background + Development Background + Development Background + Development Background + Development ROOIHUISKRAAL ROAD M37 / FULL ACCESS SOUTH EAST NORTH WEST v/c ratio delay (sec) LOS B B B B Avg Queue Length (m) v/c ratio delay (sec) LOS Avg Queue Length (m) v/c ratio delay (sec) LOS B B B B Avg Queue Length (m) v/c ratio delay (sec) LOS B B B C Avg Queue Length (m) Legend: V/C ratio - Volume to capacity ratio LOS - Level of Service N/A - The average junction delay is not a good LOS measure for a priority control junction due to zero delays associated with major road movements. Queue length analysis at Rooihuiskraal Road (M37) / Full Access junction show that 25m length right-turn lane on the northern approach is sufficient and the junction will operate satisfactorily for the 219 and 224 weekday morning and afternoon peak hour background with development traffic scenario. 22
31 The results indicate that the following junction will experience capacity and delay problems during the 219 and / or 224 weekday morning and afternoon peak hour background traffic scenarios: Rooihuiskraal Road (M37) / Samrand Avenue; and Furthermore the results show that this junction will operate better during the 219 and 224 weekday morning and afternoon peak hour background and development traffic scenarios with the proposed incremental upgrades in place. Queue length analysis at Rooihuiskraal Road (M37) / Full Access junction show that 25m length right-turn lane from the northern approach is sufficient. 23
 off Samrand Avenue and a proposed full access off Rooihuiskraal Road (M37). 6.")
32 6. ACCESS 6.1 Introduction The proposed mixed use development will be serviced by two (2) accesses. A proposed marginal access (left-in, left-out only) off Samrand Avenue and a proposed full access off Rooihuiskraal Road (M37). 6.2 Marginal Access off Samrand Avenue A proposed marginal access will be provided to development site off Samrand Avenue (refer to ANNEXURE A for a site layout plan). The proposed access configuration is shown in Figure 6.1 below. FIGURE 6.1: PROPOSED MARGINAL ACCESS OFF SAMRAND AVENUE 24
 to check the sight distance, in order to warrant a full access to the proposed development site.")
33 6.3 Full Access off Rooihuiskraal Road (M37) A proposed full access to the development site will be provided off Rooihuiskraal Road (M37). A topographical survey was conducted on Rooihuiskraal Road (M37) to check the sight distance, in order to warrant a full access to the proposed development site. Survey results concluded that the minimum requirements for sight distance are met, as prescribed in the UTG 1 Guidelines for the Geometric Design of Urban Arterial Roads (1986). There are no fixed obstructions that will hamper the sight distance from the development access. The design of the access and internal roads of the site are geometrically sound (refer to ANNEXURE G for Line of Sight Plan). The proposed access configuration is shown in Figure 6.2 below. FIGURE 6.2: PROPOSED FULL ACCESS OFF ROOIHUISKRAAL ROAD (M37) 25
34 7. PARKING PROVISION AND INTERNAL CIRCULATION 7.1 Parking Provision Parking will be provided within the site in accordance with the current Tshwane Town Planning Scheme 28 (Revised November 214). 7.2 Internal Circulation A Site Traffic Assessment (STA) will be done at the SDP stage to demonstrate the internal circulation (swept path analysis) within the proposed development and at the access to the development site. 26
35 8. PUBLIC TRANSPORT AND NON-MOTORISED TRANSPORT FACILITIES 8.1 Existing Public Transport Facilities and Non Motorised Transport Facilities Rooihuiskraal Road (M37) Samrand Avenue serve an important mobility function within the Kosmosdal and Centurion area. The roads are used by all modes of transport (public and private transport) to transport people to and from Centurion and the surrounding suburbs. Taxi/ Bus Lay-bys or Stops: There are existing bus-bys up-stream and down-stream, along Samrand Avenue; There are existing bus-bys up-stream and down-stream, along Rooihuiskraal Road (M37); and There are existing bus-bys up-stream and down-stream, along Rietspruit Road. There are paved walk ways Rooihuiskraal Road (M37), Samrand Avenue and Rietspruit Road. 8.2 Proposed Public Transport and Non Motorised Transport Facilities No additional public transport facilities are proposed. It is recommended that pedestrian walkways be provided along the site frontage of the proposed development in consultation with the City of Tshwane (CoT). 27

36 9. SUMMARY OF ROAD UPGRADES PROPOSED MIXED-USE DEVELOPMENT - EXISTING AND PROPOSED UPGRADES CONFIGURATIONS 1. SAMRAND AVENUE / ROOIHUISKRAAL ROAD EXISTING BACKGROUND BACKGROUND + DEVELOPMENT N/A Receiving lane on the northern approach has to be extended to 1m. The traffic signal timings and phasings have to be adjusted 28

37 2. WATERBERG ROAD / ROOIHUISKRAAL ROAD EXISTING BACKGROUND BACKGROUND + DEVELOPMENT N/A N/A 29
.")
38 3. RIETSPRUIT ROAD / SAMRAND AVENUE EXISTING BACKGROUND BACKGROUND + DEVELOPMENT The junction will experience delay and capacity problems for the 219 and 224 weekday morning and afternoon peak hour background traffic scenarios (without development trips). Less than 75 development trips are expected to be added to the critical lanes of this junction, therefore no upgrades are proposed at this junction. N/A 3
 BACKGROUND +")

39 4. RIETSPRUIT ROAD / ROOIHUISKRAAL ROAD EXISTING BACKGROUND (Proposed by Latent Developments) BACKGROUND + DEVELOPMENT N/A Proposed road upgrades by the Kosmosdal Extension 9 and 91. These road upgrades have not yet been implemented. 31
. Less than 75 development trips are expected to be added to the critical lanes of this junction.")
40 5. WATERCRESS STREET / SAMRAND AVENUE / COQUI FRANCOLIN EXISTING BACKGROUND BACKGROUND + DEVELOPMENT The junction will experience delay and capacity problems for the 219 and 224 weekday afternoon peak hour background traffic scenarios (without development trips). Less than 75 development trips are expected to be added to the critical lanes of this junction. It is proposed that this junction be signalised by the Kosmosdal Extension 81 existing residential development. N/A 32
41 1. FINANCE AND COST ESTIMATES 1.1 Introduction The developer will mitigate the effects of development traffic on the surrounding road network by doing the proposed road upgrades to accommodate the background with development traffic as described in the previous section (Section 9). 1.2 Improvement Costs - External Road Upgrades The estimated cost (excluding VAT) are shown below. Rooihuiskraal Road (M37) / Samrand Avenue R 75 (Timings Adjustment). Rooihuiskraal Road (M37) / Samrand Avenue (Construction Costs). 33
42 11. CONCLUSIONS 11.1 Conclusions The proposed development will consist of a filling station, 49 m2 GLA fast food and either a car wash facility (1 stalls) or 82 m2 GLA vehicle fitment centre development. The proposed mixed-use development will be serviced by two (2) accesses. A proposed marginal access (left-in, left-out only) off Samrand Avenue and a proposed full access off Rooihuiskraal Road (M37). Road upgrades were proposed at Rooihuiskraal Road (M37) / Samrand Avenue junction to mitigate the effect of the development traffic volumes Recommendations It is recommended that: the developer carries out the incremental road upgrades proposed to mitigate the effect of development trips. parking and non - motorised facilities be provided by the developer in consultation with the relevant departments of the City of Tshwane (CoT); and this Traffic Impact Assessment (TIA) in support of the a proposed mixed use development to be located on Erven 1 and 2 Kosmosdal Extension 12, Centurion, Pretoria, be approved. 34
43 REFERENCES 1. Akcelik & Associates Pty Ltd, (July 21) aasidra 5., Victoria, Australia. 2. Committee of Transport Officials, (September 213) TMH17 - South African Trip Data Manual, Version 1.1, Pretoria, South Africa. 3. BKS (Pty) Ltd, (July 1998) Pretoria s Policy for Traffic Impact Studies, City Council of Pretoria, Pretoria, South Africa. 4. Transportation Research Board, (21) Highway Capacity Manual 21, Washington, D.C, USA. 5. Committee of Transport Officials, (August 212) THM16 Volume 2 South African Traffic Impact and Site Traffic Assessment Standards and Requirements Manual, Version 1., Pretoria, South Africa. 6. Tolplan (Pty) Ltd, (February 213) City of Tshwane Road Master plan, City of Tshwane, Pretoria, South Africa. 7. ITS Engineers (Pty) Ltd, (September 29) Proposed development on Part of the Remainder of Portion 2 of the Farm Olievenhoutbosch 389-JR (Kosmosdal Extension 15) Traffic Impact Study (TIS), (report no. ITS 2615), Pretoria, South Africa. 8. ITS Engineers (Pty) Ltd, (October 29) Proposed development on Part of the Remainder of Portion 2 of the Farm Olievenhoutbosch 389-JR (Kosmosdal Extension 14) Traffic Impact Study (TIS), (report no. ITS 2615), Pretoria, South Africa. 9. Trafsol, (March 215) Samrand Phase 3 Traffic Survey, Johannesburg, South Africa.
44 FIGURES
45 3% 16% 5% 4% 21 1% 2% 16 RIETSPRUIT ROAD 5% Project Number C2562 Job Describption KOSMOSDAL EXT 14 Date 219/2/25 15:36 Done by WA KHAN ROOIHUISKRAAL ROAD (M37) DEVELOPMENT SITE RIETSPRUIT ROAD FOREST WHITE STREET WATERCRESS 5 17% SAMRAND AVENUE COQUI FRANCOLIN IN OUT ROOIHUISKRAAL ROAD (M37) % WEEKDAY MORNING PEAK HOUR DEVELOPMENT TRIPS AND ASSIGNMENTS FIGURE 2.1
46 3% 16% 17% 5% 4% 1% 2% 22 RIETSPRUIT ROAD 5% Project Number C2562 Job Describption KOSMOSDAL EXT 14 Date 219/2/25 15:36 Done by WA KHAN ROOIHUISKRAAL ROAD (M37) DEVELOPMENT SITE RIETSPRUIT ROAD FOREST WHITE STREET WATERCRESS SAMRAND AVENUE COQUI FRANCOLIN IN OUT ROOIHUISKRAAL ROAD (M37) % WEEKDAY AFTERNOON PEAK HOUR DEVELOPMENT TRIPS AND ASSIGNMENTS FIGURE 2.2
47 SAMRAND AVENUE COQUI FRANCOLIN ROOIHUISKRAAL ROAD (M37) ROOIHUISKRAAL ROAD (M37) 949 WATERCRESS 949 Project Number C2562 Job Describption KOSMOSDAL EXT 14 Date 219/2/25 15:36 Done by WA KHAN 632 FOREST WHITE STREET DEVELOPMENT SITE RIETSPRUIT ROAD RIETSPRUIT ROAD WEEKDAY MORNING PEAK HOUR TRAFFIC COUNTS (PCUs) FIGURE 3.1
48 SAMRAND AVENUE COQUI FRANCOLIN ROOIHUISKRAAL ROAD (M37) ROOIHUISKRAAL ROAD (M37) Project Number C2562 Job Describption KOSMOSDAL EXT 14 Date 219/2/25 15:36 Done by WA KHAN FOREST WHITE STREET WATERCRESS DEVELOPMENT SITE RIETSPRUIT ROAD RIETSPRUIT ROAD WEEKDAY AFTERNOON PEAK HOUR TRAFFIC COUNTS (PCUs) FIGURE 3.2
49 Project Number C2562 Job Describption KOSMOSDAL EXT 14 Date 219/2/25 15:36 Done by WA KHAN FOREST WHITE STREET ROOIHUISKRAAL ROAD (M37) SAMRAND AVENUE WATERCRESS COQUI FRANCOLIN DEVELOPMENT SITE RIETSPRUIT ROAD ROOIHUISKRAAL ROAD (M37) RIETSPRUIT ROAD LEGEND 131 Total Hourly Volume 267 Highest 15 min. volume PHF 218 WEEKDAY MORNING PEAK FLOW RATE TRAFFIC VOLUMES FIGURE 3.3
50 1 6 7 Project Number C2562 Job Describption KOSMOSDAL EXT 14 Date 219/2/25 15:36 Done by WA KHAN FOREST WHITE STREET ROOIHUISKRAAL ROAD (M37) SAMRAND AVENUE WATERCRESS COQUI FRANCOLIN DEVELOPMENT SITE RIETSPRUIT ROAD ROOIHUISKRAAL ROAD (M37) RIETSPRUIT ROAD LEGEND 131 Total Hourly Volume 267 Highest 15 min. volume PHF 218 WEEKDAY AFTERNOON PEAK FLOW RATE TRAFFIC VOLUMES FIGURE 3.4
51 SAMRAND AVENUE COQUI FRANCOLIN ROOIHUISKRAAL ROAD (M37) ROOIHUISKRAAL ROAD (M37) 1215 WATERCRESS 1215 Project Number C2562 Job Describption KOSMOSDAL EXT 14 Date 219/2/25 15:36 Done by WA KHAN 776 FOREST WHITE STREET DEVELOPMENT SITE RIETSPRUIT ROAD RIETSPRUIT ROAD WEEKDAY MORNING BALANCED PEAK FLOW RATE TRAFFIC VOLUMES FIGURE 3.5
52 SAMRAND AVENUE COQUI FRANCOLIN ROOIHUISKRAAL ROAD (M37) ROOIHUISKRAAL ROAD (M37) Project Number C2562 Job Describption KOSMOSDAL EXT 14 Date 219/2/25 15:36 Done by WA KHAN 434 FOREST WHITE STREET WATERCRESS DEVELOPMENT SITE RIETSPRUIT ROAD RIETSPRUIT ROAD WEEKDAY AFTERNOON BALANCED PEAK FLOW RATE TRAFFIC VOLUMES FIGURE 3.6
53 SAMRAND AVENUE COQUI FRANCOLIN ROOIHUISKRAAL ROAD (M37) ROOIHUISKRAAL ROAD (M37) 1251 WATERCRESS Project Number C2562 Job Describption KOSMOSDAL EXT 14 Date 219/2/25 15:36 Done by WA KHAN ESCALATION RATE 3% NUMBER OF YEARS 1 ESCALATION FACTOR 1.3 FOREST WHITE STREET DEVELOPMENT SITE RIETSPRUIT ROAD RIETSPRUIT ROAD WEEKDAY MORNING PEAK HOUR TRAFFIC VOLUMES FIGURE 3.7
54 SAMRAND AVENUE COQUI FRANCOLIN ROOIHUISKRAAL ROAD (M37) ROOIHUISKRAAL ROAD (M37) WATERCRESS Project Number C2562 Job Describption KOSMOSDAL EXT 14 Date 219/2/25 15:36 Done by WA KHAN ESCALATION RATE 3% NUMBER OF YEARS 1 ESCALATION FACTOR 1.3 FOREST WHITE STREET DEVELOPMENT SITE RIETSPRUIT ROAD RIETSPRUIT ROAD WEEKDAY AFTERNOON PEAK HOUR TRAFFIC VOLUMES FIGURE 3.8
55 SAMRAND AVENUE COQUI FRANCOLIN ROOIHUISKRAAL ROAD (M37) ROOIHUISKRAAL ROAD (M37) WATERCRESS Project Number C2562 Job Describption KOSMOSDAL EXT 14 Date 219/2/25 15:36 Done by WA KHAN ESCALATION RATE 3% NUMBER OF YEARS 6 ESCALATION FACTOR FOREST WHITE STREET DEVELOPMENT SITE RIETSPRUIT ROAD RIETSPRUIT ROAD WEEKDAY MORNING PEAK HOUR TRAFFIC VOLUMES FIGURE 3.9
56 SAMRAND AVENUE COQUI FRANCOLIN ROOIHUISKRAAL ROAD (M37) ROOIHUISKRAAL ROAD (M37) WATERCRESS Project Number C2562 Job Describption KOSMOSDAL EXT 14 Date 219/2/25 15:36 Done by WA KHAN ESCALATION RATE 3% NUMBER OF YEARS 6 ESCALATION FACTOR FOREST WHITE STREET DEVELOPMENT SITE RIETSPRUIT ROAD RIETSPRUIT ROAD WEEKDAY AFTERNOON PEAK HOUR TRAFFIC VOLUMES FIGURE 3.1
57 COQUI FRANCOLIN ROOIHUISKRAAL ROAD (M37) 57 ROOIHUISKRAAL ROAD (M37) 173 WATERCRESS Project Number C2562 Job Describption KOSMOSDAL EXT 14 Date 219/2/25 15:36 Done by WA KHAN FOREST WHITE STREET DEVELOPMENT SITE 57 RIETSPRUIT ROAD SAMRAND AVENUE RIETSPRUIT ROAD WEEKDAY MORNING PEAK HOUR KOSMOSDAL EXT 9&91 LATENT DEVELOPMENT TRIPS FIGURE 3.11
58 SAMRAND AVENUE COQUI FRANCOLIN ROOIHUISKRAAL ROAD (M37) ROOIHUISKRAAL ROAD (M37) 54 WATERCRESS 54 Project Number C2562 Job Describption KOSMOSDAL EXT 14 Date 219/2/25 15:36 Done by WA KHAN FOREST WHITE STREET DEVELOPMENT SITE 177 RIETSPRUIT ROAD RIETSPRUIT ROAD WEEKDAY AFTERNOON PEAK HOUR KOSMOSDAL EXT 9&91 LATENT DEVELOPMENT TRIPS FIGURE 3.12
59 SAMRAND AVENUE COQUI FRANCOLIN ROOIHUISKRAAL ROAD (M37) ROOIHUISKRAAL ROAD (M37) 1424 WATERCRESS Project Number C2562 Job Describption KOSMOSDAL EXT 14 Date 219/2/25 15:36 Done by WA KHAN FOREST WHITE STREET DEVELOPMENT SITE RIETSPRUIT ROAD RIETSPRUIT ROAD WEEKDAY MORNING PEAK HOUR BACKGROUND TRAFFIC VOLUMES FIGURE 3.13
60 SAMRAND AVENUE COQUI FRANCOLIN ROOIHUISKRAAL ROAD (M37) ROOIHUISKRAAL ROAD (M37) 523 WATERCRESS RIETSPRUIT ROAD Project Number C2562 Job Describption KOSMOSDAL EXT 14 Date 219/2/25 15:36 Done by WA KHAN FOREST WHITE STREET DEVELOPMENT SITE RIETSPRUIT ROAD WEEKDAY AFTERNOON PEAK HOUR BACKGROUND TRAFFIC VOLUMES FIGURE 3.14
61 SAMRAND AVENUE COQUI FRANCOLIN ROOIHUISKRAAL ROAD (M37) ROOIHUISKRAAL ROAD (M37) WATERCRESS Project Number C2562 Job Describption KOSMOSDAL EXT 14 Date 219/2/25 15:36 Done by WA KHAN FOREST WHITE STREET DEVELOPMENT SITE RIETSPRUIT ROAD RIETSPRUIT ROAD WEEKDAY MORNING PEAK HOUR BACKGROUND TRAFFIC VOLUMES FIGURE 3.15
62 SAMRAND AVENUE COQUI FRANCOLIN ROOIHUISKRAAL ROAD (M37) ROOIHUISKRAAL ROAD (M37) 597 WATERCRESS RIETSPRUIT ROAD Project Number C2562 Job Describption KOSMOSDAL EXT 14 Date 219/2/25 15:36 Done by WA KHAN FOREST WHITE STREET DEVELOPMENT SITE RIETSPRUIT ROAD WEEKDAY AFTERNOON PEAK HOUR BACKGROUND TRAFFIC VOLUMES FIGURE 3.16
63 SAMRAND AVENUE COQUI FRANCOLIN ROOIHUISKRAAL ROAD (M37) Project Number C2562 Job Describption KOSMOSDAL EXT 14 Date 219/2/25 15:36 Done by WA KHAN 19 FOREST WHITE STREET ROOIHUISKRAAL ROAD (M37) 1536 WATERCRESS DEVELOPMENT SITE RIETSPRUIT ROAD RIETSPRUIT ROAD WEEKDAY MORNING PEAK HOUR BACKGROUND AND DEVELOPMENT TRAFFIC VOLUMES FIGURE 3.17
64 SAMRAND AVENUE COQUI FRANCOLIN ROOIHUISKRAAL ROAD (M37) Project Number C2562 Job Describption KOSMOSDAL EXT 14 Date 219/2/25 15:36 Done by WA KHAN 55 FOREST WHITE STREET ROOIHUISKRAAL ROAD (M37) 672 WATERCRESS DEVELOPMENT SITE RIETSPRUIT ROAD RIETSPRUIT ROAD WEEKDAY AFTERNOON PEAK HOUR BACKGROUND AND DEVELOPMENT TRAFFIC VOLUMES FIGURE 3.18
65 SAMRAND AVENUE COQUI FRANCOLIN ROOIHUISKRAAL ROAD (M37) Project Number C2562 Job Describption KOSMOSDAL EXT 14 Date 219/2/25 15:36 Done by WA KHAN 1136 FOREST WHITE STREET ROOIHUISKRAAL ROAD (M37) 1735 WATERCRESS DEVELOPMENT SITE RIETSPRUIT ROAD RIETSPRUIT ROAD WEEKDAY MORNING PEAK HOUR BACKGROUND AND DEVELOPMENT TRAFFIC VOLUMES FIGURE 3.19
66 SAMRAND AVENUE COQUI FRANCOLIN ROOIHUISKRAAL ROAD (M37) Project Number C2562 Job Describption KOSMOSDAL EXT 14 Date 219/2/25 15:36 Done by WA KHAN 621 FOREST WHITE STREET ROOIHUISKRAAL ROAD (M37) 747 WATERCRESS DEVELOPMENT SITE RIETSPRUIT ROAD RIETSPRUIT ROAD WEEKDAY AFTERNOON PEAK HOUR BACKGROUND AND DEVELOPMENT TRAFFIC VOLUMES FIGURE 3.2
67 ANNEXURE A SITE LAYOUT PLAN


68 +86 9 Y +87 Y NOTES AND SPECIFICATIONS PTN 2 OLIEVENHOUTBOSCH 389-JR Y LOCALITY PLAN (N.T.S) EC EC EC EC T EC X X EC EC S S EC S EC AMENDMENTS S EC S EC S EC S EC EC EC EC A STORE & C/R ARE R. LESSING T LJ ZIETSMAN S SIGNATURE:... DATE:... SIGNATURE:... DATE:... A RECEPTION ARE LJ ZIETSMAN D.J. CHALMERS 1 RE/2/389 S /389 4 SIGNATURE:... DATE:... S S S LJ ZIETSMAN /11/218 T S S T S 7 SW S SW T T SW S T CITY OF TSHWANE T SW X X ROADS & TRANSPORT DEPARTMENT T S T ACTING DIVISIONAL HEAD Mr Lebepe M.T. (Thabo) GROUP HEAD Mr Letlonkane P. (Pheko) T P.O. BOX 149 PRETORIA 1 T T T DF A NEW T EXISTING KOSMOSDAL X 89 S CCTV DF T A TELKOM T S SEWER SW T WATERMAIN DF A KOSMOSDAL FILLING STATION ACCESS LAYOUT T T STORMWATER T S DF A ELECTRICAL CABLES T NEOTEL SW T DFA WAYLEAVE No. :WL1819-XXXX T T STREET LIGHTING T NEW ASPHALT C2562 T NEW PAVING T 15/11/218 SW Y +87 Y T LANDSCAPING Y SW NEW CONCRETE DATE:... DF A T LEGEND : SIGNATURE:... SW LEGEND: Mr Lebepe M.T. (Thabo) SW S P.O. BOX 149 PRETORIA 1 1:5 C A1 1 OF 1
69 ANNEXURE B DRAFT ANNEXURE T
70 PROPERTY DESCRIPTION :ERVEN 1 AND 2 KOSMOSDAL EXTENSION 14 1 Use Zone 28: Special 2 Uses permitted Filling station with an ancillary shop larger than 25m², car wash, place of refreshment and motor workshop 3 Uses with consent Table B, Column (4). 4 Uses not permitted Table B, Column (5). 5 Definitions Clause 5; Provided that the following definition shall apply for Place of refreshment: (1) Place of refreshment: means land and buildings used for the preparation, sale and consumption of refreshments on the property such as a restaurant, café, coffee shop, tea room, tea garden, sport bar, pub, bar and may included a take-away facility and a drive-thru facility for the collecting of take-away orders from a vehicle and a maximum of two table games, two dartboards, two electronic games, television screens and soft background music for the customers but excludes a place of amusement. The kitchen layout shall comply with the municipality s health requirements. 6 Density n/a 7 Coverage 4% 8 Height 2 storeys (1m) 9 Floor area ratio.125 Provided that the following restrictions shall apply: (1) The ancillary shop to the filling station shall not exceed a gross floor area of 36m²; (2) Place of refreshment shall not exceed 48m²; (3) Car wash shall not exceed 2m²; (4) Motor workshop shall not exceed 76m² 1 Site Development Plan and Landscape Development Plan Clause Street Building Lines 3.6m street building line 12 Building Restriction Areas Clause 12, Table A 13 Parking requirements Demarcated parking spaces (minimum 2.5m x 5.m with a permanent dust-free surface, together with the necessary maneuvering space, shall be provided and maintained on the Erf to the satisfaction of the Municipality as follows: (1) 6 parking spaces per 1sqm gross floor area for Place of Refreshment ; (2) 6 parking spaces per 1sqm gross floor area for
71 convenience store; (3) 4 parking spaces per 1sqm gross floor area for offices; (4) 3 parking spaces per 1sqm gross floor area for ATM (5) 7 parking bays per carwash booth (6) 3 parking spaces per 1sqm gross floor area for motor workshop. (7) Other: Clause 28 Table G 14 Paving of traffic areas All parts of the erven upon which motor vehicles are allowed to move or park, shall be provided with a permanent dust-free surface, which surface shall be paved, drained and maintained to the satisfaction of the Municipality. 15 Access to the erf Entrances to and exits from the Erf shall be sited, constructed and maintained to the satisfaction of the Municipality. 16 Loading and off-loading facilities The loading and off-loading of goods shall only take place within the boundaries of the erf. 17 Turning facilities Not required. 18 Physical barriers Clause 18(8) 19 Health measures 1) Any requirements for air-pollution, noise abatement or health measures set by the Municipality shall be complied with to the satisfaction of the Municipality without any costs to the Municipality. 2) No air-conditioning units or compressors may be mounted to the exterior walls of building(s) without the prior consent of the Municipality. 3) Flood-lights or spot-lights used to illuminate the buildings or signs, shall be positioned as such that none of the light spills onto adjacent properties or shines into the eyes of motorists or pedestrians. Lights may not shine higher than,5m beneath the top of the building to prevent light pollution. 2 Outdoor advertising Advertisements and/or signboards shall not be erected or displayed on the erf without the written consent of the Municipality first being obtained in terms of municipal bylaws for outdoor advertising. 21 Detrimental soil conditions Clause Open Space Not applicable
72 23 General: (1) An engineer must be appointed before building plans are submitted, who must submit, together with the building plans, a certificate which states that he has studied the relevant geological report and that he has established the necessary measures with regard to building work, drainage of the buildings and the site and the installation of wet services so that the whole development is safe as far as possible from a geological point of view. On completion he must certify that all his specifications have been met. (2) In addition to the above conditions the erf and buildings thereon are further subject to the general provisions of the Tshwane Town-planning Scheme, 28 (Revised 214).
73 ANNEXURE C CITY OF TSHWANE ROAD MASTER PLAN
74
75 ANNEXURE D FUTURE ROAD NETWORK

76 SUBJECT SITE
77 ANNEXURE E CAPACITY CALCULATION RESULTS
78 MOVEMENT SUMMARY Samrand Avenue / Rooihuiskraal Road (M37) Intersection 219 Weekday Morning Peak Hour Background Traffic Volumes Existing Traffic Signal Controlled Intersection Configuration Signals - Fixed Time Cycle Time = 75 seconds Site: 219 AM BG Movement Performance - Vehicles Mov ID Turn Demand Deg. Average Level of 95% Back of Queue Prop. Effective Average Flow HV Satn Delay Service Vehicles Distance Queued Stop Rate Speed veh/h % v/c sec veh m per veh km/h South: Rooihuiskraal Road (M37) (S) 1 L LOS C T LOS B R LOS C Approach LOS B East: Samrand Avenue (E) 4 L LOS A T LOS B R LOS D Approach LOS C North: Rooihuiskraal Road (M37) (N) 7 L LOS B T LOS F R LOS D Approach LOS E West: Samrand Avenue (W) 1 L LOS D T LOS C R LOS D Approach LOS D All Vehicles LOS D Level of Service (Aver. Int. Delay): LOS D. Based on average delay for all vehicle movements. LOS Method: Delay (HCM). Level of Service (Worst Movement): LOS F. LOS Method for individual vehicle movements: Delay (HCM). Approach LOS values are based on average delay for all vehicle movements. Processed: Friday, 1 February 219 8:32:44 AM Copyright 2-21 Akcelik & Associates Pty Ltd SIDRA INTERSECTION Project: W:\CC-Projects\C PROJECTS\C2562 (MG) KOSMOSDAL X 89\1. Client and Related Bodies\1.13 TIS, Traffic Statements\5 Calculations\TIA\2 Sidra\1 Samrand_Rooihuskraal M37\BG\Samrand_Rooihuskraal M37_BG.sip
79 MOVEMENT SUMMARY Samrand Avenue / Rooihuiskraal Road (M37) Intersection 219 Weekday Afternoon Peak Hour Background Traffic Volumes Existing Traffic Signal Controlled Intersection Configuration Signals - Fixed Time Cycle Time = 86 seconds Site: 219 PM BG Movement Performance - Vehicles Mov ID Turn Demand Deg. Average Level of 95% Back of Queue Prop. Effective Average Flow HV Satn Delay Service Vehicles Distance Queued Stop Rate Speed veh/h % v/c sec veh m per veh km/h South: Rooihuiskraal Road (M37) (S) 1 L LOS C T LOS C R LOS D Approach LOS C East: Samrand Avenue (E) 4 L LOS A T LOS B R LOS D Approach LOS C North: Rooihuiskraal Road (M37) (N) 7 L LOS A T LOS D R LOS F Approach LOS D West: Samrand Avenue (W) 1 L LOS D T LOS D R LOS D Approach LOS D All Vehicles LOS C Level of Service (Aver. Int. Delay): LOS C. Based on average delay for all vehicle movements. LOS Method: Delay (HCM). Level of Service (Worst Movement): LOS F. LOS Method for individual vehicle movements: Delay (HCM). Approach LOS values are based on average delay for all vehicle movements. 3 x = 1. due to short lane Processed: Monday, 11 February 219 7:48:41 AM Copyright 2-21 Akcelik & Associates Pty Ltd SIDRA INTERSECTION Project: W:\CC-Projects\C PROJECTS\C2562 (MG) KOSMOSDAL X 89\1. Client and Related Bodies\1.13 TIS, Traffic Statements\5 Calculations\TIA\2 Sidra\1 Samrand_Rooihuskraal M37\BG\Samrand_Rooihuskraal M37_BG.sip
80 MOVEMENT SUMMARY Samrand Avenue / Rooihuiskraal Road (M37) Intersection 219 Weekday Morning Peak Hour Background Traffic Volumes Existing Traffic Signal Controlled Intersection Configuration Signals - Fixed Time Cycle Time = 75 seconds Site: 224 AM BG Movement Performance - Vehicles Mov ID Turn Demand Deg. Average Level of 95% Back of Queue Prop. Effective Average Flow HV Satn Delay Service Vehicles Distance Queued Stop Rate Speed veh/h % v/c sec veh m per veh km/h South: Rooihuiskraal Road (M37) (S) 1 L LOS C T LOS B R LOS C Approach LOS B East: Samrand Avenue (E) 4 L LOS A T LOS B R LOS D Approach LOS C North: Rooihuiskraal Road (M37) (N) 7 L LOS B T LOS F R LOS D Approach LOS F West: Samrand Avenue (W) 1 L LOS D T LOS C R LOS D Approach LOS D All Vehicles LOS E Level of Service (Aver. Int. Delay): LOS E. Based on average delay for all vehicle movements. LOS Method: Delay (HCM). Level of Service (Worst Movement): LOS F. LOS Method for individual vehicle movements: Delay (HCM). Approach LOS values are based on average delay for all vehicle movements. Processed: Friday, 1 February 219 8:34: AM Copyright 2-21 Akcelik & Associates Pty Ltd SIDRA INTERSECTION Project: W:\CC-Projects\C PROJECTS\C2562 (MG) KOSMOSDAL X 89\1. Client and Related Bodies\1.13 TIS, Traffic Statements\5 Calculations\TIA\2 Sidra\1 Samrand_Rooihuskraal M37\BG\Samrand_Rooihuskraal M37_BG.sip
81 MOVEMENT SUMMARY Samrand Avenue / Rooihuiskraal Road (M37) Intersection 219 Weekday Afternoon Peak Hour Background Traffic Volumes Existing Traffic Signal Controlled Intersection Configuration Signals - Fixed Time Cycle Time = 86 seconds Site: 224 PM BG Movement Performance - Vehicles Mov ID Turn Demand Deg. Average Level of 95% Back of Queue Prop. Effective Average Flow HV Satn Delay Service Vehicles Distance Queued Stop Rate Speed veh/h % v/c sec veh m per veh km/h South: Rooihuiskraal Road (M37) (S) 1 L LOS C T LOS C R LOS D Approach LOS C East: Samrand Avenue (E) 4 L LOS A T LOS C R LOS D Approach LOS C North: Rooihuiskraal Road (M37) (N) 7 L LOS A T LOS D R LOS F Approach LOS E West: Samrand Avenue (W) 1 L LOS D T LOS D R LOS D Approach LOS D All Vehicles LOS D Level of Service (Aver. Int. Delay): LOS D. Based on average delay for all vehicle movements. LOS Method: Delay (HCM). Level of Service (Worst Movement): LOS F. LOS Method for individual vehicle movements: Delay (HCM). Approach LOS values are based on average delay for all vehicle movements. 3 x = 1. due to short lane Processed: Monday, 11 February 219 7:41:26 AM Copyright 2-21 Akcelik & Associates Pty Ltd SIDRA INTERSECTION Project: W:\CC-Projects\C PROJECTS\C2562 (MG) KOSMOSDAL X 89\1. Client and Related Bodies\1.13 TIS, Traffic Statements\5 Calculations\TIA\2 Sidra\1 Samrand_Rooihuskraal M37\BG\Samrand_Rooihuskraal M37_BG.sip
82 MOVEMENT SUMMARY Samrand Avenue / Rooihuiskraal Road (M37) Intersection 219 Weekday Morning Peak Hour Background and Development Traffic Volumes Existing Traffic Signal Controlled Intersection Configuration Signals - Fixed Time Cycle Time = 82 seconds Site: 219 AM BG+DEV Movement Performance - Vehicles Mov ID Turn Demand Deg. Average Level of 95% Back of Queue Prop. Effective Average Flow HV Satn Delay Service Vehicles Distance Queued Stop Rate Speed veh/h % v/c sec veh m per veh km/h South: Rooihuiskraal Road (M37) (S) 1 L LOS C T LOS B R LOS D Approach LOS C East: Samrand Avenue (E) 4 L LOS B T LOS B R LOS D Approach LOS C North: Rooihuiskraal Road (M37) (N) 7 L LOS B T LOS D R LOS D Approach LOS C West: Samrand Avenue (W) 1 L LOS D T LOS D R LOS D Approach LOS D All Vehicles LOS C Level of Service (Aver. Int. Delay): LOS C. Based on average delay for all vehicle movements. LOS Method: Delay (HCM). Level of Service (Worst Movement): LOS D. LOS Method for individual vehicle movements: Delay (HCM). Approach LOS values are based on average delay for all vehicle movements. Processed: Monday, 11 February 219 9:3:47 AM Copyright 2-21 Akcelik & Associates Pty Ltd SIDRA INTERSECTION Project: W:\CC-Projects\C PROJECTS\C2562 (MG) KOSMOSDAL X 89\1. Client and Related Bodies\1.13 TIS, Traffic Statements\5 Calculations\TIA\2 Sidra\1 Samrand_Rooihuskraal M37\BG+DEV\Samrand_Rooihuskraal M37_DEV_Rev1.sip
83 MOVEMENT SUMMARY Samrand Avenue / Rooihuiskraal Road (M37) Intersection 219 Weekday Morning Peak Hour Background and Development Traffic Volumes Existing Traffic Signal Controlled Intersection Configuration Signals - Fixed Time Cycle Time = 11 seconds Site: 219 PM BG+DEV Movement Performance - Vehicles Mov ID Turn Demand Deg. Average Level of 95% Back of Queue Prop. Effective Average Flow HV Satn Delay Service Vehicles Distance Queued Stop Rate Speed veh/h % v/c sec veh m per veh km/h South: Rooihuiskraal Road (M37) (S) 1 L LOS C T LOS C R LOS E Approach LOS D East: Samrand Avenue (E) 4 L LOS A T LOS B R LOS D Approach LOS C North: Rooihuiskraal Road (M37) (N) 7 L LOS A T LOS D R LOS F Approach LOS E West: Samrand Avenue (W) 1 L LOS E T LOS D R LOS E Approach LOS E All Vehicles LOS D Level of Service (Aver. Int. Delay): LOS D. Based on average delay for all vehicle movements. LOS Method: Delay (HCM). Level of Service (Worst Movement): LOS F. LOS Method for individual vehicle movements: Delay (HCM). Approach LOS values are based on average delay for all vehicle movements. 3 x = 1. due to short lane Processed: Monday, 11 February 219 9:31:1 AM Copyright 2-21 Akcelik & Associates Pty Ltd SIDRA INTERSECTION Project: W:\CC-Projects\C PROJECTS\C2562 (MG) KOSMOSDAL X 89\1. Client and Related Bodies\1.13 TIS, Traffic Statements\5 Calculations\TIA\2 Sidra\1 Samrand_Rooihuskraal M37\BG+DEV\Samrand_Rooihuskraal M37_DEV_Rev1.sip
84 MOVEMENT SUMMARY Samrand Avenue / Rooihuiskraal Road (M37) Intersection 219 Weekday Morning Peak Hour Background and Development Traffic Volumes Existing Traffic Signal Controlled Intersection Configuration Signals - Fixed Time Cycle Time = 82 seconds Site: 224 AM BG+DEV Movement Performance - Vehicles Mov ID Turn Demand Deg. Average Level of 95% Back of Queue Prop. Effective Average Flow HV Satn Delay Service Vehicles Distance Queued Stop Rate Speed veh/h % v/c sec veh m per veh km/h South: Rooihuiskraal Road (M37) (S) 1 L LOS C T LOS B R LOS D Approach LOS C East: Samrand Avenue (E) 4 L LOS B T LOS B R LOS D Approach LOS C North: Rooihuiskraal Road (M37) (N) 7 L LOS B T LOS E R LOS D Approach LOS D West: Samrand Avenue (W) 1 L LOS D T LOS D R LOS D Approach LOS D All Vehicles LOS D Level of Service (Aver. Int. Delay): LOS D. Based on average delay for all vehicle movements. LOS Method: Delay (HCM). Level of Service (Worst Movement): LOS E. LOS Method for individual vehicle movements: Delay (HCM). Approach LOS values are based on average delay for all vehicle movements. Processed: Monday, 11 February 219 9:31:39 AM Copyright 2-21 Akcelik & Associates Pty Ltd SIDRA INTERSECTION Project: W:\CC-Projects\C PROJECTS\C2562 (MG) KOSMOSDAL X 89\1. Client and Related Bodies\1.13 TIS, Traffic Statements\5 Calculations\TIA\2 Sidra\1 Samrand_Rooihuskraal M37\BG+DEV\Samrand_Rooihuskraal M37_DEV_Rev1.sip
85 MOVEMENT SUMMARY Samrand Avenue / Rooihuiskraal Road (M37) Intersection 219 Weekday Morning Peak Hour Background and Development Traffic Volumes Existing Traffic Signal Controlled Intersection Configuration Signals - Fixed Time Cycle Time = 11 seconds Site: 224 PM BG+DEV Movement Performance - Vehicles Mov ID Turn Demand Deg. Average Level of 95% Back of Queue Prop. Effective Average Flow HV Satn Delay Service Vehicles Distance Queued Stop Rate Speed veh/h % v/c sec veh m per veh km/h South: Rooihuiskraal Road (M37) (S) 1 L LOS C T LOS C R LOS E Approach LOS D East: Samrand Avenue (E) 4 L LOS A T LOS C R LOS D Approach LOS C North: Rooihuiskraal Road (M37) (N) 7 L LOS B T LOS D R LOS F Approach LOS E West: Samrand Avenue (W) 1 L LOS E T LOS D R LOS E Approach LOS E All Vehicles LOS D Level of Service (Aver. Int. Delay): LOS D. Based on average delay for all vehicle movements. LOS Method: Delay (HCM). Level of Service (Worst Movement): LOS F. LOS Method for individual vehicle movements: Delay (HCM). Approach LOS values are based on average delay for all vehicle movements. 3 x = 1. due to short lane Processed: Monday, 11 February 219 9:31:5 AM Copyright 2-21 Akcelik & Associates Pty Ltd SIDRA INTERSECTION Project: W:\CC-Projects\C PROJECTS\C2562 (MG) KOSMOSDAL X 89\1. Client and Related Bodies\1.13 TIS, Traffic Statements\5 Calculations\TIA\2 Sidra\1 Samrand_Rooihuskraal M37\BG+DEV\Samrand_Rooihuskraal M37_DEV_Rev1.sip
86 MOVEMENT SUMMARY Waterberg Road / Rooihuiskraal Road (M37) Intersection 219 Weekday Morning Peak Hour Background Traffic Volumes Existing Traffic Signal Controlled Intersection Configuration Signals - Fixed Time Cycle Time = 8 seconds Site: 219 AM BG Movement Performance - Vehicles Mov ID Turn Demand Deg. Average Level of 95% Back of Queue Prop. Effective Average Flow HV Satn Delay Service Vehicles Distance Queued Stop Rate Speed veh/h % v/c sec veh m per veh km/h South: Rooihuiskraal Road (M37) (S) 1 L LOS B T LOS A Approach LOS A North: Rooihuiskraal Road (M37) (N) 8 T LOS B R LOS B Approach LOS B West: Waterberg Road (W) 1 L LOS C R LOS D Approach LOS D All Vehicles LOS B Level of Service (Aver. Int. Delay): LOS B. Based on average delay for all vehicle movements. LOS Method: Delay (HCM). Level of Service (Worst Movement): LOS D. LOS Method for individual vehicle movements: Delay (HCM). Approach LOS values are based on average delay for all vehicle movements. Processed: Wednesday, 23 January 219 8:28:53 AM Copyright 2-21 Akcelik & Associates Pty Ltd SIDRA INTERSECTION Project: W:\CC-Projects\C PROJECTS\C2562 (MG) KOSMOSDAL X 89\1. Client and Related Bodies\1.13 TIS, Traffic Statements\5 Calculations\TIA\2 Sidra\2 Waterburg_Rooihuskraal M37\BG\Waterburg Road_Rooihuskraal M37_BG_REV1.sip
87 MOVEMENT SUMMARY Waterberg Road / Rooihuiskraal Road (M37) Intersection 219 Weekday Afternoon Peak Hour Background Traffic Volumes Existing Traffic Signal Controlled Intersection Configuration Signals - Fixed Time Cycle Time = 1 seconds Site: 219 PM BG Movement Performance - Vehicles Mov ID Turn Demand Deg. Average Level of 95% Back of Queue Prop. Effective Average Flow HV Satn Delay Service Vehicles Distance Queued Stop Rate Speed veh/h % v/c sec veh m per veh km/h South: Rooihuiskraal Road (M37) (S) 1 L LOS C T LOS A Approach LOS B North: Rooihuiskraal Road (M37) (N) 8 T LOS A R LOS C Approach LOS A West: Waterberg Road (W) 1 L LOS D R LOS D Approach LOS D All Vehicles LOS B Level of Service (Aver. Int. Delay): LOS B. Based on average delay for all vehicle movements. LOS Method: Delay (HCM). Level of Service (Worst Movement): LOS D. LOS Method for individual vehicle movements: Delay (HCM). Approach LOS values are based on average delay for all vehicle movements. Processed: Wednesday, 23 January 219 8:29:17 AM Copyright 2-21 Akcelik & Associates Pty Ltd SIDRA INTERSECTION Project: W:\CC-Projects\C PROJECTS\C2562 (MG) KOSMOSDAL X 89\1. Client and Related Bodies\1.13 TIS, Traffic Statements\5 Calculations\TIA\2 Sidra\2 Waterburg_Rooihuskraal M37\BG\Waterburg Road_Rooihuskraal M37_BG_REV1.sip
88 MOVEMENT SUMMARY Waterberg Road / Rooihuiskraal Road (M37) Intersection 224 Weekday Morning Peak Hour Background Traffic Volumes Existing Traffic Signal Controlled Intersection Configuration Signals - Fixed Time Cycle Time = 8 seconds Site: 224 AM BG Movement Performance - Vehicles Mov ID Turn Demand Deg. Average Level of 95% Back of Queue Prop. Effective Average Flow HV Satn Delay Service Vehicles Distance Queued Stop Rate Speed veh/h % v/c sec veh m per veh km/h South: Rooihuiskraal Road (M37) (S) 1 L LOS B T LOS A Approach LOS A North: Rooihuiskraal Road (M37) (N) 8 T LOS B R LOS B Approach LOS B West: Waterberg Road (W) 1 L LOS C R LOS E Approach LOS E All Vehicles LOS C Level of Service (Aver. Int. Delay): LOS C. Based on average delay for all vehicle movements. LOS Method: Delay (HCM). Level of Service (Worst Movement): LOS E. LOS Method for individual vehicle movements: Delay (HCM). Approach LOS values are based on average delay for all vehicle movements. 3 x = 1. due to short lane Processed: Wednesday, 23 January 219 8:31:51 AM Copyright 2-21 Akcelik & Associates Pty Ltd SIDRA INTERSECTION Project: W:\CC-Projects\C PROJECTS\C2562 (MG) KOSMOSDAL X 89\1. Client and Related Bodies\1.13 TIS, Traffic Statements\5 Calculations\TIA\2 Sidra\2 Waterburg_Rooihuskraal M37\BG\Waterburg Road_Rooihuskraal M37_BG_REV1.sip
89 MOVEMENT SUMMARY Waterberg Road / Rooihuiskraal Road (M37) Intersection 224 Weekday Afternoon Peak Hour Background Traffic Volumes Existing Traffic Signal Controlled Intersection Configuration Signals - Fixed Time Cycle Time = 1 seconds Site: 224 PM BG Movement Performance - Vehicles Mov ID Turn Demand Deg. Average Level of 95% Back of Queue Prop. Effective Average Flow HV Satn Delay Service Vehicles Distance Queued Stop Rate Speed veh/h % v/c sec veh m per veh km/h South: Rooihuiskraal Road (M37) (S) 1 L LOS C T LOS B Approach LOS B North: Rooihuiskraal Road (M37) (N) 8 T LOS A R LOS D Approach LOS B West: Waterberg Road 1 L LOS D R LOS D Approach LOS D All Vehicles LOS B Level of Service (Aver. Int. Delay): LOS B. Based on average delay for all vehicle movements. LOS Method: Delay (HCM). Level of Service (Worst Movement): LOS D. LOS Method for individual vehicle movements: Delay (HCM). Approach LOS values are based on average delay for all vehicle movements. 3 x = 1. due to short lane Processed: Wednesday, 23 January 219 8:33:2 AM Copyright 2-21 Akcelik & Associates Pty Ltd SIDRA INTERSECTION Project: W:\CC-Projects\C PROJECTS\C2562 (MG) KOSMOSDAL X 89\1. Client and Related Bodies\1.13 TIS, Traffic Statements\5 Calculations\TIA\2 Sidra\2 Waterburg_Rooihuskraal M37\BG\Waterburg Road_Rooihuskraal M37_BG_REV1.sip
90 MOVEMENT SUMMARY Waterberg Road / Rooihuiskraal Road (M37) Intersection 219 Weekday Morning Peak Hour Background and Development Traffic Volumes Existing Traffic Signal Controlled Intersection Configuration Signals - Fixed Time Cycle Time = 8 seconds Site: 219 AM BG+DEV Movement Performance - Vehicles Mov ID Turn Demand Deg. Average Level of 95% Back of Queue Prop. Effective Average Flow HV Satn Delay Service Vehicles Distance Queued Stop Rate Speed veh/h % v/c sec veh m per veh km/h South: Rooihuiskraal Road (M37) (S) 1 L LOS B T LOS A Approach LOS A North: Rooihuiskraal Road (M37) (N) 8 T LOS B R LOS B Approach LOS B West: Waterberg Road (W) 1 L LOS C R LOS D Approach LOS D All Vehicles LOS B Level of Service (Aver. Int. Delay): LOS B. Based on average delay for all vehicle movements. LOS Method: Delay (HCM). Level of Service (Worst Movement): LOS D. LOS Method for individual vehicle movements: Delay (HCM). Approach LOS values are based on average delay for all vehicle movements. Processed: Wednesday, 23 January 219 8:51:55 AM Copyright 2-21 Akcelik & Associates Pty Ltd SIDRA INTERSECTION Project: W:\CC-Projects\C PROJECTS\C2562 (MG) KOSMOSDAL X 89\1. Client and Related Bodies\1.13 TIS, Traffic Statements\5 Calculations\TIA\2 Sidra\2 Waterburg_Rooihuskraal M37\BG+DEV\Waterburg Road_Rooihuskraal M37_BG+DEV.sip
91 MOVEMENT SUMMARY Waterberg Road / Rooihuiskraal Road (M37) Intersection 219 Weekday Afternoon Peak Hour Background and Development Traffic Volumes Existing Traffic Signal Controlled Intersection Configuration Signals - Fixed Time Cycle Time = 1 seconds Site: 219 PM BG+DEV Movement Performance - Vehicles Mov ID Turn Demand Deg. Average Level of 95% Back of Queue Prop. Effective Average Flow HV Satn Delay Service Vehicles Distance Queued Stop Rate Speed veh/h % v/c sec veh m per veh km/h South: Rooihuiskraal Road (M37) (S) 1 L LOS C T LOS A Approach LOS B North: Rooihuiskraal Road (M37) (N) 8 T LOS A R LOS D Approach LOS A West: Waterberg Road (W) 1 L LOS D R LOS D Approach LOS D All Vehicles LOS B Level of Service (Aver. Int. Delay): LOS B. Based on average delay for all vehicle movements. LOS Method: Delay (HCM). Level of Service (Worst Movement): LOS D. LOS Method for individual vehicle movements: Delay (HCM). Approach LOS values are based on average delay for all vehicle movements. Processed: Wednesday, 23 January 219 8:57:1 AM Copyright 2-21 Akcelik & Associates Pty Ltd SIDRA INTERSECTION Project: W:\CC-Projects\C PROJECTS\C2562 (MG) KOSMOSDAL X 89\1. Client and Related Bodies\1.13 TIS, Traffic Statements\5 Calculations\TIA\2 Sidra\2 Waterburg_Rooihuskraal M37\BG+DEV\Waterburg Road_Rooihuskraal M37_BG+DEV.sip
92 MOVEMENT SUMMARY Waterberg Road / Rooihuiskraal Road (M37) Intersection 224 Weekday Morning Peak Hour Background and Development Traffic Volumes Existing Traffic Signal Controlled Intersection Configuration Signals - Fixed Time Cycle Time = 8 seconds Site: 224 AM BG+DEV Movement Performance - Vehicles Mov ID Turn Demand Deg. Average Level of 95% Back of Queue Prop. Effective Average Flow HV Satn Delay Service Vehicles Distance Queued Stop Rate Speed veh/h % v/c sec veh m per veh km/h South: Rooihuiskraal Road (M37) (S) 1 L LOS B T LOS A Approach LOS A North: Rooihuiskraal Road (M37) (N) 8 T LOS B R LOS B Approach LOS B West: Waterberg Road (W) 1 L LOS C R LOS E Approach LOS E All Vehicles LOS C Level of Service (Aver. Int. Delay): LOS C. Based on average delay for all vehicle movements. LOS Method: Delay (HCM). Level of Service (Worst Movement): LOS E. LOS Method for individual vehicle movements: Delay (HCM). Approach LOS values are based on average delay for all vehicle movements. 3 x = 1. due to short lane Processed: Wednesday, 23 January 219 9:5:3 AM Copyright 2-21 Akcelik & Associates Pty Ltd SIDRA INTERSECTION Project: W:\CC-Projects\C PROJECTS\C2562 (MG) KOSMOSDAL X 89\1. Client and Related Bodies\1.13 TIS, Traffic Statements\5 Calculations\TIA\2 Sidra\2 Waterburg_Rooihuskraal M37\BG+DEV\Waterburg Road_Rooihuskraal M37_BG+DEV.sip
93 MOVEMENT SUMMARY Waterberg Road / Rooihuiskraal Road (M37) Intersection 224 Weekday Afternoon Peak Hour Background and Development Traffic Volumes Existing Traffic Signal Controlled Intersection Configuration Signals - Fixed Time Cycle Time = 1 seconds Site: 224 PM BG+DEV Movement Performance - Vehicles Mov ID Turn Demand Deg. Average Level of 95% Back of Queue Prop. Effective Average Flow HV Satn Delay Service Vehicles Distance Queued Stop Rate Speed veh/h % v/c sec veh m per veh km/h South: Rooihuiskraal Road (M37) (S) 1 L LOS C T LOS B Approach LOS B North: Rooihuiskraal Road (M37) (N) 8 T LOS A R LOS D Approach LOS B West: Waterberg Road (W) 1 L LOS D R LOS D Approach LOS D All Vehicles LOS B Level of Service (Aver. Int. Delay): LOS B. Based on average delay for all vehicle movements. LOS Method: Delay (HCM). Level of Service (Worst Movement): LOS D. LOS Method for individual vehicle movements: Delay (HCM). Approach LOS values are based on average delay for all vehicle movements. 3 x = 1. due to short lane Processed: Wednesday, 23 January 219 9:6:37 AM Copyright 2-21 Akcelik & Associates Pty Ltd SIDRA INTERSECTION Project: W:\CC-Projects\C PROJECTS\C2562 (MG) KOSMOSDAL X 89\1. Client and Related Bodies\1.13 TIS, Traffic Statements\5 Calculations\TIA\2 Sidra\2 Waterburg_Rooihuskraal M37\BG+DEV\Waterburg Road_Rooihuskraal M37_BG+DEV.sip
94 MOVEMENT SUMMARY Samrand Avenue / Rietspruit Road Junction 218 Weekday Morning Peak Hour Background Traffic Volumes Existing Signalised Four Legged Junction Signals - Fixed Time Cycle Time = 9 seconds Site: 219 AM BG Movement Performance - Vehicles Mov ID Turn Demand Deg. Average Level of 95% Back of Queue Prop. Effective Average Flow HV Satn Delay Service Vehicles Distance Queued Stop Rate Speed veh/h % v/c sec veh m per veh km/h South: Rietspruit Road (S) 1 L LOS C T LOS C R LOS F Approach LOS F East: Samrand Avenue (E) 4 L LOS B T LOS B R LOS F Approach LOS C North: Rietspruit Road (N) 7 L NA 9 NA 9 NA T LOS C R LOS D Approach LOS B West: Samrand Avenue (W) 1 L LOS C T LOS C R LOS C Approach LOS C All Vehicles LOS F Level of Service (Aver. Int. Delay): LOS F. Based on average delay for all vehicle movements. LOS Method: Delay (HCM). Level of Service (Worst Movement): LOS F. LOS Method for individual vehicle movements: Delay (HCM). Approach LOS values are based on average delay for all vehicle movements. 3 x = 1. due to short lane 9 Continuous movement Processed: Wednesday, 2 January 219 2:3:26 PM Copyright 2-21 Akcelik & Associates Pty Ltd SIDRA INTERSECTION Project: W:\CC-Projects\C PROJECTS\C2562 (MG) KOSMOSDAL X 89\1. Client and Related Bodies\1.13 TIS, Traffic Statements\5 Calculations\TIA\2 Sidra\3 Reitspurit_Samrand\BG\Samrand-Rietspruit_BG.sip
95 MOVEMENT SUMMARY Samrand Avenue / Rietspruit Road Junction 218 Weekday Afernoon Peak Hour Background Traffic Volumes Existing Signalised Four Legged Junction Signals - Fixed Time Cycle Time = 9 seconds Site: 219 PM BG Movement Performance - Vehicles Mov ID Turn Demand Deg. Average Level of 95% Back of Queue Prop. Effective Average Flow HV Satn Delay Service Vehicles Distance Queued Stop Rate Speed veh/h % v/c sec veh m per veh km/h South: Rietspruit Road (S) 1 L LOS C T LOS B R LOS F Approach LOS F East: Samrand Avenue (E) 4 L LOS B T LOS F R LOS F Approach LOS F North: Rietspruit Road (N) 7 L NA 9 NA 9 NA T LOS C R LOS D Approach LOS B West: Samrand Avenue (W) 1 L LOS D T LOS C R LOS E Approach LOS D All Vehicles LOS F Level of Service (Aver. Int. Delay): LOS F. Based on average delay for all vehicle movements. LOS Method: Delay (HCM). Level of Service (Worst Movement): LOS F. LOS Method for individual vehicle movements: Delay (HCM). Approach LOS values are based on average delay for all vehicle movements. 3 x = 1. due to short lane 9 Continuous movement Processed: Wednesday, 2 January 219 3:13:8 PM Copyright 2-21 Akcelik & Associates Pty Ltd SIDRA INTERSECTION Project: W:\CC-Projects\C PROJECTS\C2562 (MG) KOSMOSDAL X 89\1. Client and Related Bodies\1.13 TIS, Traffic Statements\5 Calculations\TIA\2 Sidra\3 Reitspurit_Samrand\BG\Samrand-Rietspruit_BG.sip
96 MOVEMENT SUMMARY Samrand Avenue / Rietspruit Road Junction 224 Weekday Morning Peak Hour Background Traffic Volumes Existing Signalised Four Legged Junction Signals - Fixed Time Cycle Time = 9 seconds Site: 224 AM BG Movement Performance - Vehicles Mov ID Turn Demand Deg. Average Level of 95% Back of Queue Prop. Effective Average Flow HV Satn Delay Service Vehicles Distance Queued Stop Rate Speed veh/h % v/c sec veh m per veh km/h South: Rietspruit Road (S) 1 L LOS C T LOS C R LOS F Approach LOS F East: Samrand Avenue (E) 4 L NA 9 NA 9 NA T LOS B R LOS F Approach LOS C North: Rietspruit Road (N) 7 L NA 9 NA 9 NA T LOS C R LOS D Approach LOS B West: Samrand Avenue (W) 1 L LOS C T LOS C R LOS C Approach LOS C All Vehicles LOS F Level of Service (Aver. Int. Delay): LOS F. Based on average delay for all vehicle movements. LOS Method: Delay (HCM). Level of Service (Worst Movement): LOS F. LOS Method for individual vehicle movements: Delay (HCM). Approach LOS values are based on average delay for all vehicle movements. 9 Continuous movement Processed: Wednesday, 2 January 219 3:18:49 PM Copyright 2-21 Akcelik & Associates Pty Ltd SIDRA INTERSECTION Project: W:\CC-Projects\C PROJECTS\C2562 (MG) KOSMOSDAL X 89\1. Client and Related Bodies\1.13 TIS, Traffic Statements\5 Calculations\TIA\2 Sidra\3 Reitspurit_Samrand\BG\Samrand-Rietspruit_BG.sip
97 MOVEMENT SUMMARY Samrand Avenue / Rietspruit Road Junction 224 Weekday Afernoon Peak Hour Background Traffic Volumes Existing Signalised Four Legged Junction Signals - Fixed Time Cycle Time = 9 seconds Site: 224 PM BG Movement Performance - Vehicles Mov ID Turn Demand Deg. Average Level of 95% Back of Queue Prop. Effective Average Flow HV Satn Delay Service Vehicles Distance Queued Stop Rate Speed veh/h % v/c sec veh m per veh km/h South: Rietspruit Road (S) 1 L LOS C T LOS B R LOS F Approach LOS F East: Samrand Avenue (E) 4 L NA 9 NA 9 NA T LOS F R LOS F Approach LOS F North: Rietspruit Road (N) 7 L NA 9 NA 9 NA T LOS C R LOS D Approach LOS B West: Samrand Avenue (W) 1 L LOS D T LOS D R LOS E Approach LOS D All Vehicles LOS F Level of Service (Aver. Int. Delay): LOS F. Based on average delay for all vehicle movements. LOS Method: Delay (HCM). Level of Service (Worst Movement): LOS F. LOS Method for individual vehicle movements: Delay (HCM). Approach LOS values are based on average delay for all vehicle movements. 9 Continuous movement Processed: Wednesday, 2 January 219 3:44:41 PM Copyright 2-21 Akcelik & Associates Pty Ltd SIDRA INTERSECTION Project: W:\CC-Projects\C PROJECTS\C2562 (MG) KOSMOSDAL X 89\1. Client and Related Bodies\1.13 TIS, Traffic Statements\5 Calculations\TIA\2 Sidra\3 Reitspurit_Samrand\BG\Samrand-Rietspruit_BG.sip
98 MOVEMENT SUMMARY Samrand Avenue / Rietspruit Road Junction 218 Weekday Morning Peak Hour Background and Development Traffic Volumes Existing Signalised Four Legged Junction Signals - Fixed Time Cycle Time = 9 seconds Site: 219 AM BG+DEV Movement Performance - Vehicles Mov ID Turn Demand Deg. Average Level of 95% Back of Queue Prop. Effective Average Flow HV Satn Delay Service Vehicles Distance Queued Stop Rate Speed veh/h % v/c sec veh m per veh km/h South: Rietspruit Road (S) 1 L LOS C T LOS C R LOS F Approach LOS F East: Samrand Avenue (E) 4 L LOS B T LOS B R LOS F Approach LOS C North: Rietspruit Road (N) 7 L NA 9 NA 9 NA T LOS C R LOS D Approach LOS B West: Samrand Avenue (W) 1 L LOS C T LOS C R LOS C Approach LOS C All Vehicles LOS F Level of Service (Aver. Int. Delay): LOS F. Based on average delay for all vehicle movements. LOS Method: Delay (HCM). Level of Service (Worst Movement): LOS F. LOS Method for individual vehicle movements: Delay (HCM). Approach LOS values are based on average delay for all vehicle movements. 3 x = 1. due to short lane 9 Continuous movement Processed: Friday, 1 February :32:55 AM Copyright 2-21 Akcelik & Associates Pty Ltd SIDRA INTERSECTION Project: W:\CC-Projects\C PROJECTS\C2562 (MG) KOSMOSDAL X 89\1. Client and Related Bodies\1.13 TIS, Traffic Statements\5 Calculations\TIA\2 Sidra\3 Reitspurit_Samrand\BG+DEV\Samrand-Rietspruit_BG+DEV.sip
99 MOVEMENT SUMMARY Samrand Avenue / Rietspruit Road Junction 218 Weekday Afernoon Peak Hour Background and Development Traffic Volumes Existing Signalised Four Legged Junction Signals - Fixed Time Cycle Time = 9 seconds Site: 219 PM BG+DEV Movement Performance - Vehicles Mov ID Turn Demand Deg. Average Level of 95% Back of Queue Prop. Effective Average Flow HV Satn Delay Service Vehicles Distance Queued Stop Rate Speed veh/h % v/c sec veh m per veh km/h South: Rietspruit Road (S) 1 L LOS C T LOS B R LOS F Approach LOS F East: Samrand Avenue (E) 4 L LOS B T LOS F R LOS F Approach LOS F North: Rietspruit Road (N) 7 L NA 9 NA 9 NA T LOS C R LOS D Approach LOS B West: Samrand Avenue (W) 1 L LOS D T LOS C R LOS E Approach LOS D All Vehicles LOS F Level of Service (Aver. Int. Delay): LOS F. Based on average delay for all vehicle movements. LOS Method: Delay (HCM). Level of Service (Worst Movement): LOS F. LOS Method for individual vehicle movements: Delay (HCM). Approach LOS values are based on average delay for all vehicle movements. 3 x = 1. due to short lane 9 Continuous movement Processed: Friday, 1 February 219 1:39:1 PM Copyright 2-21 Akcelik & Associates Pty Ltd SIDRA INTERSECTION Project: W:\CC-Projects\C PROJECTS\C2562 (MG) KOSMOSDAL X 89\1. Client and Related Bodies\1.13 TIS, Traffic Statements\5 Calculations\TIA\2 Sidra\3 Reitspurit_Samrand\BG+DEV\Samrand-Rietspruit_BG+DEV.sip
100 MOVEMENT SUMMARY Samrand Avenue / Rietspruit Road Junction 224 Weekday Morning Peak Hour Background and Development Traffic Volumes Existing Signalised Four Legged Junction Signals - Fixed Time Cycle Time = 9 seconds Site: 224 AM BG+DEV Movement Performance - Vehicles Mov ID Turn Demand Deg. Average Level of 95% Back of Queue Prop. Effective Average Flow HV Satn Delay Service Vehicles Distance Queued Stop Rate Speed veh/h % v/c sec veh m per veh km/h South: Rietspruit Road (S) 1 L LOS C T LOS C R LOS F Approach LOS F East: Samrand Avenue (E) 4 L NA 9 NA 9 NA T LOS B R LOS F Approach LOS C North: Rietspruit Road (N) 7 L NA 9 NA 9 NA T LOS C R LOS D Approach LOS B West: Samrand Avenue (W) 1 L LOS D T LOS C R LOS C Approach LOS C All Vehicles LOS F Level of Service (Aver. Int. Delay): LOS F. Based on average delay for all vehicle movements. LOS Method: Delay (HCM). Level of Service (Worst Movement): LOS F. LOS Method for individual vehicle movements: Delay (HCM). Approach LOS values are based on average delay for all vehicle movements. 9 Continuous movement Processed: Friday, 1 February 219 1:4:3 PM Copyright 2-21 Akcelik & Associates Pty Ltd SIDRA INTERSECTION Project: W:\CC-Projects\C PROJECTS\C2562 (MG) KOSMOSDAL X 89\1. Client and Related Bodies\1.13 TIS, Traffic Statements\5 Calculations\TIA\2 Sidra\3 Reitspurit_Samrand\BG+DEV\Samrand-Rietspruit_BG+DEV.sip
101 MOVEMENT SUMMARY Samrand Avenue / Rietspruit Road Junction 224 Weekday Afernoon Peak Hour Background and Development Traffic Volumes Existing Signalised Four Legged Junction Signals - Fixed Time Cycle Time = 9 seconds Site: 224 PM BG+DEV Movement Performance - Vehicles Mov ID Turn Demand Deg. Average Level of 95% Back of Queue Prop. Effective Average Flow HV Satn Delay Service Vehicles Distance Queued Stop Rate Speed veh/h % v/c sec veh m per veh km/h South: Rietspruit Road (S) 1 L LOS C T LOS B R LOS F Approach LOS F East: Samrand Avenue (E) 4 L NA 9 NA 9 NA T LOS F R LOS F Approach LOS F North: Rietspruit Road (N) 7 L NA 9 NA 9 NA T LOS C R LOS D Approach LOS B West: Samrand Avenue (W) 1 L LOS D T LOS D R LOS E Approach LOS D All Vehicles LOS F Level of Service (Aver. Int. Delay): LOS F. Based on average delay for all vehicle movements. LOS Method: Delay (HCM). Level of Service (Worst Movement): LOS F. LOS Method for individual vehicle movements: Delay (HCM). Approach LOS values are based on average delay for all vehicle movements. 9 Continuous movement Processed: Friday, 1 February 219 1:4:5 PM Copyright 2-21 Akcelik & Associates Pty Ltd SIDRA INTERSECTION Project: W:\CC-Projects\C PROJECTS\C2562 (MG) KOSMOSDAL X 89\1. Client and Related Bodies\1.13 TIS, Traffic Statements\5 Calculations\TIA\2 Sidra\3 Reitspurit_Samrand\BG+DEV\Samrand-Rietspruit_BG+DEV.sip
102 MOVEMENT SUMMARY Rooihuiskraal Road / Rietspruit Road Junction 219 Weekday Morning Peak Hour Background and Development Traffic Volumes Existing Signalised Four Legged Junction Signals - Fixed Time Cycle Time = 9 seconds Site: 219 AM BG Movement Performance - Vehicles Mov ID Turn Demand Deg. Average Level of 95% Back of Queue Prop. Effective Average Flow HV Satn Delay Service Vehicles Distance Queued Stop Rate Speed veh/h % v/c sec veh m per veh km/h South: Rooihuiskraal Road (M37) (S) 1 L LOS B T LOS A R LOS D Approach LOS C East: Rietspriut Road (E) 4 L LOS B T LOS C R LOS D Approach LOS C North: Rooihuiskraal Road (M37) (N) 7 L LOS C T LOS C R LOS C Approach LOS C West: Rietspriut Road (W) 1 L LOS D T LOS D R LOS D Approach LOS D All Vehicles LOS C Level of Service (Aver. Int. Delay): LOS C. Based on average delay for all vehicle movements. LOS Method: Delay (HCM). Level of Service (Worst Movement): LOS D. LOS Method for individual vehicle movements: Delay (HCM). Approach LOS values are based on average delay for all vehicle movements. Processed: Monday, 11 February :31:8 AM Copyright 2-21 Akcelik & Associates Pty Ltd SIDRA INTERSECTION Project: W:\CC-Projects\C PROJECTS\C2562 (MG) KOSMOSDAL X 89\1. Client and Related Bodies\1.13 TIS, Traffic Statements\5 Calculations\TIA\2 Sidra\4 Reitspurit_Rooihuskraal\BG\Rooihuiskraal-Rietspruit_BG.sip
103 MOVEMENT SUMMARY Rooihuiskraal Road / Rietspruit Road Junction 219 Weekday Afternoon Peak Hour Background and Development Traffic Volumes Existing Signalised Four Legged Junction Signals - Fixed Time Cycle Time = 7 seconds Site: 219 PM BG Movement Performance - Vehicles Mov ID Turn Demand Deg. Average Level of 95% Back of Queue Prop. Effective Average Flow HV Satn Delay Service Vehicles Distance Queued Stop Rate Speed veh/h % v/c sec veh m per veh km/h South: Rooihuiskraal Road (S) 1 L LOS B T LOS B R LOS B Approach LOS B East: Rietspriut Road (E) 4 L LOS C T LOS C R LOS C Approach LOS C North: Rooihuiskraal Road (N) 7 L LOS C T LOS C R LOS C Approach LOS C West: Rietspriut Road (W) 1 L LOS C T LOS C R LOS D Approach LOS C All Vehicles LOS C Level of Service (Aver. Int. Delay): LOS C. Based on average delay for all vehicle movements. LOS Method: Delay (HCM). Level of Service (Worst Movement): LOS D. LOS Method for individual vehicle movements: Delay (HCM). Approach LOS values are based on average delay for all vehicle movements. Processed: Friday, 1 February 219 2:59:17 PM Copyright 2-21 Akcelik & Associates Pty Ltd SIDRA INTERSECTION Project: W:\CC-Projects\C PROJECTS\C2562 (MG) KOSMOSDAL X 89\1. Client and Related Bodies\1.13 TIS, Traffic Statements\5 Calculations\TIA\2 Sidra\4 Reitspurit_Rooihuskraal\BG\Rooihuiskraal-Rietspruit_BG.sip
104 MOVEMENT SUMMARY Rooihuiskraal Road / Rietspruit Road Junction 224 Weekday Morning Peak Hour Background and Development Traffic Volumes Existing Signalised Four Legged Junction Signals - Fixed Time Cycle Time = 9 seconds Site: 224 AM BG Movement Performance - Vehicles Mov ID Turn Demand Deg. Average Level of 95% Back of Queue Prop. Effective Average Flow HV Satn Delay Service Vehicles Distance Queued Stop Rate Speed veh/h % v/c sec veh m per veh km/h South: Rooihuiskraal Road (S) 1 L LOS B T LOS A R LOS F Approach LOS E East: Rietspriut Road (E) 4 L LOS B T LOS C R LOS E Approach LOS C North: Rooihuiskraal Road (N) 7 L LOS C T LOS D R LOS C Approach LOS C West: Rietspriut Road (W) 1 L LOS D T LOS D R LOS D Approach LOS D All Vehicles LOS D Level of Service (Aver. Int. Delay): LOS D. Based on average delay for all vehicle movements. LOS Method: Delay (HCM). Level of Service (Worst Movement): LOS F. LOS Method for individual vehicle movements: Delay (HCM). Approach LOS values are based on average delay for all vehicle movements. Processed: Friday, 1 February 219 3:5:49 PM Copyright 2-21 Akcelik & Associates Pty Ltd SIDRA INTERSECTION Project: W:\CC-Projects\C PROJECTS\C2562 (MG) KOSMOSDAL X 89\1. Client and Related Bodies\1.13 TIS, Traffic Statements\5 Calculations\TIA\2 Sidra\4 Reitspurit_Rooihuskraal\BG\Rooihuiskraal-Rietspruit_BG.sip
105 MOVEMENT SUMMARY Rooihuiskraal Road / Rietspruit Road Junction 224 Weekday Afternoon Peak Hour Background and Development Traffic Volumes Existing Signalised Four Legged Junction Signals - Fixed Time Cycle Time = 7 seconds Site: 224 PM BG Movement Performance - Vehicles Mov ID Turn Demand Deg. Average Level of 95% Back of Queue Prop. Effective Average Flow HV Satn Delay Service Vehicles Distance Queued Stop Rate Speed veh/h % v/c sec veh m per veh km/h South: Rooihuiskraal Road (S) 1 L LOS B T LOS B R LOS C Approach LOS B East: Rietspriut Road (E) 4 L LOS B T LOS C R LOS D Approach LOS C North: Rooihuiskraal Road (N) 7 L LOS C T LOS C R LOS C Approach LOS C West: Rietspriut Road (W) 1 L LOS C T LOS C R LOS D Approach LOS C All Vehicles LOS B Level of Service (Aver. Int. Delay): LOS B. Based on average delay for all vehicle movements. LOS Method: Delay (HCM). Level of Service (Worst Movement): LOS D. LOS Method for individual vehicle movements: Delay (HCM). Approach LOS values are based on average delay for all vehicle movements. 3 x = 1. due to short lane Processed: Friday, 1 February 219 2:5:44 PM Copyright 2-21 Akcelik & Associates Pty Ltd SIDRA INTERSECTION Project: W:\CC-Projects\C PROJECTS\C2562 (MG) KOSMOSDAL X 89\1. Client and Related Bodies\1.13 TIS, Traffic Statements\5 Calculations\TIA\2 Sidra\4 Reitspurit_Rooihuskraal\BG\Rooihuiskraal-Rietspruit_BG.sip
106 MOVEMENT SUMMARY Rooihuiskraal Road / Rietspruit Road Junction 219 Weekday Morning Peak Hour Background and Development Traffic Volumes Existing Signalised Four Legged Junction Signals - Fixed Time Cycle Time = 9 seconds Site: 219 AM BG+DEV Movement Performance - Vehicles Mov ID Turn Demand Deg. Average Level of 95% Back of Queue Prop. Effective Average Flow HV Satn Delay Service Vehicles Distance Queued Stop Rate Speed veh/h % v/c sec veh m per veh km/h South: Rooihuiskraal Road (S) 1 L LOS B T LOS A R LOS D Approach LOS C East: Rietspriut Road (E) 4 L LOS B T LOS C R LOS D Approach LOS C North: Rooihuiskraal Road (N) 7 L LOS C T LOS C R LOS C Approach LOS C West: Rietspriut Road (W) 1 L LOS D T LOS D R LOS D Approach LOS D All Vehicles LOS C Level of Service (Aver. Int. Delay): LOS C. Based on average delay for all vehicle movements. LOS Method: Delay (HCM). Level of Service (Worst Movement): LOS D. LOS Method for individual vehicle movements: Delay (HCM). Approach LOS values are based on average delay for all vehicle movements. Processed: Friday, 1 February 219 3:56:51 PM Copyright 2-21 Akcelik & Associates Pty Ltd SIDRA INTERSECTION Project: W:\CC-Projects\C PROJECTS\C2562 (MG) KOSMOSDAL X 89\1. Client and Related Bodies\1.13 TIS, Traffic Statements\5 Calculations\TIA\2 Sidra\4 Reitspurit_Rooihuskraal\BG+DEV\Rooihuiskraal- Rietspruit_DEV_Rev1.sip
107 MOVEMENT SUMMARY Rooihuiskraal Road / Rietspruit Road Junction 219 Weekday Afternoon Peak Hour Background and Development Traffic Volumes Existing Signalised Four Legged Junction Signals - Fixed Time Cycle Time = 7 seconds Site: 219 PM BG+DEV Movement Performance - Vehicles Mov ID Turn Demand Deg. Average Level of 95% Back of Queue Prop. Effective Average Flow HV Satn Delay Service Vehicles Distance Queued Stop Rate Speed veh/h % v/c sec veh m per veh km/h South: Rooihuiskraal Road (S) 1 L LOS B T LOS B R LOS B Approach LOS B East: Rietspriut Road (E) 4 L LOS C T LOS C R LOS C Approach LOS C North: Rooihuiskraal Road (N) 7 L LOS C T LOS C R LOS C Approach LOS C West: Rietspriut Road (W) 1 L LOS C T LOS C R LOS D Approach LOS C All Vehicles LOS C Level of Service (Aver. Int. Delay): LOS C. Based on average delay for all vehicle movements. LOS Method: Delay (HCM). Level of Service (Worst Movement): LOS D. LOS Method for individual vehicle movements: Delay (HCM). Approach LOS values are based on average delay for all vehicle movements. Processed: Friday, 1 February 219 3:49:21 PM Copyright 2-21 Akcelik & Associates Pty Ltd SIDRA INTERSECTION Project: W:\CC-Projects\C PROJECTS\C2562 (MG) KOSMOSDAL X 89\1. Client and Related Bodies\1.13 TIS, Traffic Statements\5 Calculations\TIA\2 Sidra\4 Reitspurit_Rooihuskraal\BG+DEV\Rooihuiskraal- Rietspruit_DEV_Rev1.sip
108 MOVEMENT SUMMARY Rooihuiskraal Road / Rietspruit Road Junction 224 Weekday Morning Peak Hour Background and Development Traffic Volumes Existing Signalised Four Legged Junction Signals - Fixed Time Cycle Time = 9 seconds Site: 224 AM BG+DEV Movement Performance - Vehicles Mov ID Turn Demand Deg. Average Level of 95% Back of Queue Prop. Effective Average Flow HV Satn Delay Service Vehicles Distance Queued Stop Rate Speed veh/h % v/c sec veh m per veh km/h South: Rooihuiskraal Road (S) 1 L LOS B T LOS A R LOS F Approach LOS E East: Rietspriut Road (E) 4 L LOS B T LOS C R LOS E Approach LOS C North: Rooihuiskraal Road (N) 7 L LOS C T LOS D R LOS C Approach LOS C West: Rietspriut Road (W) 1 L LOS D T LOS D R LOS D Approach LOS D All Vehicles LOS D Level of Service (Aver. Int. Delay): LOS D. Based on average delay for all vehicle movements. LOS Method: Delay (HCM). Level of Service (Worst Movement): LOS F. LOS Method for individual vehicle movements: Delay (HCM). Approach LOS values are based on average delay for all vehicle movements. Processed: Friday, 1 February 219 3:53:58 PM Copyright 2-21 Akcelik & Associates Pty Ltd SIDRA INTERSECTION Project: W:\CC-Projects\C PROJECTS\C2562 (MG) KOSMOSDAL X 89\1. Client and Related Bodies\1.13 TIS, Traffic Statements\5 Calculations\TIA\2 Sidra\4 Reitspurit_Rooihuskraal\BG+DEV\Rooihuiskraal- Rietspruit_DEV_Rev1.sip
109 MOVEMENT SUMMARY Rooihuiskraal Road / Rietspruit Road Junction 224 Weekday Afternoon Peak Hour Background and Development Traffic Volumes Existing Signalised Four Legged Junction Signals - Fixed Time Cycle Time = 7 seconds Site: 224 PM BG+DEV Movement Performance - Vehicles Mov ID Turn Demand Deg. Average Level of 95% Back of Queue Prop. Effective Average Flow HV Satn Delay Service Vehicles Distance Queued Stop Rate Speed veh/h % v/c sec veh m per veh km/h South: Rooihuiskraal Road (S) 1 L LOS B T LOS B R LOS C Approach LOS B East: Rietspriut Road (E) 4 L LOS B T LOS C R LOS D Approach LOS C North: Rooihuiskraal Road (N) 7 L LOS C T LOS C R LOS C Approach LOS C West: Rietspriut Road (W) 1 L LOS C T LOS C R LOS D Approach LOS C All Vehicles LOS C Level of Service (Aver. Int. Delay): LOS C. Based on average delay for all vehicle movements. LOS Method: Delay (HCM). Level of Service (Worst Movement): LOS D. LOS Method for individual vehicle movements: Delay (HCM). Approach LOS values are based on average delay for all vehicle movements. 3 x = 1. due to short lane Processed: Friday, 1 February 219 3:46:36 PM Copyright 2-21 Akcelik & Associates Pty Ltd SIDRA INTERSECTION Project: W:\CC-Projects\C PROJECTS\C2562 (MG) KOSMOSDAL X 89\1. Client and Related Bodies\1.13 TIS, Traffic Statements\5 Calculations\TIA\2 Sidra\4 Reitspurit_Rooihuskraal\BG+DEV\Rooihuiskraal- Rietspruit_DEV_Rev1.sip
110 AutoJ Design counts Watercress Road Samrand Avenue 219 Background TVs, Kosmosdal Ext 14 Q 3hr tot V/C max % optimal best priority RR % &AutoJ138 horak-civilconcepts best signal % Base hour count (veh/hr) Enter hour counts here if qtr hr not already entered from North from South from West from East Ln Sn Rn Ls Ss Rs Lw Sw Rw Le Se Re AM SAT PM % growth base traffic: % growth % per annum no. of years Pedestrians per minute AM SAT PM If crossing not permitted, or does not conflict with vehicles, accept default (zero) Peds north-south (x east side) Peds south-north (x west side) Peds west-east (x north side) Peds east-west (x south side) Pn Ps Pw Pe Heavy vehicles including buses Accept default or input known values one heavy = 2 light veh. period from North from South from West from East %HV average Left Straight Right Left Straight Right Left Straight Right Left Straight Right AM % % % % % % % % % % % % SAT % % % % % % % % % % % % PM % % % % % % % % % % % % Development traffic Optional, use to add/subtract traffic to a movement(s) from North from South from West from East adjust by (veh/hr): Left Straight Right Left Straight Right Left Straight Right Left Straight Right AM SAT PM Design volume / hour Used by AutoJ for all calculations that follow Skip if satisfied, adjust if required, see below for missing counts from North from South from West from East (veh/hr) Left Straight Right Left Straight Right Left Straight Right Left Straight Right % of ADT AM % SAT.% PM % Weighting Signal will give more (>1%) or less(<1%) green time to weighted movement (see Manual). Can use, for example, to force more time for a bus route or force less time to a minor side street. Forcing more green time for one movement will cause additional delay to all other non-preference movements. Weighting will be ignored if resulting time is less than the minimums specified in "cyc". North South West East Left Str Right Left Str Right Left Str Right Left Str Right Weight 1% 1% 1% 1% 1% 1% 1% 1% 1% 1% 1% 1% Downstream block A downstream blockage will mean vehicles can't get out of intersection, green time cannot be used and will be wasted. If desired, the green time given to movements affected by blockages can be decreased or increased using the weighting above. Estimate missing volumes Use to get missing AM, PM or off peak. Only valid for urban intersections without one-ways. Missing peak estimated by reversing known peak, off peak estimated from the combined AM and PM volumes. 1 Copy missing AM or PM peak row and "paste values" back into "Design volume/hour" above. (Note, this cannot be undone once saved) 2 Only when both AM and PM peaks have values in the table below (not before), copy off peak row and "paste values" into "Design volume / hour". from North from South from West from East Left Straight Right Left Straight Right Left Straight Right Left Straight Right AM SAT PM Estimates of Average Daily Traffic (veh/day) For information from North from South from West from East (veh/day) Left Straight Right Left Straight Right Left Straight Right Left Straight Right sum Est. ADT (1) Est ADT (2) Est ADT - 12 hr n/a n/a n/a n/a n/a n/a n/a n/a n/a n/a n/a n/a ADT Professional: Date: 219 BG (C) Print: 219/2/25 registered to: Dr John Sampson
111 AutoJ Geometry &AutoJ138 horak-civilconcepts Watercress Road Samrand Avenue 219 Background TVs, Kosmosdal Ext 14 Watercress Road to North 13 from North speed (km/h) 6 grade % (+ = up) % rt. turn in gap allowed? slip must yield? n y best priority best signal signal no. lanes no. sig lanes lanes Pw ped length, width, heads y y 75 from West (m) to 2.4 slip must yield? n 1 clear 14. rt. turn in gap allowed? y (m) to clear 2 no. lanes to East grade % (+ = up) % turn lane (m) speed (km/h) 6 no.lanes if RR W= 2 2 =N Samrand Avenue median width (m) circ= 3 1 median width (m) Samrand Avenue y S= 2 3 =E from East 17.5 speed (km/h) 6 Ps ped l, w, head to West no. lanes 2 (m) to clear grade % (+ = up) % (m) to rt. turn in gap allowed? y clear 1 slip must yield? n Pe ped length, width, heads y 4. signal no. sig. lanes no. lanes 1 lanes 25 turning lane length (m) slip must yield? n rt. turn in gap allowed? grade % (+ = up) % y speed (km/h) 6 from South median (m) median (m) 25 to South Watercress Road turning lane length (m) 13 Pn ped l, w, hea 2 Q 3hr total V/C Max % optimal RR % turn lane (m) % Professional: Date: 219 BG (C) Print: 219/2/25 copyright: Dr John Sampson
112 Watercress Road Samrand Avenue 219 Background TVs, Kosmosdal Ext 14 AutoJ control Q 3hr V/C % optim V/C, delay and queue XX Stop street on all approaches this control XX % &AutoJ138 horak-civilconcepts best possible RR % Volume (incl HV) vol/hr North approach vol/hr South approach vol/hr West approach vol/hr East approach veh vol left slip left str right L+S+R Peds left slip left str right L+S+R Peds left slip left str right L+S+R Peds left slip left str right L+S+R Peds Total AM SAT PM ~lanes Control North approach South approach West approach East approach approx. L slip L S R L slip L S R L slip L S R L slip L S R capacity Stop Stop Stop Stop Stop Stop Stop Stop Stop Stop Stop Stop #DIV/! Volume to Capacity ratio LOS A<.5, B<.8, C<.9, D<.95, E<.99 LOS A-B C-D E F V/C North approach V/C South approach V/C West approach V/C East approach V/C L slip L S R all Peds L slip L S R all Peds L slip L S R all Peds L slip L S R all Peds i/section AM SAT PM max V/C; movement, approach, pedestrian, i/s Average Delay per vehicle (seconds) LOS A<1, B<15, C<25, D<35, E<5 LOS A-B C-D E F Ave Delay North approach Ave Delay South approach Ave Delay West approach Ave Delay East approach ave. del L slip L S R all Peds L slip L S R all Peds L slip L S R all Peds L slip L S R all Peds i/section AM SAT PM Average Queue Length (vehicles) (= Total Delay in veh-hrs/hr) Q North approach Q South approach Q West approach Q East approach Q L slip L S R all Peds L slip L S R all Peds L slip L S R all Peds L slip L S R all Peds Total AM SAT PM max Professional: Date: 219 BG (C) Print: 219/2/25 registered to: Dr John Sampson
113 AutoJ Design counts Watercress Road Samrand Avenue 224 PH Background TVs, Kosmosdal Ext 14 Q 3hr tot V/C max % optimal best priority RR % &AutoJ138 horak-civilconcepts best signal % Base hour count (veh/hr) Enter hour counts here if qtr hr not already entered from North from South from West from East Ln Sn Rn Ls Ss Rs Lw Sw Rw Le Se Re AM SAT PM % growth base traffic: % growth % per annum no. of years Pedestrians per minute AM SAT PM If crossing not permitted, or does not conflict with vehicles, accept default (zero) Peds north-south (x east side) Peds south-north (x west side) Peds west-east (x north side) Peds east-west (x south side) Pn Ps Pw Pe Heavy vehicles including buses Accept default or input known values one heavy = 2 light veh. period from North from South from West from East %HV average Left Straight Right Left Straight Right Left Straight Right Left Straight Right AM % % % % % % % % % % % % SAT % % % % % % % % % % % % PM % % % % % % % % % % % % Development traffic Optional, use to add/subtract traffic to a movement(s) from North from South from West from East adjust by (veh/hr): Left Straight Right Left Straight Right Left Straight Right Left Straight Right AM SAT PM Design volume / hour Used by AutoJ for all calculations that follow Skip if satisfied, adjust if required, see below for missing counts from North from South from West from East (veh/hr) Left Straight Right Left Straight Right Left Straight Right Left Straight Right % of ADT AM % SAT.% PM % Weighting Signal will give more (>1%) or less(<1%) green time to weighted movement (see Manual). Can use, for example, to force more time for a bus route or force less time to a minor side street. Forcing more green time for one movement will cause additional delay to all other non-preference movements. Weighting will be ignored if resulting time is less than the minimums specified in "cyc". North South West East Left Str Right Left Str Right Left Str Right Left Str Right Weight 1% 1% 1% 1% 1% 1% 1% 1% 1% 1% 1% 1% Downstream block A downstream blockage will mean vehicles can't get out of intersection, green time cannot be used and will be wasted. If desired, the green time given to movements affected by blockages can be decreased or increased using the weighting above. Estimate missing volumes Use to get missing AM, PM or off peak. Only valid for urban intersections without one-ways. Missing peak estimated by reversing known peak, off peak estimated from the combined AM and PM volumes. 1 Copy missing AM or PM peak row and "paste values" back into "Design volume/hour" above. (Note, this cannot be undone once saved) 2 Only when both AM and PM peaks have values in the table below (not before), copy off peak row and "paste values" into "Design volume / hour". from North from South from West from East Left Straight Right Left Straight Right Left Straight Right Left Straight Right AM SAT PM Estimates of Average Daily Traffic (veh/day) For information from North from South from West from East (veh/day) Left Straight Right Left Straight Right Left Straight Right Left Straight Right sum Est. ADT (1) Est ADT (2) Est ADT - 12 hr n/a n/a n/a n/a n/a n/a n/a n/a n/a n/a n/a n/a ADT Professional: Date: 224 BG (C) Print: 219/2/25 registered to: Dr John Sampson
114 AutoJ Geometry &AutoJ138 horak-civilconcepts Watercress Road Samrand Avenue 224 PH Background TVs, Kosmosdal Ext 14 Watercress Road to North 13 from North speed (km/h) 6 grade % (+ = up) % rt. turn in gap allowed? slip must yield? n 12 y best priority best signal signal no. lanes no. sig lanes lanes Pw ped length, width, heads y y 75 from West (m) to 2.4 slip must yield? n 1 clear 14. rt. turn in gap allowed? y (m) to clear 2 no. lanes to East grade % (+ = up) % turn lane (m) speed (km/h) 6 no.lanes if RR W= 2 2 =N Samrand Avenue median width (m) circ= 3 1 median width (m) Samrand Avenue y S= 2 3 =E from East 17.5 speed (km/h) 6 Ps ped l, w, head to West no. lanes 2 (m) to clear grade % (+ = up) % (m) to rt. turn in gap allowed? y clear 1 slip must yield? n Pe ped length, width, heads y 4. signal no. sig. lanes no. lanes 1 lanes 25 turning lane length (m) slip must yield? n rt. turn in gap allowed? grade % (+ = up) % y speed (km/h) 6 from South median (m) median (m) 25 to South Watercress Road turning lane length (m) 13 Pn ped l, w, hea Q 3hr total V/C Max % optimal RR % 2 turn lane (m) % Professional: Date: 224 BG (C) Print: 219/2/25 copyright: Dr John Sampson
115 Watercress Road Samrand Avenue 224 PH Background TVs, Kosmosdal Ext 14 AutoJ control Q 3hr V/C % optim V/C, delay and queue XX Stop street on all approaches this control XX % &AutoJ138 horak-civilconcepts best possible RR % Volume (incl HV) vol/hr North approach vol/hr South approach vol/hr West approach vol/hr East approach veh vol left slip left str right L+S+R Peds left slip left str right L+S+R Peds left slip left str right L+S+R Peds left slip left str right L+S+R Peds Total AM SAT PM ~lanes Control North approach South approach West approach East approach approx. L slip L S R L slip L S R L slip L S R L slip L S R capacity Stop Stop Stop Stop Stop Stop Stop Stop Stop Stop Stop Stop #DIV/! 2 88 Volume to Capacity ratio LOS A<.5, B<.8, C<.9, D<.95, E<.99 LOS A-B C-D E F V/C North approach V/C South approach V/C West approach V/C East approach V/C L slip L S R all Peds L slip L S R all Peds L slip L S R all Peds L slip L S R all Peds i/section AM SAT PM max V/C; movement, approach, pedestrian, i/s Average Delay per vehicle (seconds) LOS A<1, B<15, C<25, D<35, E<5 LOS A-B C-D E F Ave Delay North approach Ave Delay South approach Ave Delay West approach Ave Delay East approach ave. del L slip L S R all Peds L slip L S R all Peds L slip L S R all Peds L slip L S R all Peds i/section AM SAT PM Average Queue Length (vehicles) (= Total Delay in veh-hrs/hr) Q North approach Q South approach Q West approach Q East approach Q L slip L S R all Peds L slip L S R all Peds L slip L S R all Peds L slip L S R all Peds Total AM SAT PM max Professional: Date: 224 BG (C) Print: 219/2/25 registered to: Dr John Sampson
116 AutoJ Design counts Watercress Road Samrand Avenue 219 Background and Development TVs, Kosmosdal Ext 14 Q 3hr tot V/C max % optimal best priority RR % &AutoJ138 horak-civilconcepts best signal % Base hour count (veh/hr) Enter hour counts here if qtr hr not already entered from North from South from West from East Ln Sn Rn Ls Ss Rs Lw Sw Rw Le Se Re AM SAT PM % growth base traffic: % growth % per annum no. of years Pedestrians per minute AM SAT PM If crossing not permitted, or does not conflict with vehicles, accept default (zero) Peds north-south (x east side) Peds south-north (x west side) Peds west-east (x north side) Peds east-west (x south side) Pn Ps Pw Pe Heavy vehicles including buses Accept default or input known values one heavy = 2 light veh. period from North from South from West from East %HV average Left Straight Right Left Straight Right Left Straight Right Left Straight Right AM % % % % % % % % % % % % SAT % % % % % % % % % % % % PM % % % % % % % % % % % % Development traffic Optional, use to add/subtract traffic to a movement(s) from North from South from West from East adjust by (veh/hr): Left Straight Right Left Straight Right Left Straight Right Left Straight Right AM SAT PM Design volume / hour Used by AutoJ for all calculations that follow Skip if satisfied, adjust if required, see below for missing counts from North from South from West from East (veh/hr) Left Straight Right Left Straight Right Left Straight Right Left Straight Right % of ADT AM % SAT.% PM % Weighting Signal will give more (>1%) or less(<1%) green time to weighted movement (see Manual). Can use, for example, to force more time for a bus route or force less time to a minor side street. Forcing more green time for one movement will cause additional delay to all other non-preference movements. Weighting will be ignored if resulting time is less than the minimums specified in "cyc". North South West East Left Str Right Left Str Right Left Str Right Left Str Right Weight 1% 1% 1% 1% 1% 1% 1% 1% 1% 1% 1% 1% Downstream block A downstream blockage will mean vehicles can't get out of intersection, green time cannot be used and will be wasted. If desired, the green time given to movements affected by blockages can be decreased or increased using the weighting above. Estimate missing volumes Use to get missing AM, PM or off peak. Only valid for urban intersections without one-ways. Missing peak estimated by reversing known peak, off peak estimated from the combined AM and PM volumes. 1 Copy missing AM or PM peak row and "paste values" back into "Design volume/hour" above. (Note, this cannot be undone once saved) 2 Only when both AM and PM peaks have values in the table below (not before), copy off peak row and "paste values" into "Design volume / hour". from North from South from West from East Left Straight Right Left Straight Right Left Straight Right Left Straight Right AM SAT PM Estimates of Average Daily Traffic (veh/day) For information from North from South from West from East (veh/day) Left Straight Right Left Straight Right Left Straight Right Left Straight Right sum Est. ADT (1) Est ADT (2) Est ADT - 12 hr n/a n/a n/a n/a n/a n/a n/a n/a n/a n/a n/a n/a ADT Professional: Date: 219 BG+D (C) Print: 219/2/25 registered to: Dr John Sampson
117 AutoJ Geometry &AutoJ138 horak-civilconcepts Watercress Road Samrand Avenue 219 Background and Development TVs, Kosmosdal Ext 14 Watercress Road to North 13 from North speed (km/h) 6 grade % (+ = up) % rt. turn in gap allowed? slip must yield? n 93 y best priority best signal signal no. lanes no. sig lanes lanes Pw ped length, width, heads y y 75 from West (m) to 2.4 slip must yield? n 1 clear 21. rt. turn in gap allowed? y (m) to clear 2 no. lanes to East grade % (+ = up) % turn lane (m) speed (km/h) 6 no.lanes if RR W= 2 2 =N Samrand Avenue median width (m) circ= 3 median width (m) Samrand Avenue y S= 2 3 =E from East 17.5 speed (km/h) 6 Ps ped l, w, head to West no. lanes 2 (m) to clear grade % (+ = up) % (m) to rt. turn in gap allowed? y clear 1 slip must yield? n Pe ped length, width, heads y 4. signal no. sig. lanes no. lanes 1 lanes 25 turning lane length (m) 3 slip must yield? n rt. turn in gap allowed? grade % (+ = up) % y speed (km/h) 6 from South median (m) median (m) 25 to South Watercress Road turning lane length (m) 13 Pn ped l, w, hea 2 Q 3hr total V/C Max % optimal RR % turn lane (m) % Professional: Date: 219 BG+D (C) Print: 219/2/25 copyright: Dr John Sampson
118 AutoJ Results summary Watercress Road Samrand 19 Avenue Background and Development TVs, Kosmosdal Ext 14 Q 3hr tot V/C max % optimal best priority RR % &AutoJ138 horak-civilconcepts best signal % Automated Intersection Analysis Results Level of service is colour coded. Values in the table are hourly. AVE DELAY (secs/veh) QUEUE V/C (max) PERF INDEX AM SAT PM sum 3hr movement approach i-section pedestrian % optimal PI weighting 2% 2% 2% 2% 1% 1% % % 1% Control type Priority Xns % Xwe % XX % RR % 2 stage % 3 stage 3ns % 3we % n % s % w % e % 4 stage 4nswe % n4we % s4we % w4ns % e4ns % nw % ne % sw % se % separate n-s % (split) stage w-e % n-s-4we % w-e-4ns % n-s-w-e % min all ICD minimums Optimum Control and Performance AVE DELAY (secs/veh) QUEUE V/C (max) PERF INDEX best ctrl AM SAT PM sum 3hr movement approach i-section pedestrian % optimal Best Priority RR % Best Signal % Best Overall RR % Level of Service Key LOS A-B C-D E F Priority control, average delay (secs / veh) A<1, B<15, C<25, D<35, E<5, F=5+ Signal control, average delay (secs / veh) A<1, B<2, C<35, D<55, E<8, F=8+ Volume / capacity (V/C) A<.5, B<.8, C<.9, D<.95, E<.99, F=.99+ Pedestrians (ped/min/m) A<7, B<23, C<33, D<49, E<82, F=82+ Pedestrians (V/C) A<.1, B<.3, C<.4, D<.6, E<.97, F=.97+ Professional: Date: 219 BG+D (C) Print: 219/2/25 copyright: Dr John Sampson
119 Watercress Road Samrand Avenue 219 Background and Development TVs, Kosmosdal Ext 14 AutoJ control Q 3hr V/C % optim V/C, delay and queue XX Stop street on all approaches this control XX % &AutoJ138 horak-civilconcepts best possible RR % Volume (incl HV) vol/hr North approach vol/hr South approach vol/hr West approach vol/hr East approach veh vol left slip left str right L+S+R Peds left slip left str right L+S+R Peds left slip left str right L+S+R Peds left slip left str right L+S+R Peds Total AM SAT PM ~lanes Control North approach South approach West approach East approach approx. L slip L S R L slip L S R L slip L S R L slip L S R capacity Stop Stop Stop Stop Stop Stop Stop Stop Stop Stop Stop Stop #DIV/! Volume to Capacity ratio LOS A<.5, B<.8, C<.9, D<.95, E<.99 LOS A-B C-D E F V/C North approach V/C South approach V/C West approach V/C East approach V/C L slip L S R all Peds L slip L S R all Peds L slip L S R all Peds L slip L S R all Peds i/section AM SAT PM max V/C; movement, approach, pedestrian, i/s Average Delay per vehicle (seconds) LOS A<1, B<15, C<25, D<35, E<5 LOS A-B C-D E F Ave Delay North approach Ave Delay South approach Ave Delay West approach Ave Delay East approach ave. del L slip L S R all Peds L slip L S R all Peds L slip L S R all Peds L slip L S R all Peds i/section AM SAT PM Average Queue Length (vehicles) (= Total Delay in veh-hrs/hr) Q North approach Q South approach Q West approach Q East approach Q L slip L S R all Peds L slip L S R all Peds L slip L S R all Peds L slip L S R all Peds Total AM SAT PM max Professional: Date: 219 BG+D (C) Print: 219/2/25 registered to: Dr John Sampson
120 AutoJ Design counts Watercress Road Samrand Avenue 224 PH Background and Development TVs, Kosmosdal Ext 1 Q 3hr tot V/C max % optimal best priority RR % &AutoJ138 horak-civilconcepts best signal % Base hour count (veh/hr) Enter hour counts here if qtr hr not already entered from North from South from West from East Ln Sn Rn Ls Ss Rs Lw Sw Rw Le Se Re AM SAT PM % growth base traffic: % growth % per annum no. of years Pedestrians per minute AM SAT PM If crossing not permitted, or does not conflict with vehicles, accept default (zero) Peds north-south (x east side) Peds south-north (x west side) Peds west-east (x north side) Peds east-west (x south side) Pn Ps Pw Pe Heavy vehicles including buses Accept default or input known values one heavy = 2 light veh. period from North from South from West from East %HV average Left Straight Right Left Straight Right Left Straight Right Left Straight Right AM % % % % % % % % % % % % SAT % % % % % % % % % % % % PM % % % % % % % % % % % % Development traffic Optional, use to add/subtract traffic to a movement(s) from North from South from West from East adjust by (veh/hr): Left Straight Right Left Straight Right Left Straight Right Left Straight Right AM SAT PM Design volume / hour Used by AutoJ for all calculations that follow Skip if satisfied, adjust if required, see below for missing counts from North from South from West from East (veh/hr) Left Straight Right Left Straight Right Left Straight Right Left Straight Right % of ADT AM % SAT.% PM % Weighting Signal will give more (>1%) or less(<1%) green time to weighted movement (see Manual). Can use, for example, to force more time for a bus route or force less time to a minor side street. Forcing more green time for one movement will cause additional delay to all other non-preference movements. Weighting will be ignored if resulting time is less than the minimums specified in "cyc". North South West East Left Str Right Left Str Right Left Str Right Left Str Right Weight 1% 1% 1% 1% 1% 1% 1% 1% 1% 1% 1% 1% Downstream block A downstream blockage will mean vehicles can't get out of intersection, green time cannot be used and will be wasted. If desired, the green time given to movements affected by blockages can be decreased or increased using the weighting above. Estimate missing volumes Use to get missing AM, PM or off peak. Only valid for urban intersections without one-ways. Missing peak estimated by reversing known peak, off peak estimated from the combined AM and PM volumes. 1 Copy missing AM or PM peak row and "paste values" back into "Design volume/hour" above. (Note, this cannot be undone once saved) 2 Only when both AM and PM peaks have values in the table below (not before), copy off peak row and "paste values" into "Design volume / hour". from North from South from West from East Left Straight Right Left Straight Right Left Straight Right Left Straight Right AM SAT PM Estimates of Average Daily Traffic (veh/day) For information from North from South from West from East (veh/day) Left Straight Right Left Straight Right Left Straight Right Left Straight Right sum Est. ADT (1) Est ADT (2) Est ADT - 12 hr n/a n/a n/a n/a n/a n/a n/a n/a n/a n/a n/a n/a ADT Professional: Date: 224 BG+D (C) Print: 219/2/25 registered to: Dr John Sampson
121 AutoJ Geometry &AutoJ138 horak-civilconcepts Watercress Road Samrand Avenue 224 PH Background and Development TVs, Kosmosdal Ext 14 Watercress Road to North 13 from North speed (km/h) 6 grade % (+ = up) % rt. turn in gap allowed? slip must yield? n 16 y best priority best signal signal no. lanes no. sig lanes lanes Pw ped length, width, heads y y 75 from West (m) to 2.4 slip must yield? n 1 clear 21. rt. turn in gap allowed? y (m) to clear 2 no. lanes to East grade % (+ = up) % turn lane (m) speed (km/h) 6 no.lanes if RR W= 2 2 =N Samrand Avenue median width (m) circ= 3 median width (m) Samrand Avenue y S= 2 3 =E from East 17.5 speed (km/h) 6 Ps ped l, w, head to West no. lanes 2 (m) to clear grade % (+ = up) % (m) to rt. turn in gap allowed? y clear 1 slip must yield? n Pe ped length, width, heads y 4. signal no. sig. lanes no. lanes 1 lanes 25 turning lane length (m) 4 slip must yield? n rt. turn in gap allowed? grade % (+ = up) % y speed (km/h) 6 from South median (m) median (m) 25 to South Watercress Road turning lane length (m) 13 Pn ped l, w, hea 2 Q 3hr total V/C Max % optimal RR % turn lane (m) % Professional: Date: 224 BG+D (C) Print: 219/2/25 copyright: Dr John Sampson
122 Watercress Road Samrand Avenue 224 PH Background and Development TVs, Kosmosdal Ext 14 AutoJ control Q 3hr V/C % optim V/C, delay and queue XX Stop street on all approaches this control XX % &AutoJ138 horak-civilconcepts best possible RR % Volume (incl HV) vol/hr North approach vol/hr South approach vol/hr West approach vol/hr East approach veh vol left slip left str right L+S+R Peds left slip left str right L+S+R Peds left slip left str right L+S+R Peds left slip left str right L+S+R Peds Total AM SAT PM ~lanes Control North approach South approach West approach East approach approx. L slip L S R L slip L S R L slip L S R L slip L S R capacity Stop Stop Stop Stop Stop Stop Stop Stop Stop Stop Stop Stop #DIV/! 2 57 Volume to Capacity ratio LOS A<.5, B<.8, C<.9, D<.95, E<.99 LOS A-B C-D E F V/C North approach V/C South approach V/C West approach V/C East approach V/C L slip L S R all Peds L slip L S R all Peds L slip L S R all Peds L slip L S R all Peds i/section AM SAT PM max V/C; movement, approach, pedestrian, i/s Average Delay per vehicle (seconds) LOS A<1, B<15, C<25, D<35, E<5 LOS A-B C-D E F Ave Delay North approach Ave Delay South approach Ave Delay West approach Ave Delay East approach ave. del L slip L S R all Peds L slip L S R all Peds L slip L S R all Peds L slip L S R all Peds i/section AM SAT PM Average Queue Length (vehicles) (= Total Delay in veh-hrs/hr) Q North approach Q South approach Q West approach Q East approach Q L slip L S R all Peds L slip L S R all Peds L slip L S R all Peds L slip L S R all Peds Total AM SAT PM max Professional: Date: 224 BG+D (C) Print: 219/2/25 registered to: Dr John Sampson
123 AutoJ Design counts Rooihuskraal Road (M37) Full Access Kosmosdal Ext 12, 219 BG+DEV Q 3hr tot V/C max % optimal best priority Xwe % &AutoJ138 horak-civilconcepts best signal % Base hour count (veh/hr) Enter hour counts here if qtr hr not already entered from North from South from West from East Ln Sn Rn Ls Ss Rs Lw Sw Rw Le Se Re AM off PM % growth base traffic: % growth % per annum no. of years Pedestrians per minute AM off PM If crossing not permitted, or does not conflict with vehicles, accept default (zero) Peds north-south (x east side) Peds south-north (x west side) Peds west-east (x north side) Peds east-west (x south side) Pn Ps Pw Pe Heavy vehicles including buses Accept default or input known values one heavy = 2 light veh. period from North from South from West from East %HV average Left Straight Right Left Straight Right Left Straight Right Left Straight Right AM % % % % % % % % % % % % off % % % % % % % % % % % % PM % % % % % % % % % % % % Development traffic Optional, use to add/subtract traffic to a movement(s) from North from South from West from East adjust by (veh/hr): Left Straight Right Left Straight Right Left Straight Right Left Straight Right AM off PM Design volume / hour Used by AutoJ for all calculations that follow Skip if satisfied, adjust if required, see below for missing counts from North from South from West from East (veh/hr) Left Straight Right Left Straight Right Left Straight Right Left Straight Right % of ADT AM % off.% PM % Weighting Signal will give more (>1%) or less(<1%) green time to weighted movement (see Manual). Can use, for example, to force more time for a bus route or force less time to a minor side street. Forcing more green time for one movement will cause additional delay to all other non-preference movements. Weighting will be ignored if resulting time is less than the minimums specified in "cyc". North South West East Left Str Right Left Str Right Left Str Right Left Str Right Weight 1% 1% 1% 1% 1% 1% 1% 1% 1% 1% 1% 1% Downstream block A downstream blockage will mean vehicles can't get out of intersection, green time cannot be used and will be wasted. If desired, the green time given to movements affected by blockages can be decreased or increased using the weighting above. Estimate missing volumes Use to get missing AM, PM or off peak. Only valid for urban intersections without one-ways. Missing peak estimated by reversing known peak, off peak estimated from the combined AM and PM volumes. 1 Copy missing AM or PM peak row and "paste values" back into "Design volume/hour" above. (Note, this cannot be undone once saved) 2 Only when both AM and PM peaks have values in the table below (not before), copy off peak row and "paste values" into "Design volume / hour". from North from South from West from East Left Straight Right Left Straight Right Left Straight Right Left Straight Right AM off PM Estimates of Average Daily Traffic (veh/day) For information from North from South from West from East (veh/day) Left Straight Right Left Straight Right Left Straight Right Left Straight Right sum Est. ADT (1) Est ADT (2) Est ADT - 12 hr n/a n/a n/a n/a n/a n/a n/a n/a n/a n/a n/a n/a ADT Professional: Date: Full Access_BG+DEV Print: 219/2/25 registered to: Dr John Sampson
124 AutoJ Geometry &AutoJ138 horak-civilconcepts Rooihuskraal Road (M37) Full Access Kosmosdal Ext 12, 219 BG+DEV Rooihuskraal Road (M37) to North 25 from North speed (km/h) 7 grade % (+ = up) % rt. turn in gap allowed? 15 slip must yield? n y best priority best signal signal no. lanes no. sig lanes lanes Pw ped length, width, heads y y 5 from West (m) to 2.4 slip must yield? n clear 3.5 turn lane (m) rt. turn in gap allowed? y 21. (m) to clear 1 no. lanes to East grade % (+ = up) % 1 speed (km/h) 6 no.lanes if RR 5 W= 1 1 =N Full Access median width (m) circ= 2 median width (m) Full Access y S= 2 =E from East 7. speed (km/h) 6 Ps ped l, w, head to West no. lanes 1 (m) to clear. grade % (+ = up) % (m) to rt. turn in gap allowed? y clear slip must yield? n Pe ped length, width, heads y. 4 signal no. sig. lanes no. lanes 1 lanes 25 turning lane length (m) 1 slip must yield? n rt. turn in gap allowed? grade % (+ = up) % y speed (km/h) 7 from South median (m) median (m) 5 to South Rooihuskraal Road (M37) turning lane length (m) 5 Pn ped l, w, hea 2 Q 3hr total V/C Max % optimal Xwe % turn lane (m) % Professional: Date: Full Access_BG+DEV Print: 219/2/25 copyright: Dr John Sampson
125 Rooihuskraal Road (M37) Full Access Kosmosdal Ext 12, 219 BG+DEV AutoJ control Q 3hr V/C % optim V/C, delay and queue Xwe Stop street on west and east approaches this control Xwe % &AutoJ138 horak-civilconcepts best possible Xwe % Volume (incl HV) vol/hr North approach vol/hr South approach vol/hr West approach vol/hr East approach veh vol left slip left str right L+S+R Peds left slip left str right L+S+R Peds left slip left str right L+S+R Peds left slip left str right L+S+R Peds Total AM off PM ~lanes Control North approach South approach West approach East approach approx. L slip L S R L slip L S R L slip L S R L slip L S R capacity Yield Stop Stop Stop Stop Stop #DIV/! Volume to Capacity ratio LOS A<.5, B<.8, C<.9, D<.95, E<.99 LOS A-B C-D E F V/C North approach V/C South approach V/C West approach V/C East approach V/C L slip L S R all Peds L slip L S R all Peds L slip L S R all Peds L slip L S R all Peds i/section AM off PM max V/C; movement, approach, pedestrian, i/s Average Delay per vehicle (seconds) LOS A<1, B<15, C<25, D<35, E<5 LOS A-B C-D E F Ave Delay North approach Ave Delay South approach Ave Delay West approach Ave Delay East approach ave. del L slip L S R all Peds L slip L S R all Peds L slip L S R all Peds L slip L S R all Peds i/section AM off PM Average Queue Length (= Total Delay in veh-hrs/hr) Q North approach Q South approach Q West approach Q East approach Q L slip L S R all Peds L slip L S R all Peds L slip L S R all Peds L slip L S R all Peds Total AM off PM max Professional: Date: Full Access_BG+DEV Print: 219/2/25 registered to: Dr John Sampson
126 AutoJ Design counts Rooihuskraal Road (M37) Full Access Kosmosdal Ext 12, 224 BG+DEV Q 3hr tot V/C max % optimal best priority Xwe % &AutoJ138 horak-civilconcepts best signal % Base hour count (veh/hr) Enter hour counts here if qtr hr not already entered from North from South from West from East Ln Sn Rn Ls Ss Rs Lw Sw Rw Le Se Re AM off PM % growth base traffic: % growth % per annum no. of years Pedestrians per minute AM off PM If crossing not permitted, or does not conflict with vehicles, accept default (zero) Peds north-south (x east side) Peds south-north (x west side) Peds west-east (x north side) Peds east-west (x south side) Pn Ps Pw Pe Heavy vehicles including buses Accept default or input known values one heavy = 2 light veh. period from North from South from West from East %HV average Left Straight Right Left Straight Right Left Straight Right Left Straight Right AM % % % % % % % % % % % % off % % % % % % % % % % % % PM % % % % % % % % % % % % Development traffic Optional, use to add/subtract traffic to a movement(s) from North from South from West from East adjust by (veh/hr): Left Straight Right Left Straight Right Left Straight Right Left Straight Right AM off PM Design volume / hour Used by AutoJ for all calculations that follow Skip if satisfied, adjust if required, see below for missing counts from North from South from West from East (veh/hr) Left Straight Right Left Straight Right Left Straight Right Left Straight Right % of ADT AM % off.% PM % Weighting Signal will give more (>1%) or less(<1%) green time to weighted movement (see Manual). Can use, for example, to force more time for a bus route or force less time to a minor side street. Forcing more green time for one movement will cause additional delay to all other non-preference movements. Weighting will be ignored if resulting time is less than the minimums specified in "cyc". North South West East Left Str Right Left Str Right Left Str Right Left Str Right Weight 1% 1% 1% 1% 1% 1% 1% 1% 1% 1% 1% 1% Downstream block A downstream blockage will mean vehicles can't get out of intersection, green time cannot be used and will be wasted. If desired, the green time given to movements affected by blockages can be decreased or increased using the weighting above. Estimate missing volumes Use to get missing AM, PM or off peak. Only valid for urban intersections without one-ways. Missing peak estimated by reversing known peak, off peak estimated from the combined AM and PM volumes. 1 Copy missing AM or PM peak row and "paste values" back into "Design volume/hour" above. (Note, this cannot be undone once saved) 2 Only when both AM and PM peaks have values in the table below (not before), copy off peak row and "paste values" into "Design volume / hour". from North from South from West from East Left Straight Right Left Straight Right Left Straight Right Left Straight Right AM off PM Estimates of Average Daily Traffic (veh/day) For information from North from South from West from East (veh/day) Left Straight Right Left Straight Right Left Straight Right Left Straight Right sum Est. ADT (1) Est ADT (2) Est ADT - 12 hr n/a n/a n/a n/a n/a n/a n/a n/a n/a n/a n/a n/a ADT Professional: Date: Full Access_BG+DEV_224 Print: 219/2/25 registered to: Dr John Sampson
127 AutoJ Geometry &AutoJ138 horak-civilconcepts Rooihuskraal Road (M37) Full Access Kosmosdal Ext 12, 224 BG+DEV Rooihuskraal Road (M37) to North 25 from North speed (km/h) 7 grade % (+ = up) % rt. turn in gap allowed? 15 slip must yield? n y best priority best signal signal no. lanes no. sig lanes lanes Pw ped length, width, heads y y 5 from West (m) to 2.4 slip must yield? n clear 3.5 turn lane (m) rt. turn in gap allowed? y 21. (m) to clear 1 no. lanes to East grade % (+ = up) % 1 speed (km/h) 6 no.lanes if RR 5 W= 1 1 =N Full Access median width (m) circ= 2 median width (m) Full Access y S= 2 =E from East 7. speed (km/h) 6 Ps ped l, w, head to West no. lanes 1 (m) to clear. grade % (+ = up) % (m) to rt. turn in gap allowed? y clear slip must yield? n Pe ped length, width, heads y. 4 signal no. sig. lanes no. lanes 1 lanes 25 turning lane length (m) 1 slip must yield? n rt. turn in gap allowed? grade % (+ = up) % y speed (km/h) 7 from South median (m) median (m) 5 to South Rooihuskraal Road (M37) turning lane length (m) 5 Pn ped l, w, hea 2 Q 3hr total V/C Max % optimal Xwe % turn lane (m) % Professional: Date: Full Access_BG+DEV_224 Print: 219/2/25 copyright: Dr John Sampson
128 Rooihuskraal Road (M37) Full Access Kosmosdal Ext 12, 224 BG+DEV AutoJ control Q 3hr V/C % optim V/C, delay and queue Xwe Stop street on west and east approaches this control Xwe % &AutoJ138 horak-civilconcepts best possible Xwe % Volume (incl HV) vol/hr North approach vol/hr South approach vol/hr West approach vol/hr East approach veh vol left slip left str right L+S+R Peds left slip left str right L+S+R Peds left slip left str right L+S+R Peds left slip left str right L+S+R Peds Total AM off PM ~lanes Control North approach South approach West approach East approach approx. L slip L S R L slip L S R L slip L S R L slip L S R capacity Yield Stop Stop Stop Stop Stop 4 31 #DIV/! Volume to Capacity ratio LOS A<.5, B<.8, C<.9, D<.95, E<.99 LOS A-B C-D E F V/C North approach V/C South approach V/C West approach V/C East approach V/C L slip L S R all Peds L slip L S R all Peds L slip L S R all Peds L slip L S R all Peds i/section AM off PM max V/C; movement, approach, pedestrian, i/s Average Delay per vehicle (seconds) LOS A<1, B<15, C<25, D<35, E<5 LOS A-B C-D E F Ave Delay North approach Ave Delay South approach Ave Delay West approach Ave Delay East approach ave. del L slip L S R all Peds L slip L S R all Peds L slip L S R all Peds L slip L S R all Peds i/section AM off PM Average Queue Length (= Total Delay in veh-hrs/hr) Q North approach Q South approach Q West approach Q East approach Q L slip L S R all Peds L slip L S R all Peds L slip L S R all Peds L slip L S R all Peds Total AM off PM max Professional: Date: Full Access_BG+DEV_224 Print: 219/2/25 registered to: Dr John Sampson
129 ANNEXURE F1 CITY OF TSHWANE EXISTING TRAFFIC SIGNAL TIMING PLANS
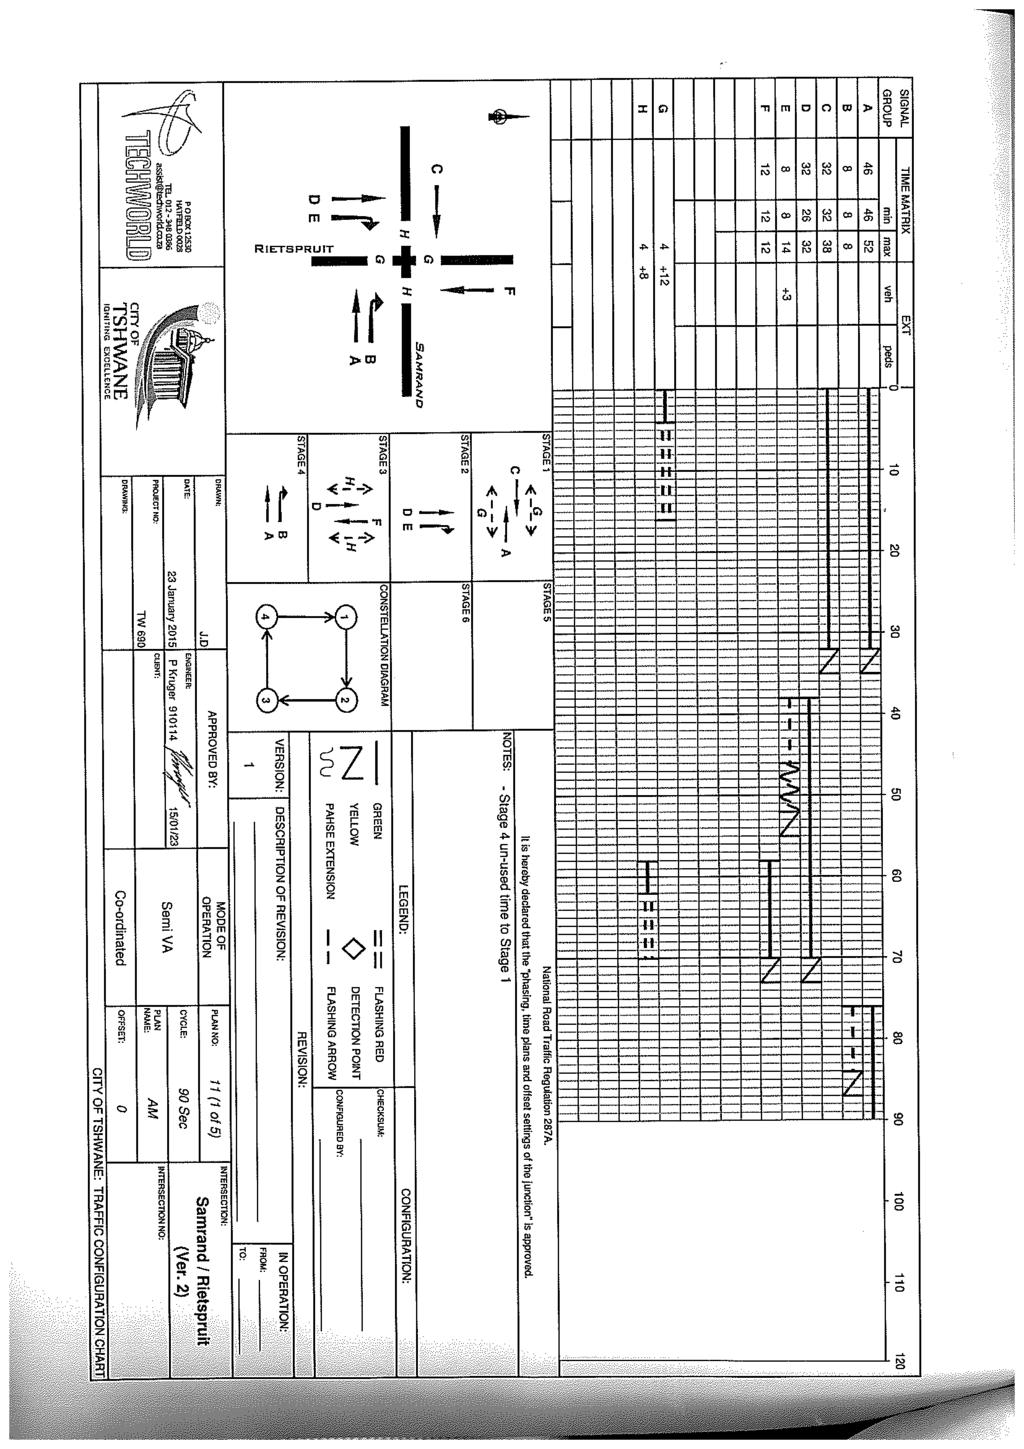
130
131
132
133
134
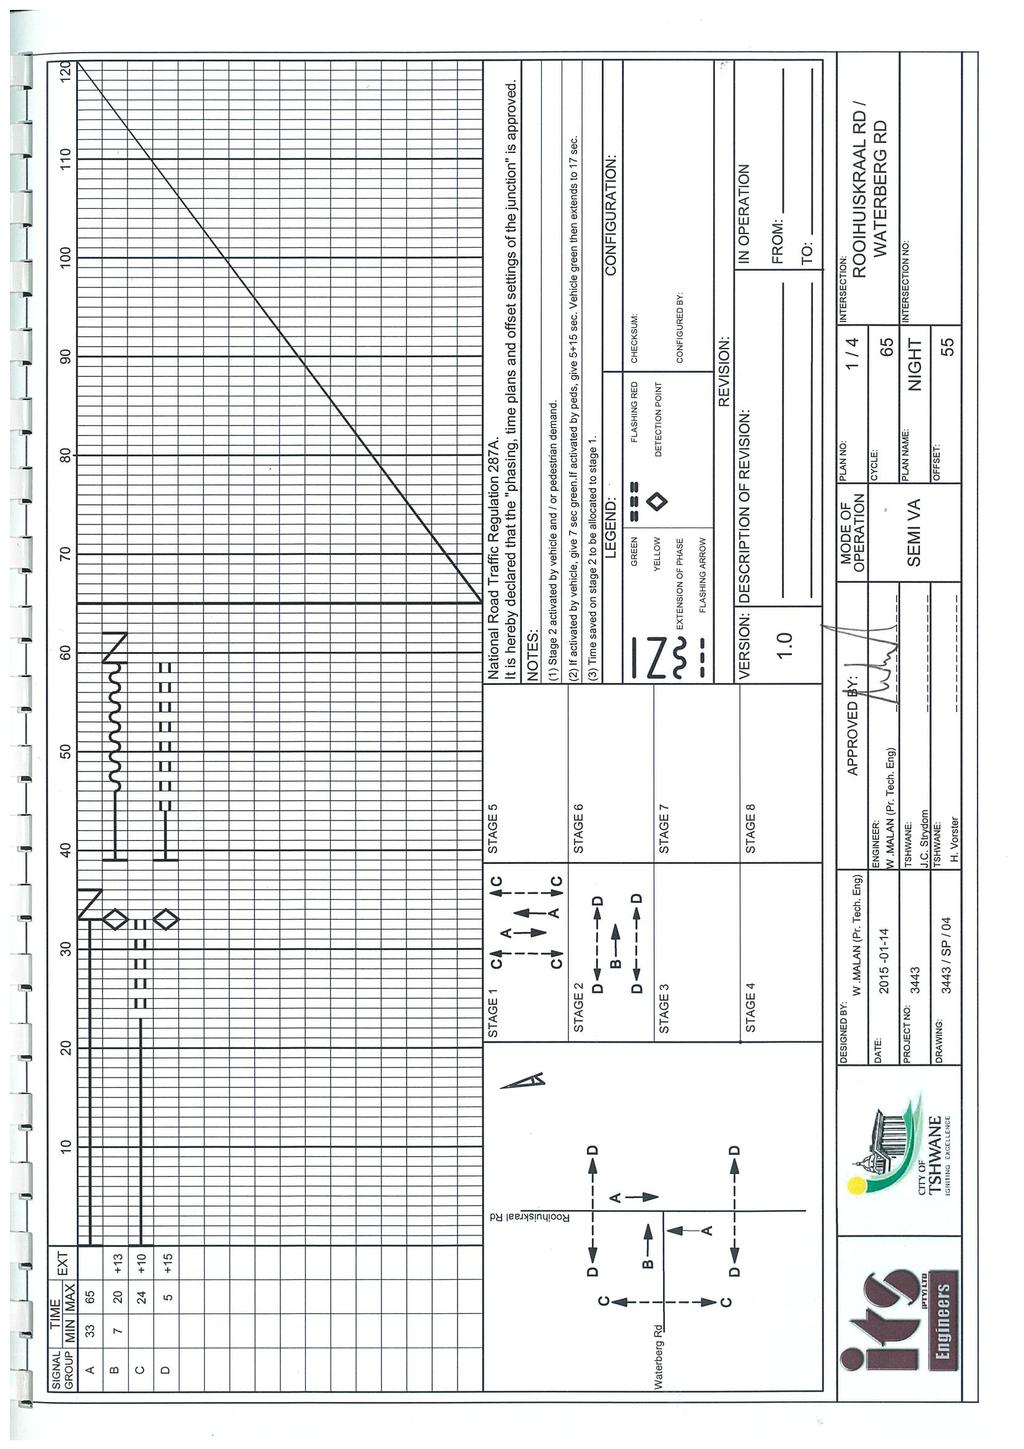
135
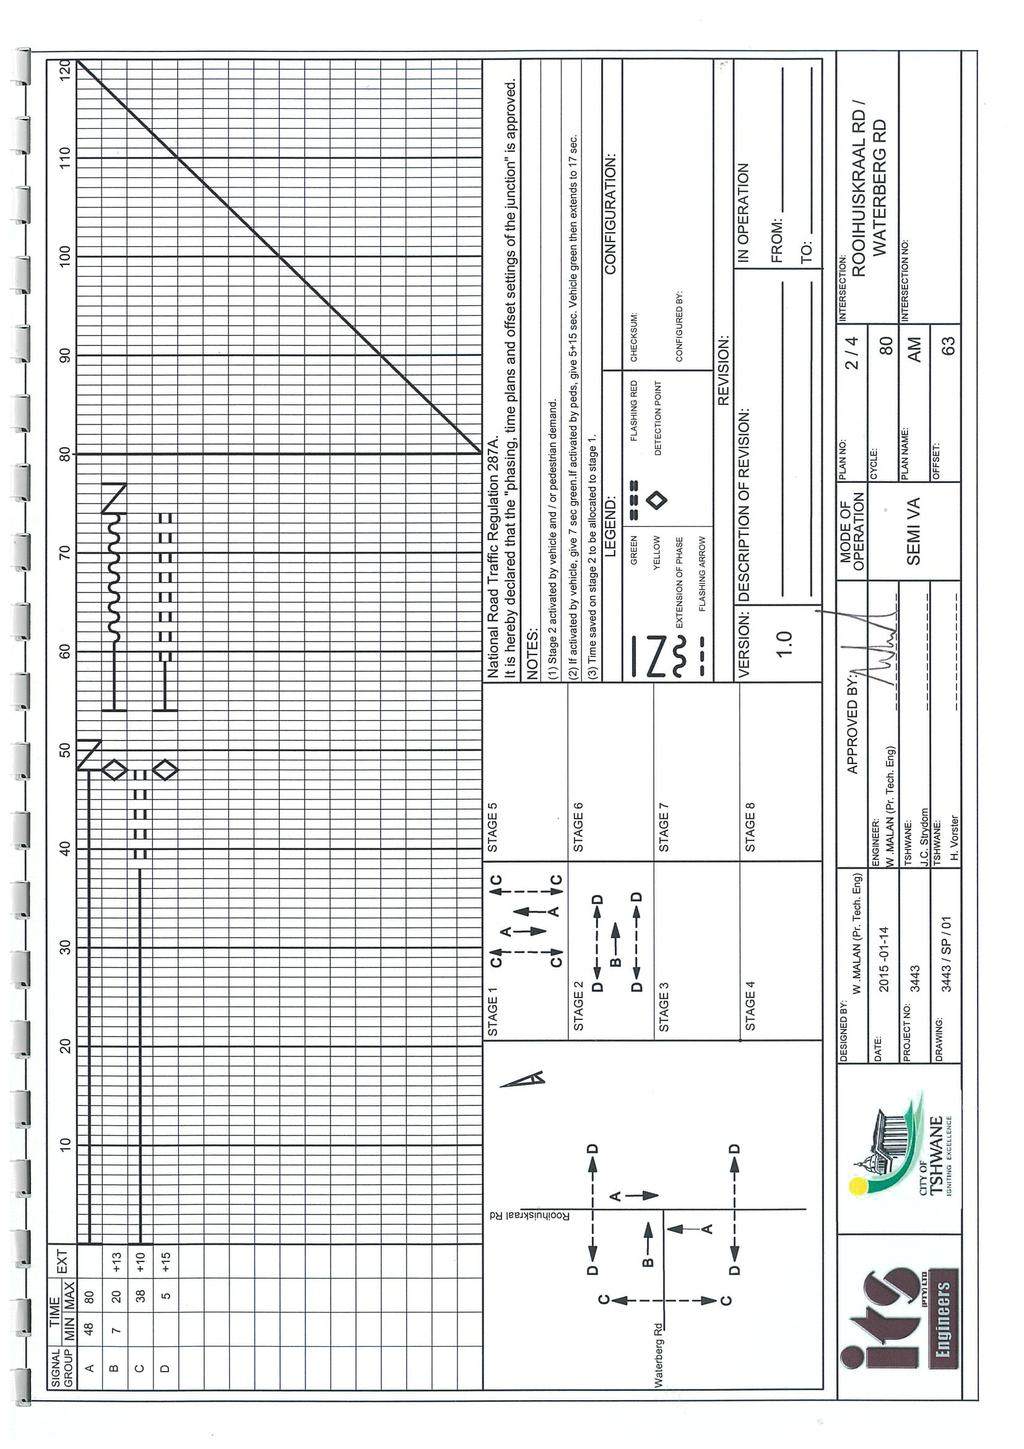
136
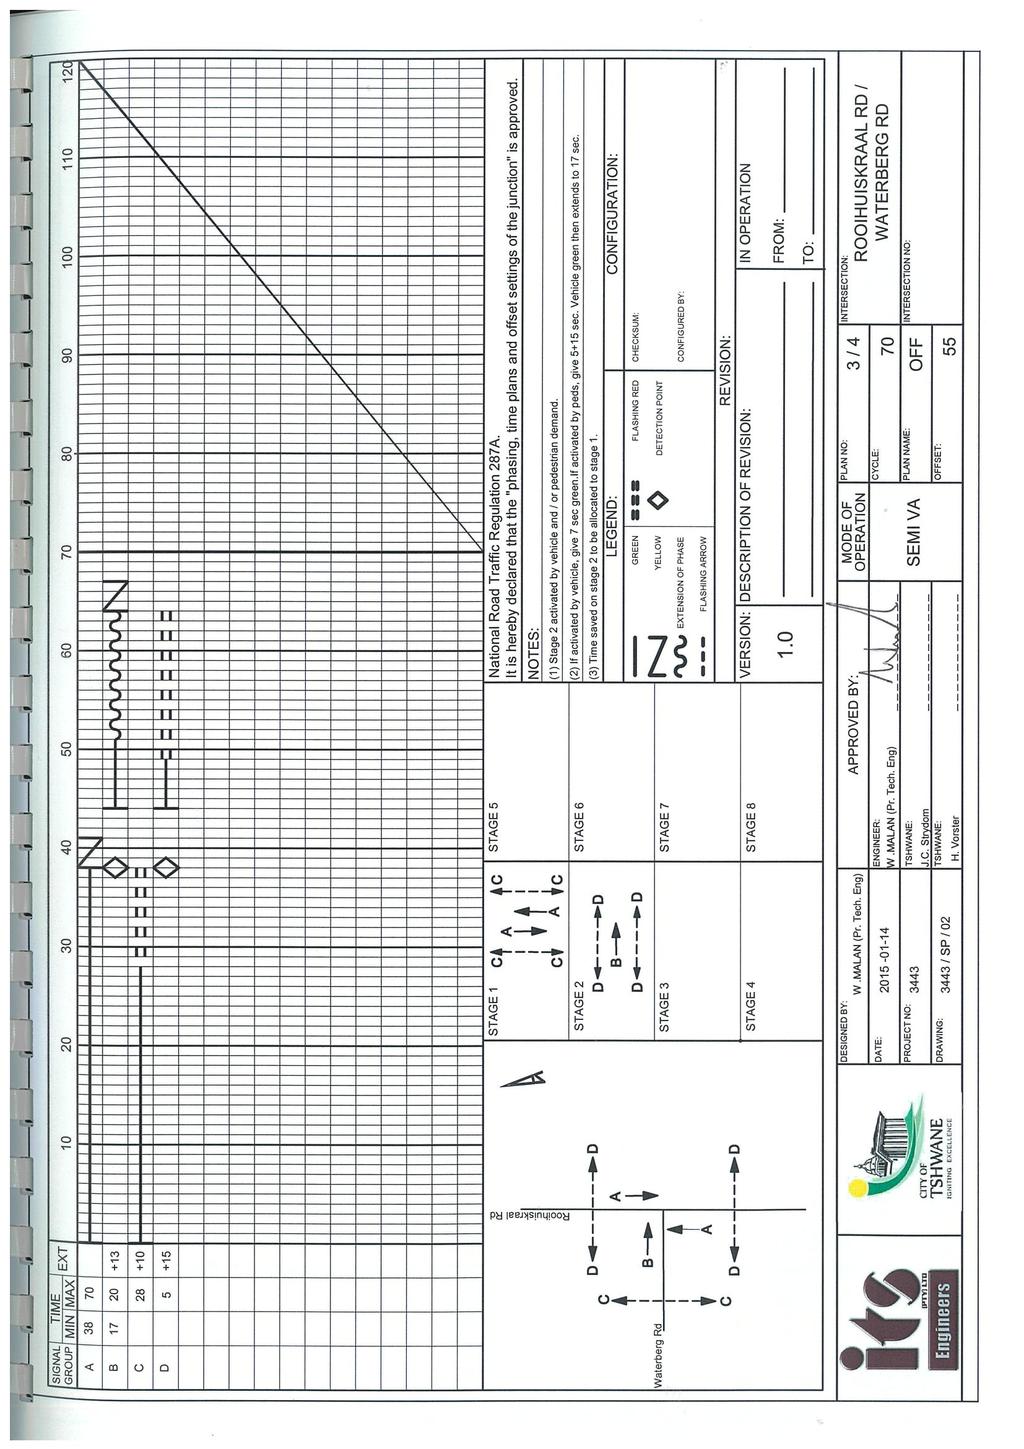
137
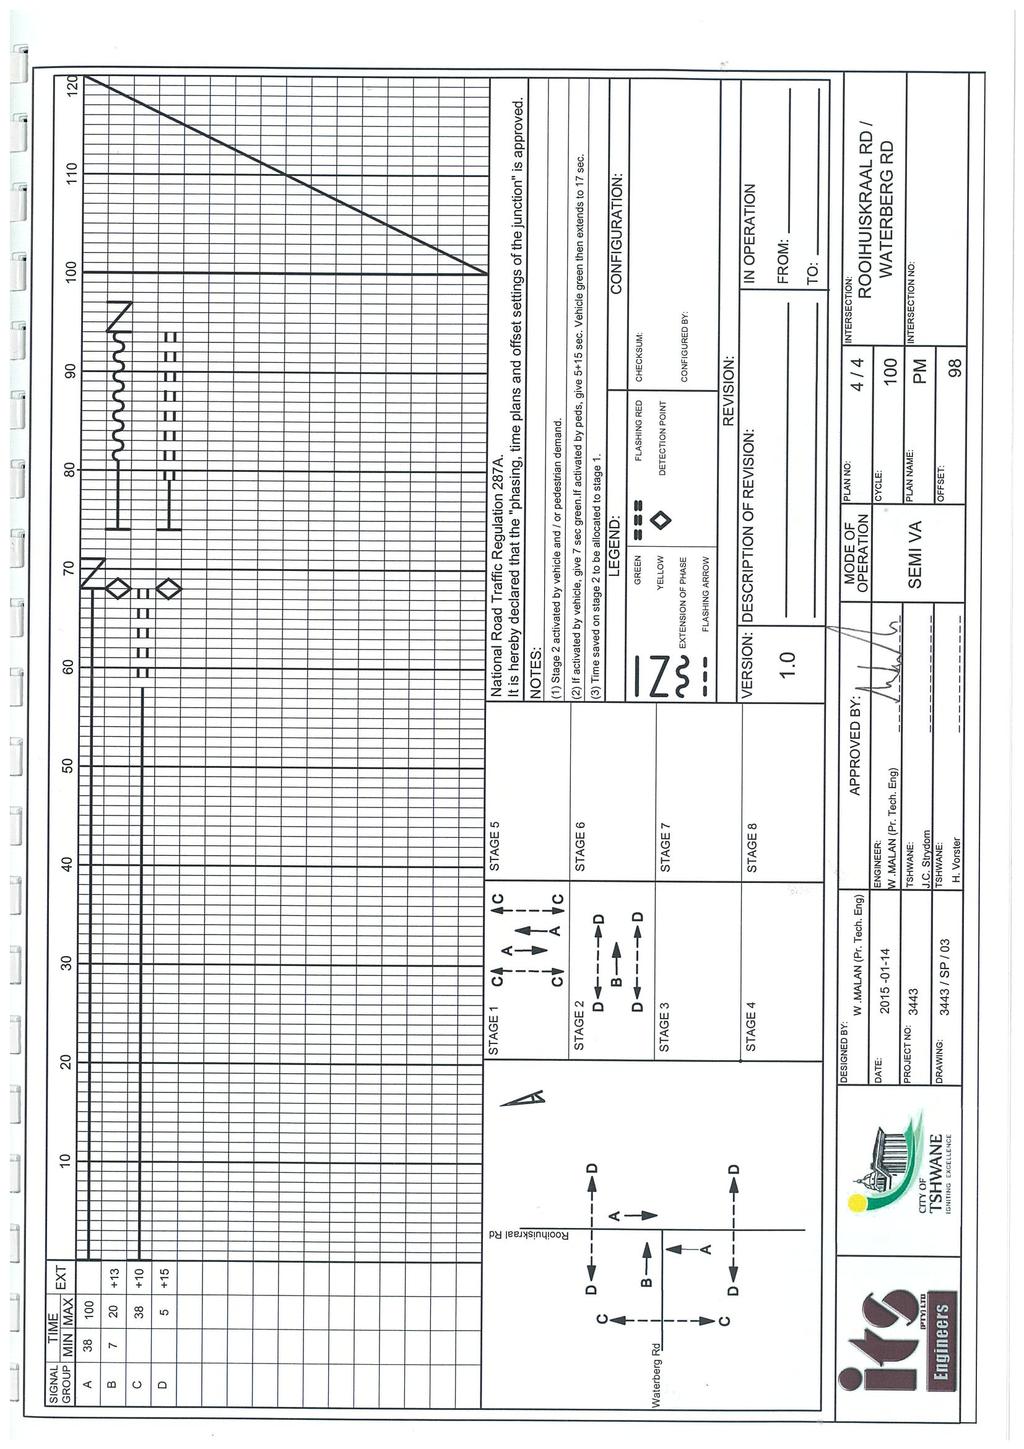
138
139
140
141
142
143
144
145
146
147
148
149 ANNEXURE F2 DETAILED PHASINGS AND TIMINGS OF THE TRAFFIC SIGNAL
150 PHASING SUMMARY Samrand Avenue / Rooihuiskraal Road (M37) Intersection 219 Weekday Morning Peak Hour Background Traffic Volumes Existing Traffic Signal Controlled Intersection Configuration Signals - Fixed Time Cycle Time = 75 seconds Site: 219 AM BG Cycle Time Option: User-specified Cycle Time Phase times specified by the user Sequence: Two-Phase Input Sequence: A, B, C, D Output Sequence: A, B, C, D Phase Timing Results Phase A B C D Green Time (sec) Yellow Time (sec) All-Red Time (sec) Phase Time (sec) Phase Split 27% 29% 25% 19% Phase A Phase B Phase C Rooihuiskraal Road (M37) (N) Rooihuiskraal Road (M37) (N) Rooihuiskraal Road (M37) (N) Samrand Avenue (W) Samrand Avenue (E) Samrand Avenue (W) Samrand Avenue (E) Samrand Avenue (W) Samrand Avenue (E) Rooihuiskraal Road (M37) (S) Rooihuiskraal Road (M37) (S) Rooihuiskraal Road (M37) (S) Phase D Rooihuiskraal Road (M37) (N) Samrand Avenue (W) Samrand Avenue (E) Rooihuiskraal Road (M37) (S) Normal Movement Slip-Lane Movement Stopped Movement Turn On Red Permitted/Opposed Opposed Slip-Lane Continuous Movement Undetected Movement Phase Transition Applied Processed: Friday, 1 February 219 8:32:44 AM Copyright 2-21 Akcelik & Associates Pty Ltd SIDRA INTERSECTION Project: W:\CC-Projects\C PROJECTS\C2562 (MG) KOSMOSDAL X 89\1. Client and Related Bodies\1.13 TIS, Traffic Statements\5 Calculations\TIA\2 Sidra\1 Samrand_Rooihuskraal M37\BG\Samrand_Rooihuskraal M37_BG.sip
151 PHASING SUMMARY Samrand Avenue / Rooihuiskraal Road (M37) Intersection 219 Weekday Afternoon Peak Hour Background Traffic Volumes Existing Traffic Signal Controlled Intersection Configuration Signals - Fixed Time Cycle Time = 86 seconds Site: 219 PM BG Cycle Time Option: User-specified Cycle Time Phase times specified by the user Sequence: Two-Phase Input Sequence: A, B, C, D Output Sequence: A, B, C, D Phase Timing Results Phase A B C D Green Time (sec) Yellow Time (sec) All-Red Time (sec) Phase Time (sec) Phase Split 22% 22% 22% 34% Phase A Phase B Phase C Rooihuiskraal Road (M37) (N) Rooihuiskraal Road (M37) (N) Rooihuiskraal Road (M37) (N) Samrand Avenue (W) Samrand Avenue (E) Samrand Avenue (W) Samrand Avenue (E) Samrand Avenue (W) Samrand Avenue (E) Rooihuiskraal Road (M37) (S) Rooihuiskraal Road (M37) (S) Rooihuiskraal Road (M37) (S) Phase D Rooihuiskraal Road (M37) (N) Samrand Avenue (W) Samrand Avenue (E) Rooihuiskraal Road (M37) (S) Normal Movement Slip-Lane Movement Stopped Movement Turn On Red Permitted/Opposed Opposed Slip-Lane Continuous Movement Undetected Movement Phase Transition Applied Processed: Monday, 11 February 219 7:48:41 AM Copyright 2-21 Akcelik & Associates Pty Ltd SIDRA INTERSECTION Project: W:\CC-Projects\C PROJECTS\C2562 (MG) KOSMOSDAL X 89\1. Client and Related Bodies\1.13 TIS, Traffic Statements\5 Calculations\TIA\2 Sidra\1 Samrand_Rooihuskraal M37\BG\Samrand_Rooihuskraal M37_BG.sip
152 PHASING SUMMARY Samrand Avenue / Rooihuiskraal Road (M37) Intersection 219 Weekday Morning Peak Hour Background Traffic Volumes Existing Traffic Signal Controlled Intersection Configuration Signals - Fixed Time Cycle Time = 75 seconds Site: 224 AM BG Cycle Time Option: User-specified Cycle Time Phase times specified by the user Sequence: Two-Phase Input Sequence: A, B, C, D Output Sequence: A, B, C, D Phase Timing Results Phase A B C D Green Time (sec) Yellow Time (sec) All-Red Time (sec) Phase Time (sec) Phase Split 27% 29% 25% 19% Phase A Phase B Phase C Rooihuiskraal Road (M37) (N) Rooihuiskraal Road (M37) (N) Rooihuiskraal Road (M37) (N) Samrand Avenue (W) Samrand Avenue (E) Samrand Avenue (W) Samrand Avenue (E) Samrand Avenue (W) Samrand Avenue (E) Rooihuiskraal Road (M37) (S) Rooihuiskraal Road (M37) (S) Rooihuiskraal Road (M37) (S) Phase D Rooihuiskraal Road (M37) (N) Samrand Avenue (W) Samrand Avenue (E) Rooihuiskraal Road (M37) (S) Normal Movement Slip-Lane Movement Stopped Movement Turn On Red Permitted/Opposed Opposed Slip-Lane Continuous Movement Undetected Movement Phase Transition Applied Processed: Friday, 1 February 219 8:34: AM Copyright 2-21 Akcelik & Associates Pty Ltd SIDRA INTERSECTION Project: W:\CC-Projects\C PROJECTS\C2562 (MG) KOSMOSDAL X 89\1. Client and Related Bodies\1.13 TIS, Traffic Statements\5 Calculations\TIA\2 Sidra\1 Samrand_Rooihuskraal M37\BG\Samrand_Rooihuskraal M37_BG.sip
153 PHASING SUMMARY Samrand Avenue / Rooihuiskraal Road (M37) Intersection 219 Weekday Afternoon Peak Hour Background Traffic Volumes Existing Traffic Signal Controlled Intersection Configuration Signals - Fixed Time Cycle Time = 86 seconds Site: 224 PM BG Cycle Time Option: User-specified Cycle Time Phase times specified by the user Sequence: Two-Phase Input Sequence: A, B, C, D Output Sequence: A, B, C, D Phase Timing Results Phase A B C D Green Time (sec) Yellow Time (sec) All-Red Time (sec) Phase Time (sec) Phase Split 22% 22% 22% 34% Phase A Phase B Phase C Rooihuiskraal Road (M37) (N) Rooihuiskraal Road (M37) (N) Rooihuiskraal Road (M37) (N) Samrand Avenue (W) Samrand Avenue (E) Samrand Avenue (W) Samrand Avenue (E) Samrand Avenue (W) Samrand Avenue (E) Rooihuiskraal Road (M37) (S) Rooihuiskraal Road (M37) (S) Rooihuiskraal Road (M37) (S) Phase D Rooihuiskraal Road (M37) (N) Samrand Avenue (W) Samrand Avenue (E) Rooihuiskraal Road (M37) (S) Normal Movement Slip-Lane Movement Stopped Movement Turn On Red Permitted/Opposed Opposed Slip-Lane Continuous Movement Undetected Movement Phase Transition Applied Processed: Monday, 11 February 219 7:41:26 AM Copyright 2-21 Akcelik & Associates Pty Ltd SIDRA INTERSECTION Project: W:\CC-Projects\C PROJECTS\C2562 (MG) KOSMOSDAL X 89\1. Client and Related Bodies\1.13 TIS, Traffic Statements\5 Calculations\TIA\2 Sidra\1 Samrand_Rooihuskraal M37\BG\Samrand_Rooihuskraal M37_BG.sip
154 PHASING SUMMARY Samrand Avenue / Rooihuiskraal Road (M37) Intersection 219 Weekday Morning Peak Hour Background and Development Traffic Volumes Existing Traffic Signal Controlled Intersection Configuration Signals - Fixed Time Cycle Time = 82 seconds Site: 219 AM BG+DEV Cycle Time Option: User-specified Cycle Time Phase times specified by the user Sequence: Two-Phase Input Sequence: A, B, C, D Output Sequence: A, B, C, D Phase Timing Results Phase A B C D Green Time (sec) Yellow Time (sec) All-Red Time (sec) Phase Time (sec) Phase Split 24% 27% 29% 2% Phase A Phase B Phase C Rooihuiskraal Road (M37) (N) Rooihuiskraal Road (M37) (N) Rooihuiskraal Road (M37) (N) Samrand Avenue (W) Samrand Avenue (E) Samrand Avenue (W) Samrand Avenue (E) Samrand Avenue (W) Samrand Avenue (E) Rooihuiskraal Road (M37) (S) Rooihuiskraal Road (M37) (S) Rooihuiskraal Road (M37) (S) Phase D Rooihuiskraal Road (M37) (N) Samrand Avenue (W) Samrand Avenue (E) Rooihuiskraal Road (M37) (S) Normal Movement Slip-Lane Movement Stopped Movement Turn On Red Permitted/Opposed Opposed Slip-Lane Continuous Movement Undetected Movement Phase Transition Applied Processed: Monday, 11 February 219 9:3:47 AM Copyright 2-21 Akcelik & Associates Pty Ltd SIDRA INTERSECTION Project: W:\CC-Projects\C PROJECTS\C2562 (MG) KOSMOSDAL X 89\1. Client and Related Bodies\1.13 TIS, Traffic Statements\5 Calculations\TIA\2 Sidra\1 Samrand_Rooihuskraal M37\BG+DEV\Samrand_Rooihuskraal M37_DEV_Rev1.sip
155 PHASING SUMMARY Samrand Avenue / Rooihuiskraal Road (M37) Intersection 219 Weekday Morning Peak Hour Background and Development Traffic Volumes Existing Traffic Signal Controlled Intersection Configuration Signals - Fixed Time Cycle Time = 11 seconds Site: 219 PM BG+DEV Cycle Time Option: User-specified Cycle Time Phase times specified by the user Sequence: Two-Phase Input Sequence: A, B, C, D Output Sequence: A, B, C, D Phase Timing Results Phase A B C D Green Time (sec) Yellow Time (sec) All-Red Time (sec) Phase Time (sec) Phase Split 17% 15% 29% 39% Phase A Phase B Phase C Rooihuiskraal Road (M37) (N) Rooihuiskraal Road (M37) (N) Rooihuiskraal Road (M37) (N) Samrand Avenue (W) Samrand Avenue (E) Samrand Avenue (W) Samrand Avenue (E) Samrand Avenue (W) Samrand Avenue (E) Rooihuiskraal Road (M37) (S) Rooihuiskraal Road (M37) (S) Rooihuiskraal Road (M37) (S) Phase D Rooihuiskraal Road (M37) (N) Samrand Avenue (W) Samrand Avenue (E) Rooihuiskraal Road (M37) (S) Normal Movement Slip-Lane Movement Stopped Movement Turn On Red Permitted/Opposed Opposed Slip-Lane Continuous Movement Undetected Movement Phase Transition Applied Processed: Monday, 11 February 219 9:31:1 AM Copyright 2-21 Akcelik & Associates Pty Ltd SIDRA INTERSECTION Project: W:\CC-Projects\C PROJECTS\C2562 (MG) KOSMOSDAL X 89\1. Client and Related Bodies\1.13 TIS, Traffic Statements\5 Calculations\TIA\2 Sidra\1 Samrand_Rooihuskraal M37\BG+DEV\Samrand_Rooihuskraal M37_DEV_Rev1.sip
156 PHASING SUMMARY Samrand Avenue / Rooihuiskraal Road (M37) Intersection 219 Weekday Morning Peak Hour Background and Development Traffic Volumes Existing Traffic Signal Controlled Intersection Configuration Signals - Fixed Time Cycle Time = 82 seconds Site: 224 AM BG+DEV Cycle Time Option: User-specified Cycle Time Phase times specified by the user Sequence: Two-Phase Input Sequence: A, B, C, D Output Sequence: A, B, C, D Phase Timing Results Phase A B C D Green Time (sec) Yellow Time (sec) All-Red Time (sec) Phase Time (sec) Phase Split 24% 27% 29% 2% Phase A Phase B Phase C Rooihuiskraal Road (M37) (N) Rooihuiskraal Road (M37) (N) Rooihuiskraal Road (M37) (N) Samrand Avenue (W) Samrand Avenue (E) Samrand Avenue (W) Samrand Avenue (E) Samrand Avenue (W) Samrand Avenue (E) Rooihuiskraal Road (M37) (S) Rooihuiskraal Road (M37) (S) Rooihuiskraal Road (M37) (S) Phase D Rooihuiskraal Road (M37) (N) Samrand Avenue (W) Samrand Avenue (E) Rooihuiskraal Road (M37) (S) Normal Movement Slip-Lane Movement Stopped Movement Turn On Red Permitted/Opposed Opposed Slip-Lane Continuous Movement Undetected Movement Phase Transition Applied Processed: Monday, 11 February 219 9:31:39 AM Copyright 2-21 Akcelik & Associates Pty Ltd SIDRA INTERSECTION Project: W:\CC-Projects\C PROJECTS\C2562 (MG) KOSMOSDAL X 89\1. Client and Related Bodies\1.13 TIS, Traffic Statements\5 Calculations\TIA\2 Sidra\1 Samrand_Rooihuskraal M37\BG+DEV\Samrand_Rooihuskraal M37_DEV_Rev1.sip
157 PHASING SUMMARY Samrand Avenue / Rooihuiskraal Road (M37) Intersection 219 Weekday Morning Peak Hour Background and Development Traffic Volumes Existing Traffic Signal Controlled Intersection Configuration Signals - Fixed Time Cycle Time = 11 seconds Site: 224 PM BG+DEV Cycle Time Option: User-specified Cycle Time Phase times specified by the user Sequence: Two-Phase Input Sequence: A, B, C, D Output Sequence: A, B, C, D Phase Timing Results Phase A B C D Green Time (sec) Yellow Time (sec) All-Red Time (sec) Phase Time (sec) Phase Split 17% 15% 29% 39% Phase A Phase B Phase C Rooihuiskraal Road (M37) (N) Rooihuiskraal Road (M37) (N) Rooihuiskraal Road (M37) (N) Samrand Avenue (W) Samrand Avenue (E) Samrand Avenue (W) Samrand Avenue (E) Samrand Avenue (W) Samrand Avenue (E) Rooihuiskraal Road (M37) (S) Rooihuiskraal Road (M37) (S) Rooihuiskraal Road (M37) (S) Phase D Rooihuiskraal Road (M37) (N) Samrand Avenue (W) Samrand Avenue (E) Rooihuiskraal Road (M37) (S) Normal Movement Slip-Lane Movement Stopped Movement Turn On Red Permitted/Opposed Opposed Slip-Lane Continuous Movement Undetected Movement Phase Transition Applied Processed: Monday, 11 February 219 9:31:5 AM Copyright 2-21 Akcelik & Associates Pty Ltd SIDRA INTERSECTION Project: W:\CC-Projects\C PROJECTS\C2562 (MG) KOSMOSDAL X 89\1. Client and Related Bodies\1.13 TIS, Traffic Statements\5 Calculations\TIA\2 Sidra\1 Samrand_Rooihuskraal M37\BG+DEV\Samrand_Rooihuskraal M37_DEV_Rev1.sip
158 PHASING SUMMARY Waterberg Road / Rooihuiskraal Road (M37) Intersection 219 Weekday Morning Peak Hour Background Traffic Volumes Existing Traffic Signal Controlled Intersection Configuration Signals - Fixed Time Cycle Time = 8 seconds Site: 219 AM BG Cycle Time Option: User-specified Cycle Time Phase times specified by the user Sequence: Two-Phase Input Sequence: A, B Output Sequence: A, B Phase Timing Results Phase A B Green Time (sec) 48 2 Yellow Time (sec) 3 3 All-Red Time (sec) 3 3 Phase Time (sec) Phase Split 68% 33% Phase A Phase B Rooihuiskraal Road (M37) (N) Rooihuiskraal Road (M37) (N) Waterberg Road (W) Waterberg Road (W) Rooihuiskraal Road (M37) (S) Rooihuiskraal Road (M37) (S) Normal Movement Slip-Lane Movement Stopped Movement Turn On Red Permitted/Opposed Opposed Slip-Lane Continuous Movement Undetected Movement Phase Transition Applied Processed: Wednesday, 23 January 219 8:28:53 AM Copyright 2-21 Akcelik & Associates Pty Ltd SIDRA INTERSECTION Project: W:\CC-Projects\C PROJECTS\C2562 (MG) KOSMOSDAL X 89\1. Client and Related Bodies\1.13 TIS, Traffic Statements\5 Calculations\TIA\2 Sidra\2 Waterburg_Rooihuskraal M37\BG\Waterburg Road_Rooihuskraal M37_BG_REV1.sip
159 PHASING SUMMARY Waterberg Road / Rooihuiskraal Road (M37) Intersection 219 Weekday Afternoon Peak Hour Background Traffic Volumes Existing Traffic Signal Controlled Intersection Configuration Signals - Fixed Time Cycle Time = 1 seconds Site: 219 PM BG Cycle Time Option: User-specified Cycle Time Phase times specified by the user Sequence: Two-Phase Input Sequence: A, B Output Sequence: A, B Phase Timing Results Phase A B Green Time (sec) 68 2 Yellow Time (sec) 3 3 All-Red Time (sec) 3 3 Phase Time (sec) Phase Split 74% 26% Phase A Phase B Rooihuiskraal Road (M37) (N) Rooihuiskraal Road (M37) (N) Waterberg Road (W) Waterberg Road (W) Rooihuiskraal Road (M37) (S) Rooihuiskraal Road (M37) (S) Normal Movement Slip-Lane Movement Stopped Movement Turn On Red Permitted/Opposed Opposed Slip-Lane Continuous Movement Undetected Movement Phase Transition Applied Processed: Wednesday, 23 January 219 8:29:17 AM Copyright 2-21 Akcelik & Associates Pty Ltd SIDRA INTERSECTION Project: W:\CC-Projects\C PROJECTS\C2562 (MG) KOSMOSDAL X 89\1. Client and Related Bodies\1.13 TIS, Traffic Statements\5 Calculations\TIA\2 Sidra\2 Waterburg_Rooihuskraal M37\BG\Waterburg Road_Rooihuskraal M37_BG_REV1.sip
160 PHASING SUMMARY Waterberg Road / Rooihuiskraal Road (M37) Intersection 224 Weekday Morning Peak Hour Background Traffic Volumes Existing Traffic Signal Controlled Intersection Configuration Signals - Fixed Time Cycle Time = 8 seconds Site: 224 AM BG Cycle Time Option: User-specified Cycle Time Phase times specified by the user Sequence: Two-Phase Input Sequence: A, B Output Sequence: A, B Phase Timing Results Phase A B Green Time (sec) 48 2 Yellow Time (sec) 3 3 All-Red Time (sec) 3 3 Phase Time (sec) Phase Split 68% 33% Phase A Phase B Rooihuiskraal Road (M37) (N) Rooihuiskraal Road (M37) (N) Waterberg Road (W) Waterberg Road (W) Rooihuiskraal Road (M37) (S) Rooihuiskraal Road (M37) (S) Normal Movement Slip-Lane Movement Stopped Movement Turn On Red Permitted/Opposed Opposed Slip-Lane Continuous Movement Undetected Movement Phase Transition Applied Processed: Wednesday, 23 January 219 8:31:51 AM Copyright 2-21 Akcelik & Associates Pty Ltd SIDRA INTERSECTION Project: W:\CC-Projects\C PROJECTS\C2562 (MG) KOSMOSDAL X 89\1. Client and Related Bodies\1.13 TIS, Traffic Statements\5 Calculations\TIA\2 Sidra\2 Waterburg_Rooihuskraal M37\BG\Waterburg Road_Rooihuskraal M37_BG_REV1.sip
161 PHASING SUMMARY Waterberg Road / Rooihuiskraal Road (M37) Intersection 224 Weekday Afternoon Peak Hour Background Traffic Volumes Existing Traffic Signal Controlled Intersection Configuration Signals - Fixed Time Cycle Time = 1 seconds Site: 224 PM BG Cycle Time Option: User-specified Cycle Time Phase times specified by the user Sequence: Two-Phase Input Sequence: A, B Output Sequence: A, B Phase Timing Results Phase A B Green Time (sec) 68 2 Yellow Time (sec) 3 3 All-Red Time (sec) 3 3 Phase Time (sec) Phase Split 74% 26% Phase A Phase B Rooihuiskraal Road (M37) (N) Rooihuiskraal Road (M37) (N) Waterberg Road Waterberg Road Rooihuiskraal Road (M37) (S) Rooihuiskraal Road (M37) (S) Normal Movement Slip-Lane Movement Stopped Movement Turn On Red Permitted/Opposed Opposed Slip-Lane Continuous Movement Undetected Movement Phase Transition Applied Processed: Wednesday, 23 January 219 8:33:2 AM Copyright 2-21 Akcelik & Associates Pty Ltd SIDRA INTERSECTION Project: W:\CC-Projects\C PROJECTS\C2562 (MG) KOSMOSDAL X 89\1. Client and Related Bodies\1.13 TIS, Traffic Statements\5 Calculations\TIA\2 Sidra\2 Waterburg_Rooihuskraal M37\BG\Waterburg Road_Rooihuskraal M37_BG_REV1.sip
162 PHASING SUMMARY Waterberg Road / Rooihuiskraal Road (M37) Intersection 219 Weekday Morning Peak Hour Background and Development Traffic Volumes Existing Traffic Signal Controlled Intersection Configuration Signals - Fixed Time Cycle Time = 8 seconds Site: 219 AM BG+DEV Cycle Time Option: User-specified Cycle Time Phase times specified by the user Sequence: Two-Phase Input Sequence: A, B Output Sequence: A, B Phase Timing Results Phase A B Green Time (sec) 48 2 Yellow Time (sec) 3 3 All-Red Time (sec) 3 3 Phase Time (sec) Phase Split 68% 33% Phase A Phase B Rooihuiskraal Road (M37) (N) Rooihuiskraal Road (M37) (N) Waterberg Road (W) Waterberg Road (W) Rooihuiskraal Road (M37) (S) Rooihuiskraal Road (M37) (S) Normal Movement Slip-Lane Movement Stopped Movement Turn On Red Permitted/Opposed Opposed Slip-Lane Continuous Movement Undetected Movement Phase Transition Applied Processed: Wednesday, 23 January 219 8:51:55 AM Copyright 2-21 Akcelik & Associates Pty Ltd SIDRA INTERSECTION Project: W:\CC-Projects\C PROJECTS\C2562 (MG) KOSMOSDAL X 89\1. Client and Related Bodies\1.13 TIS, Traffic Statements\5 Calculations\TIA\2 Sidra\2 Waterburg_Rooihuskraal M37\BG+DEV\Waterburg Road_Rooihuskraal M37_BG+DEV.sip
163 MOVEMENT SUMMARY Waterberg Road / Rooihuiskraal Road (M37) Intersection 219 Weekday Afternoon Peak Hour Background and Development Traffic Volumes Existing Traffic Signal Controlled Intersection Configuration Signals - Fixed Time Cycle Time = 1 seconds Site: 219 PM BG+DEV Movement Performance - Vehicles Mov ID Turn Demand Deg. Average Level of 95% Back of Queue Prop. Effective Average Flow HV Satn Delay Service Vehicles Distance Queued Stop Rate Speed veh/h % v/c sec veh m per veh km/h South: Rooihuiskraal Road (M37) (S) 1 L LOS C T LOS A Approach LOS B North: Rooihuiskraal Road (M37) (N) 8 T LOS A R LOS D Approach LOS A West: Waterberg Road (W) 1 L LOS D R LOS D Approach LOS D All Vehicles LOS B Level of Service (Aver. Int. Delay): LOS B. Based on average delay for all vehicle movements. LOS Method: Delay (HCM). Level of Service (Worst Movement): LOS D. LOS Method for individual vehicle movements: Delay (HCM). Approach LOS values are based on average delay for all vehicle movements. Processed: Wednesday, 23 January 219 8:57:1 AM Copyright 2-21 Akcelik & Associates Pty Ltd SIDRA INTERSECTION Project: W:\CC-Projects\C PROJECTS\C2562 (MG) KOSMOSDAL X 89\1. Client and Related Bodies\1.13 TIS, Traffic Statements\5 Calculations\TIA\2 Sidra\2 Waterburg_Rooihuskraal M37\BG+DEV\Waterburg Road_Rooihuskraal M37_BG+DEV.sip
164 PHASING SUMMARY Waterberg Road / Rooihuiskraal Road (M37) Intersection 224 Weekday Morning Peak Hour Background and Development Traffic Volumes Existing Traffic Signal Controlled Intersection Configuration Signals - Fixed Time Cycle Time = 8 seconds Site: 224 AM BG+DEV Cycle Time Option: User-specified Cycle Time Phase times specified by the user Sequence: Two-Phase Input Sequence: A, B Output Sequence: A, B Phase Timing Results Phase A B Green Time (sec) 48 2 Yellow Time (sec) 3 3 All-Red Time (sec) 3 3 Phase Time (sec) Phase Split 68% 33% Phase A Phase B Rooihuiskraal Road (M37) (N) Rooihuiskraal Road (M37) (N) Waterberg Road (W) Waterberg Road (W) Rooihuiskraal Road (M37) (S) Rooihuiskraal Road (M37) (S) Normal Movement Slip-Lane Movement Stopped Movement Turn On Red Permitted/Opposed Opposed Slip-Lane Continuous Movement Undetected Movement Phase Transition Applied Processed: Wednesday, 23 January 219 9:5:3 AM Copyright 2-21 Akcelik & Associates Pty Ltd SIDRA INTERSECTION Project: W:\CC-Projects\C PROJECTS\C2562 (MG) KOSMOSDAL X 89\1. Client and Related Bodies\1.13 TIS, Traffic Statements\5 Calculations\TIA\2 Sidra\2 Waterburg_Rooihuskraal M37\BG+DEV\Waterburg Road_Rooihuskraal M37_BG+DEV.sip
165 PHASING SUMMARY Waterberg Road / Rooihuiskraal Road (M37) Intersection 224 Weekday Afternoon Peak Hour Background and Development Traffic Volumes Existing Traffic Signal Controlled Intersection Configuration Signals - Fixed Time Cycle Time = 1 seconds Site: 224 PM BG+DEV Cycle Time Option: User-specified Cycle Time Phase times specified by the user Sequence: Two-Phase Input Sequence: A, B Output Sequence: A, B Phase Timing Results Phase A B Green Time (sec) 68 2 Yellow Time (sec) 3 3 All-Red Time (sec) 3 3 Phase Time (sec) Phase Split 74% 26% Phase A Phase B Rooihuiskraal Road (M37) (N) Rooihuiskraal Road (M37) (N) Waterberg Road (W) Waterberg Road (W) Rooihuiskraal Road (M37) (S) Rooihuiskraal Road (M37) (S) Normal Movement Slip-Lane Movement Stopped Movement Turn On Red Permitted/Opposed Opposed Slip-Lane Continuous Movement Undetected Movement Phase Transition Applied Processed: Wednesday, 23 January 219 9:6:37 AM Copyright 2-21 Akcelik & Associates Pty Ltd SIDRA INTERSECTION Project: W:\CC-Projects\C PROJECTS\C2562 (MG) KOSMOSDAL X 89\1. Client and Related Bodies\1.13 TIS, Traffic Statements\5 Calculations\TIA\2 Sidra\2 Waterburg_Rooihuskraal M37\BG+DEV\Waterburg Road_Rooihuskraal M37_BG+DEV.sip
166 PHASING SUMMARY Samrand Avenue / Rietspruit Road Junction 218 Weekday Morning Peak Hour Background Traffic Volumes Existing Signalised Four Legged Junction Signals - Fixed Time Cycle Time = 9 seconds Site: 219 AM BG Cycle Time Option: User-specified Cycle Time Phase times specified by the user Sequence: Two-Phase Input Sequence: A, B, C, D Output Sequence: A, B, C, D Phase Timing Results Phase A B C D Green Time (sec) Yellow Time (sec) All-Red Time (sec) Phase Time (sec) Phase Split 16% 27% 16% 42% Phase A Phase B Phase C Rietspruit Road (N) Rietspruit Road (N) Rietspruit Road (N) Samrand Avenue (W) Samrand Avenue (E) Samrand Avenue (W) Samrand Avenue (E) Samrand Avenue (W) Samrand Avenue (E) Rietspruit Road (S) Rietspruit Road (S) Rietspruit Road (S) Phase D Rietspruit Road (N) Samrand Avenue (W) Samrand Avenue (E) Rietspruit Road (S) Normal Movement Slip-Lane Movement Stopped Movement Turn On Red Permitted/Opposed Opposed Slip-Lane Continuous Movement Undetected Movement Phase Transition Applied Processed: Wednesday, 2 January 219 2:3:26 PM Copyright 2-21 Akcelik & Associates Pty Ltd SIDRA INTERSECTION Project: W:\CC-Projects\C PROJECTS\C2562 (MG) KOSMOSDAL X 89\1. Client and Related Bodies\1.13 TIS, Traffic Statements\5 Calculations\TIA\2 Sidra\3 Reitspurit_Samrand\BG\Samrand-Rietspruit_BG.sip
167 PHASING SUMMARY Samrand Avenue / Rietspruit Road Junction 218 Weekday Afernoon Peak Hour Background Traffic Volumes Existing Signalised Four Legged Junction Signals - Fixed Time Cycle Time = 9 seconds Site: 219 PM BG Cycle Time Option: User-specified Cycle Time Phase times specified by the user Sequence: Two-Phase Input Sequence: A, B, C, D Output Sequence: A, B, C, D Phase Timing Results Phase A B C D Green Time (sec) Yellow Time (sec) All-Red Time (sec) Phase Time (sec) Phase Split 19% 33% 19% 29% Phase A Phase B Phase C Rietspruit Road (N) Rietspruit Road (N) Rietspruit Road (N) Samrand Avenue (W) Samrand Avenue (E) Samrand Avenue (W) Samrand Avenue (E) Samrand Avenue (W) Samrand Avenue (E) Rietspruit Road (S) Rietspruit Road (S) Rietspruit Road (S) Phase D Rietspruit Road (N) Samrand Avenue (W) Samrand Avenue (E) Rietspruit Road (S) Normal Movement Slip-Lane Movement Stopped Movement Turn On Red Permitted/Opposed Opposed Slip-Lane Continuous Movement Undetected Movement Phase Transition Applied Processed: Wednesday, 2 January 219 3:13:8 PM Copyright 2-21 Akcelik & Associates Pty Ltd SIDRA INTERSECTION Project: W:\CC-Projects\C PROJECTS\C2562 (MG) KOSMOSDAL X 89\1. Client and Related Bodies\1.13 TIS, Traffic Statements\5 Calculations\TIA\2 Sidra\3 Reitspurit_Samrand\BG\Samrand-Rietspruit_BG.sip
168 PHASING SUMMARY Samrand Avenue / Rietspruit Road Junction 224 Weekday Morning Peak Hour Background Traffic Volumes Existing Signalised Four Legged Junction Signals - Fixed Time Cycle Time = 9 seconds Site: 224 AM BG Cycle Time Option: User-specified Cycle Time Phase times specified by the user Sequence: Two-Phase Input Sequence: A, B, C, D Output Sequence: A, B, C, D Phase Timing Results Phase A B C D Green Time (sec) Yellow Time (sec) All-Red Time (sec) Phase Time (sec) Phase Split 16% 27% 16% 42% Phase A Phase B Phase C Rietspruit Road (N) Rietspruit Road (N) Rietspruit Road (N) Samrand Avenue (W) Samrand Avenue (E) Samrand Avenue (W) Samrand Avenue (E) Samrand Avenue (W) Samrand Avenue (E) Rietspruit Road (S) Rietspruit Road (S) Rietspruit Road (S) Phase D Rietspruit Road (N) Samrand Avenue (W) Samrand Avenue (E) Rietspruit Road (S) Normal Movement Slip-Lane Movement Stopped Movement Turn On Red Permitted/Opposed Opposed Slip-Lane Continuous Movement Undetected Movement Phase Transition Applied Processed: Wednesday, 2 January 219 3:18:49 PM Copyright 2-21 Akcelik & Associates Pty Ltd SIDRA INTERSECTION Project: W:\CC-Projects\C PROJECTS\C2562 (MG) KOSMOSDAL X 89\1. Client and Related Bodies\1.13 TIS, Traffic Statements\5 Calculations\TIA\2 Sidra\3 Reitspurit_Samrand\BG\Samrand-Rietspruit_BG.sip
169 PHASING SUMMARY Samrand Avenue / Rietspruit Road Junction 224 Weekday Afernoon Peak Hour Background Traffic Volumes Existing Signalised Four Legged Junction Signals - Fixed Time Cycle Time = 9 seconds Site: 224 PM BG Cycle Time Option: User-specified Cycle Time Phase times specified by the user Sequence: Two-Phase Input Sequence: A, B, C, D Output Sequence: A, B, C, D Phase Timing Results Phase A B C D Green Time (sec) Yellow Time (sec) All-Red Time (sec) Phase Time (sec) Phase Split 19% 33% 19% 29% Phase A Phase B Phase C Rietspruit Road (N) Rietspruit Road (N) Rietspruit Road (N) Samrand Avenue (W) Samrand Avenue (E) Samrand Avenue (W) Samrand Avenue (E) Samrand Avenue (W) Samrand Avenue (E) Rietspruit Road (S) Rietspruit Road (S) Rietspruit Road (S) Phase D Rietspruit Road (N) Samrand Avenue (W) Samrand Avenue (E) Rietspruit Road (S) Normal Movement Slip-Lane Movement Stopped Movement Turn On Red Permitted/Opposed Opposed Slip-Lane Continuous Movement Undetected Movement Phase Transition Applied Processed: Wednesday, 2 January 219 3:44:41 PM Copyright 2-21 Akcelik & Associates Pty Ltd SIDRA INTERSECTION Project: W:\CC-Projects\C PROJECTS\C2562 (MG) KOSMOSDAL X 89\1. Client and Related Bodies\1.13 TIS, Traffic Statements\5 Calculations\TIA\2 Sidra\3 Reitspurit_Samrand\BG\Samrand-Rietspruit_BG.sip
170 PHASING SUMMARY Samrand Avenue / Rietspruit Road Junction 218 Weekday Morning Peak Hour Background and Development Traffic Volumes Existing Signalised Four Legged Junction Signals - Fixed Time Cycle Time = 9 seconds Site: 219 AM BG+DEV Cycle Time Option: User-specified Cycle Time Phase times specified by the user Sequence: Two-Phase Input Sequence: A, B, C, D Output Sequence: A, B, C, D Phase Timing Results Phase A B C D Green Time (sec) Yellow Time (sec) All-Red Time (sec) Phase Time (sec) Phase Split 16% 27% 16% 42% Phase A Phase B Phase C Rietspruit Road (N) Rietspruit Road (N) Rietspruit Road (N) Samrand Avenue (W) Samrand Avenue (E) Samrand Avenue (W) Samrand Avenue (E) Samrand Avenue (W) Samrand Avenue (E) Rietspruit Road (S) Rietspruit Road (S) Rietspruit Road (S) Phase D Rietspruit Road (N) Samrand Avenue (W) Samrand Avenue (E) Rietspruit Road (S) Normal Movement Slip-Lane Movement Stopped Movement Turn On Red Permitted/Opposed Opposed Slip-Lane Continuous Movement Undetected Movement Phase Transition Applied Processed: Friday, 1 February :32:55 AM Copyright 2-21 Akcelik & Associates Pty Ltd SIDRA INTERSECTION Project: W:\CC-Projects\C PROJECTS\C2562 (MG) KOSMOSDAL X 89\1. Client and Related Bodies\1.13 TIS, Traffic Statements\5 Calculations\TIA\2 Sidra\3 Reitspurit_Samrand\BG+DEV\Samrand-Rietspruit_BG+DEV.sip
171 PHASING SUMMARY Samrand Avenue / Rietspruit Road Junction 218 Weekday Afernoon Peak Hour Background and Development Traffic Volumes Existing Signalised Four Legged Junction Signals - Fixed Time Cycle Time = 9 seconds Site: 219 PM BG+DEV Cycle Time Option: User-specified Cycle Time Phase times specified by the user Sequence: Two-Phase Input Sequence: A, B, C, D Output Sequence: A, B, C, D Phase Timing Results Phase A B C D Green Time (sec) Yellow Time (sec) All-Red Time (sec) Phase Time (sec) Phase Split 19% 33% 19% 29% Phase A Phase B Phase C Rietspruit Road (N) Rietspruit Road (N) Rietspruit Road (N) Samrand Avenue (W) Samrand Avenue (E) Samrand Avenue (W) Samrand Avenue (E) Samrand Avenue (W) Samrand Avenue (E) Rietspruit Road (S) Rietspruit Road (S) Rietspruit Road (S) Phase D Rietspruit Road (N) Samrand Avenue (W) Samrand Avenue (E) Rietspruit Road (S) Normal Movement Slip-Lane Movement Stopped Movement Turn On Red Permitted/Opposed Opposed Slip-Lane Continuous Movement Undetected Movement Phase Transition Applied Processed: Friday, 1 February 219 1:39:1 PM Copyright 2-21 Akcelik & Associates Pty Ltd SIDRA INTERSECTION Project: W:\CC-Projects\C PROJECTS\C2562 (MG) KOSMOSDAL X 89\1. Client and Related Bodies\1.13 TIS, Traffic Statements\5 Calculations\TIA\2 Sidra\3 Reitspurit_Samrand\BG+DEV\Samrand-Rietspruit_BG+DEV.sip
172 PHASING SUMMARY Samrand Avenue / Rietspruit Road Junction 224 Weekday Morning Peak Hour Background and Development Traffic Volumes Existing Signalised Four Legged Junction Signals - Fixed Time Cycle Time = 9 seconds Site: 224 AM BG+DEV Cycle Time Option: User-specified Cycle Time Phase times specified by the user Sequence: Two-Phase Input Sequence: A, B, C, D Output Sequence: A, B, C, D Phase Timing Results Phase A B C D Green Time (sec) Yellow Time (sec) All-Red Time (sec) Phase Time (sec) Phase Split 16% 27% 16% 42% Phase A Phase B Phase C Rietspruit Road (N) Rietspruit Road (N) Rietspruit Road (N) Samrand Avenue (W) Samrand Avenue (E) Samrand Avenue (W) Samrand Avenue (E) Samrand Avenue (W) Samrand Avenue (E) Rietspruit Road (S) Rietspruit Road (S) Rietspruit Road (S) Phase D Rietspruit Road (N) Samrand Avenue (W) Samrand Avenue (E) Rietspruit Road (S) Normal Movement Slip-Lane Movement Stopped Movement Turn On Red Permitted/Opposed Opposed Slip-Lane Continuous Movement Undetected Movement Phase Transition Applied Processed: Friday, 1 February 219 1:4:3 PM Copyright 2-21 Akcelik & Associates Pty Ltd SIDRA INTERSECTION Project: W:\CC-Projects\C PROJECTS\C2562 (MG) KOSMOSDAL X 89\1. Client and Related Bodies\1.13 TIS, Traffic Statements\5 Calculations\TIA\2 Sidra\3 Reitspurit_Samrand\BG+DEV\Samrand-Rietspruit_BG+DEV.sip
173 PHASING SUMMARY Samrand Avenue / Rietspruit Road Junction 224 Weekday Afernoon Peak Hour Background and Development Traffic Volumes Existing Signalised Four Legged Junction Signals - Fixed Time Cycle Time = 9 seconds Site: 224 PM BG+DEV Cycle Time Option: User-specified Cycle Time Phase times specified by the user Sequence: Two-Phase Input Sequence: A, B, C, D Output Sequence: A, B, C, D Phase Timing Results Phase A B C D Green Time (sec) Yellow Time (sec) All-Red Time (sec) Phase Time (sec) Phase Split 19% 33% 19% 29% Phase A Phase B Phase C Rietspruit Road (N) Rietspruit Road (N) Rietspruit Road (N) Samrand Avenue (W) Samrand Avenue (E) Samrand Avenue (W) Samrand Avenue (E) Samrand Avenue (W) Samrand Avenue (E) Rietspruit Road (S) Rietspruit Road (S) Rietspruit Road (S) Phase D Rietspruit Road (N) Samrand Avenue (W) Samrand Avenue (E) Rietspruit Road (S) Normal Movement Slip-Lane Movement Stopped Movement Turn On Red Permitted/Opposed Opposed Slip-Lane Continuous Movement Undetected Movement Phase Transition Applied Processed: Friday, 1 February 219 1:4:5 PM Copyright 2-21 Akcelik & Associates Pty Ltd SIDRA INTERSECTION Project: W:\CC-Projects\C PROJECTS\C2562 (MG) KOSMOSDAL X 89\1. Client and Related Bodies\1.13 TIS, Traffic Statements\5 Calculations\TIA\2 Sidra\3 Reitspurit_Samrand\BG+DEV\Samrand-Rietspruit_BG+DEV.sip
174 PHASING SUMMARY Rooihuiskraal Road / Rietspruit Road Junction 219 Weekday Morning Peak Hour Background and Development Traffic Volumes Existing Signalised Four Legged Junction Signals - Fixed Time Cycle Time = 9 seconds Site: 219 AM BG Cycle Time Option: User-specified Cycle Time Phase times specified by the user Sequence: Two-Phase Input Sequence: A, B, C Output Sequence: A, B, C Phase Timing Results Phase A B C Green Time (sec) Yellow Time (sec) All-Red Time (sec) Phase Time (sec) Phase Split 31% 42% 27% Phase A Phase B Phase C Rooihuiskraal Road (M37) (N) Rooihuiskraal Road (M37) (N) Rooihuiskraal Road (M37) (N) Rietspriut Road (W) Rietspriut Road (E) Rietspriut Road (W) Rietspriut Road (E) Rietspriut Road (W) Rietspriut Road (E) Rooihuiskraal Road (M37) (S) Rooihuiskraal Road (M37) (S) Rooihuiskraal Road (M37) (S) Normal Movement Slip-Lane Movement Stopped Movement Turn On Red Permitted/Opposed Opposed Slip-Lane Continuous Movement Undetected Movement Phase Transition Applied Processed: Monday, 11 February :31:8 AM Copyright 2-21 Akcelik & Associates Pty Ltd SIDRA INTERSECTION Project: W:\CC-Projects\C PROJECTS\C2562 (MG) KOSMOSDAL X 89\1. Client and Related Bodies\1.13 TIS, Traffic Statements\5 Calculations\TIA\2 Sidra\4 Reitspurit_Rooihuskraal\BG\Rooihuiskraal-Rietspruit_BG.sip
175 PHASING SUMMARY Rooihuiskraal Road / Rietspruit Road Junction 219 Weekday Afternoon Peak Hour Background and Development Traffic Volumes Existing Signalised Four Legged Junction Signals - Fixed Time Cycle Time = 7 seconds Site: 219 PM BG Cycle Time Option: User-specified Cycle Time Phase times specified by the user Sequence: Two-Phase Input Sequence: A, B, C Output Sequence: A, B, C Phase Timing Results Phase A B C Green Time (sec) Yellow Time (sec) All-Red Time (sec) Phase Time (sec) Phase Split 24% 41% 34% Phase A Phase B Phase C Rooihuiskraal Road (N) Rooihuiskraal Road (N) Rooihuiskraal Road (N) Rietspriut Road (W) Rietspriut Road (E) Rietspriut Road (W) Rietspriut Road (E) Rietspriut Road (W) Rietspriut Road (E) Rooihuiskraal Road (S) Rooihuiskraal Road (S) Rooihuiskraal Road (S) Normal Movement Slip-Lane Movement Stopped Movement Turn On Red Permitted/Opposed Opposed Slip-Lane Continuous Movement Undetected Movement Phase Transition Applied Processed: Friday, 1 February 219 2:59:17 PM Copyright 2-21 Akcelik & Associates Pty Ltd SIDRA INTERSECTION Project: W:\CC-Projects\C PROJECTS\C2562 (MG) KOSMOSDAL X 89\1. Client and Related Bodies\1.13 TIS, Traffic Statements\5 Calculations\TIA\2 Sidra\4 Reitspurit_Rooihuskraal\BG\Rooihuiskraal-Rietspruit_BG.sip
176 PHASING SUMMARY Rooihuiskraal Road / Rietspruit Road Junction 224 Weekday Morning Peak Hour Background and Development Traffic Volumes Existing Signalised Four Legged Junction Signals - Fixed Time Cycle Time = 9 seconds Site: 224 AM BG Cycle Time Option: User-specified Cycle Time Phase times specified by the user Sequence: Two-Phase Input Sequence: A, B, C Output Sequence: A, B, C Phase Timing Results Phase A B C Green Time (sec) Yellow Time (sec) All-Red Time (sec) Phase Time (sec) Phase Split 31% 42% 27% Phase A Phase B Phase C Rooihuiskraal Road (N) Rooihuiskraal Road (N) Rooihuiskraal Road (N) Rietspriut Road (W) Rietspriut Road (E) Rietspriut Road (W) Rietspriut Road (E) Rietspriut Road (W) Rietspriut Road (E) Rooihuiskraal Road (S) Rooihuiskraal Road (S) Rooihuiskraal Road (S) Normal Movement Slip-Lane Movement Stopped Movement Turn On Red Permitted/Opposed Opposed Slip-Lane Continuous Movement Undetected Movement Phase Transition Applied Processed: Friday, 1 February 219 3:5:49 PM Copyright 2-21 Akcelik & Associates Pty Ltd SIDRA INTERSECTION Project: W:\CC-Projects\C PROJECTS\C2562 (MG) KOSMOSDAL X 89\1. Client and Related Bodies\1.13 TIS, Traffic Statements\5 Calculations\TIA\2 Sidra\4 Reitspurit_Rooihuskraal\BG\Rooihuiskraal-Rietspruit_BG.sip
177 PHASING SUMMARY Rooihuiskraal Road / Rietspruit Road Junction 224 Weekday Afternoon Peak Hour Background and Development Traffic Volumes Existing Signalised Four Legged Junction Signals - Fixed Time Cycle Time = 7 seconds Site: 224 PM BG Cycle Time Option: User-specified Cycle Time Phase times specified by the user Sequence: Two-Phase Input Sequence: A, B, C Output Sequence: A, B, C Phase Timing Results Phase A B C Green Time (sec) Yellow Time (sec) All-Red Time (sec) Phase Time (sec) Phase Split 24% 41% 34% Phase A Phase B Phase C Rooihuiskraal Road (N) Rooihuiskraal Road (N) Rooihuiskraal Road (N) Rietspriut Road (W) Rietspriut Road (E) Rietspriut Road (W) Rietspriut Road (E) Rietspriut Road (W) Rietspriut Road (E) Rooihuiskraal Road (S) Rooihuiskraal Road (S) Rooihuiskraal Road (S) Normal Movement Slip-Lane Movement Stopped Movement Turn On Red Permitted/Opposed Opposed Slip-Lane Continuous Movement Undetected Movement Phase Transition Applied Processed: Friday, 1 February 219 2:5:44 PM Copyright 2-21 Akcelik & Associates Pty Ltd SIDRA INTERSECTION Project: W:\CC-Projects\C PROJECTS\C2562 (MG) KOSMOSDAL X 89\1. Client and Related Bodies\1.13 TIS, Traffic Statements\5 Calculations\TIA\2 Sidra\4 Reitspurit_Rooihuskraal\BG\Rooihuiskraal-Rietspruit_BG.sip
178 PHASING SUMMARY Rooihuiskraal Road / Rietspruit Road Junction 219 Weekday Morning Peak Hour Background and Development Traffic Volumes Existing Signalised Four Legged Junction Signals - Fixed Time Cycle Time = 9 seconds Site: 219 AM BG+DEV Cycle Time Option: User-specified Cycle Time Phase times specified by the user Sequence: Two-Phase Input Sequence: A, B, C Output Sequence: A, B, C Phase Timing Results Phase A B C Green Time (sec) Yellow Time (sec) All-Red Time (sec) Phase Time (sec) Phase Split 31% 42% 27% Phase A Phase B Phase C Rooihuiskraal Road (N) Rooihuiskraal Road (N) Rooihuiskraal Road (N) Rietspriut Road (W) Rietspriut Road (E) Rietspriut Road (W) Rietspriut Road (E) Rietspriut Road (W) Rietspriut Road (E) Rooihuiskraal Road (S) Rooihuiskraal Road (S) Rooihuiskraal Road (S) Normal Movement Slip-Lane Movement Stopped Movement Turn On Red Permitted/Opposed Opposed Slip-Lane Continuous Movement Undetected Movement Phase Transition Applied Processed: Friday, 1 February 219 3:56:51 PM Copyright 2-21 Akcelik & Associates Pty Ltd SIDRA INTERSECTION Project: W:\CC-Projects\C PROJECTS\C2562 (MG) KOSMOSDAL X 89\1. Client and Related Bodies\1.13 TIS, Traffic Statements\5 Calculations\TIA\2 Sidra\4 Reitspurit_Rooihuskraal\BG+DEV\Rooihuiskraal- Rietspruit_DEV_Rev1.sip
179 PHASING SUMMARY Rooihuiskraal Road / Rietspruit Road Junction 219 Weekday Afternoon Peak Hour Background and Development Traffic Volumes Existing Signalised Four Legged Junction Signals - Fixed Time Cycle Time = 7 seconds Site: 219 PM BG+DEV Cycle Time Option: User-specified Cycle Time Phase times specified by the user Sequence: Two-Phase Input Sequence: A, B, C Output Sequence: A, B, C Phase Timing Results Phase A B C Green Time (sec) Yellow Time (sec) All-Red Time (sec) Phase Time (sec) Phase Split 24% 41% 34% Phase A Phase B Phase C Rooihuiskraal Road (N) Rooihuiskraal Road (N) Rooihuiskraal Road (N) Rietspriut Road (W) Rietspriut Road (E) Rietspriut Road (W) Rietspriut Road (E) Rietspriut Road (W) Rietspriut Road (E) Rooihuiskraal Road (S) Rooihuiskraal Road (S) Rooihuiskraal Road (S) Normal Movement Slip-Lane Movement Stopped Movement Turn On Red Permitted/Opposed Opposed Slip-Lane Continuous Movement Undetected Movement Phase Transition Applied Processed: Friday, 1 February 219 3:49:21 PM Copyright 2-21 Akcelik & Associates Pty Ltd SIDRA INTERSECTION Project: W:\CC-Projects\C PROJECTS\C2562 (MG) KOSMOSDAL X 89\1. Client and Related Bodies\1.13 TIS, Traffic Statements\5 Calculations\TIA\2 Sidra\4 Reitspurit_Rooihuskraal\BG+DEV\Rooihuiskraal- Rietspruit_DEV_Rev1.sip
180 PHASING SUMMARY Rooihuiskraal Road / Rietspruit Road Junction 224 Weekday Morning Peak Hour Background and Development Traffic Volumes Existing Signalised Four Legged Junction Signals - Fixed Time Cycle Time = 9 seconds Site: 224 AM BG+DEV Cycle Time Option: User-specified Cycle Time Phase times specified by the user Sequence: Two-Phase Input Sequence: A, B, C Output Sequence: A, B, C Phase Timing Results Phase A B C Green Time (sec) Yellow Time (sec) All-Red Time (sec) Phase Time (sec) Phase Split 31% 42% 27% Phase A Phase B Phase C Rooihuiskraal Road (N) Rooihuiskraal Road (N) Rooihuiskraal Road (N) Rietspriut Road (W) Rietspriut Road (E) Rietspriut Road (W) Rietspriut Road (E) Rietspriut Road (W) Rietspriut Road (E) Rooihuiskraal Road (S) Rooihuiskraal Road (S) Rooihuiskraal Road (S) Normal Movement Slip-Lane Movement Stopped Movement Turn On Red Permitted/Opposed Opposed Slip-Lane Continuous Movement Undetected Movement Phase Transition Applied Processed: Friday, 1 February 219 3:53:58 PM Copyright 2-21 Akcelik & Associates Pty Ltd SIDRA INTERSECTION Project: W:\CC-Projects\C PROJECTS\C2562 (MG) KOSMOSDAL X 89\1. Client and Related Bodies\1.13 TIS, Traffic Statements\5 Calculations\TIA\2 Sidra\4 Reitspurit_Rooihuskraal\BG+DEV\Rooihuiskraal- Rietspruit_DEV_Rev1.sip
181 PHASING SUMMARY Rooihuiskraal Road / Rietspruit Road Junction 224 Weekday Afternoon Peak Hour Background and Development Traffic Volumes Existing Signalised Four Legged Junction Signals - Fixed Time Cycle Time = 7 seconds Site: 224 PM BG+DEV Cycle Time Option: User-specified Cycle Time Phase times specified by the user Sequence: Two-Phase Input Sequence: A, B, C Output Sequence: A, B, C Phase Timing Results Phase A B C Green Time (sec) Yellow Time (sec) All-Red Time (sec) Phase Time (sec) Phase Split 24% 41% 34% Phase A Phase B Phase C Rooihuiskraal Road (N) Rooihuiskraal Road (N) Rooihuiskraal Road (N) Rietspriut Road (W) Rietspriut Road (E) Rietspriut Road (W) Rietspriut Road (E) Rietspriut Road (W) Rietspriut Road (E) Rooihuiskraal Road (S) Rooihuiskraal Road (S) Rooihuiskraal Road (S) Normal Movement Slip-Lane Movement Stopped Movement Turn On Red Permitted/Opposed Opposed Slip-Lane Continuous Movement Undetected Movement Phase Transition Applied Processed: Friday, 1 February 219 3:46:36 PM Copyright 2-21 Akcelik & Associates Pty Ltd SIDRA INTERSECTION Project: W:\CC-Projects\C PROJECTS\C2562 (MG) KOSMOSDAL X 89\1. Client and Related Bodies\1.13 TIS, Traffic Statements\5 Calculations\TIA\2 Sidra\4 Reitspurit_Rooihuskraal\BG+DEV\Rooihuiskraal- Rietspruit_DEV_Rev1.sip
182 ANNEXURE G LINE OF SIGHT
 (@GLO) SIGHT DISTANCE Level (m) Depth (m) (@GLO) 1.3 1.35 1.42 1.46 1.48 1.45 1.42 1.37 1.29 1.19 149.21 149.53 149.86 1491.19 1491.52 1491.85 1492.18 1492.51 1492.83 1493.16 1488.")

183 5456. Sight ROOIHUISKRAAL ROAD X X Peg Distance (m) DATUM : Ground Level (m) (@GLO) SIGHT DISTANCE Level (m) Depth (m) (@GLO) SIGHT LONGITUDINAL SECTION SCALE HOR 1:1 VER 1:1 VERTICAL ALIGNMENT DATA Peg dist. Elev. BVc EVc CL Grade(%) Y Y 869 Y ROOIHUISKRAAL ROAD / RECEPTION AREA STORE & C/R AREA CH = 33 VPI=151.5 CH = 51 VPI= LINE OF SIGHT NATURAL GROUND LEVEL High NOTES AND SPECIFICATIONS AMENDMENTS NO. DATE APPROVED DESCRIPTION PAR. DESIGNED DRAWN LJ ZIETSMAN R. LESSING SIGNATURE:... DATE:... SIGNATURE:... DATE:... DESIGN CHECKED BY LJ ZIETSMAN INFRASTRUCTURE TECHNICAL INFORMATION MANAGEMENT D.J. CHALMERS SIGNATURE:... DATE:... PROJECT STATUS CONCEPT DRAWING PROJECT ENGINEER ( CONSULTANT) TENDER DRAWING APPROVED FOR CONSTRUCTION DRAWING AS BUILT DRAWING LJ ZIETSMAN INITIALS AND SURNAME SIGNATURE AND Pr. No. 15/11/218 DATE PROJECT ENGINEER ( CITY OF TSHWANE) INITIALS AND SURNAME SIGNATURE AND Pr. No. DATE STRUCTURAL ENGINEER (CITY OF TSHWANE) INITIALS AND SURNAME SIGNATURE AND Pr. No. DATE INSPECTOR OF WORKS (CITY OF TSHWANE): INITIALS AND SURNAME SIGNATURE AND Pr. No. DATE CONSULTANT DETAIL CITY OF TSHWANE ROADS & TRANSPORT DEPARTMENT GROUP HEAD Mr Letlonkane P. (Pheko) P.O. BOX 149 PRETORIA 1 DRAWING APPROVED BY ACTING DIVISIONAL HEAD Mr Lebepe M.T. (Thabo) ACTING DIVISIONAL HEAD Mr Lebepe M.T. (Thabo) P.O. BOX 149 PRETORIA 1 SIGNATURE:... DATE:... LOCATION OF PROJECT: KOSMOSDAL X 14 KOSMOSDAL FILLING STATION LINE OF SIGHT PLAN WAYLEAVE No. : - CONTRACT No. : PROJECT No. : C2562 C2562 DATE : SCALE : ORIGINAL PAPER SIZE: 15/11/218 A1 A1 DRAWING NO. C SHEET NO: REVISION
LYNNWOOD ROAD ARTERIAL STUDY The effect of intersection spacing on arterial operation
 LYNNWOOD ROAD ARTERIAL STUDY The effect of intersection spacing on arterial operation A J Joubert*, S L Burnett**, and T Ueckermann* *PWV Consortium, PO Box 1109, Sunninghill 2157 **Gautrans, Gauteng Department
Traffic Impact Statement. Durbanville Development Erf 40, Re 72, Erf and Erf 91, Durbanville
 Traffic Impact Statement Durbanville Development Erf 40, Re 72, Erf 5732 and Erf 9, Durbanville PREPARED FOR: CONTACT PERSON: Gerhard Nel e-mail: gnel@jubelie.co.za PREPARED BY: KERNEELS LION CACHET ENGINEERS
5858 N COLLEGE, LLC N College Avenue Traffic Impact Study
 5858 N COLLEGE, LLC nue Traffic Impact Study August 22, 2016 Contents Traffic Impact Study Page Preparer Qualifications... 1 Introduction... 2 Existing Roadway Conditions... 5 Existing Traffic Conditions...
Traffic Impact Study. Westlake Elementary School Westlake, Ohio. TMS Engineers, Inc. June 5, 2017
 TMS Engineers, Inc. Traffic Impact Study Westlake Elementary School Westlake, Ohio June 5, 2017 Prepared for: Westlake City Schools - Board of Education 27200 Hilliard Boulevard Westlake, OH 44145 TRAFFIC
Traffic Impact Study WestBranch Residential Development Davidson, NC March 2016
 Traffic Impact Study WestBranch Residential Development Davidson, NC March 216 TRAFFIC IMPACT STUDY FOR THE WestBranch Residential Development LOCATED IN DAVIDSON, NC Prepared For: Lennar Carolinas, LLC
Roundabouts along Rural Arterials in South Africa
 Krogscheepers & Watters 0 0 Word count: 00 text + figures = 0 equivalent words including Title and Abstract. Roundabouts along Rural Arterials in South Africa Prepared for: rd Annual Meeting of Transportation
Highway 111 Corridor Study
 Highway 111 Corridor Study June, 2009 LINCOLN CO. HWY 111 CORRIDOR STUDY Draft Study Tea, South Dakota Prepared for City of Tea Sioux Falls Metropolitan Planning Organization Prepared by HDR Engineering,
Traffic Impact Analysis Chatham County Grocery Chatham County, NC
 Chatham County Grocery Chatham County, NC TABLE OF CONTENTS 1. INTRODUCTION... 1 1.1. Location and Study Area... 1 1.2. Proposed Land Use and Access... 2 1.3. Adjacent Land Uses... 2 1.4. Existing ways...
Traffic Impact Analysis (TIA) Process and Procedures Manual. September 2017
 Process and Procedures Manual. September 2017") Traffic Impact Analysis (TIA) Process and Procedures Manual Post Office Box 664 101 Huntersville-Concord Road Huntersville, NC 28070 Phone 704-766-2220 Fax 704-992-5528 www.huntersville.org (c) 2017, Town
Traffic Impact Analysis (TIA) Process and Procedures Manual Post Office Box 664 101 Huntersville-Concord Road Huntersville, NC 28070 Phone 704-766-2220 Fax 704-992-5528 www.huntersville.org (c) 2017, Town
Traffic Impact Analysis Walton Acres at Riverwood Athletic Club Clayton, NC
 Traffic Impact Analysis Walton Acres at Riverwood Athletic Club Clayton, NC 1. TABLE OF CONTENTS INTRODUCTION...1 1.1. Site Location and Study Area...1 1.2. Proposed Land Use and Site Access...2 1.3.
TRANSPORTATION ANALYSIS REPORT US Route 6 Huron, Erie County, Ohio
 TRANSPORTATION ANALYSIS REPORT US Route 6 Huron, Erie County, Ohio December 12, 2012 Prepared for: The City of Huron 417 Main Huron, OH 44839 Providing Practical Experience Technical Excellence and Client
TRAFFIC STUDY GUIDELINES Clarksville Street Department
 TRAFFIC STUDY GUIDELINES Clarksville Street Department 9/1/2009 Introduction Traffic studies are used to help the city determine potential impacts to the operation of the surrounding roadway network. Two
METHODOLOGY. Signalized Intersection Average Control Delay (sec/veh)
") Chapter 5 Traffic Analysis 5.1 SUMMARY US /West 6 th Street assumes a unique role in the Lawrence Douglas County transportation system. This principal arterial street currently conveys commuter traffic
Chapter 5 Traffic Analysis 5.1 SUMMARY US /West 6 th Street assumes a unique role in the Lawrence Douglas County transportation system. This principal arterial street currently conveys commuter traffic
Subject: Solberg Avenue / I-229 Grade Separation: Traffic Analysis
 MEMORANDUM Transportation Bill Troe, AICP Jason Carbee, AICP 12120 Shamrock Plaza Suite 300 Omaha, NE 68154 (402) 334-8181 (402) 334-1984 (Fax) To: Project File Date: Subject: Solberg Avenue / I-229 Grade
SIDRA INTERSECTION 6.1 UPDATE HISTORY
 Akcelik & Associates Pty Ltd PO Box 1075G, Greythorn, Vic 3104 AUSTRALIA ABN 79 088 889 687 For all technical support, sales support and general enquiries: support.sidrasolutions.com SIDRA INTERSECTION
VIVA RETIREMENT COMMUNITIES OAKVILLE TRAFFIC IMPACT STUDY
 VIVA RETIREMENT COMMUNITIES OAKVILLE TRAFFIC IMPACT STUDY VIVA RETIREMENT COMMUNITIES OAKVILLE TRAFFIC IMPACT STUDY DECEMBER 2012 READ, VOORHEES & ASSOCIATES TORONTO, ONTARIO Read, Voorhees & Associates
TRAFFIC IMPACT STUDY COMPREHENSIVE UPDATE TOWN OF THOMPSON S STATION, TENNESSEE PREPARED FOR: THE TOWN OF THOMPSON S STATION
 TRAFFIC IMPACT STUDY COMPREHENSIVE UPDATE TOWN OF THOMPSON S STATION, TENNESSEE PREPARED FOR: THE TOWN OF THOMPSON S STATION Transportation Consultants, LLC 1101 17 TH AVENUE SOUTH NASHVILLE, TN 37212
RIGHT TURNS AT INTERSECTIONS: ARE THERE ALTERNATIVES?
 RIGHT TURNS AT INTERSECTIONS: ARE THERE ALTERNATIVES? R.C. Pyke, J.D. Sampson and K.G. Schmid Stewart Scott International, P O Box 784506, Sandton, 2146 TTT Africa, P.O.Box 109, Sunninghill, G.D.P.T.R.W,
TRAFFIC IMPACT STUDY CRITERIA
 Chapter 6 - TRAFFIC IMPACT STUDY CRITERIA 6.1 GENERAL PROVISIONS 6.1.1. Purpose: The purpose of this document is to outline a standard format for preparing a traffic impact study in the City of Steamboat
ENHANCED PARKWAY STUDY: PHASE 2 CONTINUOUS FLOW INTERSECTIONS. Final Report
 Preparedby: ENHANCED PARKWAY STUDY: PHASE 2 CONTINUOUS FLOW INTERSECTIONS Final Report Prepared for Maricopa County Department of Transportation Prepared by TABLE OF CONTENTS Page EXECUTIVE SUMMARY ES-1
BROMPTON LODGE, CRANBOURNE PRECINCT STRUCTURE PLAN TRAFFIC ENGINEERING ASSESSMENT WOLFDENE PTY LTD PREPARED FOR
 BROMPTON LODGE, CRANBOURNE PRECINCT STRUCTURE PLAN TRAFFIC ENGINEERING ASSESSMENT PREPARED FOR WOLFDENE PTY LTD TRAFFIC ENGINEERING ASSESSMENT PRECINCT STRUCTURE PLAN AT BROMPTON LODGE, CRANBOURNE Document
19 July 2016 OUR REF:
 19 July 2016 OUR REF: 602263-01000 194168 Ontario Ltd. 320 McRae Street Ottawa, ON K1Z 5R8 Attention: Brian Casagrande Dear Brian: Re: 320 McRae/1976 Scott Redevelopment CTS Addendum #1 This Addendum has
Walton Acres at Riverwood Athletic Club Clayton, North Carolina
 9. CONCLUSIONS This Traffic Impact Analysis Update was conducted to determine the potential traffic impacts of the proposed Walton Acres at Riverwood Athletic Club residential development, located east
CHAPTER 4 TRANSPORTATION IMPACT STUDY TABLE OF CONTENTS
 CHAPTER 4 TRANSPORTATION IMPACT STUDY TABLE OF CONTENTS Section Title Page 4.1 Introduction... 4-1 4.1.1 General... 4-1 4.1.2 Applicant Responsibility... 4-1 4.1.3 Capacity and Safety Issues... 4-1 A.
1609 E. FRANKLIN STREET HOTEL TRAFFIC IMPACT STUDY EXECUTIVE SUMMARY
 1609 E. FRANKLIN STREET HOTEL TRAFFIC IMPACT STUDY EXECUTIVE SUMMARY Prepared for: The Town of Chapel Hill Public Works Department Traffic Engineering Division Prepared by: HNTB North Carolina, PC 343
Project Report. South Kirkwood Road Traffic Study. Meadows Place, TX October 9, 2015
 Meadows Place, TX October 9, 2015 Contents 1 Introduction... 1 2 Data Collection... 1 3 Existing Roadway Network... 2 4 Traffic Volume Development... 2 5 Warrant Analysis... 3 6 Traffic Control Alternative
TRAFFIC IMPACT ANALYSIS
 TRAFFIC IMPACT ANALYSIS FOR THE CHAMPAIGN UNIT#4 SCHOOL DISTRICT PROPOSED HIGH SCHOOL (SPALDING PARK SITE) IN THE CITY OF CHAMPAIGN Final Report Champaign Urbana Urbanized Area Transportation Study 6/24/2014
SECTION 1 - TRAFFIC PLANNING
 SECTION 1 - TRAFFIC PLANNING 1.1 TRAFFIC OPERATIONS 1.1.1 Roadway Functional Classification The Multnomah County Comprehensive Framework Plan s Policy 34: Trafficways and the Functional Classification
Gap Acceptance Cycles for Modelling Roundabout Capacity and Performance
 15th Scientific and Technical Conference Transport Systems Theory and Practice Department of Transport Systems and Traffic Engineering, Faculty of Transport, Silesian University of Technology, Katowice,
Magnolia Place. Traffic Impact Analysis. Prepared for: City of San Mateo. Prepared by: Hexagon Transportation Consultants, Inc.
 Magnolia Place Traffic Impact Analysis Prepared for: City of San Mateo Prepared by: Hexagon Transportation Consultants, Inc. Updated January 4, 2010 Table of Contents 1. Introduction...1 2. Existing Conditions...6
Intersection of Massachusetts Avenue and Maple Street in Lexington Signalized Intersection and Roundabout Comparison
 Intersection of Massachusetts Avenue and Maple Street in Lexington Signalized Intersection and Roundabout Comparison Michael Wallwork, Roundabout Expert, Orange Park, Florida Tom Bertulis (MS, PE, PTOE),
INDUSTRIAL BUILDING 3009 HAWTHORNE ROAD CITY OF OTTAWA TRANSPORTATION OVERVIEW REVISED. Prepared for: Canada Inc.
 INDUSTRIAL BUILDING 3009 HAWTHORNE ROAD CITY OF OTTAWA TRANSPORTATION OVERVIEW REVISED Prepared for: 7849648 Canada Inc. Octiober 1, 2015 114-598 Overview_2.doc D. J. Halpenny & Associates Ltd. Consulting
Traffic Academy: IJS & IMS FAQ/RULES OF THUMB
 FAQ/RULES OF THUMB HCS intersection analysis criteria See LDM Figure 401-14aE Cycle lengths between 60 to 120 seconds No impractical phases, i.e., 1 second green time Yellow + All Red must be no less than
APPENDIXB. Traffic Operations Technical Memorandum
 APPENDIXB Traffic Operations Technical Memorandum Environmental Assessment - Lincoln County, SD 85 th Street: Sundowner Avenue to Louise Avenue November 2017 MEMORANDUM Transportation Jim Kollbaum, PE
Walmart (Store # ) 60 th Street North and Marion Road Sioux Falls, South Dakota
 60 th Street North and Marion Road Sioux Falls, South Dakota") Walmart (Store #4865-00) 60 th Street North and Marion Road Sioux Falls, South Dakota Prepared for: Wal-Mart Stores, Inc. Bentonville, Arkansas Prepared by: Kimley-Horn and Associates, Inc. ã2013 Kimley-Horn
Walmart (Store #4865-00) 60 th Street North and Marion Road Sioux Falls, South Dakota Prepared for: Wal-Mart Stores, Inc. Bentonville, Arkansas Prepared by: Kimley-Horn and Associates, Inc. ã2013 Kimley-Horn
Technical Memorandum TRAFFIC IMPACT STUDY. RIDLEY ROAD CONVENIENCE STORE Southampton County, VA. Prepared for: Mr. David Williams.
 Technical Memorandum TRFFIC IMPCT STUDY RIDLEY ROD CONVENIENCE STORE Southampton County, V Prepared for: Mr. David Williams By: Charles Smith, P.E., PTOE EPR Charlottesville, V July 2014 1 TBLE OF CONTENTS
9 Leeming Drive Redevelopment Ottawa, ON Transportation Brief. Prepared By: Stantec Consulting Ltd.
 9 Leeming Drive Redevelopment Ottawa, ON Transportation Brief Prepared By: Stantec Consulting Ltd. TIA GUIDELINES CHECKLIST Report Context Municipal Address Comment: Section 1.1 Location relative to major
Operational Comparison of Transit Signal Priority Strategies
 Operational Comparison of Transit Signal Priority Strategies Revision Submitted on: November, 0 Author: Adriana Rodriguez, E.I Assistant Engineer Parsons Brinckerhoff 0 South Orange Avenue, Suite 00 Orlando,
Draft Report. Traffic Impact Study. Superstore, Wal-Mart, and Kent Development. Yarmouth, Nova Scotia. Prepared for
 oad & Traffic Management Road & Traffic Management R Atlantic Traffic Engineering Specialists Draft Report Traffic Impact Study Superstore, Wal-Mart, and Kent Development Yarmouth, Nova Scotia Prepared
Evaluating Roundabout Capacity, Level of Service and Performance
 Roundabouts with Metering Signals ITE 2009 Annual Meeting, San Antonio, Texas, USA, August 9-12, 2009 Evaluating Roundabout Capacity, Level of Service and Performance Presenter: Rahmi Akçelik rahmi.akcelik@sidrasolutions.com
Clackamas County Comprehensive Plan
 ROADWAYS The County s road system permits the movement of goods and people between communities and regions, using any of a variety of modes of travel. Roads provide access to virtually all property. They
D.13 Transportation and Traffic
 This section addresses transportation and traffic issues and impacts related to the Proposed Project. Section D.13.1 provides a description of the affected environment for the Proposed Project. Applicable
TECHNICAL NOTE THROUGH KERBSIDE LANE UTILISATION AT SIGNALISED INTERSECTIONS
 TECHNICAL NOTE THROUGH KERBSIDE LANE UTILISATION AT SIGNALISED INTERSECTIONS Authors: Randhir Karma NDip: Eng (Civil) B. Tech Eng (Civil) M Eng (Hons) (Transportation) Auckland Traffic Service Group Manager
At each type of conflict location, the risk is affected by certain parameters:
 TN001 April 2016 The separated cycleway options tool (SCOT) was developed to partially address some of the gaps identified in Stage 1 of the Cycling Network Guidance project relating to separated cycleways.
Truck Climbing Lane Traffic Justification Report
 ROUTE 7 (HARRY BYRD HIGHWAY) WESTBOUND FROM WEST MARKET STREET TO ROUTE 9 (CHARLES TOWN PIKE) Truck Climbing Lane Traffic Justification Report Project No. 6007-053-133, P 101 Ι UPC No. 58599 Prepared by:
DERIVATION OF A SIGNAL TIMING SCHEME FOR AN EXTERNALLY SIGNALIZED ROUNDABOUT
 DERIVATION OF A SIGNAL TIMING SCHEME FOR AN EXTERNALLY SIGNALIZED ROUNDABOUT Paper Presented at the Annual Sessions of the Institute of Engineers, Sri Lanka Dr. Amal S. Kumarage, Senior Lecturer Dr. J.M.S.J.
aasidra for Roundabouts INTRODUCTION
 aasidra for Roundabouts INTRODUCTION Rahmi Akçelik Director, Akcelik & Associates Pty Ltd Adjunct Professor, Monash University Mark Besley Director, Akcelik & Associates Pty Ltd TRB Roundabout Conference
84-88 Columbia Street West Waterloo, Ontario Transportation Impact Study. Paradigm Transportation Solutions Limited
 84-88 Columbia Street West Waterloo, Ontario Transportation Impact Study Paradigm Transportation Solutions Limited June 217 Project Summary Project Number 15255 June 217 Client Masri O Inc. Architects
Road Conversion Study Plumas Street
 Plumas Street Phase I Submitted to The Regional Transportation Commission of Washoe County Submitted by Zong Tian, Ph.D., P.E. Saeedeh Farivar Haiyuan Li, Ph.D. Center for Advanced Transportation Education
Figure 1: East West Connector Alignment Alternatives Concept Drawing
 Page 2 of 9 Figure 1: East West Connector Alignment Alternatives Concept Drawing The Montebello Drive extension will run north south and connect Wilsonville Road to the Boones Ferry Road to Brown Road
Chapter 5 5. INTERSECTIONS 5.1. INTRODUCTION
 Chapter 5 5. INTERSECTIONS 5.1. INTRODUCTION Intersections are the physical component of the roadways where two highways intersect. They are the most complex element of roadways, since it requires more
Stanley Street/Shotover Street, Queenstown. Traffic Modelling Report
 Stanley Street/Shotover Street, Queenstown Traffic Modelling Report Stanley Street/Shotover Street, Queenstown Traffic Modelling Report Prepared By Chris Morahan Transportation Engineer/Traffic Modeller
Simulating Street-Running LRT Terminus Station Options in Dense Urban Environments Shaumik Pal, Rajat Parashar and Michael Meyer
 Simulating Street-Running LRT Terminus Station Options in Dense Urban Environments Shaumik Pal, Rajat Parashar and Michael Meyer Abstract The Exposition Corridor transit project is a light rail project
Traffic and Transport Assessment
 Traffic and Transport Assessment Section 96 Residential Subdivision, Davis Road Tarneit CG120370 Prepared for Stockland Pty Ltd 19 February 2013 Document Information Prepared for Stockland Pty Ltd Project
MEMORANDUM. Our project study area included the following locations:
 MEMORANDUM Date: To: From: Subject: Najib O. Habesch Nick M. Fomenko, PE, PTOE Bushnell Park North Traffic Assessment BETA Project #: 4461 As part of our contract to undertake the design of the Bushnell
THIS PAGE LEFT BLANK INTENTIONALLY
 GA SR 25 Spur at Canal Road Transportation Impact Analysis PREPARED FOR GLYNN COUNTY, GEORGIA 1725 Reynolds Street, Suite 300 Brunswick, Georgia 31520 PREPARED BY 217 Arrowhead Boulevard Suite 26 Jonesboro,
Johannesburg Roads Agency. A-Z Traffic Calming Guide
 Johannesburg Roads Agency A-Z Traffic Calming Guide Table of Contents The Role of a Traffic Engineer... 2 JRA s Traffic Engineering Department s Responsibilities:... 2 Traffic Engineering Enquiries...
Chapter Capacity and LOS Analysis of a Signalized I/S Overview Methodology Scope Limitation
 Chapter 37 Capacity and LOS Analysis of a Signalized I/S 37.1 Overview The Highway Capacity Manual defines the capacity as the maximum howdy rate at which persons or vehicle can be reasonably expected
DUNBOW ROAD FUNCTIONAL PLANNING
 DUNBOW ROAD FUNCTIONAL PLANNING Final Report August 3, 216 #31, 316 5th Avenue NE Calgary, AB T2A 6K4 Phone: 43.273.91 Fax: 43.273.344 wattconsultinggroup.com Dunbow Road Functional Planning Final Report
Existing Conditions. Date: April 16 th, Dan Holderness; Coralville City Engineer Scott Larson; Coralville Assistant City Engineer
 Date: April 16 th, 2015 To: From: Re: Dan Holderness; Coralville City Engineer Scott Larson; Coralville Assistant City Engineer Darian Nagle-Gamm, Traffic Engineering Planner Highway 6 (2 nd Street) /
Figure 1: Vicinity Map of the Study Area
 ARIZONA TEXAS NEW MEXICO OKLAHOMA May 5, 2016 Mr. Anthony Beach, P.E. BSP Engineers 4800 Lakewood Drive, Suite 4 Waco, Texas 76710 Re: Intersection and Access Analysis along Business 190 in Copperas Cove
Waterford Lakes Small Area Study
 Waterford Lakes Small Area Study Existing Traffic Conditions PREPARED FOR: ORANGE COUNTY PUBLIC WORKS DEPARTMENT TRAFFIC ENGINEERING DIVISION ORLANDO, FLORIDA PREPARED WITH: INWOOD CONSULTING ENGINEERS
FINAL DESIGN TRAFFIC TECHNICAL MEMORANDUM
 FINAL DESIGN TRAFFIC TECHNICAL MEMORANDUM July 2014 FINAL (SR 43) Project Development and Environment Study From State Road 60 (Adamo Drive) to I-4 (SR 400) Hillsborough County, Florida Work Program Item
TABLE OF CONTENTS TABLE OF CONTENTS... I APPENDICES... III LIST OF EXHIBITS... V LIST OF TABLES... VII LIST OF ABBREVIATED TERMS...
 TABLE OF CONTENTS TABLE OF CONTENTS... I APPENDICES... III LIST OF EXHIBITS... V LIST OF TABLES... VII LIST OF ABBREVIATED TERMS... IX 1 INTRODUCTION... 1 1.1 Project Overview... 1 1.2 Analysis Scenarios...
Transportation Impact Study for Abington Terrace
 Transportation Impact Study for Abington Terrace Abington Township, Montgomery County, PA Sandy A. Koza, P.E., PTOE PA PE License Number PE059911 Prepared by McMahon Associates, Inc. 425 Commerce Drive,
Traffic Circulation Study for Neighborhood Southwest of Mockingbird Lane and Airline Road, Highland Park, Texas
 ARIZONA TEXAS NEW MEXICO OKLAHOMA February 13, 2015 Mr. Meran Dadgostar P.E., R.S. Town of Highland Park 4700 Drexel Dr. Highland Park, Texas 75205 Re: Traffic Circulation Study for Neighborhood Southwest
EAST AND SOUTH STREET CITY OF ANAHEIM, CALIFORNIA
 T R A F F I C I M P A C T A N A LY S I S EAST AND SOUTH STREET CITY OF ANAHEIM, CALIFORNIA April 217 T R A F F I C I M P A C T A N A LY S I S EAST AND SOUTH STREET CITY OF ANAHEIM, CALIFORNIA Submitted
APPENDIX H EXISTING TRAFFIC CONDITIONS ANALYSIS
 APPENDIX H EXISTING TRAFFIC CONDITIONS ANALYSIS MEMO : Peter Steacy, P.Eng. Date: December 3, 2014 : Ian Borsuk, P.Eng. Job No.: 3414015-000 Subject: City of Ottawa O-Train Extension Planning & EA Study
Introduction Roundabouts are an increasingly popular alternative to traffic signals for intersection control in the United States. Roundabouts have a
 HIGH-CAPACITY ROUNDABOUT INTERSECTION ANALYSIS: GOING AROUND IN CIRCLES David Stanek, PE and Ronald T. Milam, AICP Abstract. Roundabouts have become increasingly popular in recent years as an innovative
Roundabout Model Calibration Issues and a Case Study
 Roundabout Model Calibration Issues and a Case Study TRB National Roundabout Conference Vail, Colorado, USA, 22-25 May 2005 Pictures modified to show driving on the right-hand side of the road Rahmi Akçelik
Preliminary Transportation Analysis
 Preliminary Transportation Analysis Goals of a Robust, Multimodal Transportation Network Safe Accessible/Connected Efficient Comfortable Context-Sensitive Motor Vehicle: Continue to analyze the data to
Acland Street, St Kilda
 Acland Street, St Kilda Traffic Redistribution Client: Yarra Trams Project No. 122531 Draft_4 Report 16/09/13 Suite 1, 1 st Floor 132 Upper Heidelberg Road Ivanhoe Vic 3079 PO Box 417 Ivanhoe Vic 3079
Table of Contents FIGURES TABLES APPENDICES. Traffic Impact Study Hudson Street Parking Garage MC Project No.: A Table of Contents
 Traffic Impact Study Hudson Street Parking Garage MC Project No.: 151714A Table of Contents Table of Contents I. INTRODUCTION... 2 II. EXISTING CONDITIONS... 5 III. 215 EXISTING TRAFFIC CONDITIONS... 6
10 SHERFORD Town Code
 Key Fixes (Ref: Masterplan Book, section 4a. Land Use Budget and Key Fixes ) The Town Plan designs and allocates buildings, streets and spaces as accurately as possible in the understandable absence of
Traffic Signal Design
 Traffic Signal Design Instructor: S. M. Mahdi Amiripour m.amiripour@gmail.com 2 Introduction Intersection is an area shared by two or more roads Designated for the vehicles to turn to different directions
COUNTY ROAD 22 HORSESHOE VALLEY ROAD. Municipal Class Environmental Assessment. simcoe.ca
 OCTOBER 2014 Municipal Class Environmental Assessment COUNTY ROAD 22 HORSESHOE VALLEY ROAD Project A Truck Climbing Lanes Project B Intersection Improvements simcoe.ca CORPORATE COMMUNICATIONS DEPARTMENT
Enclosure 1. Crimson Drive Traffic Safety and Calming Review Report
 Enclosure 1 Crimson Drive Traffic Safety and Calming Review Report Prepared by: Tahir Hameed, P.Eng. Traffic Safety Engineer Planning Engineering and Safety Transportation Planning and Engineering Date:
Glenn Avenue Corridor Traffic Operational Evaluation
 Glenn Avenue Corridor Traffic Operational Evaluation PREPARED FOR: THE CITY OF AUBURN PREPARED BY: DECEMBER 2007 Glenn Avenue Corridor Study--Auburn, Alabama TABLE OF CONTENTS Introduction... 1 Background
South Albion-Bolton Community Plan North Hill Supermarket Transportation Study Part B: Evaluation of Alternatives
 Community Plan North Hill Supermarket Transportation Study Part B: Evaluation of Alternatives Prepared for: The Town of Caledon August 9 Transportation Solutions Ltd. 43 Forest Road Cambridge, ON N1S 3B4
Appendix B: Forecasting and Traffic Operations Analysis Framework Document
 Existing Conditions Report - Appendix Appendix B: Forecasting and Traffic Operations Analysis Framework Document This document defines the methodology and assumptions that will be used in the traffic forecasting
Alternative Intersection Analysis Using SIDRA INTERSECTION
 Alternative Intersection Analysis Using SIDRA INTERSECTION ITEANZ Innovative Intersections Seminar Melbourne, 5 Nov 2015 Rahmi Akçelik and Mark Besley SIDRA SOLUTIONS Presenter: David Nash TRAFFINITY sidrasolutions.com
ALLEY 24 TRAFFIC STUDY
 ALLEY 24 TRAFFIC STUDY in City of Frostburg, Maryland January 2013 3566 Teays Valley Road Hurricane, WV Office: (304) 397-5508 www.denniscorporation.com Alley 24 Traffic Study January 2013 Frostburg, Maryland
SELECTED ROADWAY CAPACITY ANALYSIS
 CHAPTERFOUR SELECTED ROADWAY CAPACITY ANALYSIS 4.1 SELECTED ROADWAY CAPACITY ANALYSIS Introduction Capacity analysis was performed on six selected roadways within the Dearborn County study area using the
MEDICAL/OFFICE BUILDING 1637 BANK STREET OTTAWA, ONTARIO TRANSPORTATION OVERVIEW. Prepared for:
 MEDICAL/OFFICE BUILDING 1637 BANK STREET OTTAWA, ONTARIO TRANSPORTATION OVERVIEW Prepared for: 2434984 Ontario Inc. 13-5510 Canotek Road Ottawa, Ontario K1J 9J5 June 4, 2015 115-613 Report_2.doc D. J.
Transport Assessment. Curtis Street Plan Change
 Transport Assessment Curtis Street Plan Change Transport Assessment for Curtis Street Plan Change i Contents 1. Introduction... 1 2. Existing Conditions... 2 2.1 Location... 2 2.2 Study Area... 3 2.3
Abrams Associates. Transportation Impact Analysis. City of Rocklin. Prepared for: David Mohlenbrok City of Rocklin 4081 Alvis Court Rocklin, CA 95677
 Transportation Impact Analysis Sierra College Boulevard Commercial Project City of Rocklin Prepared for: David Mohlenbrok City of Rocklin 081 Alvis Court Rocklin, CA 95677 Prepared by: 1875 Olympic Boulevard,
City of Prince Albert Statement of POLICY and PROCEDURE. Department: Public Works Policy No. 66. Section: Transportation Issued: July 14, 2014
 Page: 1 of 8 1 POLICY 1.01 The City shall follow all of the specifications in the Manual of Uniform Traffic Control Devices for Canada, prepared by the National Committee of Uniform Traffic Control, and
TRAFFIC ASSESSMENT River Edge Colorado
 TRAFFIC ASSESSMENT River Edge Colorado Submitted by: Fehr & Peers 621 17th Street, Ste. 231 Denver, CO 8293 (33) 296-43 December, 21 App. M-2 Traffic Assessment River Edge Colorado December 21 TABLE OF
1 Introduction. COPY John Denney FROM Chris Morahan DATE 2 November 2015 FILE 6-XT177.62/305DC SUBJECT Stanley Street Network Traffic Modelling
 Opus International Consultants Ltd Christchurch Office 20 Moorhouse Avenue PO Box 1482, Christchurch Mail Centre, Christchurch 8140 New Zealand TO Reece Gibson COPY John Denney FROM Chris Morahan DATE
Shockoe Bottom Preliminary Traffic and Parking Analysis
 Shockoe Bottom Preliminary Traffic and Parking Analysis Richmond, Virginia August 14, 2013 Prepared For City of Richmond Department of Public Works Prepared By 1001 Boulders Pkwy Suite 300, Richmond, VA
Alternative Intersection Analysis Using SIDRA INTERSECTION
 Alternative Intersection Analysis Using SIDRA INTERSECTION ITEANZ Innovative Intersections Seminar Melbourne, 5 Nov 2015 Rahmi Akçelik and Mark Besley sidrasolutions.com youtube.com/sidrasolutions Alternative
A Traffic Operations Method for Assessing Automobile and Bicycle Shared Roadways
 A Traffic Operations Method for Assessing Automobile and Bicycle Shared Roadways A Thesis Proposal By James A. Robertson Submitted to the Office of Graduate Studies Texas A&M University in partial fulfillment
Include autoturn exhibits of WB-67 trucks at each roundabout.
 1 Along the through path, the desired relationship is R1>R2
Traffic Impact Study Little Egypt Road Development Denver, North Carolina June 2017
 Traffic Impact Study Little Egypt Road Development Denver, North arolina June 2017 N. Little Egypt Road DQ\ QDQFLQJ VDOHV RU RWKHU SHUIRUPDQFH EDVHG FULWHULD Proposed Site Driveways Site Driveway 1 TRAFFI
University Hill Transportation Study Technical Memorandum Alternatives Modeling and Analysis May 2007
 Technical Memorandum May 2007 Syracuse Metropolitan Transportation Council Edwards and Kelcey with Wallace Roberts and Todd Alta Planning and Design CONTENTS SECTION ONE- INTRODUCTION...1 SECTION TWO-
BLOSSOM AT PICKENS SIGNALIZED INTERSECTION IMPROVEMENT STUDY
 BLOSSOM AT PICKENS SIGNALIZED INTERSECTION IMPROVEMENT STUDY Class Project Report for ECIV 542 Traffic Engineering Submitted by Omor Sharif Muchun Song Narges Kaveshgar Quyen Pham Chih-Yao Lin Submission
Capital Region Council of Governments
 March 23, 2018 Capital Region Council of Governments PROJECT CONCEPT REPORT Realignment of Swamp and Northfield Road s approaches to Route 44 (Boston Turnpike) Town of Coventry SUMMARY: The Town of Coventry
CarMax Auto Superstore/ Reconditioning Center #6002 Murrieta, California
 CarMax Auto Superstore/ Reconditioning Center #6002 Murrieta, California TUSTIN 17782 17th Street Suite 200 Tustin, CA 92780-1947 714.665.4500 Fax: 714.665.4501 LOS ANGELES 145 S. Spring Street Suite 120
ROUNDABOUT MODEL COMPARISON TABLE
 Akcelik & Associates Pty Ltd PO Box 1075G, Greythorn, Vic 3104 AUSTRALIA info@sidrasolutions.com Management Systems Registered to ISO 9001 ABN 79 088 889 687 ROUNDABOUT MODEL COMPARISON TABLE Prepared
PROPOSED RESIDENTIAL SUBDIVISION
 PROPOSED RESIDENTIAL SUBDIVISION PART OF TARNEIT ROAD & 1121 DOHERTYS ROAD, TARNEIT Prepared For: TCG (RM) Developments Pty Ltd MARCH 2014 OUR REF: 16740R#1 PROPOSED RESIDENTIAL SUBDIVISION PART OF TARNEIT