2012 U. S. Catfish Database
|
|
|
- Imogene Haynes
- 5 years ago
- Views:
Transcription


1 2012 U. S. Catfish Database By Dr. Terry Hanson Auburn University, Department of Fisheries and Allied Aquacultures and Mr. Dave Sites Mississippi State University, Department of Agricultural Economics March 2013 Fisheries and Allied Aquacultures Department Series No. 6 Alabama Agricultural Experiment Station William Batchelor, Director Auburn University Auburn, Alabama Sources: USDA National Agricultural Statistics Service (NASS) Mississippi Agricultural Statistics Service (MASS)
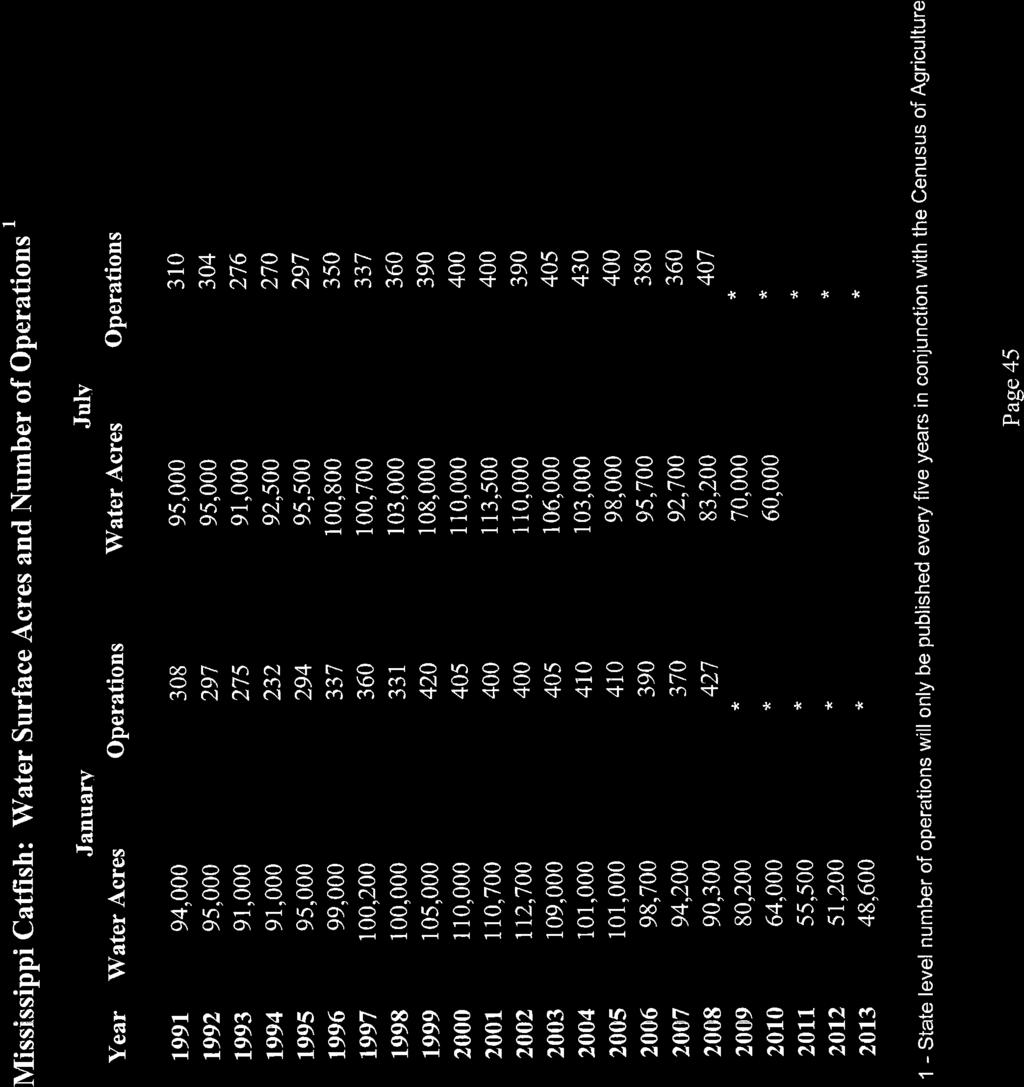
2 2012 U.S. Catfish Database Table of Contents Table of Contents U.S. Farm-Raised Catfish Industry Highlights U.S. Farm-Raised Catfish Industry Review and 2012 Outlook Notes from USDA NASS Reports Page # ii v vi xxiv U.S. Farm Level Catfish Data Round Weight Processed by U.S. Processors (Foodsize Only) 1 Total U.S. Catfish Sales 3 (Foodsize, Broodstock, Stockers, Fry and Fingerlings) Total U.S. and MS Foodsize Catfish Sales 5 Number of U.S. Catfish Operations 8 Number of Catfish Operations in AL, AR, LA and MS 9 Catfish Water Surface Acres in U.S. 11 Catfish Water Surface Acres in AL, AR, LA and MS 12 Catfish Water Acres Being Renovated in U.S. 14 New Water Acres Under Construction in U.S. 16 New Water Acres Under Construction in AL, AR, LA and MS 17 Catfish Acres Out of Production in U.S. 19 Catfish Acres Used for Broodfish in U.S. 21 Catfish Acres Used for Broodfish in AL, AR, LA, MS 22 Catfish Acres Used for Fingerlings in AL, AR, LA, MS 24 Price Paid to Producers of Foodsize Catfish in U.S % and 28% Protein Feed Prices Paid by Producers 28 Catfish Feed Delivered for Foodsize Fish 32 Catfish Feed Delivered for Fingerlings and Broodfish 34 U.S. Catfish Inventories by Size Category 36 Mississippi Farm Level Catfish Data MS Catfish Water Surface Acres and Number of Operations 44 MS Catfish Water Surface Acres by County 46 MS Catfish Sales by Size Category 47 MS Catfish Inventories, by Size Category 55 ii
3 Imports of Catfish to the U.S. 57 U.S. Catfish Processing Level Data Round Weight Processed in U.S. Catfish Industry 59 Fresh Catfish Processing Data Fresh Catfish by Product Form Pounds Sold 61 Prices 62 Catfish Revenue 63 Total Fresh Catfish Quantity Sold 64 Average Price 65 Total Revenue 66 Fresh Whole Form Quantity Sold 67 Average Price 68 Total Revenue 69 Fresh Fillet Form Quantity Sold 70 Average Price 71 Total Revenue 72 Fresh Other Form Quantity Sold 73 Average Price 74 Total Revenue 75 Frozen Catfish Processing Data Frozen Catfish by Product Form Pounds Sold 76 Prices 77 Catfish Revenue 78 Total Frozen Catfish Quantity Sold 79 Average Price 80 Total Revenue 81 Frozen Whole Form Quantity Sold 82 Average Price 83 Total Revenue 84 iii
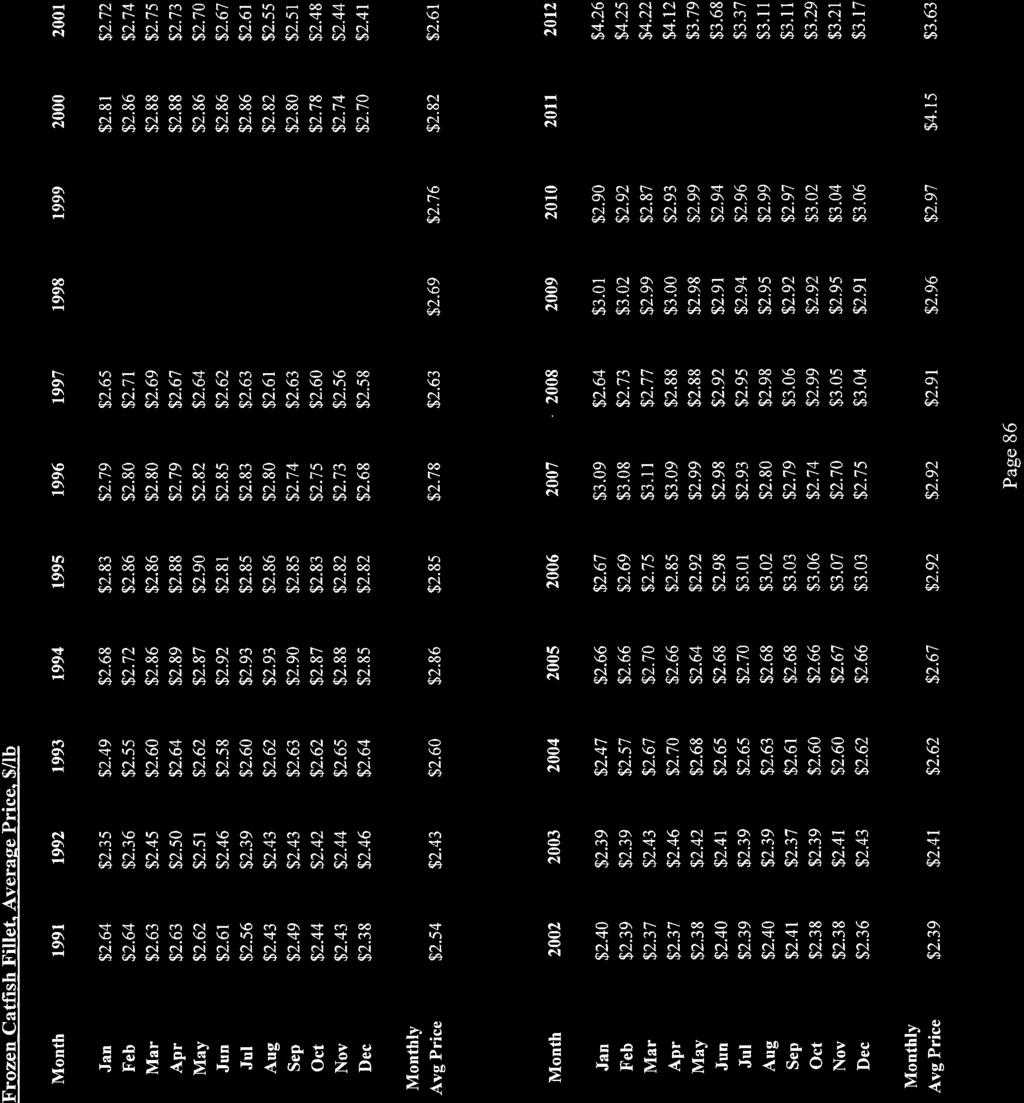
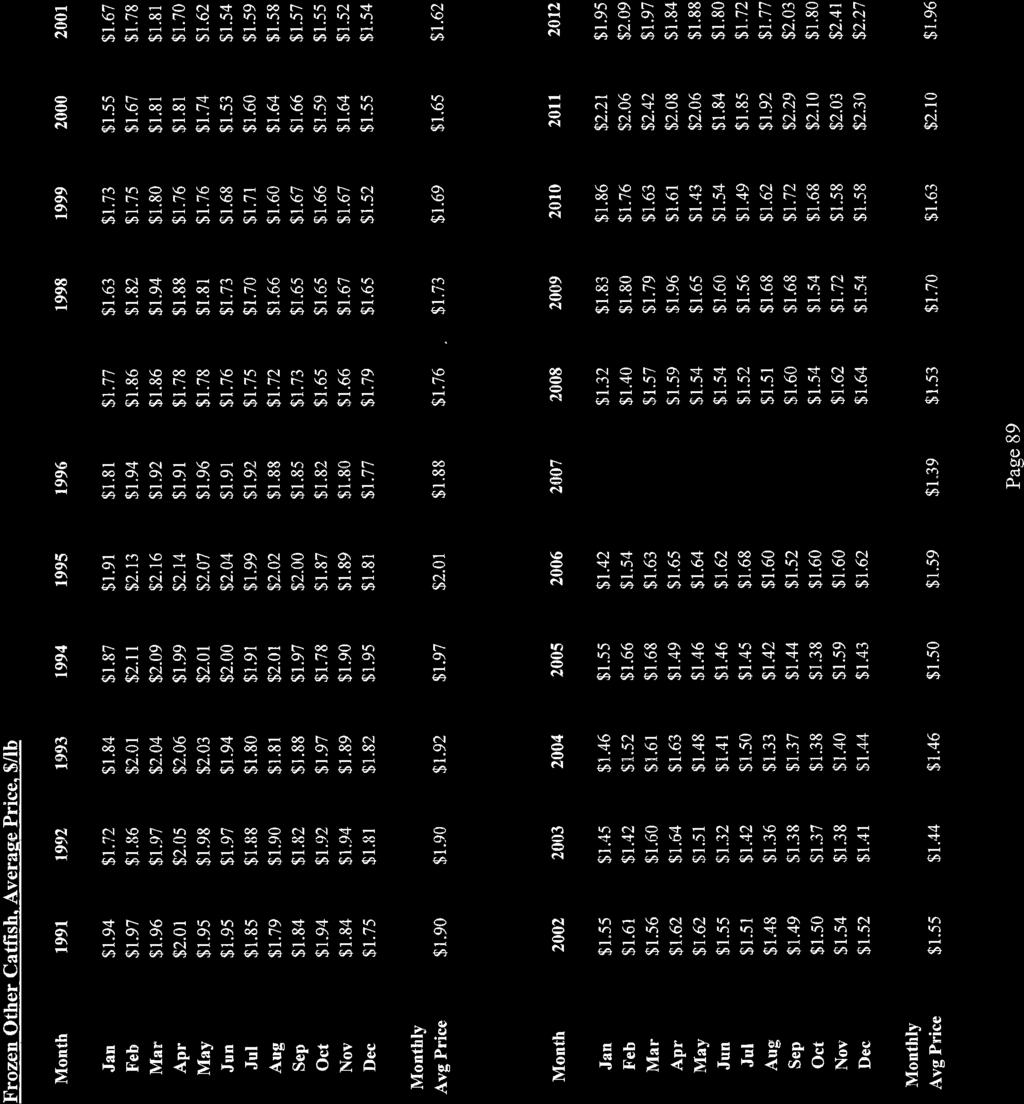
4 Frozen Fillet Form Quantity Sold 85 Average Price 86 Total Revenue 87 Frozen Other Form Quantity Sold 88 Average Price 89 Total Revenue 90 Total (Fresh and Frozen) Catfish Processing Data Total (Fresh and Frozen) Catfish Pounds Sold 91 Catfish Price 93 Processor s Revenue 95 Fresh and Frozen Whole Form Quantity Sold 97 Average Price 99 Total Revenue 101 Fresh and Frozen Fillet Form Quantity Sold 103 Average Price 105 Total Revenue 107 Fresh and Frozen Other Form Quantity Sold 109 Average Price 111 Total Revenue 113 Processor Total Ending Inventory Fresh Catfish Ending Inventory All Products 115 Whole Products 116 Fillet Products 117 Other Products 118 Frozen Catfish Ending Inventory All Products 119 Whole Products 120 Fillet Products 121 Other Products 122 Total Fresh and Frozen, Ending Inventory 123 iv
5 U.S. Farm-Raised Catfish Industry 2012 Review and 2013 Outlook Highlights U.S. farm-raised catfish was seventh in the 2011 Top 10 fish and seafood consumption list for Americans, who consumed 15.0 pounds of fish and seafood per year in total and 0.56 pound per year of catfish. The U.S. catfish industry has been on a contracting course since a high mark in 2003 when 662 million pounds of round weight catfish were processed. In 2012, 300 million pounds were processed, down 34 million pounds (-10%) from 334 million pounds processed in 2011; and a 55% decrease since the 2003 peak. Imports of frozen catfish fillets increased by 34 million pounds (+14%) to 237 million pounds in 2012; and imports now account for 78% of all U.S. sales of frozen catfish fillet product. There were 83,020 acres of water in U.S. catfish production in January 2013, down 8% from Current production acreage for the top three catfish producing states, Alabama, Arkansas and Mississippi was down 4,400 acres (-6%) to 75,000 acres. The number of U.S. catfish operations decreased by 94 (-13%) from January 2012 to January 2013 and is now at 624. The average price received by producers was $0.967 per pound in 2012, down $0.202 per pound from the 2011 average price of $1.177 per pound. In 2012 there was a $0.455 per pound difference between high (January, $1.248 per pound) and low (September, $0.793 per pound) pond bank prices received during the year. Total producer income in 2012 was $292 million, a $101 million decrease (-26%) from the 2011 total producer income of $393 million. This was due to the reduction in processing volume and the lower average price received by producers. (Note: 2011 had a record high price received by producers at $1.177/lb average for the year). In-pond inventories of foodsize fish in January 2013 were down 5.4% from January 2012 levels. Stocker inventory was down 27% from Jan levels. Fingerling weight (and number) inventory was down 26% and 12% respectively from January 2012 levels. Broodfish pounds were up 4%. Catfish feed prices (32% protein) in 2012 averaged $469/ton, up $48/ton (+12%) over the 2011 average feed price of $421/ton. Note: 2012 feed prices peaked in August ($562/ton) while the lowest feed price in 2012 occurred in January and February ($401/ton). v
6
7 U.S. Farm-Raised Catfish Industry 2012 Review and 2013 Outlook By Dr. Terry Hanson Auburn University, Department of Fisheries and Allied Aquacultures and Mr. Dave Sites Mississippi State University, Department of Agricultural Economics This 2012 review and the 2013 outlook reports on recent trends in the U.S. catfish industry were derived primarily from NASS reports; Catfish Processing, Catfish Production, and Catfish Feed Deliveries reports. As of March 12, 2013, NASS (Agricultural Statistics Board of the U.S. Department of Agriculture, National Agricultural Statistics Service) announced the suspension of certain statistical estimates and reports due to sequestration, including all Catfish and Trout Reports including Catfish Feed Deliveries and Catfish Processing reports (for information contact Sue King at (202) ). Complete data for the contents of this introduction are contained in the catfish database tables which follow this report. Sections in this introduction provide information on American s fish and seafood consumption patterns, imports of catfish-like products, U.S. catfish industry statistics on processing, inventory of fresh/frozen products, U.S. farm-raised catfish production statistics on water acreage, live fish price, inventories, feed price, and an outlook for U.S. Fish and Seafood Consumption Consumers ultimately decide what food products they will purchase based on their likes and dislikes. Consumers have many fish/seafood choices and elect to purchase these products based on product attributes they prefer, such as price, taste, flavor, texture, enjoyment, other protein options, etc. Thus, it is important to understand American fish and seafood consumption patterns and where domestically produced farm-raised catfish fits among consumed fish and shellfish species, and to understand how consumer trends may influence 2013 purchases of domestically produced channel catfish. U.S. per capita fish and seafood consumption was lower in 2011 than in 2010, though the long-term trend is still rising, Figure 1. There have been some changes in American s species preferences over time, Figure 2. Shrimp became the number one consumed seafood product in the U.S. in 2002 and has stayed in this position ever since. Tuna, primarily canned tuna, dropped to second place and has stayed at this position. Salmon replaced pollock as the number three preferred product in 2003 and has remained there. Tilapia was surpassed by pollock, dropping from fourth place to fifth place. Pangasius rose to sixth place. vi
8 U.S. farm-raised catfish was seventh in the 2011 Top 10 fish and seafood consumption list for Americans, who consumed 15.0 pounds of fish and seafood per year in total and 0.56 pound per year of catfish. Figure 1. U.S. Per Capita Consumption of Fish and Shellfish Products. Pounds Per Person Per Year Figure 2. U.S. Top Ten Seafood Consumed, per capita consumption Tuna Shrimp (4.00) Shrimp (4.10) Shrimp (4.0) 1. Shrimp (4.2) 2. Shrimp (3.50) Tuna Tuna Tuna (2.7) 2. Tuna (2.6) 3. Pollock Salmon Salmon Salmon (2.0) 3. Salmon (1.952) 4. Salmon Pollock Pollock Tilapia (1.45) 4. Pollock (1.312) 5. Catfish (0.996) Catfish (1.137) Tilapia (1.208) Pollock (1.2) 5. Tilapia (1.287) 6. Cod Cod Catfish (0.849) Catfish (0.8) 6. Pangasius (0.628) 7. Clams Crabs Crabs Crabs (0.57) 7. Catfish (0.559) 8. Crabs Clams Cod Cod (0.46) 8. Crab (0.518) 9. Flatfish Tilapia (0.525) Clams Pangasius (0.41) 9. Cod (0.501) 10. Scallops Scallops Pangasius (0.356) Clams (0.34) 10. Clams (0.331) vii
9 2. Imports Imports of frozen catfish fillets increased by 34 million pounds (+14%) to 237 million pounds in 2012; and imports now account for 78% of all U.S. sales of frozen catfish fillet product. Figure 3 shows the dramatic increase in imports of frozen, boneless catfish fillet products (Ictalurus, Pangasius and Siluriformes), and: - in 2005 the import quantity was 30 million pounds of frozen fillets; - in 2006 the import quantity increased to 75 million pounds (+ 149 %); - in 2007 the import quantity increased to 85 million pounds (+ 13 %); - in 2008 the import quantity increased to 102 million pounds (+ 21 %); - in 2009 the import quantity increased to 129 million pounds (+ 26 %); - in 2010 the import quantity increased to 138 million pounds (+ 6 %); - in 2011 the import quantity increased to 204 million pounds (+ 48 %); and - in 2012 the import quantity increased to 237 million pounds (+ 14%). In total, the U.S. catfish industry processed and sold 124 million pounds of frozen catfish fillets in 2005, 118 million pounds in 2006, 104 million pounds in 2007, 103 million pounds in 2008, 96 million pounds in 2009, 98 million pounds in 2010, 70 million pounds in 2011, and 68 million pounds of frozen fillet product in 2012, Figure 4. Figure 3. Imported Catfish, , ,000 1,000 pounds 150, ,000 50, viii
10 The quantity of imported frozen catfish fillets sold in the U.S. was equal to the quantity of U.S. processed frozen catfish-like fillet products sold as recently as Since then, the sales percentage of this product form from the U.S. processing industry has continued to decline. Domestically produced frozen catfish fillet products made up 22% of the entire quantity sold in the U.S. in 2012 (78% was imported), Figure 4. This is remarkable, given that in 2005 there were 124 million pounds of U.S. processed frozen catfish fillet product sold in U.S. and only 30 million pounds of imported catfish-like frozen fillet product sold in the U.S. From 2005 to 2012, imported frozen catfish-like fillet product has increased from 20% to 78% of the market share for frozen catfish and catfish-like fillet products in the U.S. (U.S. percentage of sales have declined from 80% to 22% during this same period). Much of this decline relates to high catfish feed prices, due primarily to increasing and very high soybean and corn prices, the main ingredients of catfish feed. Figure 4. Quantity of U.S. Catfish and Imported Catfish-like Frozen Fillets Sold in the U.S. (U.S. percentages of frozen fillets sold are in boxes), , ,000 26% 22% 1,000 pounds 150, ,000 50,000 80% 61% 55% 50% 43% 42% US Processed Frozen Fillets Imported Fillets ix
11 3. U.S. Catfish Processing and Frozen/Fresh Inventory U.S. catfish processed and inventoried fresh and frozen fish (and in-pond inventories discussed later) provide a view of what was in demand and supplied to the U.S. market place. The U.S. catfish industry has been in decline since a high mark in 2003 when 662 million pounds of round weight catfish were processed. In 2012, 300 million pounds were processed, down 34 million pounds (-10%) from 334 million. From 2003 s high to the 2012 low, there has been a 361 million pound decrease (-55%) in U.S. farm-raised round weight catfish processed, Figure 5. During the 2000 to 2012 period frozen catfish fillet product sales have declined by 52 million pounds (-44%), while frozen Other product sales have declined by 18 million pounds (-40%) and frozen whole catfish product sales have declined by 7 million pounds (-53%), Figure 6. During the same 2000 to 2012 period fresh catfish fillet product sales have declined by 31 million pounds (-52%), while fresh Other product sales have declined by 11 million pounds (-65%) and fresh whole catfish product sales have declined by 17 million pounds (-41%), Figure 7. Figure 5. Round Weight Processed by U.S. Processors *, , , ,000 1,000 pounds 400, , , , *Foodsize Catfish Only x
12 Figure 6. U.S. Processed Weight of Frozen Catfish Products, ,000 1,000 pounds 1,000 pounds 120, ,000 80,000 60,000 40,000 20, Frozen Whole Qty Frozen Fillet Qty Frozen Other Qty Figure 7. U.S. Processed Weight of Fresh Catfish Products, , , ,000 80,000 60,000 40,000 20, Fresh Whole Qty Fresh Fillet Qty Fresh Other Qty Fresh product (on ice) inventory held at processing plant refrigerated warehouses is small compared to frozen inventory quantities. In 2009 there was an average monthly inventory of approximately 701,000 pounds of fresh whole, fillet and other product forms on hand. This increased to 777,000 pounds in 2010, then decreased to 514,000 pounds in 2011, and increased to 530,000 pounds in In contrast, the average monthly 2009 frozen inventory of whole, fillet and other products was approximately 11.3 million pounds that decreased to 10.7 million pounds in 2010, decreased to 7.7 million pounds in 2011, and increased to 10.4 million pounds in Of these frozen forms, the fillet form dominates. There was a monthly inventory of frozen fillets averaging xi
13 8.6 million pounds in 2009, 7.2 million pounds in 2010, 4.8 million pounds in 2011, and 8.5 million pounds in Clearly, processor inventory of catfish products was lower in 2011 but 2012 was similar to 2009 and U.S Farm-raised Catfish Production Sales of domestic catfish products (foodfish, broodfish, stockers, fry, and fingerlings) in 2012 were approximately $341 million, down 20% from 2011 ($423 million) sales. This is understandable as production acreage and quantity has decreased significantly over the past several years, Figure 8. U.S. farm-raised catfish production acres have declined to 83,020 acres (projected use from January 2013 NASS Catfish Production report) from a 2002 high of 196,760 acres, a 113,740 acre decrease (-58%) in 11 years, Figure 8. Since 2002, Alabama acreage has declined 7,700 acres (-30%), Arkansas acreage has declined 29,800 acres (-78%), Louisiana acreage has declined 11,780 acres (-97%), and Mississippi acreage has declined 62,900 acres (-56%). Escalating catfish feed and fuel costs combined with volatile annual prices to the producers, weakened demand, and lost market share for final products have made profits very difficult in the U.S. catfish industry during the 2002 to 2012 period. This has caused many producers in Arkansas, Louisiana and Mississippi delta regions to convert their pond acreage to corn and soybean. Producers income, that is the average annual price received across the whole industry by producers multiplied by total round weight processed, was $101 million (-26%) less in 2012 ($292 million) than in 2011 ($393 million); and few producers in the U.S. catfish industry saw any profit in Figure 8. Water Acreage Used in U.S. Catfish Production, Jan Jan Acreage 200, , ,000 50, Arkansas Louisiana Alabama Mississippi xii
14 5. Fish Price and In-pond Fish Inventory The pond bank price paid to catfish producers averaged $0.767 per pound in 2007, increased to $0.780 per pound in 2008, decreased to $0.771 per pound in 2009, increased to $0.802 per pound in 2010, increased to $1.18 per pound in 2011, and decreased to $0.97 per pound in It is noteworthy that 2011 prices to producers were the highest they had ever been and were reflecting a severe shortage of fish inventory in the ponds at that time, Figures 9 and 10. However, the 2012 price level could not keep up with this high 2011 price. The 2012 price paid to producers averaged $0.967 per pound, down $0.20 per pound, reflecting an uncertain need for fish by U.S. processors in 2012 and low consumer demand. Figure 9. Nominal Prices Paid to Producers by Month, $ per pound Jan Feb Mar Apr May Jun Jul Aug Sep Oct Nov Dec Figure 10. Nominal Prices Paid to U.S. Catfish Producers by month, January 2006 to December $ per pound Jan- 06 Mar- 06 May- 06 Jul- 06 Sep- 06 Nov- 06 Jan- 07 Mar- 07 May- 07 Jul- 07 Sep- 07 Nov- 07 Jan- 08 Mar- 08 May- 08 Jul- 08 Sep- 08 Nov- 08 Jan- 09 Mar- 09 May- 09 Jul- 09 Sep- 09 Nov- 09 Jan- 10 Mar- 10 May- 10 Jul- 10 Sep- 10 Nov- 10 Jan- 11 Mar- 11 May- 11 Jul- 11 Sep- 11 Nov- 11 Jan- 12 Mar- 12 May- 12 Jul- 12 Sep- 12 Nov- 12 xiii
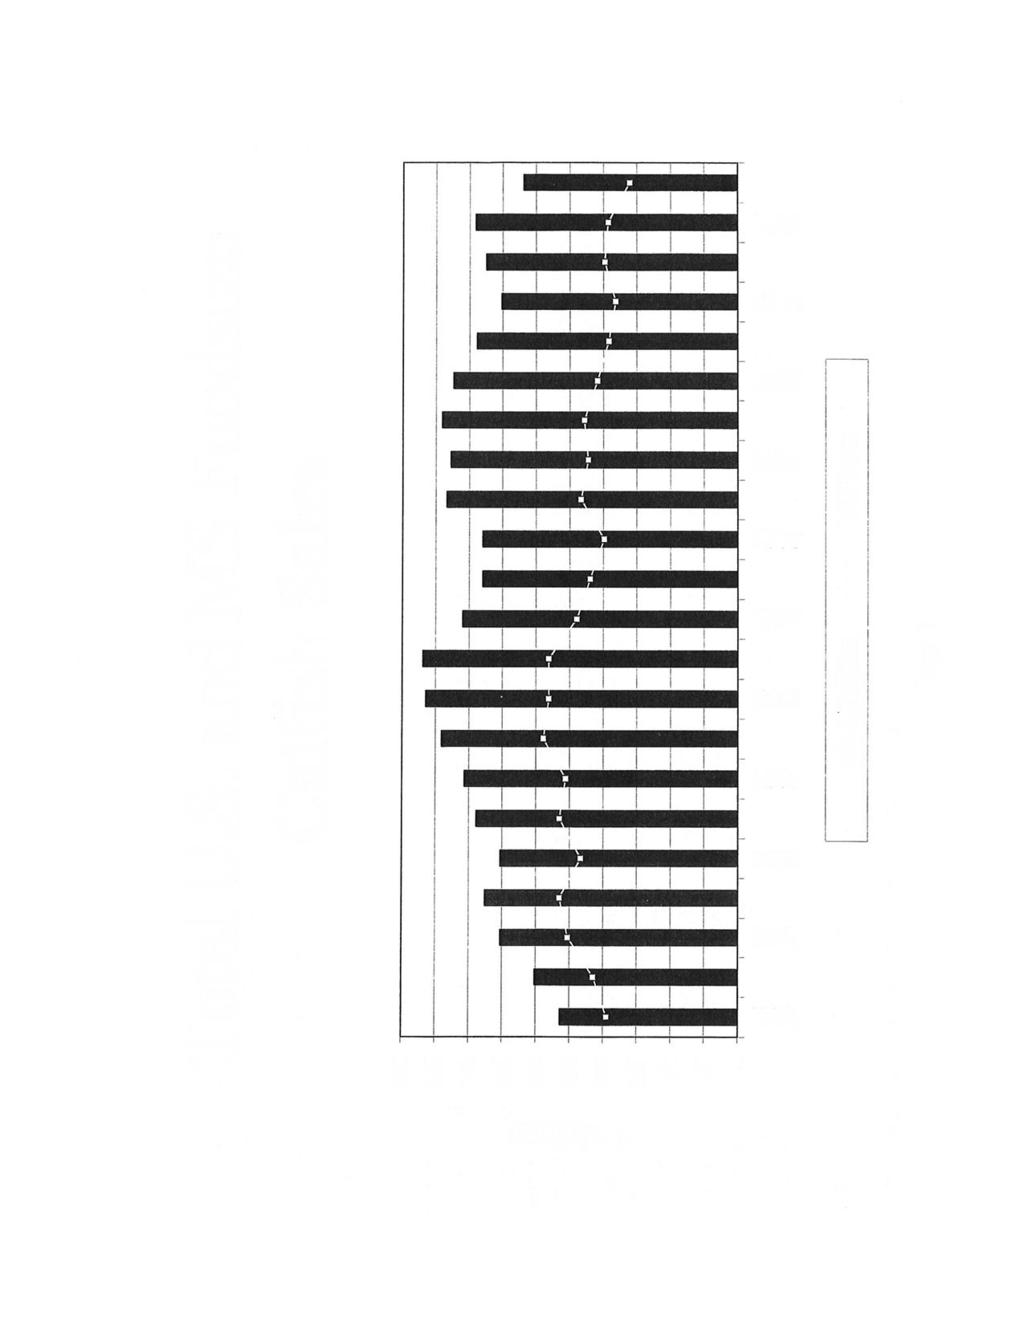
15 In-pond fish inventory Round weight processed catfish was 300 million pounds in 2012, down 34 million pounds from the 2011 level (334 million). If the 2012 quantity is to be processed in 2013, the fish will have to come from foodsize catfish in-pond inventories for the immediate term (and processor s frozen stored product discussed earlier), from stockers to supply demand in late 2013 and into early to mid-2014, and from fingerling inventory to supply demand in late 2014 and early to mid The January 2013 foodsize catfish in-pond inventories (small, medium and large sizes) were reported at 233 million pounds, down 5% from January 2011, Figure 11. Figure 11. U.S. Catfish Foodsize In-pond Inventory, pounds. 600, ,000 1,000 pounds 400, , , ,000 0 Jan Jan Jan Jan Jan Jan Jan Jan Jan Jan The stocker size catfish will be harvestable in mid- to late The inventory of stocker sized fish in January 2013 was approximately 69 million pounds, Figure 12, down 27% from January 2012 levels. xiv
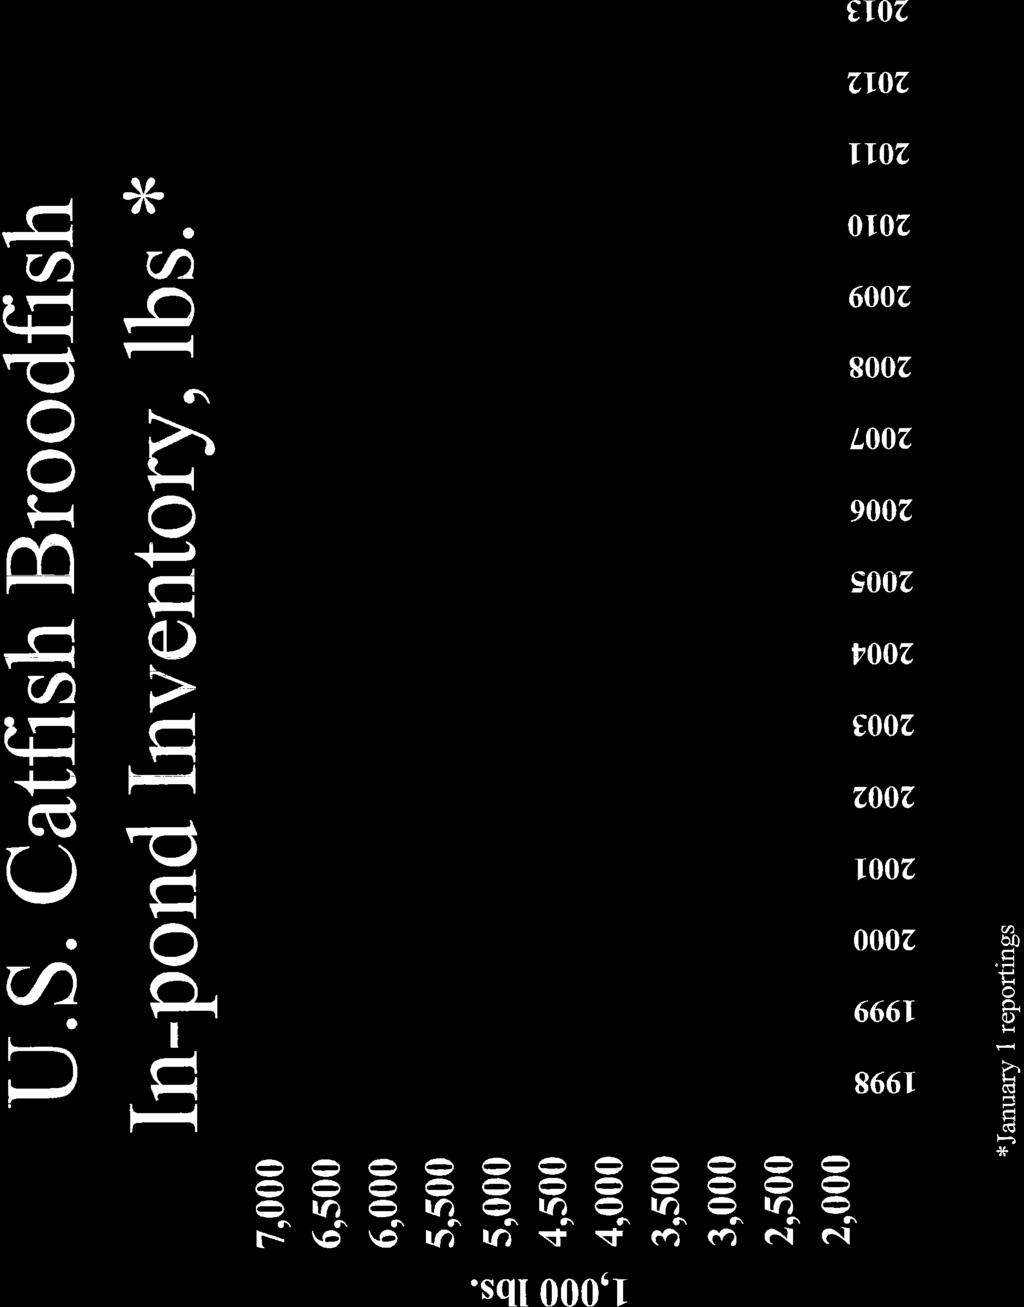
16 Figure 12. U.S. Catfish Stockers In-pond Inventory, pounds. 1,000 pounds 180, , , , ,000 80,000 60,000 40,000 20, The reported fingerling quantity and numbers available from the January 2013 report show decreases of 26% and 12% respectively, but the trend shows a bottoming out of fingerling supply, Figures 13a and 13b. Figure 13a. U.S. Catfish Fingerlings in Inventory, January of each year, pounds. 1,000 pounds 40,000 35,000 30,000 25,000 20,000 15,000 10,000 5, xv
17 Figure 13b. U.S. Catfish Fingerlings in Inventory, January of each year, number Millions Many catfish production operations have gone out of business. There are now 624 producers, down 94 operations from a year earlier (-13%), Figure 14. Low prices and prior years of reduced production and processing have led to hatchery operators reducing their number of fingerlings and broodstock in stock. However, broodstock pounds in inventory in January 2013 were up 4% over January 2012 levels, indicating a longer term potential for more fingerling supplies if the industry demands them. Figure 14. U.S. Catfish Broodfish In-pond Inventory, pounds. 6,000 5,000 1,000 pounds 4,000 3,000 2,000 1, xvi
18 Thus, from an in-pond inventories perspective, there will be enough foodsize fish and advanced stockers in 2013 for processing quantities equaling the 2012 round weight processing quantity. For the future, the increased number of broodstock on hand will provide the potential for more fingerlings in mid-2013 to increase foodsize fish availability for very late 2014 and early The fish shortage of 2011 was unfortunate as seafood buyers turned to imported white fish as substitutes to meet their needs. This did lead to further decreases in market share for U.S. catfish processors and reduced the quantity required from U.S. catfish producers. Thus, the progress of the industry in 2013 will be critical in knowing the long-term future of the U.S. farm-raised catfish industry. 6. Feed Price The feed price trend has continued to increase from 2001 onward (Figure 15 from 2006 through 2012). In 2012 catfish feed prices peaked at never-before-seen levels in the U.S. catfish industry, with producers paying an average of $469 per ton, up $48 per ton (+12%) from the 2011 annual average price of $421 per ton for 32% crude protein floating feed. Note that this increase is in addition to a feed price increase of $67 per ton (+19%) in Though the average price was $469 per ton for 2012, the price was greater than $500 per ton during August, September and October, Figure 16. High catfish feed component prices for corn and soybean meal have pushed the catfish feed price higher in the last five years, and with expected high corn and soybean prices in 2013 this trend is expected to continue. Additionally, acreage battles with rice and cotton are occurring and could further increase the scarcity of corn and soybeans and elevate their prices. There may be some relief on these commodity prices resulting from corn acreage expansion and possibly better yields in the U.S., but these commodity price levels also depend on crop harvests in Argentina and Brazil. In 2013 it is estimated that Brazil will produce a record soybean crop of 83.5 million tons, surpassing the U.S. as the world's largest producer of soybeans. Global soybean production was increased to million tons as Brazil's production prospects more than offset Argentina's depleting weather and production conditions. Global corn production for 2012/13 was increased by 2.1 million tons with increases in Brazil, Mexico, India, and Ukraine. South American weather and production estimates in 2013 will need to be followed throughout the year as these harvests are key indicators of price movement, up or down, in these two crops and will translate into catfish feed price direction as well. xvii
19 Figure 15. Prices for 28% and 32% Crude Protein, Floating Catfish Feed, January 2006 to December $ per ton Jan- 06 Mar- 06 May- 06 Jul- 06 Sep- 06 Nov- 06 Jan- 07 Mar- 07 May- 07 Jul- 07 Sep- 07 Nov- 07 Jan- 08 Mar- 08 May- 08 Jul- 08 Sep- 08 Nov- 08 Jan- 09 Mar- 09 May- 09 Jul- 09 Sep- 09 Nov- 09 Jan- 10 Mar- 10 May- 10 Jul- 10 Sep- 10 Nov- 10 Jan- 11 Mar- 11 May- 11 Jul- 11 Sep- 11 Nov- 11 Jan- 12 Mar- 12 May- 12 Jul- 12 Sep- 12 Nov % 28% Figure 16. Monthly Prices for 28% and 32% Crude Protein, Floating Catfish Feed in $ per ton Jan Feb Mar Apr May Jun Jul Aug Sep Oct Nov Dec 32% protein feed 28% protein feed xviii
20 The Feed Delivered report from USDA/NASS, Figure 17, graphically depicts and compares the monthly tons of feed delivered to the U.S. catfish industry in 2007, 2009, 2011 and From this figure, it is clear the total feed being fed in the U.S. farmraised catfish industry is declining, and is a clear indicator of overall catfish production declining in the U.S. Additionally, when graphed by state where the feed was delivered, the sharp declines in production occurring in individual states is seen, Figure 18. It is clear that Mississippi and Arkansas had the greatest reduction in feed purchases in 2007 through 2012 compared to the relatively stable, though declining, feed delivery quantities in Alabama for the same period. In 2012, Mississippi fed 218 thousand tons of catfish feed, which is down 38% from 2004 levels (353 thousand tons); while Alabama fed over 151 thousand tons in 2012 which is down 52 thousand tons from 2004 levels (-26%), Figure 18. Arkansas fed 35 thousand tons of feed in 2012, which is down 70% from 2004 levels (117 thousand tons). Meanwhile, Louisiana catfish production has nearly disappeared, with feed fed in 2012 at just over 2.5 thousand tons, down 94% from 2004 levels (39 thousand tons). There have been some increases and decreases in catfish production in other states west and east of the Mississippi River respectively, and combined these states fed 45 thousand tons in 2012, Figure 18, representing 10% of all feed fed in the U.S. catfish industry. Figure 17. Comparison of Total U.S. Catfish Foodfish Feed Delivered between 2007 and , , , ,000 80,000 60,000 40,000 20,000 0 Jan Feb Mar Apr May Jun Jul Aug Sep Oct Nov Dec xix
21 Figure 18. Catfish Foodfish Feed Delivered to each State and Remaining Other States. 450, , , , , , , ,000 50, AL AR LA MS East West 7. Farm-Raised Catfish Outlook for 2013 The long term trend in U.S. consumption of fish and seafood products is increasing, though in the last few years per capita quantity has decreased. Among the most consumed fish and seafood species in the U.S., farm-raised catfish produced in the U.S. is number seven, preceded by shrimp, tuna, salmon, pollock, tilapia, and Pangasius. The final three species in the top ten list are crab, cod, and clam. The surprise in 2011 was Pangasius jumping from ninth place to sixth place and moving ahead of channel catfish. Pangasius consumption is pounds, up from 0.41 pounds consumed annually per capita in This is an imported catfish-like product and is a substitute product to the channel catfish species grown in the U.S. Recent trends show there is an increasing quantity of imported frozen catfish and catfishlike fillets coming into the U.S. This import trend continued and increased dramatically in 2012 to 237 million pounds, an increase of 33 million pounds over 2011 imported quantities (204 million pounds). Imported frozen catfish fillets now account for 78% of all sales of this product form in the U.S. This trend is likely to continue in 2013, due to the relatively high cost of producing and processing of U.S. catfish products. Round weight processing in the U.S. catfish industry was down 10% from 2011 levels, but is expected to be at similar levels in 2013 as seen by equal or slightly lower beginning inventories of fish in ponds and above average beginning of year levels of fish in processor storage. xx
22 The U.S. catfish industry had a good production year until slowed by uncertain buyers for harvested fish that began to be noticeable in mid High feed prices, uncertain sales of produced fish, and a low price to producers by processors signaled to producers to cut back on feeding and restocking. When fish are not routinely harvested in multiple-batch production systems and the ponds are fed a maintenance diet there will be very large size differences of fish in ponds. Fish larger than four pounds receive a reduced price from the processor. Thus, in 2013 there is the possibility that there will be a shortage of smaller, more desirable fish sizes. Because the price received by producers was low compared to operating costs, many producers went out of business in With the high feed price it is possible that there will be a shortage of correctly sized catfish and the price paid to processors may be bid up in The question is whether the increase in price to producers and processors will be accepted by wholesalers, retailers and consumers. Perhaps the improving economy will result in more catfish sales, at a higher price, in the U.S. marketplace. In 2012 the escalating feed and fuel costs were not matched by a sufficiently high pondbank price to result in a profit to producers. The result was a 13% decrease in the number of U.S. catfish operations and an 8% decrease in the number of production acres. Prices received by producers in 2012 averaged $0.967 per pound, 18% less than the 2011 average price ($1.177 per pound). The price producers will receive in 2013 is hard to determine, but in January 2013, processors paid $0.82 per pound to producers, which was $0.43 per pound less than in January With continued high catfish feed prices, catfish processors would benefit from figuring in the variable costs of production as well as fixed costs when determining the price to pay producers. Paying a price that covers variable costs will ensure short term survival of farmers and paying a price that covers variable and fixed costs will ensure a long term profitability and sustainability for the industry as it allows for investment in new technologies, such as in-pond raceways, that can significantly reduce the cost of production. If the breakeven cost of production covering variable cost is not paid by processors to producers, then producers will continue to go out of business, infrastructure closings will follow, and that will mean the end to the large-scale U.S. farm-raised catfish industry as we know it today. The question is whether the processors can pass on a higher fish price to their middlemen buyers. Terry R. Hanson, Ph.D. Associate Professor Department of Fisheries and Allied Aquacultures Auburn University March 2013 xxi
23 Notes from USDA NASS Reports: General USDA-NASS (U.S. Department of Agriculture - National Agricultural Statistical Service) provides to the public information on the production and processing sectors of the U.S. catfish industry. Over the years this data has been printed and distributed. More recently, data from 1995 to present have been put onto the Internet for easy access at then search for 'catfish'. However, pre-1995 data are not available on-line. Thus the reason for this publication is to put the longer time series together in one place. In some presented tables and graphs, time series have been shortened, but data for the longer series is available upon request. All data in this publication, except for catfish feed prices, comes from USDA-NASS or the state equivalent MASS (Mississippi Agricultural Statistics Service). The following notes are the notes that accompany USDA's reports, Catfish Production, Catfish Processing, Catfish Feed Deliveries, and MASS annual reports. Catfish Production Report Notes: Catfish Production Estimation and Survey Procedures: States used every available source of producer names to make their list as complete as possible. Great care was exercised to ensure that all operations were accounted for in the estimates. Estimation Procedures: Sound statistical methodology is employed to derive the estimates from reported data. All data are analyzed for unusual values. Data from each operation are compared to their own past operating profile and to trends from similar operations. Data for missing operations are estimated based on similar operations or historical data. Reliability: Catfish production estimates are based on a census of all known active producers and, therefore, have no sampling variability. However, estimates may be subject to errors such as omissions, duplication, and mistakes in reporting, recording, and processing of the data. These errors are minimized through strict quality controls in the edit and summarization process and a careful review of all reported data for consistency and reasonableness. Revision policy: Estimates for the previous year are subject to revision when current estimates are made. Revisions are the result of late or corrected data. xxii
24 Definitions Used for Catfish Production: Broodfish - Fish kept for egg production, including males. Broodfish produce the fertilized eggs which go to hatcheries. The most desirable size is 3 to 10 pounds or 4 to 6 years of age. Large Foodsize - Fish weighing over 3 pounds. Medium Foodsize - Fish weighing over one and one-half pounds to 3 pounds. Small Foodsize - Fish weighing over three-fourths pound to one and one-half pounds. Large Stockers -Fish weighing over 180 pounds to 750 pounds per 1,000 fish. Small Stockers -Fish weighing over 60 pounds to 180 pounds per 1,000 fish. Fingerlings/Fry - Fish weighing 60 pounds or less per 1,000 fish. Catfish Processing Report Notes: Catfish Processing Estimation and Survey Procedures: Survey data for catfish processing are collected monthly from approximately 24 processors. All participating processors must meet the minimum criteria of having a capacity to process at least 2,000 pounds live weight of catfish per 8- hour shift. The survey is conducted entirely by NASS Headquarters staff in Washington, D.C. NASS field offices, however, are responsible for keeping Headquarters informed of any new processing operations in their state to ensure that the survey coverage is as complete as possible. Processors are contacted either by mail or telephone. Diligent effort is made to ensure that all operations are accounted for in the estimate. Estimation Procedures: The "Catfish Processing" report refers strictly to farm-raised fish and excludes wild capture fish. Prior to summarization, questionnaires are compared with the previous month's reports for comparable placement of data, reasonable price levels, and reasonable inventory carryover given the sales and processing totals reported. Estimates are made for those processors whose reports are not available in time to be included in the release. These plants are identified by an asterisk on page 5 of each release of the "Catfish Processing" report. Estimates are normally based on the processor's previous report and current conditions. Published totals are a straight summation of the individual reports and estimated data. Price items are weighted by the associated volumes to compute weighted average prices. The published price for total whole fish, however, reflects an adjustment to the round and gutted only price to bring it to an equivalent dressed weight price. If a plant uses a fiscal accounting system, proration is used to convert reported data to a calendar month basis. Only national level estimates are published due to the limited number of plants involved. Generally, individual items are not published if there are less than three plants reporting, or if any one plant has 60 percent or more of the total. One unique feature of the "Catfish Processing" report is the listing of cooperating processors by name on each month's release. This feature originally was used to solicit industry cooperation in maintaining coverage, but it has continued because of the processors' overall acceptance of this policy. xxiii
25 Reliability: Catfish processing estimates are based on a census of all known active processors and, therefore, have no sampling variability. However, estimates may be subject to errors such as omissions, duplication, and mistakes in reporting, recording, and processing of the data. These errors are minimized through strict quality controls in the edit and summarization process, and a careful review of all reported data for consistency and reasonableness. Revision Policy: Revisions may be necessary following a review of late reports received from plants. Revisions of less than two percent of the existing published levels of any category will normally not be made. Definitions Used For Catfish Processing: Average Price Paid to Producers - Refers to the price of fish delivered to the processing plant door. Price includes charges for any services provided by the processing plant, such as seining and hauling, but does not include any adjustments based on year-end settlements. Fillets - Boned sides of the fish, cut lengthwise away from the backbone. Includes regular, shank, and strip fillets and excludes any breaded product. Fresh Fish - Fish intended for immediate consumption. Also referred to as "icepacked." Frozen Fish - Fish which are individually quick-frozen and glazed (IQF) or individually bagged and bulk frozen. Nuggets - Small fillets cut from below the rib section of the fish. Usually includes breading or added ingredients. Round and Gutted Only - Fish with no processing done or viscera only removed. Round Weight - A term for fish live weight. Steaks - Cross-section cuts from larger dressed fish. Strips - Finger size pieces of fish cut from fillets. Usually includes breading or added ingredients. Whole Dressed - Weight of whole fish with only head, viscera, and skin removed. Generally, 60 percent of the live weight remains as dressed fish. Other catfish - Includes regular, shank, and strip fillets and excludes any breaded product. Whole - Includes round and gutted and whole dressed fish Other - Differs from other category used by USDA-NASS. Includes steaks, nuggets, and all products not already reported, including weight of breading and added ingredients. Total Fresh - Includes whole, fillet, and other forms of fresh catfish. Total Frozen - Includes whole, fillet, and other frozen catfish. Total - Includes all fresh and total frozen catfish product forms. xxiv
26 Processing data were compiled in cooperation with the following processors: America's Catch Carolina Classics Catfish, LLC Consolidated Catfish Producers, LLC Delta Supreme Processing Farm Catch Catfish Processors, Inc. Fish Breeders of Idaho, Inc. Freshwater Farms Products, LLC Guidry Catfish, Inc. Haring s Pride Catfish Harvest Select Catfish, Inc. Heartland Catfish Lake's Farm Raised Catfish, Inc. Pride of the Pond Prime Line Inc. Seabrook Seafood, Inc. Simmons Farm Raised Catfish, Inc. SouthFresh Farms Superior Fish Processors (As of the Jan., 2012 Issue of NASS Catfish Processing) Catfish Feed Deliveries Report Notes: Survey Procedures: Survey data for catfish feed are collected from feed mills by the USDA-NASS Mississippi Field Office, who is responsible for ensuring survey coverage is as complete as possible. Mills are contacted by mail, telephone, fax, or internet. All cooperating feed mills have allowed NASS to publish data at the State, Regional, and National level. Estimation Procedures: The "Catfish Feed Deliveries" report refers strictly to catfish feed delivered to bonafide catfish producers and excludes catfish feed delivered to producers of other species. The totals include both bagged and bulk feed. Prior to summarization, questionnaires are compared to previous reports for comparability. Estimates are made for feed mills whose reports are not available in time to be included in the release. Estimates are based on the mill's previous reports and current conditions. Published totals are a straight summation of the individual reports and estimated data. If a mill uses a fiscal accounting system, proration is used to convert reported data to a calendar month basis. Two unusual features of this report are worthy of note: (1) cooperating feed mills are listed by name, and (2) it is impossible for the public to infer the amount of catfish feed produced in each state. Since many mills deliver feed to more than one state and to growers of other species, any inferences about overall production per state or per mill are not valid. Reliability: Catfish Feed estimates are based on a census of all known active and cooperating catfish feed mills, and therefore have no sampling variability. However, estimates may be subject to errors such as omissions, duplication, and mistakes in reporting, recording, and processing of the data. These errors are minimized through strict quality controls in the edit and summarization process, and a careful review of all reported data for consistency and reasonableness. Revision Policy: Revisions may be necessary in the following month's publication pending a review of late reports received from mills. Revisions to previous estimates are made to improve month to month relationships. Estimates for the previous month are xxv
27 subject to revision in all States each month when current estimates are made. In February, all monthly estimates for the previous year are reviewed and subject to revisions. The review is primarily based on data that may have been received after the original estimates were made. Definitions Used for Catfish Feed Sales Broodfish - Fish kept for egg production, including males. Catfish Feed - For the purposes of this report catfish feed is defined as feed delivered to bonafide catfish producers. Thus, it is not the absolute total amount of feed produced or even sold by a mill. (Some catfish feed is sold to producers of other species of fish.) The definition includes medicated feed. Catfish Feed for Foodsize Fish - Feed containing pellets larger than 1/8 of an inch. Catfish Feed for Fingerlings/Broodfish - Feed containing pellets 1/8 of an inch or smaller. Fingerlings - Smaller fish about 2 to 6 inches in length. Foodsize Fish - Fish being grown commercially for human consumption. Optimum sizes at harvest depend on the market but are generally no lower than 3/4 pound but near one pound. Data were compiled in cooperation with the following feed mills: Alabama Feed Mill LLC Arkat Feeds Cargill Animal Nutrition Carolina Fish Feeds Delta Western Fishbelt Feeds, Inc. Flint River Mills, Inc. Land O Lakes Melick Aqua Feed LLC Rangen, Inc. Silver Cup Southfresh Feeds Star Milling Co. Topwater Feed Mill Mississippi Catfish Notes: Mississippi data was obtained from Mississippi Agricultural Statistics Supplements. Methods for gathering data: Much of the data used to calculate statistics published by the NASS is collected by a part-time staff of telephone and field enumerators. This enumerator staff is employed by the National Association of State Departments of Agriculture (NASDA) and serves as outside contract workers for the USDA. The National Agricultural Statistics Service is recognized as one of the premier statistical organizations in the world. That reputation rests in large part on the efforts of enumerators in every state in the U.S. The Mississippi Agricultural Statistics Service gratefully acknowledges the work and integrity of its own enumerators. xxvi
28


29
30
31

32

33

34

35


36

37
38

39

40

41

42

43

44

45

46


47

48
49

50

51


52

53

54

55

56

57

58

59
60

61

62

63

64

65

66

67
68

69
70

71

72

73
74
75
76


77
78

79

80

81

82

83

84

85

86

87

88

89
90

91
92

93

94

95
96
97

98

99
100

101

102

103


104


105

106

107

108

109

110


111

112


113

114

115
116

117
118


119

120

121

122

123


124

125

126


127

128

129


130

131
132

133
134

135
136

137


138

139

140

141


142

143


144

145

146

147


148

149


150
151

152

153


154

155

156

157


158

159

160

161
162

163

164

165

166

167

168

169

170

171
172
173 Auburn University is an equal opportunity educational institution/employer.
2010 U.S. Catfish Database
 2010 U.S. Catfish Database by Dr. Terry Hanson and Mr. Dave Sites Mississippi State University Department of Agricultural Economics Information Report 2011-01 March, 2011 Sources: USDA National Agricultural
2011 U. S. Catfish Database
 2011 U. S. Catfish Database By Dr. Terry Hanson Auburn University, Department of Fisheries and Allied Aquacultures and Mr. Dave Sites Mississippi State University, Department of Agricultural Economics
Catfish Feed Deliveries
 Catfish Feed Deliveries ISSN: 1944-9267 Released April 20, 2011, by the National Agricultural Statistics Service (NASS), Agricultural Statistics Board, United States Department of Agriculture (USDA). March
Catfish Industry. The Delta. ANS 18 - CATFISH vs BASA 1
 Catfish Industry The Delta ANS 18 - CATFISH vs BASA 1 History and infrastructure 1950 ss Homer Swingle and students at Auburn University in Alabama examined the potential of commercial culture Sport fishing
CHANNEL CATFISH CULTURE IN THE UNITED STATES. Leonard Lovshin Department of Fisheries and Allied Aquacultures Auburn University, AL 36849
 CHANNEL CATFISH CULTURE IN THE UNITED STATES BY Leonard Lovshin Department of Fisheries and Allied Aquacultures Auburn University, AL 36849 Channel Catfish ( Ictalurus punctatus ) Native Range Of Channel
BMO Capital Markets 2014 Farm to Market Conference New York, New York. May 21, 2014
 0 BMO Capital Markets 2014 Farm to Market Conference New York, New York May 21, 2014 1 Forward Looking Statement Warning This presentation contains forward-looking statements about the business, financial
Provide a brief introduction to the U.S. seafood industry
 Provide a brief introduction to the U.S. seafood industry Participants will gain a better understanding of the large variety of seafood products available. 3 Increase knowledge of the following: What is
Sidoti & Company, LLC West Coast Road Show. San Francisco, California
 Sidoti & Company, LLC West Coast Road Show San Francisco, California February 4, 2015 Forward Looking Statement Warning This presentation contains forward-looking statements about the business, financial
Goldman Sachs Eighteenth Annual Agribusiness Conference New York, New York. March 12, 2014
 0 Goldman Sachs Eighteenth Annual Agribusiness Conference New York, New York March 12, 2014 1 Forward Looking Statement Warning This presentation contains forward-looking statements about the business,
BMO Capital Markets New York Road Show New York, New York. December 5, 2013
 0 BMO Capital Markets New York Road Show New York, New York December 5, 2013 1 Forward Looking Statement Warning This presentation contains forward-looking statements about the business, financial condition
Georgia Commercial Aquaculture Update Gary Burtle University of Georgia Animal & Dairy Science, Tifton
 Georgia Commercial Aquaculture Update 2010 Gary Burtle University of Georgia Animal & Dairy Science, Tifton Major Changes Catfish processors looking for fish Catfish prices increase during 2010 Some ponds
Goldman Sachs U.S. Emerging/SMID Cap Growth Conference. New York, New York
 Goldman Sachs U.S. Emerging/SMID Cap Growth Conference New York, New York November 20, 2014 Forward Looking Statement Warning This presentation contains forward-looking statements about the business, financial
Outlook for the U.S. Livestock and Poultry Sectors in 2011
 Outlook for the U.S. Livestock and Poultry Sectors in 2011 Presented By Shayle D. Shagam World Agricultural Outlook Board, USDA USDA Outlook Forum Washington, D.C. February 25, 2011 Situation Facing Livestock
BMO Capital Markets 2013 Farm to Market Conference New York, New York. May 14, 2013
 0 BMO Capital Markets 2013 Farm to Market Conference New York, New York May 14, 2013 1 Forward Looking Statement Warning This presentation contains forward-looking statements about the business, financial
2017/18 Corn Outlook
 217/18 Corn Outlook 217 Ag Econ In service Training Dr. S. Aaron Smith, Assistant Professor, Department of Agricultural and Resource Economics, University of Tennessee https://ag.tennessee.edu/arec/pages/cropeconomics.aspx
Overview of the U. S. Trout Industry
 Washington, D.C. Overview of the U. S. Trout Industry Released September 29, 2009, by the National Agricultural Statistics Service (NASS),, U.S. Department of Agriculture. For information on call Chris
Outlook for the U.S. Livestock and Poultry Sectors in 2012 Presented By Shayle D. Shagam World Agricultural Outlook Board, USDA
 Outlook for the U.S. Livestock and Poultry Sectors in 2012 Presented By Shayle D. Shagam World Agricultural Outlook Board, USDA USDA Outlook Forum Washington, D.C. February 24, 2012 Situation Facing Livestock
Goldman Sachs Agricultural Biotech Forum New York, NY. March 7, 2012
 1 Goldman Sachs Agricultural Biotech Forum New York, NY March 7, 2012 2 Forward Looking Statement Warning This presentation contains forward-looking statements about the business, financial condition and
Cattle and Beef Markets: Short and Long Run Challenges and Opportunities
 Cattle and Beef Markets: Short and Long Run Challenges and Opportunities Derrell S. Peel Breedlove Professor of Agribusiness and Extension Livestock Marketing Specialist Oklahoma State University Major
Cattle Market Situation and Outlook: 2015 and Beyond
 Cattle Market Situation and Outlook: 2015 and Beyond Derrell S. Peel Breedlove Professor of Agribusiness and Extension Livestock Marketing Specialist Oklahoma State University 2015 Market Setting Global
Cattle Market Outlook & Important Profit Factors for Cattle Producers
 Cattle Market Outlook & Important Profit Factors for Cattle Producers Dr. Scott Brown Agricultural Markets and Policy Division of Applied Social Sciences brownsc@missouri.edu http://amap.missouri.edu $
Beef Cattle Market Update
 Beef Cattle Market Update August 8, 2017 Dr. Scott Brown Agricultural Markets and Policy Division of Applied Social Sciences University of Missouri brownsc@missouri.edu http://amap.missouri.edu Twitter
U.S. EXPORTS Dairy Products - by Country, 2009 (pie chart) 69 Dairy Products, 2009 v (bar graph) 70 All Dry Whey, All Dry Whey -
 69 Dairy Products, 2009 v (bar graph) 70 All Dry Whey, All Dry Whey -") TABLE OF CONTENTS I. EXECUTIVE SUMMARY 5 II. UTILIZATION A. Dry Milk Products Utilization 1. Nonfat Dry Milk Compilation of Dry Milk Utilization Data 9 Nonfat Dry Milk Overview 10 Nonfat Dry Milk Domestic
TABLE OF CONTENTS I. EXECUTIVE SUMMARY 5 II. UTILIZATION A. Dry Milk Products Utilization 1. Nonfat Dry Milk Compilation of Dry Milk Utilization Data 9 Nonfat Dry Milk Overview 10 Nonfat Dry Milk Domestic
2017/18 Soybean Outlook
 217/18 Soybean Outlook 217 Ag Econ In service Training Dr. S. Aaron Smith, Assistant Professor, Department of Agricultural and Resource Economics, University of Tennessee https://ag.tennessee.edu/arec/pages/cropeconomics.aspx
2018 Soybean, Corn, & Wheat Outlook KY and TN Grain Conference
 2018 Soybean, Corn, & Wheat Outlook KY and TN Grain Conference S. Aaron Smith, Crop Marketing Specialist, Assistant Professor, Department of Agricultural and Resource Economics, University of Tennessee
MISSOURI FISH AND SEAFOOD CONSUMER STUDY EXECUTIVE SUMMARY
 MISSOURI FISH AND SEAFOOD CONSUMER STUDY EXECUTIVE SUMMARY Missouri consumers answered 1,050 questionnaires in grocery stores and responded to 400 telephone surveys about their preferences and demands
Beef Outlook. Regional Dealer Event. February 9, Dr. Scott Brown Agricultural Markets and Policy Division of Applied Social Sciences
 Beef Outlook Regional Dealer Event February 9, 2018 Dr. Scott Brown Agricultural Markets and Policy Division of Applied Social Sciences brownsc@missouri.edu http://amap.missouri.edu $ Per Cwt. MED. & LRG.
SGS, LLC AQUACULTURE
 SGS, LLC AQUACULTURE WORLDWIDE FISH MARKET OVERVIEW The price for various fish species are influenced by demand and supply factors, including the cost of production and transportation, but also by alternative
Fishery. Fishing vessels (Dept. of Finance)
") Fishery Fishing vessels (Dept. of Finance) The Newfoundland and Labrador fishery recorded a difficult year in 29 due to low market prices, continued pressure from low-cost producers, and an appreciating
Fishery Fishing vessels (Dept. of Finance) The Newfoundland and Labrador fishery recorded a difficult year in 29 due to low market prices, continued pressure from low-cost producers, and an appreciating
Livestock Market Trends
 Livestock Market Trends Farm$mart Agricultural Conference January 18, 2014 John Bancroft Market Strategies Program Lead john.bancroft@ontario.ca 519-271-6974 Today s Discussion 2014 FCC Market Drivers
Outlook for Livestock and Poultry. Michael Jewison World Agricultural Outlook Board, USDA
 Outlook for Livestock and Poultry Michael Jewison World Agricultural Outlook Board, USDA USDA Agricultural Outlook Forum February 20, 2015 About Those Forecasts Everything makes sense in hindsight, a fact
ANS 18 Test Yourself Sample Test Questions. 1. With respect to relative GLOBAL production tonnage, correctly order the following on the pyramid below:
 ANS 18 Test Yourself Sample Test Questions 1. With respect to relative GLOBAL production tonnage, correctly order the following on the pyramid below: a) Basa b) grass carp c) U.S. channel catfish d) abalone
Livestock and Dairy Market Outlook
 Livestock and Dairy Market Outlook August 9, 2018 Missouri Farm Bureau Commodity Conference Dr. Scott Brown Agricultural Markets and Policy Division of Applied Social Sciences brownsc@missouri.edu http://amap.missouri.edu
Commodity Market Outlook: Corn, Forage, Wheat & Cattle
 Commodity Market Outlook: Corn, Forage, Wheat & Cattle Stephen R. Koontz Professor & extension economist Department of Agricultural & Resource Economics Colorado State University Stephen.Koontz@ColoState.Edu
Agriculture Outlook. Rich Pottorff Doane Advisory Services
 Agriculture Outlook Rich Pottorff Doane Advisory Services General Outline An overview of U.S. crop markets Corn, soybeans, wheat & cotton Some factors shaping the outlook World Ag Situation Conclusions
SLADE GORTON & CO SEAFOOD MARKET REPORT June 2014
 **June Feature** ICYBAY Baby Clam Meat ICYBAY meat is versatile, mild flavored and medium texture with excellent plate coverage. ICYBAY clam meat is all natural with no hormones, no antibiotics and no
Commercial Net Pen Salmon Farming in Washington State
 Commercial Net Pen Salmon Farming in Washington State Icicle SeafoodsOverivew at a glance Icicle Seafoods Icicle is a leading harvester, producer and processor of diversified seafood products in North
Presentation from the USDA Agricultural Outlook Forum 2017
 Presentation from the USDA Agricultural Outlook Forum 2017 United States Department of Agriculture 93 rd Annual Agricultural Outlook Forum A New Horizon: The Future of Agriculture February 23-24, 2017
MSU Extension Publication Archive. Scroll down to view the publication.
 MSU Extension Publication Archive Archive copy of publication, do not use for current recommendations. Up-to-date information about many topics can be obtained from your local Extension office. What Brokers,
The Salmon Industry: Twenty-Five Predictions for the Future
 The Salmon Industry: Twenty-Five Predictions for the Future by Gunnar Knapp Professor of Economics Institute of Social and Economic Research University of Alaska Anchorage 3211 Providence Drive Anchorage,
MSU Extension Publication Archive. Scroll down to view the publication.
 MSU Extension Publication Archive Archive copy of publication, do not use for current recommendations. Up-to-date information about many topics can be obtained from your local Extension office. What Consumers
Mink. Pelt Production Down 10 Percent
 Mink ISSN: 19491549 Released July 14, 017, by the National Agricultural Statistics Service (NASS), Agricultural Statistics Board, United States Department of Agriculture (USDA). Pelt Production Down 10
J.P. Morgan New York Non-Deal Road Show. New York, New York
 J.P. Morgan New York Non-Deal Road Show New York, New York March 2, 2018 Forward Looking Statement Warning This presentation contains forward-looking statements about the business, financial condition
Jacksonville & Terre Haute
 2013-14 Post Harvest Special Grain Market Outlook and Strategies for Jacksonville & Terre Haute Presented by: Joseph Aiello 12/06-07/13 Disclaimer: Futures/options trading involves substantial risk of
World supply and demand of tilapia
 World supply and demand of tilapia by Helga Josupeit FAO Rome, October 2010 World tilapia production World tilapia production has been booming during the last decade, with output doubling from 830000 tonnes
80:20 Pond Growth Performance of Hybrid Tilapia on Soybean Meal-Based Diets
 80:20 Pond Growth Performance of Hybrid Tilapia on Soybean Meal-Based Diets Results of 1997 ASA/China Feed-Based Production Trials INTRODUCTION M. C. Cremer and Zhang Jian American Soybean Association,
Propagating and Selling Fish
 Lesson C3 5 Propagating and Selling Fish Unit C. Animal Wildlife Management Problem Area 3. Fish Management Lesson 5. Propagating and Selling Fish New Mexico Content Standard: Pathway Strand: Natural Resources
Compound Aqua feeds in a More Competitive Market: Alternative protein sources for a more sustainable future
 Compound Aqua feeds in a More Competitive Market: Alternative protein sources for a more sustainable future Abstract Albert G.J. Tacon Aquatic Farms Ltd 49-139 Kamehameha Hwy Kaneohe, Hawaii 96744 USA
Fishing Industry in Prince Edward Island January 2009
 Fishing Industry in Prince Edward Island January 2009 INDUSTRY HIGHLIGHTS Did you know??? There are two lobster seasons in PEI: the Spring season and the Fall fishery. There were 22.9 million pounds of
10/18/2015. Outline. Commodity Outlook
 Commodity Outlook Stephen R. Koontz Professor & extension economist Department of Agricultural & Resource Economics Colorado State University Stephen.Koontz@ColoState.Edu http://webdoc.agsci.colostate.edu/koontz
2018 Cotton Market Outlook: At What Price Should I Get Back Into Cotton?
 2018 Cotton Market Outlook: At What Price Should I Get Back Into Cotton? S. Aaron Smith, Crop Marketing Specialist, Assistant Professor, Department of Agricultural and Resource Economics, University of
FAPRI agricultural commodity outlook
 FAPRI agricultural commodity outlook By William H. Meyers Howard Cowden Professor of Agricultural and Applied Economics FAPRI at MU UN DESA Expert Group Meeting on the World Economy 21 October 2013 New
Global Supply Conditions
 Species Calamari Global Supply Conditions Market Activity Loligo Chinensis. Catch volumes are down 25-30% this season, producers are not taking on any new business and are having dificulty finding raw
Corn Outlook. December, 2017
 Corn Outlook December, 2017 Corn Outlook December, 2017 Historical Price Reference Fundamental Backdrop Seasonal Tendency Summary Commodity & Ingredient Hedging 2 Historical Price Reference Where are Corn
Agricultural Outlook: Rebalancing U.S. Agriculture
 Agricultural Outlook: Rebalancing U.S. Agriculture Michael J. Swanson Ph.D. Agricultural Economist January 2018 2018 Wells Fargo Bank, N.A. All rights reserved. For public use. The U.S. Ag Sector renormalizes!
One Year Later A regional assessment of seafood consumption patterns after the Gulf oil spill
 One Year Later A regional assessment of seafood consumption patterns after the Gulf oil spill Lisa Krimsky 1 and Brooke Saari 2 UF/IFAS Sea Grant Extension Miami-Dade County 1, Okaloosa and Walton Counties
OCEAN2012 Fish Dependence Day - UK
 OCEAN2012 Fish Dependence Day - UK Europeans are now so dependent on fish products originating from external waters that half the fish they consume are sourced outside the EU Fish dependence: The EU s
Swine Market Outlook
 2018 IOWA PORK REGIONAL CONFERENCES NASHUA, CARROLL, LE MARS, & WASHINGTON, IA FEBRUARY 19-22, 2018 Swine Market Outlook Lee Schulz, Department of Economics, Iowa State University (515) 294-3356; lschulz@iastate.edu
Land Values and Chinese Agriculture
 Land Values and Chinese Agriculture Wendong Zhang Assistant Professor of Economics and Extension Economist wdzhang@iastate.edu 515-294-2536 2016 Pro-Ag Meetings, Clarinda, IA, December 15 th, 2016 The
08 / Industriveien 18 Phone: N Kristiansund Fax:
 Aquaculture Bulletin HEADLINES 08 / 2006 - a guideline for investors in the aquaculture business * Still high prices on the wholesale markets in the EU, with total supply of Atlantic salmon up with 4.6
Beef & Cattle Market Outlook. Glynn Tonsor Dept. of Agricultural Economics Kansas State University
 Beef & Cattle Market Outlook Glynn Tonsor Dept. of Agricultural Economics Kansas State University 1 Economic Outlook Overview: Cow-Calf Continued beneficiary of tight supplies and expanded heifer retention
Pork Outlook. Professor of Agricultural Economics. Midwest/Great Plains & Western Outlook Conference Indianapolis, August 2007
 Midwest/Great Plains & Western Outlook Conference Indianapolis, August 2007 Pork Outlook Ron Plain Professor of Agricultural Economics University of Missouri-Columbia http://web.missouri.edu/~plainr/ Long
October 14, University of Missouri Extension
 October 14, 2014 University of Missouri Extension Pat Guinan October 14, 2014 A benign growing season for much of Missouri, and the Midwest Missouri Monthly Temperature Departure from Average* April 2014
Iowa Land Values. Wendong Zhang Assistant Professor of Economics and Extension Economist
 Iowa Land Values Wendong Zhang Assistant Professor of Economics and Extension Economist wdzhang@iastate.edu 515-294-2536 2017 U.S. Bank Ag Summit, Ames, IA, January 10 th, 2017 The new Mike Duffy 30 29
Outlook for Hog Profits in 2012
 NPB Swine Conference, Sioux Falls, September 29, 2011 Outlook for Hog Profits in 2012 Ron Plain D. Howard Doane Professor of Agricultural Economics University of Missouri-Columbia http://web.missouri.edu/~plainr/
Fishery. Harvesting. Snow Crab Professional Fish Harvesters Certification Board
 Fishery T he Newfoundland and Labrador fishery faced several challenges in 8, including continued competition from low-cost producers, as well as high fuel costs and unfavourable exchange rates for most
Utah Ag Bankers Conference Alfalfa and Dairy Outlook
 Utah Ag Bankers Conference Alfalfa and Dairy Outlook Dillon M Feuz Utah State University Extension Feb 2018 Hay Market Most data provided by USDA- AMS, NASS & FAS 1990 1990 1991 1991 1992 1992 1993 1994
Global Outlook for Agriculture Trend versus Cycle
 Global Outlook for Agriculture Trend versus Cycle Michael Swanson Ph.D. Wells Fargo October 2017 Everything is connected we just don t see how. Connection corollary: Nothing natural moves in a straight
Have You Ever Heard the Phrase
 Setting the Stage with Dairy Outlook Mark Stephenson Director of Dairy Policy Analysis Have You Ever Heard the Phrase! 3M Money Makes Milk! 5M More Money Makes More Milk! 7M Much More Money Makes Much
Cocahoe Economics Fact Sheet
 Cocahoe Economics Fact Sheet Undertaking a large project such as baitfish farming requires a good deal of advanced planning to ensure that prudent decisions are made. The purpose of this section is to
Mexico sugar towards 2014/15. Forget the inflexion point?
 Mexico sugar towards 20 Forget the inflexion point? Pablo Sherwell VP, Food & Agribusiness Research & Advisory pablo.sherwell@rabobank.com September 2014 1 Rabobank: Food & Agribusiness Research and Advisory
Cattle & Beef Outlook
 Cattle & Beef Outlook Friday, August 18, 2017 Glynn Tonsor Dept. of Agricultural Economics, Kansas State University Overarching Beef Industry Economic Outlook Supplies Expansion continues, but has moderated
USDA Grains & Oilseeds Outlook
 USDA Grains & Oilseeds Outlook 3 rd Ukrainian Grain Congress 2012 Edward W. Allen U.S. Department of Agriculture Economic Research Service 202-694-5288 ewallen@ers.usda.gov U.S. Producer Prices Are High
Cattle & Beef Outlook
 Cattle & Beef Outlook Glynn Tonsor Dept. of Agricultural Economics, Kansas State University Overarching Beef Industry Economic Outlook Supplies Peak herd size may extend given 17 returns Demand Key to
Outlook for U.S. Retail Food Prices and Inflation in 2009
 Outlook for U.S. Retail Food Prices and Inflation in 2009 Ephraim Leibtag, PhD Food Markets Branch, Food Economics Division ERS-USDA Presented at the 2009 Agricultural Outlook Forum Global Agriculture
Agricultural Commodity Outlook: Grain, Forage & Cattle Markets
 Agricultural Commodity Outlook: Grain, Forage & Cattle Markets Stephen R. Koontz Professor & extension economist Department of Agricultural & Resource Economics Colorado State University Stephen.Koontz@ColoState.Edu
Agricultural Weather Assessments World Agricultural Outlook Board
 Texas (8) Missouri (7) South Dakota (6) Kansas (5) Nebraska (5) North Dakota (5) Oklahoma (5) Kentucky (4) Montana (4) California (3) Minnesota (3) New York (3) Pennsylvania (3) Tennessee (3) Wisconsin
ANS 18 Test Yourself Sample Test Questions. 1. With respect to relative GLOBAL production tonnage, correctly order the following on the pyramid below:
 ANS 18 Test Yourself Sample Test Questions 1. With respect to relative GLOBAL production tonnage, correctly order the following on the pyramid below: a) Basa b) grass carp c) U.S. channel catfish d) abalone
Agricultural Weather Assessments World Agricultural Outlook Board
 Texas (8) Missouri (7) South Dakota (6) Kansas () Nebraska () North Dakota () Oklahoma () Kentucky (4) Montana (4) California (3) Minnesota (3) New York (3) Pennsylvania (3) Tennessee (3) Wisconsin (3)
Global Supply Conditions
 Species Calamari Global Supply Conditions Market Activity Loligo Chinensis. As new containers arrive with higher costs, prices for cleaned products are increasing an additional $.10-$.15/lb. on smaller
Economics of Spice Pepper Production in Oklahoma 1
 Economics of Spice Pepper Production in Oklahoma 1 Raymond Joe Schatzer and Anita M. Kinsella Department of Agricultural Economics James E. Motes and Brian A. Kahn Department of Horticulture and Landscape
Toward an Outlook for California Agriculture Relevant to GHG Emissions Mitigation. April 30, Daniel A. Sumner
 Toward an Outlook for California Agriculture Relevant to GHG Emissions Mitigation April 30, 2013 Daniel A. Sumner University of California Agricultural Issues Center and UC Davis, Agricultural and Resource
USA: World s Largest Tilapia Market
 USA: World s Largest Tilapia Market Kevin Fitzsimmons, Ph.D. University of Arizona, Professor of Environmental Science World Aquaculture Society, Past-President Aquaculture without Frontiers, Past-Chairman
Taiwan Tilapia Production Zone Exclusive for Exporting
 Taiwan Tilapia Production Zone Exclusive for Exporting Fu-Sung (Frank) CHIANG, Ph.D. Professor, National Taiwan Ocean University Executive Director, Taiwan Tilapia Alliance Fu-Sung (Frank) Chiang! Consumer
Agricultural Commodity Outlook: Grain, Forage & Cattle Markets
 Agricultural Commodity Outlook: Grain, Forage & Cattle Markets Stephen R. Koontz Professor & extension economist Department of Agricultural & Resource Economics Colorado State University Stephen.Koontz@ColoState.Edu
TEGMA Fall Transportation Symposium
 TEGMA 2017 Fall Transportation Symposium John Wilson Senior Vice President Dairy industry trends 1997 1998 1999 2000 2001 2002 2003 2004 2005 2006 2007 2008 2009 2010 2011 2012 2013 2014 2015 2016 Million
Aquaculture growth potential in Azerbaijan
 Aquaculture growth potential in Azerbaijan Policy brief for FAO TCP/AZE/372/C2 Assessment of state-owned fish farms for sustainable development of the aquaculture sector in Azerbaijan (prepared by Junning
Manufacturers Continue Capacity Expansion as Technology Orders Grow
 Contact: Penny Brown, AMT, 703-827-5275 pbrown@amtonline.org For Release: October 8th, 2018 Manufacturers Continue Capacity Expansion as Technology Orders Grow Manufacturing technology orders posted an
Bristol Bay and World Salmon Markets in 2016
 Bristol Bay and World Salmon Markets in 2016 Gunnar Knapp Professor Emeritus of Economics Institute of Social and Economic Research University of Alaska Anchorage Gunnar.Knapp@gmail.com January 24, 2017
Change, Challenges and Opportunities for Wild Fisheries
 Change, Challenges and Opportunities for Wild Fisheries Gunnar Knapp Professor of Economics University of Alaska Anchorage September 2002 This is a slightly modified version of a presentation which I gave
Livestock, Poultry, and Dairy: Situation and Outlook
 Livestock, Poultry, and Dairy: Situation and Outlook AAEA Annual Meeting Extension Track August 14, 2012 James G. Robb Director james.robb@lmic.info 29 land Grant Universities: USDA Members: ERS APHIS
BRITISH COLUMBIA SEAFOOD INDUSTRY YEAR IN REVIEW
 BRITISH COLUMBIA SEAFOOD INDUSTRY YEAR IN REVIEW ii British Columbia Seafood Industry 2012 YEAR IN REVIEW TABLE of CONTENTS A MESSAGE from The B.C. MINISTER of AGRICULTURE....1 British Columbia SEAFOOD
Seafood Industry. The 2012 Juneau and Southeast Alaska Economic Indicators 11/1/12 Page 60
 Seafood Industry In 2011, fishermen in Southeast landed 395,628,268 pounds of fish with an ex vessel value of $391,091,684. This harvest resulted in 272.6 million pounds of product, with a wholesale value
Global Containerboard Outlook
 Global Containerboard Outlook European Conference March 2018 Gleb Sinavskis Economist, European Paper Packaging Copyright 2018 RISI, Inc. Proprietary Information Gleb Sinavskis Economist, European Paper
COMPARISON OF FIXED & VARIABLE RATES (25 YEARS) CHARTERED BANK ADMINISTERED INTEREST RATES - PRIME BUSINESS*
 CHARTERED BANK ADMINISTERED INTEREST RATES - PRIME BUSINESS*") COMPARISON OF FIXED & VARIABLE RATES (25 YEARS) Fixed Rates Variable Rates FIXED RATES OF THE PAST 25 YEARS AVERAGE RESIDENTIAL MORTGAGE LENDING RATE - 5 YEAR* (Per cent) Year Jan Feb Mar Apr May Jun Jul
COMPARISON OF FIXED & VARIABLE RATES (25 YEARS) Fixed Rates Variable Rates FIXED RATES OF THE PAST 25 YEARS AVERAGE RESIDENTIAL MORTGAGE LENDING RATE - 5 YEAR* (Per cent) Year Jan Feb Mar Apr May Jun Jul
OECD Workshop, Busan, June 2010
 Aquaculture Adaptation Strategies to Climate Change: An Industry Perspective Daniel Lee BAP Standards Coordinator Global Aquaculture Alliance OECD Workshop, Busan, June 2010 Outline Aquaculture Adaptation
Atlantic Canada lobster industry: structure & markets
 Atlantic Canada lobster industry: structure & markets Lobster summit October 2007 Gardner Pinfold 1 The lobster industry - vital to communities in Canada & U.S. Canada Landings 40-50,000 t $550-650 million
Babson Capital/UNC Charlotte Economic Forecast. May 13, 2014
 Babson Capital/UNC Charlotte Economic Forecast May 13, 2014 Outline for Today Myths and Realities of this Recovery Positive Economic Signs Negative Economic Signs Outlook for 2014 The Employment Picture
2018 Farm Bill Update and Agricultural Outlook
 2018 Farm Bill Update and Agricultural Outlook August 23, 2018 Dr. Scott Brown Agricultural Markets and Policy Division of Applied Social Sciences brownsc@missouri.edu http://amap.missouri.edu 2018 Farm
Human Impact in Aquatic Systems: Fish Catching vs. Fish Raising
 Human Impact in Aquatic Systems: Fish Catching vs. Fish Raising What are human impacts? Fish and aquatic invertebrates (clams, crabs, squid, etc.) currently supply 16% of world protein, higher in developing