Public Transport Asset Management
|
|
|
- Chrystal Morgan
- 5 years ago
- Views:
Transcription

1 Public Transport Asset Management 17 maintenance shops Bank 885 miles of track Workshop and Training on Urban Transport Planning and Reform. Baku, April 14-16, 2009
2 Key Public Transport Activities Service Planning Daily Service Transportation Maintenance Capital Planning New Equipment New Facilities Construction Asset Management Often given minimal attention Bank 2
3 PT Assets Often Are Complex Visible to Public Visible to Public Invisible to Public Over 2000 revenue vehicles 275 stations 885 miles of track 478 bridges Invisible to Public 20 miles of tunnels Invisible to Public 17 maintenance shops Invisible to Public Bank 3
4 Asset Management Control of assets Assignment of responsibility Maintenance of inventory Disposition Maintenance in a State-of-Good Repair (SGR) Ensure that assets used economically throughout their useful life Bank 4
5 ? What is SGR? Assets renewed/replaced when needed Bank 5 Renewed at critical midlife points to ensure full useful life e.g., Buses Busways Roofs Track 8 years 8 years 20 years 25 years Replaced at the end of their useful lives e.g., Buses Rail cars Bridges 15 years 35 years 50 years


6 Importance of Renewal Reactive Maintenance Deterioration Curve Preventive Maintenance Deterioration Curve Bank 6
7 SGR Database Is Needed Identify renewal/replacement activities Important for often-forgotten renewals Demonstrate ongoing funding needs and consequences Engineering assessment of current assets Support long-range capital planning Project programming under constrained funding Bank 7

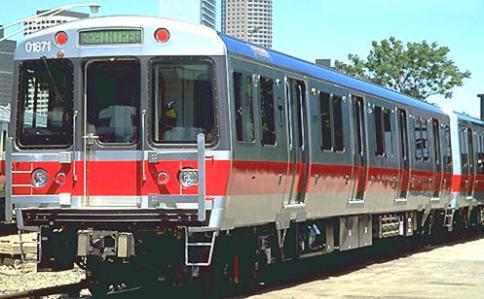


8 Boston MBTA Case Study Multi-modal Ages of assets range up to 100 years Service expansion continues BRT Commuter Rail Bank 8
9 Key Infrastructure Statistics Over 2000 revenue vehicles 275 stations 885 miles of track 478 bridges 20 miles of tunnels 17 maintenance shops Bank 9
10 Capital Spending Trends 80 $ $700 Revenue Vehicle Miles (millions) Revenue Vehicle Miles Straight Line Capital Trend Straight Line Trend Total Capital Expenditures $600 $500 $400 $300 $200 millions of dollars ($1999) 10 $100 0 $0 Bank 10
11 Boston SGR Model Approach Focus on high-cost assets Not a maintenance database of all assets Support periodic data updates A dynamic, not static problem However, staff and resources limited Provide objective analysis Uniform criteria and process Report consequences Bank 11


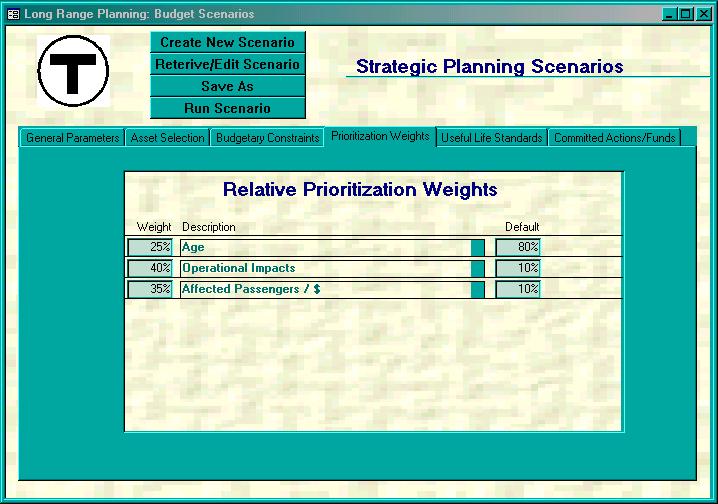
12 SGR Model Inputs Assets Table Annual Budgets Prioritization Weights Bank 12
13 SGR Database Assets Table Stores information about all key MBTA assets Vehicles Facilities Systems Bank 13

14 Asset Table Attributes Condition Measures Age Life Project Action Costs Replacement/Renewal Contingency Factors Cash flow years Ranking Measures Condition measures Operational importance Affected ridership Bank 14
15 Scoring Candidate Actions Operational Impact 20% Cost Effectiveness 20% Default Weighting Age 60% Age Age as % of Service Life Operational Impact Yes/No Selected assets are essential to system operations Cost-Effectiveness Cost of Action/Ridership Reflects impact on users Bank 15
![Score Age Scoring Score = [(Asset Age) / (Service Life)-1] * 180 Subject to Maximum Score = 60 (Reach](/docs-images/89/100582505/images/16-2.jpg "Max at 133%) 70 60 50 40 30 20 10 0 100 110 120 130 140 150 160 Asset Age/Service Life (Percent) Bank")
16 Score Age Scoring Score = [(Asset Age) / (Service Life)-1] * 180 Subject to Maximum Score = 60 (Reach Max at 133%) Asset Age/Service Life (Percent) Bank 16
17 Age Scoring Examples Asset Age Service Life Percent Score Bus Bus Bridge Bank 17
18 Operational Impact Scoring 0/1 Scoring Depending on Operations Criticality Examples of Critical Projects (Score = 20) Buses, Track, Signals, Power Examples of Non-Critical Projects (Score = 0) Stations, Parking Bank 18
 * 10 Subject to Maximum Score = 20")
19 Cost-Effectiveness Scoring Cost-Effectiveness (CE) = Daily Riders/Project Cost Project Cost = Remaining Cost for Multiple-Year Funded Projects Project Score = (Project CE / Ave CE (All Projects) * 10 Subject to Maximum Score = 20 Bank 19
20 Sequential Programming Process Identify candidate projects Actions come due Delayed projects from prior years Score and rank projects Fund projects in rank order until: Cost (project i) > Funds remaining Mark unfunded projects as candidates for next year Carryover remaining funds to next year Bank 20
21 Analysis Questions What is the funding needed to bring and maintain system at SGR? Lives of all assets < services lives All renewals performed on-time What are the consequences of providing less than required SGR funding? Replacements/Renewals performed on-time Replacements/Renewals delayed Replacements/Renewals not performed Bank 21
22 Unconstrained Funding Analysis Simulates effect of unlimited funds applied to capital needs Determines: Minimum time and funds needed to achieve SGR Reduce the Backlog Funds required to maintain the system at SGR Baseline comparison for other funding scenarios Bank 22


23 Unconstrained Funding: Backlog $2,500,000, $2,000,000, $1,500,000, Initial SGR Need: $2.7 billion Needs $1,000,000, $500,000, $ Year Unconstrained Seven years for procurements At SGR after 2007 Bank 23


24 Unconstrained Funding: Backlog $2,500,000, $2,000,000, Spending $1,500,000, $1,000,000, $500,000, $ Year Unconstrained Seven years for procurements At SGR after 2007 Bank 24
25 Constrained Funding Analysis Simulates effect of limited funds applied to capital needs Limited funds < Funds needed to achieve SGR Determines: Beginning/Ending Period Comparisons Changes in Backlog Percent of Assets > Service Life by Asset Type 20-Year Totals SGR Needs Funded On-time, Late, Not at All Spending by Asset Type Bank 25

26 Current Annual Funding: $350M Backlog Unconstrained $350M $4,500,000, $4,000,000, $3,500,000, $3,000,000, $2,500,000, $2,000,000, $1,500,000, $1,000,000, $500,000, $ $350 Year Uncons $0 $200 $400 $600 $800 Bank 26
27 Funding by Asset $5,000,000,000 Asset Spending $350M Annual Funding $4,500,000,000 $4,000,000,000 $3,500,000,000 $3,000,000,000 $2,500,000,000 Unconstrained $350M $2,000,000,000 $1,500,000,000 $1,000,000,000 $500,000,000 Bank 27 $- Administration Bridges Communications Elevators & Escalators Facilities Fare Equipment Non-Revenue Vehicles Parking Power Revenue Vehicles Signals Stations Track Tunnels Yard & Shop
28 Assets Exceeding Service Lives 70% 60% 50% Percent Assets Exceeding Useful Life $350M Annual Funding 2002 and Unconstrained 2022 $350M 40% 30% 20% 10% 0% Bank 28 Administration Bridges Communications Elevators & Escalators Facilities Fare Equipment Non-Revenue Vehicles Parking Power Revenue Vehicles Signals Stations Track Tunnels

29 On-Time Funding Impact 20-Year Funding Impact $350M Annual Funding $9,000,000,000 $8,000,000,000 $7,000,000,000 Unconstrained $350M $6,000,000,000 $5,000,000,000 $4,000,000,000 $3,000,000,000 $2,000,000,000 $1,000,000,000 $0 SGR Needs Funded On Time SGR Needs Funded Late SGR Needs Unfunded Bank 29
30 Maintain Current Backlog: $450M Unconstrained $450M $3,000,000, $2,500,000, $2,000,000, $1,500,000, $1,000,000, $500,000, $ Year Uncons $450 $0 $200 $400 $600 $800 Bank 30
31 Eliminate Backlog (20 yrs): $570M $2,500,000, $2,000,000, Unconstrained $570M $1,500,000, $1,000,000, $500,000, $ Year Uncons $570 $0 $200 $400 $600 $800 Bank 31

32 Time for a Reality Check! Show me the money!! Bank 32
33 The SGR Database Has Been Used in Several Ways Discussions with Policy Makers Internal Management Bank 33

34 Discussions with Policy Makers Briefing the Board of Directors on SGR Convincing the Chairman to pursue SGR Persuading the Legislature of need for SGR capital funding Bank 34

35 Internal Management Uses Implications of Current Investment Patterns Where are we headed? MBTA SGR Goal Setting Where would we like to go? Yard Stick to Measure Progress Towards SGR Bank 35 Are we getting closer to our goals?


36 Conclusions Most transport systems have not addressed longterm asset management issues The SGR approach can help make the funding case to policy makers. It also can help managers: Make more effective decisions Optimize Public Transport investments Bank 36
Arterial Transitway Corridors Study. Ave
 Arterial Transitway Corridors Study Ave January 2012 Arterial Transitway Corridors Study Overview Corridor Features and Demographics 11 study corridors, 95 route miles 86,000 daily rides and half of existing
Arterial Transitway Corridors Study
 Arterial Transitway Corridors Study February 2012 Arterial Transitway Corridors Study Overview Corridor Features and Demographics 11 study corridors, 95 route miles Routes: 86,000 daily rides and half
Instances of 1 Minute or Less Between Buses 4 5% 55% 3.9% 3.5% 3.5% 3.5% 2.9% 2.8% Sep- Sep 07 Oct-07 Nov-07 Dec-07 Jan- Jan 08 Feb- Feb 08 Mar-08
 President s Report Monthly Performance Matrix Meeting or exceeding target Within 10% of target Missing target by more than 10% Measure does not have target RIDERSHIP Total Ridership p( (in millions) Rail
Developing a Portwide Asset Management Program
 Developing a Portwide Asset Management Program American Association of Port Authorities Marine Terminal Management Training Program September 17, 2015 Colin Chung, PhD President, Kayuga Solution Asset
Crenshaw Transit Corridor Study. Working Group Meetings March 2009
 Crenshaw Transit Corridor Study Working Group Meetings March 2009 1 Concepts to Think About Today Alternatives and Design Options Grade Separation Analysis Supplemental Inglewood Alignment Analysis Evaluation
Long-Range Financial Plan Implications of Revised Sales Tax Projections for DART
 Long-Range Financial Plan Implications of Revised Sales Tax Projections for DART City of Dallas Transportation and Environment Committee May 10, 2010 1 Comprehensive Sales Tax Forecast Review was Required
Spring Lake Park Mounds View North Oaks. Arden Hills. Shoreview. Roseville. Little Canada. Falcon Heights SNELLING. Lilydale. West Saint Paul 35E
 Coon Rapids Blaine Spring Lake Park Mounds View rth Oaks In 2011, Metro Transit embarked on the Arterial 494 Minnetonka Maple Grove Plymouth Hopkins Brooklyn Park New Hope Golden Valley Louis Park Edina
PERFORMANCE ANALYSIS of The Draft 2015 CLRP
 Item 9 PERFORMANCE ANALYSIS of The Draft CLRP Presentation to the Transportation Planning Board September 16, CLRP Performance Analysis 1 What is the Long-Range Transportation Plan (CLRP)? The CLRP identifies
MTA Capital Program Amendment for Hurricane Sandy Recovery As submitted to the MTA Board December 2012
 MTA Capital Program 2010-2014 Amendment for Hurricane Sandy Recovery As submitted to the MTA Board December 2012 Print date: 12/13/12 Staff Summary Page 2 of 2 The attached tables show a summary of the
TORONTO TRANSIT COMMISSION REPORT NO.
 Form Revised: February 2005 TORONTO TRANSIT COMMISSION REPORT NO. MEETING DATE: May 30, 2012 SUBJECT: ADDITIONAL OPERATING RESOURCE REQUIREMENTS TO MEET INCREASING TTC RIDERSHIP ACTION ITEM RECOMMENDATIONS
MTA CAPITAL PROGRAM: Tri-State Transportation Campaign
 MTA CAPITAL PROGRAM: WHAT S IT IN FOR LONG ISLAND? Tri-State Transportation Campaign December 3, 2009 The Context From 2000-2008 Population growth 3.8% 25-44 years olds percentage of population dropped
Two Capitals: 1 w/lrt, 1 w/out How Has Transit Fared in Each?
 Two Capitals: 1 w/lrt, 1 w/out How Has Transit Fared in Each? Columbus, Ohio Sacramento, CA Photo courtesy of the Ohio Statehouse Photo Archive John Schumann Senior Transportation Consultant http://en.wikipedia.org/wiki/file:california_state_capitol.jpg
Improving Mobility Without Building More Lanes
 Improving Mobility Without Building More Lanes By Mike Salisbury and Will Toor July 2017 Copyright 2017 by Southwest Energy Efficiency Project. All rights reserved. Photo: Courtesy of the Denver Post Anyone
Corridor Advisory Group and Task Force Meeting #10. July 27, 2011
 Corridor Advisory Group and Task Force Meeting #10 July 27, 2011 1 Agenda Recap CAG/TF #9 Public Meeting #2 Summary Single Mode Alternatives Evaluation Results Next Steps 2 3 CAG/TF #9 Recap CAG /TF #9
ROUTES 55 / 42 / 676 BUS RAPID TRANSIT LOCALLY PREFERRED ALTERNATIVE
 ROUTES 55 / 42 / 676 BUS RAPID TRANSIT LOCALLY PREFERRED ALTERNATIVE April, 2012 1 INTRODUCTION The need for transit service improvements in the Routes 42/55/676 corridor was identified during the Southern
METRO. Monthly Board Report. February 2009
 METRO Monthly Board Report Operating Capital Service Performance February 29 3/17/29 February 29 MONTHLY BOARD REPORT Table of Contents Section A Section B Section C Section D Section E Section F Section
ITEM 2.3 South of Fraser Rapid Transit Surrey-Langley technology decision. That the Mayors Council on Regional Transportation receive this report.
 TO: FROM: Mayors Council on Regional Transportation Geoff Cross, Vice President of Planning and Policy DATE: September 27, 2017 SUBJECT: ITEM 2.3 South of Fraser Rapid Transit Surrey-Langley technology
Report to COUNCIL for decision
 17 152 Title: Section: Prepared by: Olympic Pool Business Case Community & Recreation Andrew White (Community & Recreation Manager) Meeting Date: 18 May 2017 Legal Financial Significance = Medium Report
Transportation. Pages E-3 to E-145 PROPOSED FY CAPITAL IMPROVEMENT PLAN (CIP) CCCRC Presentation Thursday, June 14, 2018
 CCCRC Presentation Thursday, June 14, 2018") PROPOSED FY 2019-2028 CAPITAL IMPROVEMENT PLAN (CIP) Pages E-3 to E-145 CCCRC Presentation Thursday, June 14, 2018 in the CIP Continues Arlington s commitment to a transportation system that expands travel
PROPOSED FY 2019-2028 CAPITAL IMPROVEMENT PLAN (CIP) Pages E-3 to E-145 CCCRC Presentation Thursday, June 14, 2018 in the CIP Continues Arlington s commitment to a transportation system that expands travel
Bus Rapid Transit (BRT) sets a new global trend in public transportation
 sets a new global trend in public transportation") 01 Transportation Planning 7 International comparative study of Seoul BRT system Ko, Joonho Summary The ridership of the bus rapid transit system in Seoul is the fifth highest among 162 cities worldwide,
01 Transportation Planning 7 International comparative study of Seoul BRT system Ko, Joonho Summary The ridership of the bus rapid transit system in Seoul is the fifth highest among 162 cities worldwide,
PURPOSE AND NEED SUMMARY 54% Corridor Need 1. Corridor Need 2. Corridor Need 3. Corridor Need 4. Corridor Need 5
 SUMMARY PURPOSE AND NEED Chapel Hill Transit ridership has increased Buses operate every 4 minutes and have standing room only Exceeding seated capacity by 12% Corridor Need 1 by more than 20 percent between
Market Factors and Demand Analysis. World Bank
 Market Factors and Demand Analysis Bank Workshop and Training on Urban Transport Planning and Reform. Baku, April 14-16, 2009 Market Factors The market for Public Transport is affected by a variety of
WEST AND SOUTH WEST RING ROAD DOWNSTREAM TRAFFIC IMPACTS
 Page 1 of 9 EXECUTIVE SUMMARY Alberta Transportation ( AT ) is preparing to construct the final sections of the Calgary Ring Road. This includes the South West Ring Road ( SWRR ) (from Lott Creek Blvd
Looking Ahead and Looking Back: An Examination of NJDOT s and NJT s 2014 Capital Program
 Looking Ahead and Looking Back: An Examination of NJDOT s and NJT s 2014 Capital Program The New Jersey Department of Transportation s (NJDOT) and New Jersey TRANSIT s (NJT) Transportation Capital Program
US 19 Pedestrian and Bicycle Safe Access to Transit Corridor Study
 US 19 Pedestrian and Bicycle Safe Access to Transit Corridor Study DRAFT Technical Memorandum #6 Cost and Benefit Evaluation Methodology August 2016 Prepared for: FLORIDA DEPARTMENT OF TRANSPORTATION DISTRICT
Typical Rush Hour Commute. PennyforTransportation.com
 Typical Rush Hour Commute In the News Overview of the Plan Collaborative plan with projects in every community Prioritizing connectivity and congestion relief Dedicated transportation-specific funding;
Pavement Management Report. City Council Meeting of May 21, 2013
 Pavement Management Report City Council Meeting of May 21, 2013 Previous Meetings Summary In February, we presented the 2012 pavement survey and our consultant presented general pavement management strategies
Everett Transit Action Plan. Community Open House November 16, 2015
 Everett Transit Action Plan Community Open House Everett has a great location, but getting around the city and into surrounding communities is a problem for all ages Many Voices, One Future: The Everett
Highway 217 Corridor Study. Phase I Overview Report
 Highway 217 Corridor Study Phase I Overview Report November 3, 24 BACKGROUND AND OVERVIEW Study purpose The Highway 217 Corridor Study is developing multi-modal transportation solutions for traffic problems
Standing Committee on Policy and Strategic Priorities
 POLICY REPORT Report Date: January 15, 2019 Contact: Steve Brown Contact No.: 604.873.9733 RTS No.: 12955 VanRIMS No.: 08-2000-20 Meeting Date: January 30, 2019 TO: FROM: SUBJECT: Standing Committee on
Ujari Mohite. Vijay Mahal and Vincent Sanders. Revised Ridership Forecasts for the Uptown DBL project. Date: August 17, 2015 INTRODUCTION/SUMMARY:
 To: From: Subject: Ujari Mohite Vijay Mahal and Vincent Sanders Revised Ridership Forecasts for the Uptown DBL project Date: August 17, 2015 INTRODUCTION/SUMMARY: This memorandum presents updated ridership
Attachment One. Integration of Performance Measures Into the Bryan/College Station MPO FY 2019 FY 2022 Transportation Improvement Program
 Attachment One Integration of Performance Measures Into the Bryan/College Station MPO FY 2019 FY 2022 Transportation Improvement Program Introduction Begun as part of the Moving Ahead for Progress in the
Findings. TSTC went line-by-line through the STIP and categorized projects into 15 categories:
 Tracking the Dollars 2012-2015: A Review of Planned Transportation Investments in Connecticut and what it says about Connecticut s transportation priorities The Connecticut Department of Transportation
Where We Live and Work Today
 San Diego Forward: The 2019-2050 Regional Plan Network Concepts Transportation Committee Item 4 October 19, 2018 Where We Live and Work Today 2018 2 2019 Regional Plan Transportation Committee Item 4 October
ANNEX1 The investment required to achieve the Government s ambition to double cycling activity by 2025
 ANNEX1 The investment required to achieve the Government s ambition to double cycling activity by 2025 May 2016 About Sustrans Sustrans makes smarter travel choices possible, desirable and inevitable.
PUBLIC TRANSPORTATION PLAN FOR THE CITY OF GEORGETOWN
 PUBLIC TRANSPORTATION PLAN FOR THE CITY OF GEORGETOWN PRESENTATION TO CITY COUNCIL JANUARY 22, 2008 PUBLIC TRANSIT FOR THE CITY OF GEORGETOWN LOCAL SERVICE For Georgetown residents to Georgetown destinations.
Regional Alternatives Analysis. Downtown Corridor Tier 2 Evaluation
 Regional Alternatives Analysis Downtown Corridor Tier 2 Evaluation September 19, 2011 EVALUATION PROCESS REVIEW OF EVALUATION PROCESS Tier 1: Screen Seven Alignment Options into a Short List Tier 2: Evaluate
Public Consultation Centre For. Transportation Master Plan Update. Information Package
 Public Consultation Centre For Transportation Master Plan Update Information Package Date Location Hours Tuesday, September 12, 2017 Wednesday, September 13, 2017 Tuesday, September 19, 2017 Cambridge
February 2018 METRO TRANSIT RIDERSHIP AUDIT PROGRAM EVALUATION AND AUDIT
 February 2018 METRO TRANSIT RIDERSHIP AUDIT PROGRAM EVALUATION AND AUDIT INTRODUCTION Background Each weekday, Metro Transit provides more than 250,000 rides across 131 routes. This includes urban local
Canarsie Tunnel Repairs: Planning Ahead for the Crisis
 Canarsie Tunnel Repairs: Planning Ahead for the Crisis Beginning in April 2019, the Canarsie Tunnel between Brooklyn and Manhattan will close for 15 months, affecting over 400,000 daily riders of the L
TULSA CITY COUNCIL CAPITAL IMPROVEMENT PROGRAM TASK FORCE MEETING JANUARY
 CITY OF TULSA BICYCLE & PEDESTRIAN INFRASTRUCTURE TULSA CITY COUNCIL CAPITAL IMPROVEMENT PROGRAM TASK FORCE MEETING JANUARY 31, 2013 CITY OF TULSA ENGINEERING SERVICES DEPARTMENT CITY OF TULSA ADA TRANSITION
South King County High-Capacity Transit Corridor Study
 HIGH-CAPACITY TRANSIT CORRIDOR STUDY South King County Corridor South King County High-Capacity Transit Corridor Study Corridor Report August 2014 South King County High Capacity Transit Corridor Report
Reversible Elevated Express Lanes. A Solution for Urban Traffic Congestion
 Lee Roy Selmon Crosstown Expressway Reversible Elevated Express Lanes A Solution for Urban Traffic Congestion Martin Stone, Ph.D., AICP Director of Planning Tampa-Hillsborough Expressway Authority Pensacola
5. RUNNINGWAY GUIDELINES
 5. RUNNINGWAY GUIDELINES These guidelines should be considered collectively when making runningway decisions. A runningway is the linear component of the transit system that forms the right-of-way reserved
COST ESTIMATION. Fully Allocated Causal Factor Models Temporal Variation Models Incremental Fixed Variable Cost Models
 COST ESTIMATION Outline 1. Roles for Cost Models 2. Conventional Model Types Fully Allocated Causal Factor Models Temporal Variation Models Incremental Fixed Variable Cost Models 3. New Approaches HASTUS
METRO Now. Transit Leader. One of only four urban. gain bus ridership in Purple and Green Lines. Red Line is one
 Transit Leader Our commuter buses provide 8 million trips each year third most trips of any U.S. transit agency. 1 One of only four urban transit agencies in the country to gain bus ridership in 2016 2
Secondary Road Program
 Secondary Road Program Joint Legislative Transportation Oversight Committee October 5, 2012 1 Secondary Roads Program The Big Picture The Secondary Road System Needs and Project Types Paved and Unpaved
Arlington County 10-Year Transit Development Plan & Premium Transit Network Briefing. May 2016
 Arlington County 10-Year Transit Development Plan & Premium Transit Network Briefing May 2016 Overview 10-Year Transit Development Plan Premium Transit Network Columbia Pike service concept Premium amenities
NEED FOR ADDITIONAL FUNDING
 Measure B BACKGROUND 2013: Vision for a supplement to Measure A that prioritizes local roads & regional capital projects Plan developed by Professional Advisory Group Consensus recently built on RT O&M
New Mexico Transportation Funding Challenges
 New Mexico Transportation Funding Challenges Rocky Mountain Pavement Preservation Partnership Meeting October 29-31, 2008 Ernest Archuleta, P.E. Field Operations Division Director 1 NMDOT DISTRICT OFFICES
Progress with the Road Investment Strategy
 Report by the Comptroller and Auditor General Department for Transport and Highways England Progress with the Road Investment Strategy HC 1056 SESSION 2016-17 22 MARCH 2017 4 Key facts Progress with the
1.221J/11.527J/ESD.201J TRANSPORTATION SYSTEMS FALL 2003 FINAL EXAMINATION. 1. Open-book and open-notes, calculators are fine -- no laptops.
 1.221J/11.527J/ESD.201J TRANSPORTATION SYSTEMS FALL 2003 FINAL EXAMINATION Instructions: PROFESSOR JOSEPH M. SUSSMAN (LECTURER) 1. Open-book and open-notes, calculators are fine -- no laptops. 2. The exam
TOWARDS A BIKE-FRIENDLY CANADA A National Cycling Strategy Overview
 TOWARDS A BIKE-FRIENDLY CANADA A National Cycling Strategy Overview NationalCyclingStrategFrameworkv3.indd 1 Potential for this modal shift can be found in municipalities of all sizes, in every population
CITY OF HAMILTON PUBLIC WORKS DEPARTMENT Transit Division
 CITY OF HAMILTON PUBLIC WORKS DEPARTMENT Transit Division TO: Chair and Members Public Works Committee COMMITTEE DATE: June 4, 2018 SUBJECT/REPORT NO: WARD(S) AFFECTED: PREPARED BY: SUBMITTED BY: Mountain
Public Transportation and Bicycle & Pedestrian Stakeholder Webinar. April 11, :30 PM
 Public Transportation and Bicycle & Pedestrian Stakeholder Webinar April 11, 2013 1:30 PM Public Transportation and Bicycle & Pedestrian Webinar April 11, 2013 1:30 PM MULTIMODAL TRANSPORTATION PLAN Vision,
Rhode Island Moving Forward Long-Range Transportation Plan 2040 Municipal Roundtable Newport County
 Rhode Island Moving Forward Long-Range Transportation Plan 2040 Municipal Roundtable Newport County www.planri.com PlanRI2040@gmail.com Municipal Roundtable Meeting Summary Date/time: Location: Wednesday,
Corporate. Report COUNCIL DATE: June 26, 2006 NO: C012 COUNCIL-IN-COMMITTEE. TO: Mayor & Council DATE: June 22, 2006
 Corporate NO: C012 Report COUNCIL DATE: June 26, 2006 COUNCIL-IN-COMMITTEE TO: Mayor & Council DATE: June 22, 2006 FROM: General Manager, Engineering FILE: 0410-20(MoT/Gate) SUBJECT: Surrey Response on
APPENDIX C. Systems Performance Report C-1
 APPENDIX C Systems Performance Report C-1 System Performance Report & Requirements According to the FAST Act, a long range transportation plan needs to include a system performance report and subsequent
Arterial Transitway Corridors Study. Sept. 26, 2011
 Arterial Transitway Corridors Study Sept. 26, 2011 Purpose of Study Study 11 urban corridors in Minneapolis, St. Paul and surrounding communities Develop service and facilities plan to improve Transit
Experience from India Future Perspectives
 Experience from India Future Perspectives The 2 nd Asia BRTS Conference September 29 and 30, 2014 Amdavad Prof. Shivanand Swamy Executive Director Centre of Excellence in Urban Transport, CEPT University
Transportation Master Plan Advisory Task Force
 Transportation Master Plan Advisory Task Force Network Alternatives & Phasing Strategy February 2016 BACKGROUND Table of Contents BACKGROUND Purpose & Introduction 2 Linking the TMP to Key Council Approved
Virginia Beach Transit Extension Study Draft Environmental Impact Statement Town Center Alignment Alternative Public Informational Meetings September
 Virginia Beach Transit Extension Study Draft Environmental Impact Statement Town Center Alignment Alternative Public Informational Meetings September 22 and 24, 2014 Presentation 1. Project Background
WHITE PAPER: TRANSIT SERVICE FOR SOUTH SHAGANAPPI
 9/27/2012 TRANSIT PLANNING WHITE PAPER: TRANSIT SERVICE FOR SOUTH SHAGANAPPI 2012 Calgary Transit 1 Table of Contents Purpose... 3 Area of Change... 3 Background... 3 Access to destinations... 5 Connecting
Technical Working Group November 15, 2017
 Technical Working Group November 15, 2017 Welcome and Introductions Project Partners Regional Transportation District (RTD) Colorado Department of Transportation (CDOT) Denver Regional Council of Governments
Transportation Infrastructure Systems Needs and Challenges: Progress Report
 Transportation Infrastructure Systems Needs and Challenges: Progress Report Alabama House Speaker Mac McCutcheon Justice Smyth Outreach Director Steven Polunsky TPRC Director Shashi Nambisan Executive
SUMMARY APPROACH. xiii
 SUMMARY The U.S. Navy and the U.S. Maritime Administration (MARAD) together preside over a fleet of some 450 retired naval vessels and merchant ships that grows each month as ship retirements continue.
Purpose and Need. Chapter Introduction. 2.2 Project Purpose and Need Project Purpose Project Need
 Chapter 2 Purpose and Need 2.1 Introduction The El Camino Real Bus Rapid Transit (BRT) Project (Project) would make transit and other transportation improvements along a 17.6-mile segment of the El Camino
1/30/2019 DRAFT. January 31, Item #1 CITIZENS PARTICIPATION
 January 31, 2019 Item #1 CITIZENS PARTICIPATION 1 Item #2 APPROVAL OF MINUTES Item #3 TRAC GOALS, FRAMEWORK & AGENDA REVIEW 2 COMMITTEE GOALS Learn about Southern Nevada s mobility challenges, new developments
Community Task Force November 15, 2017
 Community Task Force November 15, 2017 Welcome and Introductions Project Partners Regional Transportation District (RTD) Colorado Department of Transportation (CDOT) Denver Regional Council of Governments
INNER LOOP EAST. AIA Rochester Annual Meeting November 13, 2013 TRANSFORMATION PROJECT. Bret Garwood, NBD Erik Frisch, DES
 INNER LOOP EAST TRANSFORMATION PROJECT AIA Rochester Annual Meeting November 13, 2013 Bret Garwood, NBD Erik Frisch, DES Why? We are building a city that encourages walking, biking and enjoying the outdoor
San Francisco s Capital Plan & the Mayor s Transportation Task Force 2030: Funding the next steps for transportation
 San Francisco s Capital Plan & the Mayor s Transportation Task Force 2030: Funding the next steps for transportation San Francisco Capital Needs In 2006, the Mayor and Board of Supervisors approved San
BRIDGE REPLACEMENT AND REHABILITATION PROGRAM
 BRIDGE REPLACEMENT AND REHABILITATION PROGRAM INTRODUCTION An integral element of the City's transportation infrastructure is a network of bridges designed to carry vehicular, railroad, light rail, pedestrian,
Application of SUTI in Colombo (Western Region)
") Application of SUTI in Colombo (Western Region) Dr Dimantha De Silva Senior Lecturer, University of Moratuwa Capacity Building Workshop on Sustainable Urban Transport Index (SUTI) 30 th & 31 st October
Application of SUTI in Colombo (Western Region) Dr Dimantha De Silva Senior Lecturer, University of Moratuwa Capacity Building Workshop on Sustainable Urban Transport Index (SUTI) 30 th & 31 st October
North Carolina Transportation Issues
 North Carolina Transportation Issues David T. Hartgen, Ph.D., P.E. Emeritus Professor of Transportation Studies UNC Charlotte Remarks at the Shaftesbury Lecture John Locke Foundation Raleigh, North Carolina
Craig Rempp, Transit Superintendent Mary Karlsson, Kimley-Horn. Mankato City Council Meeting 6/25/2018
 Craig Rempp, Transit Superintendent Mary Karlsson, Kimley-Horn Mankato City Council Meeting 6/25/2018 What is a Transit Development Plan (TDP)? Engagement Issues Goals, objectives, design guidelines and
Keep Placer Moving. Placer is Growing. POPULATION (From 2014 to 2045) 70,000 new homes and well over 180,000 more residents
 70,000 new homes and well over 180,000 more residents") Keep Placer Moving Placer is Growing Keep Placer Moving POPULATION (From 2014 to 2045) 70,000 new homes and well over 180,000 more residents 30% of the total housing market growth in the Sacramento region.
Keep Placer Moving Placer is Growing Keep Placer Moving POPULATION (From 2014 to 2045) 70,000 new homes and well over 180,000 more residents 30% of the total housing market growth in the Sacramento region.
Midtown Corridor Alternatives Analysis
 Midtown Corridor Alternatives Analysis Ridership Forecast Methodology and Results December 2013 Prepared by the SRF Consulting Group Team for Table of Contents Introduction... 1 Methodology... 1 Assumptions...
CHAPTER 7.0 IMPLEMENTATION
 CHAPTER 7.0 IMPLEMENTATION Achieving the vision of the Better Streets Plan will rely on the ability to effectively fund, build and maintain improvements, and to sustain improvements over time. CHAPTER
TriMet Review of Debunking Portland: The Public Transit Myth September 2007
 TriMet Review of Debunking Portland: The Public Transit Myth September 2007 In his recent paper, Debunking Portland: The Public Transit Myth dated August 28, 2007, posted on the Cato Institute web site,
GOVERNMENT OF SASKATCHEWAN SUBMISSION TO THE RAILWAY SAFETY ACT REVIEW PANEL
 GOVERNMENT OF SASKATCHEWAN SUBMISSION TO THE RAILWAY SAFETY ACT REVIEW PANEL Saskatchewan Highways & Transportation May 29, 2007 I Introduction Government of Saskatchewan Submission To the Railway Safety
Regional Transportation Needs Within Southeastern Wisconsin
 Regional Transportation Needs Within Southeastern Wisconsin #118274 May 24, 2006 1 Introduction The Southeastern Wisconsin Regional Planning Commission (SEWRPC) is the official areawide planning agency
The City of Toronto s Long-Term Financial Direction
 The City of Toronto s Long-Term Financial Direction Introduction The City has been able to achieve balanced budgets on an annual basis, despite underlying concerns regarding sustainability. The staff report:
APPENDIX B.2 TABLE 2 CITY OF TORONTO PRELIMINARY DRAFT DEVELOPMENT-RELATED CAPITAL PROGRAM TRANSIT (BALANCE) Grants/ Subsidies/Other Recoveries
 Grants/ Subsidies/Other Recoveries") PRELIMINARY DRAFT DEVELOPMENTRELATED CAPITAL PROGRAM Description 0 Related s 2.0 2.1 STREETCAR RELATED INFRASTRUCTURE 2.1.1 Surface Track 2.1.1.1 King/Queen/Roncesvalles Modifications Subtotal Surface
PRELIMINARY DRAFT DEVELOPMENTRELATED CAPITAL PROGRAM Description 0 Related s 2.0 2.1 STREETCAR RELATED INFRASTRUCTURE 2.1.1 Surface Track 2.1.1.1 King/Queen/Roncesvalles Modifications Subtotal Surface
Fiscal Impact of SunTrust Park and The Battery Atlanta on Cobb County Executive Summary Sept. 18, 2018
 Fiscal Impact of SunTrust Park and The Battery Atlanta on Cobb County Executive Summary Sept. 18, 2018 Overview Historically, professional sports stadiums were privately owned by the sports teams that
1.146 Engineering Systems Analysis for Design Application Portfolio: Construction of a New Rapid Transit Corridor
 1.146 Engineering Systems Analysis for Design Application Portfolio: Construction of a New Rapid Transit Corridor André Carrel December 2008 1 Abstract This application portfolio evaluates design options
Philadelphia Bus Network Choices Report
 Philadelphia Bus Network Choices Report JUNE 2018 SEPTA Table of Contents Executive Summary...7 What if transit gave us more freedom?... 8 What is this report?... 8 The main conclusions... 9 What is happening
WELCOME BUS RAPID TRANSIT PUBLIC MEETING. MEETING TIME: 5 p.m. - 8 p.m.
 WELCOME BUS RAPID TRANSIT PUBLIC MEETING MEETING TIME: 5 p.m. - 8 p.m. Milwaukee County in conjunction with the Federal Transit Administration is hosting today s meeting to give the public an opportunity
Community Engagement Process
 Community Engagement Process PHASE ONE PURPOSE + NEED STATEMENT IDEAS DESTINATIONS TRAVEL PATTERNS PHASE TWO MODE SELECTION INPUT PHASE THREE LOCALLY PREFERRED ALTERNATIVE SELECTION OF PREFERRED ALTERNATIVE
Priced Managed Lanes in America. October 2013
 Priced Managed Lanes in America October 2013 1 Priced Managed Lanes What are they? Where are they? Why do them? When to do them? Common issues Lessons learned What are Priced Managed Lanes? The subset
Integrated Corridor Approach to Urban Transport. O.P. Agarwal World Bank Presentation at CODATU XV Addis Ababa, 25 th October 2012
 Integrated Corridor Approach to Urban Transport O.P. Agarwal World Bank Presentation at CODATU XV Addis Ababa, 25 th October 2012 What is the Integrated Corridor Approach for Urban Transport Public? Why
York Region Population and Employment Growth
 March 1, 2016 1 York Region Population and Employment Growth York Region needs to comply with The Provincial Growth Plan and new forecasts introduced to 2036 and 2041 2 Regional Official Plan Review York
Preview. Tables in your paper Mass Transit as alternative to auto California s problems in urban transportation
 Preview Tables in your paper Mass Transit as alternative to auto California s problems in urban transportation Integrating tables in your writing Commuting in Urban Areas Last time auto and congestion
Reserve Analysis for < hoa name> HOA
 10 June 2016 Reserve Analysis for < hoa name> HOA Capital Replacement Analysis and Funding Plan Fiscal Year 2016 2016 SB Consulting The HOA has a responsibility to establish and maintain a Replacement
Transportation Day at the Capitol. Charlie Zelle Commissioner, MnDOT Feb. 16, 2017
 Transportation Day at the Capitol Charlie Zelle Commissioner, MnDOT Feb. 16, 2017 State Transportation System Highways 59.1 billion annual vehicle miles traveled 33.1 billion on trunk highways Bridges
Title. Metropolitan Council Transportation Committee December 12, Brad Larson Metro District MnDOT
 Title Metropolitan Council Transportation Committee December 12, 2016 Evaluating the potential for Bus Rapid Transit and MnPASS Express Lanes in the southwest Metro Brad Larson Metro District MnDOT Background
Bus Rapid Transit Plans
 Twin Cities Region Bus Rapid Transit Plans ULI Minnesota Workshop Connecting Bus Rapid Transit to the Community December 15, 2009 John Levin Director of Service Development Metro Transit Metropolitan Area
Transit Workshop with MPO Board
 Transit Workshop with MPO Board Overview of Workshop What is a TDP? Historical trends Existing bus service 2028 Recent public outreach Future direction Policy Questions 1 What TDP is Not Not a budget Not
Urban Transport Service Level Benchmarking in Urban Transport for Indian Cities
 Urban Transport Service Level Benchmarking in Urban Transport for Indian Cities Ahmedabad Bhubaneswar Hubli-Dharwad Kohima Mysore Surat An Initiative of the, Government of India Presented by Prof. H.M.
BUS RAPID TRANSIT. A Canadian Perspective. McCormick Rankin International. John Bonsall P.Eng
 BUS RAPID TRANSIT A Canadian Perspective Why choose BRT? Because it is a practical and cost effective rapid transit solution for the most common types of land use in urban Canada Operating experience shows
January 2019 FY Key Performance Report
 January 2019 FY 2019 - Key Performance Report Management Notes: The information in this report is based on the FY 2019 Operating Budget, adopted by the Board on June 11, 20. RT s farebox recovery ratio