The Good, The Bad and The Ugly: Planning for Reduced Car Dependence in European and Other Global Cities
|
|
|
- Corey Harris
- 5 years ago
- Views:
Transcription


, Curtin")

1 The Good, The Bad and The Ugly: Planning for Reduced Car Dependence in European and Other Global Cities Jeffrey Kenworthy Professor in Sustainable Cities Frankfurt University of Applied Sciences, Frankfurt, Germany Curtin University Sustainability Policy Institute (CUSP), Curtin University, Perth, Western Australia Presented to: Ballungsräume Europas, Frankfurt University of Applied Sciences, May 16, 2017
2 OUTLINE An overview of comparative data on cities using selected key variables (American, Canadian, Australian, European and Asian cities). Major changes in urban transport in recent years. Peak car use, nationally and in cities Decoupling of GDP from growth in car use An insight into the concept of Automobile, Transit and Walking City fabrics and how recognising, respecting and rejuvenating different urban fabrics can lead to better planning and transport outcomes for cities. Some brief conclusions and overall policy implications What are some key things that cities should do to become more sustainable in passenger transport?

3 Urban form factors - Urban density - Proportion of jobs in CBD Economic factors - Metropolitan gross domestic product per person - Average user cost of a car trip - Average user cost of a public transport trip - Total passenger transport cost as a percentage of GDP - Ratio of annual investment in public versus private transport Private transport infrastructure factors - Length of freeway per person - Parking spaces per 1000 CBD jobs - Total cars + motor cycles per person Public transport infrastructure factors - Total length of reserved public transport route per person - Total length of reserved public transport route per urban ha - Ratio of reserved public transport infrastructure versus freeways Private transport use and performance factors - Total car+motor cycle+taxi passenger kilometres per person - Ratio of system average public transport speed versus private transport speed Public transport service and use and non-motorised mode use factors - Total public transport seat kilometres of service per person - Total public transport boardings per person - Proportion of total motorised passenger kilometres on public transport - Proportion of total daily trips by public transport - Proportion of total daily trips by non-motorised modes Energy and externality factors - Total private and public transport passenger energy use per person - Total CO2 emissions per person from passenger transport (kg) - Total emissions of CO, HC, NOx and SO2 per person (kg) - Total emissions of CO, HC, NOx and SO2 per urban hectare (kg) - Total transport deaths per 100,000 people - Total transport deaths per billion passenger kilometres A small sample of the kind of data that are collected and compared for cities.
4 Metropolitan Areas Represented in Trends Data Australian Metropolitan Areas Perth Melbourne Brisbane Sydney Canadian Metropolitan Areas Vancouver Calgary Montreal Ottawa Toronto American Metropolitan Areas Atlanta Chicago Denver Houston Los Angeles New York Phoenix San Diego San Francisco Washington Seattle Portland New Orleans European Metropolitan Areas Berlin Frankfurt Hamburg Munich Stuttgart Zurich Copenhagen Helsinki Oslo Stockholm London Manchester Graz Bern Prague Düsseldorf Geneva Vienna Madrid Brussels Paris Asian Metropolitan Areas Hong Kong Singapore Last three US cities and Paris are not in trends graphs, only detailed city graphs Total 45 cities

5 Much of the data shown in this presentation and more are in our book released in August 2015 Paris has comparatively high per capita GDP but not very high car dependence..


6 Metro GDP per Capita, 2005 GDP of metro areas is not a major determinant of their sustainability in transport or mobility patterns. There are many high income cities with quite low car use and many high income cities with high car use. Many European cities have comparatively high per capita GDP but comparatively low car dependence.


7 Car Ownership 2005 Car ownership is important, but not as critical as how much cars are used In a global perspective European cities have medium levels of car ownership.


8 Car Use 2005 Car passenger kilometres of travel per capita actually declined from 1995 to 2005 in 14 metro regions: Atlanta Houston Los Angeles Melbourne Toronto Montreal Calgary Hamburg Stockholm London Vienna Graz Hong Kong Paris ( ) In a moment I want to explore some of the factors that influence the level of automobile dependence in cities, as reflected in these car travel data.

9 Car Use Trend in 41 Global Cities, to Let s now consider this question of the peaking of car use and its decoupling from GDP. There is now strong evidence that cities in the developed world are peaking in car use.

10 Peaking of car use in wealthier cities has had a long gestation period. Car Use Trend 1960 to 2005 The percentage growth in car VKT per person has been getting less and less with each passing decade. Car use growth trends in developed cities from 1960 to 2005 using Global Cities Database.

11 Car Use (VMT) Appears to Have Peaked in the USA as a Whole Source: retrieved April 1, 2017
12 National Peak Travel in Various Countries Bureau of Infrastructure, Transport and Regional Economics (2012a) Traffic Growth: Modelling a Global Phenomenon, Report 128, BITRE, Canberra, Australia. Data are based on all vehicle types.
13 In Australian Cities, Car Use Appears to Have Peaked (Estimated Car Passenger Kilometres per Annum) Peak Car Use in Australian Cities: A Sustained Trend. (graphic created by James McIntosh from BITRE, Canberra data) Note: Passenger kilometres for Australian cities in this graph are only for the passenger car class of vehicle, whereas our own comparisons also include the light commercial vehicle class because it is used heavily for private passenger travel in Australian cities (as with light duty trucks in US cities).

14 Decoupling of GDP from driving is very pronounced in some US cities. Kooshian, C. and Winkelman, S. (2011) Recent trends in the travel intensity of the US economy. Center for Clean Air Policy, Washington DC. (available at: - accessed July 7, 2013)
15 Urban Car Use Has Decoupled From Metropolitan GDP Growth Kenworthy, J. (2013) Decoupling urban car use and metropolitan GDP growth. World Transport Policy and Practice 19 (4) Cities are requiring less car travel to generate their GDP. Only 3 cities out of 42 in this study increased in this factor. These were cities whose GDP per capita had hardly increased. It has also happened already in Taipei and Sao Paulo and perhaps is happening in other rapidly motorising cities.
16 Factors behind peak car use in cities from our analysis Modelling of trends in car VKT for our global cities database from 1960 to 2000, shows that the changes can be primarily explained by urban density and transit service levels 1. Sprawl has reversed in many cities and metropolitan densities are increasing. There is a strong power function linking car use and urban density (shown next) Growth of a culture of urbanism: People are moving back into central city and inner city areas in search of a live/work/play urban environment with less car use, not long car commutes from the suburbs in congested traffic. Young people are getting fewer driver s licenses and are driving less, preferring to spend money on public transport, mobile devices and more central living (as well as more holiday travel). Public transport is growing rapidly in use, particularly in urban rail and one passenger km on public transport replaces multiple car vehicle kms (the transit leverage effect due to trip chaining). The price of fuel may be having an effect, as may increased tele-commuting/work-at-home. Automobile cities have hit a travel time and distance wall. There is too much traffic and cities cannot maintain a reasonable daily travel time budget of 65 to 70 minutes per person per day (Marchetti constant) unless they restructure with faster public transport and transit-oriented development. Communities are now being built more around walking, cycling and public transport to meet daily needs within the travel time budget. Many cities are aging. People in their 70s drive about 50% as much as people from 20 to 50 years. 1. McIntosh, J., Trubka, R., Kenworthy, J. and Newman, P. (2014) The role of urban form and transit in city car dependence: analysis of 26 global cities from Transportation Research D, 33:
17 The changes needed in cities today to reduce automobile dependence relate very strongly to minimising the creation of new Auto City fabric, while recognising, respecting and rejuvenating existing Walking and Transit City fabric and creating new Transit and Walking City fabric, especially in auto-dominated areas of every city. See Newman, Kosonen and Kenworthy (2016) Theory of urban fabrics: planning the walking, transit/public transport and automobile/motor car cities for reduced car dependency. Town Planning Review 87 (4) The power function link between urban density and per capita energy use/car use


18 In a global perspective, European urban regions are medium in density. A major aim in many cities is to increase density in selected locations by creating more walking and transit city fabric (e.g. transitoriented development or TOD in focused locations and through minimising urban sprawl). Urban Density 2005 The correlation between urban density and car/energy use in the wealthy cities is very strong. Cities must find ways of strategically raising densities to develop more sustainable transport systems.


19 Vällingby and Kista, Stockholm are examples of new Transit and Walking City fabric.


20 European cities are generally highly decentralised in jobs which makes them easier to service with transit.


21 Centralised work locations are much easier to service with public transport and non-motorised modes than sprawling decentralised patterns which are car-dominated. Low density areas, such as below, need to have new Transit and Walking City Fabric injected into them through new transit systems and TOD built around them. Melbourne s denser CBD and inner suburbs are well-served by trains and trams and are walkable. Jobs in the suburbs are typically accessed by cars.

22 Where jobs outside the central area are concentrated into strong sub-centres linked to public transport, auto dependence can be reduced. Vancouver has some noticeable examples of de-centralised concentration around rail stations, with a mixture of jobs and residential uses.

23 Freeway Supply It has been known for decades that building more freeways pushes cities towards higher automobile dependence and less sustainable transport. European cities have on average moderate provision of freeways, though some are surprisingly wellendowed and others with very little freeway. Cities need to minimise, stop or even reverse their supply of freeways, especially to restore Walking and Transit City Fabrics.


24 Impacts of freeways One freeway clover leaf occupies the same area as a typical medieval walking city such as Salzburg. This is an example of how the imposition of Auto City Fabric has destroyed the old Transit and Walking City Fabrics of countless cities.


25 In Seoul they tore down 5.8 km of elevated freeway and surface road carrying a combined 170,000 vehicles per day. Average speed in Seoul increased!!. Traffic behaves like a gas, not like a liquid.


26 Seoul has removed a key element of Auto City Fabric imposed on the city in the 1960s and rejuvenated the Transit and Walking City Fabrics in its centre.


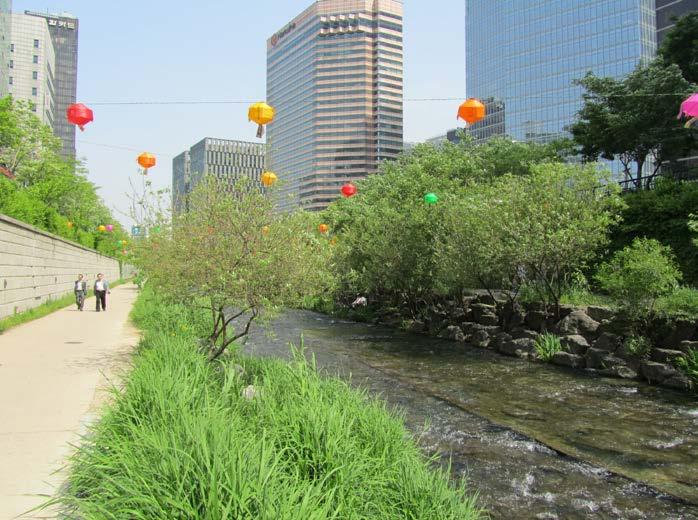
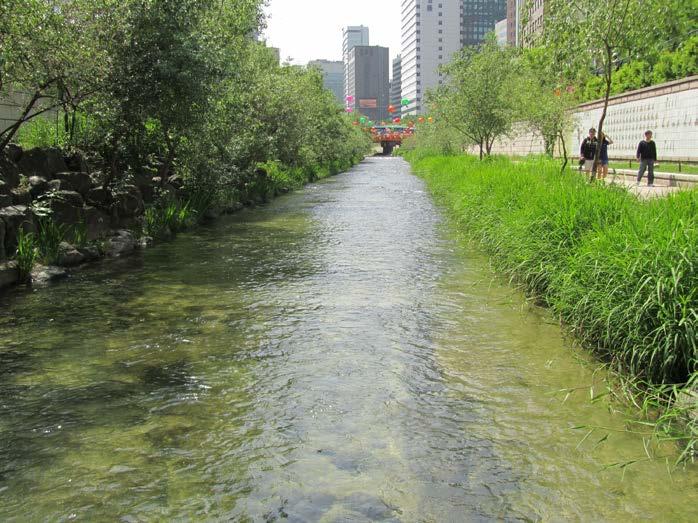
27 Cheonggyecheon River restoration, Seoul, South Korea


28 Vancouver (Skytrain) Stockholm Stockholm Many cities are adding significant amounts of new reserved route for transit, mainly new rail systems, both LRT and regular rail (including in China, India, Canada, Middle East). European cities generally have a lot of reserved route for transit.


 City Fabrics")
29 Budapest New LRT in Portland Helsinki- effective tram right-of-way Reserved rights-of-way are critical for transit and can help cities rejuvenate Auto City Fabric with new Transit (and Walking) City Fabrics New LRT in Stockholm


30 Public transport service levels in European cities are mostly relatively high with some exceptions, such as Manchester and Geneva.


31 Munich Public Transit Use High usage of public transport is a key feature of cities with more integration of development around public transport stops, especially rail stations. European cities are amongst the best in the world for transit use (together with many Asian cities). Former Eastern European cities such as Prague have extraordinary use.


32 Joyce Station, Vancouver, 2004 Joyce Station, Vancouver, 1987 Rail can be very powerful in influencing the form and scale of development
33 Bus and Rail Tends 1995 to 2005 USA bus: +2.7% USA rail: +21.7% CAN bus: +2.1% CAN rail: +17.8% AUS bus: +4.8% AUS rail: +6.4% EUR bus: +5.8% EUR rail: +10.4% ASIA bus: -13.2% ASIA rail: +11.2% A very significant increase is occurring in urban rail systems worldwide not just in usage, but in new rail systems throughout China, India and elsewhere. Canada is on the verge of the biggest increase in urban rail network in its history with new lines in Vancouver, Toronto, Ottawa and other parts of Ontario.


34 A New Golden Age of Rail 82 Chinese cities are building metros and nationally there is a large and growing high speed rail network between cities. Shanghai and Beijing now have the largest metro systems in the world, mostly built in the last 20 years. 51 Indian cities are building metros Increasing numbers of Middle eastern cities are building rail for first time (Dubai, Riyadh, etc) Cities in Europe are expanding rail lines (e.g. Paris circle LRT lines) Usage of urban rail systems is growing strongly.


35 European cities have the best levels of walking and cycling in the world. Modal Split to Walking and Cycling Improving conditions for pedestrians and cyclists is essential to the development of more sustainable transport.
36 Conclusions Sustainable Transport is a Package Deal. Lower car use cities have less car ownership, more competitive public transport, more public transport use, more walking and cycling, less parking, higher density housing, fewer freeways, more higher quality transit lines, lower energy use and emissions and so on. There is, however, little relationship to wealth. Some important things that cities need to do to move beyond automobile dependence revolve around minimising Auto City Fabric and maximising Transit and Walking City Fabric : Increase densities strategically around transit stops; Build more high quality transit infrastructure, especially rail; Improve their urban centres and enhance their public spaces for pedestrians and cyclists; Stop building destructive freeways and even take out some of the most destructive sections; Introduce vehicle car and bike sharing and car-on-demand schemes to help reduce car ownership (both electric cars and e-bikes); Have Integrated Mobility Management systems that link all modes through IT. Congestion charging
Washington. Berne Oslo Geneva Zurich Paris Sea le Helsinki. Denver Munich Houston Stockholm Copenhagen. Atlanta
 216-1-12 Planning for Peak Car: International Evidence of How Urban Development is Moving Beyond Auto Dependence Jeffrey Kenworthy Professor in Sustainable Cities Curtin University Sustainability Policy
Notes on Transport and Land-use (adapted from Lectures by Suman Maitra, Lecturer, URP, BUET) Table 2: Theoretically expected impacts of land use
 Table 2: Theoretically expected impacts of land use") Notes on Transport and Land-use (adapted from Lectures by Suman Maitra, Lecturer, URP, BUET) Table 2: Theoretically expected impacts of land use Table 3: Theoretically expected impacts of transport Table
Notes on Transport and Land-use (adapted from Lectures by Suman Maitra, Lecturer, URP, BUET) Table 2: Theoretically expected impacts of land use Table 3: Theoretically expected impacts of transport Table
Concept of Sustainable Transport and integrated Land Use Planning- An Overview. Manfred Breithaupt GIZ Water, Energy, Transport
 Concept of Sustainable Transport and integrated Land Use Planning- An Overview Manfred Breithaupt GIZ Water, Energy, Transport The adverse impacts of growth in motorization - in economic, environmental
Jeffrey Kenworthy, Christina Inbakaran. Curtin University, 1 Kent Street, Bentley, Perth,WA, for correspondence:
 Australasian Transport Research Forum 2011 Proceedings 28-30 September 2011, Adelaide, Australia Publication website: http://www.patrec.org/atrf.aspx Differences in transport and land use in thirteen comparable
Konstantin Glukhenkiy Economic Affairs Officer
 Konstantin Glukhenkiy Economic Affairs Officer Rapid growth of urban areas Very rapid increase in motorisation Substantial increases in traffic congestion Relative decline of public transport usage and
The Theory of Urban Fabrics: Understanding the Science of Planning Ci?es. The Journey. How did I get from Chemistry to Sustainable Transport.?
 The Theory of Urban Fabrics: Understanding the Science of Planning Ci?es By Peter Newman Professor of Sustainability CUSP, Cur?n University The Journey. How did I get from Chemistry to Sustainable Transport.?
Public Transport as a Necessity for Active Transport
 03.05.2017 Seite 1 Public Transport as a Necessity for Active Transport Manfred Breithaupt Urban Transport Consultant to GIZ Active Transport requires an attractive Public Transport System and its Integration
Briefing Paper #1. An Overview of Regional Demand and Mode Share
 2011 Metro Vancouver Regional Trip Diary Survey Briefing Paper #1 An Overview of Regional Demand and Mode Share Introduction The 2011 Metro Vancouver Regional Trip Diary Survey is the latest survey conducted
Exceeding expectations: The growth of walking in Vancouver and creating a more walkable city in the future through EcoDensity
 Exceeding expectations: The growth of walking in Vancouver and creating a more walkable city in the future through EcoDensity Melina Scholefield, P. Eng. Manager, Sustainability Group, City of Vancouver
2017 City RepTrak. The Most Reputable Cities in the World. September 28th, 2017 Nicolas G. Trad
 2017 City RepTrak The Most Reputable Cities in the World September 28th, 2017 Nicolas G. Trad 1 What we are going to see during this webinar: Managing the reputation Cities why and how City RepTrak 2017
Sustainable Transportation Planning in the Portland Region
 Sustainable Transportation Planning in the Portland Region Jennifer Dill, Ph.D. Associate Professor School of Urban Studies & Planning jdill@pdx.edu http://web.pdx.edu/~jdill/ Outline Elements of a sustainable
2. Context. Existing framework. The context. The challenge. Transport Strategy
 Transport Strategy Providing quality connections Contents 1. Introduction 2. Context 3. Long-term direction 4. Three-year priorities 5. Strategy tree Wellington City Council July 2006 1. Introduction Wellington
Public Transport and Development: Making It Work
 Public Transport and Development: Making It Work Robert T. Dunphy Urban Land Institute World Bank Transport Forum 2006 March 28, 2006 Transportation Development Disconnect Now Few Then places w/o car Many
Helsinki. Explaining Active Transportation Success in a City with Winter. Karl Saidla, Ph.D. Candidate, University of Ottawa, Human Kinetics
 Helsinki Explaining Active Transportation Success in a City with Winter Karl Saidla, Ph.D. Candidate, University of Ottawa, Human Kinetics Thanks! University of Ottawa Finland Futures Research Centre-University
Infrastructure and Programs. What does the data say? Advancing Non-motorized Transportation in Vermont 11/15/09
 Advancing Non-motorized Transportation in Vermont A reply from the university point of view Lisa Aultman-Hall Professor and Director Figure 4 Why Canadians Cycle more than Americans: A Comparative Analysis
Extracting Maximum Benefit from Parking Policy - 10 Years Experience in Perth, Australia. By Emmerson Richardson Sinclair Knight Merz
 Extracting Maximum Benefit from Parking Policy - 10 Years Experience in Perth, Australia By Emmerson Richardson Sinclair Knight Merz Snapshot of Perth > Metropolitan Area Population 1.7 million > 3.5 million
Design Principle Active Transport
 Active Transport Definition Active transport includes non-motorised forms of transport involving physical activity, such as walking and cycling. It also includes public transport to meet longer distance
Urban Transport Policy and Planning Documents For Transportation Researchers, Transport Policy Makers and Decision Makers
 Johannesburg Integrated Transport Plan 2003 / 2008: http://www.joburg.org.za/content/view/1250/78/ Africa South Africa Public Transport Action Plan, Phase 1 (2007-2010): Catalytic Integrated Rapid PublicTransport
Ranking Walkable Urbanism in America s Largest Metros
 Ranking Walkable Urbanism in America s Largest Metros The Largest 30 Metros in the United States SHARE OF U.S. POPULATION SHARE OF U.S. GDP 54% 46% 42% 58% LARGEST 30 METROS REST OF U.S. The Old Dichotomy
Coolest Cities Results Summary
 Coolest Cities Results Summary About Coolest Cities Canada s six largest urban areas provide homes and jobs for almost 15 million people, nearly half of our population. Transporting these citizens to and
Public Consultation Centre For. Transportation Master Plan Update. Information Package
 Public Consultation Centre For Transportation Master Plan Update Information Package Date Location Hours Tuesday, September 12, 2017 Wednesday, September 13, 2017 Tuesday, September 19, 2017 Cambridge
Smart Growth, Climate Change and Prosperity Steve Winkelman Chuck Kooshian
 Smart Growth, Climate Change and Prosperity Steve Winkelman Chuck Kooshian Asilomar Transportation & Energy Conference August 31, 2011 CCAP put the third leg of the stool on the policy map. Reducing VMT
How To Encourage More Efficient Transportation in Brazilian Cities
 How To Encourage More Efficient Transportation in Brazilian Cities Todd Litman Victoria Transport Policy Institute Presented Seminar on Discouraging The Use Of Cars São Paulo, Brazil 3 September 2013 Creating
TRANSPORTATION TOMORROW SURVEY
 Clause No. 15 in Report No. 7 of was adopted, without amendment, by the Council of The Regional Municipality of York at its meeting held on April 17, 2014. 15 2011 TRANSPORTATION TOMORROW SURVEY recommends
Walkable Cities. A Presentation by Michalis Lambrinos Ministry of Transport, Communications and Works
 Walkable Cities A Presentation by Michalis Lambrinos Ministry of Transport, Communications and Works Contents What Makes a City Walkable Why is Walkability Important The Theory of Walkability Restrict
Arnold Hinojosa
 Policy Analysis of the Mass Transit Challenges Facing Rapidly Growing Southern and Western Cities and How These Challenges Can Be Addressed Using the Model Set by Chicago Arnold Hinojosa ahinojosa@kentlaw.edu
SUSTAINABILITY, TRANSPORT, & HEALTH. Ralph Buehler, Virginia Tech
 SUSTAINABILITY, TRANSPORT, & HEALTH Ralph Buehler, Virginia Tech Prepared for National Academies Roundtable on Science and Technology for Sustainability 6 December 2013 Overview Trends in Motorization
THE FUTURE OF TEXAS METROPOLITAN AREAS: NO ALTERNATIVES TO ROADWAYS
 THE FUTURE OF TEXAS METROPOLITAN AREAS: NO ALTERNATIVES TO ROADWAYS As traffic congestion has worsened, there has been an increased interest in transportation, mobility and access alternatives to the highway
Economics of Highway Spending and Traffic Congestion. Todd Litman Victoria Transport Policy Institute Presented Strong Towns Webinar 3 February 2016
 Economics of Highway Spending and Traffic Congestion Todd Litman Victoria Transport Policy Institute Presented Strong Towns Webinar 3 February 2016 Motor Vehicle Travel is Peaking Annual Vehicle Mileage
outline 1. why cycle? 2. (safety health) 3. safe system 4. what next
 3. safe system 4. what next") outline 1. why cycle? 2. (safety health) 3. safe system 4. what next In a city of many cyclists, why do they ride? Copenhageners reasons for cycling to and from work (multiple answers) 56% it s faster
outline 1. why cycle? 2. (safety health) 3. safe system 4. what next In a city of many cyclists, why do they ride? Copenhageners reasons for cycling to and from work (multiple answers) 56% it s faster
Travel Patterns and Cycling opportunites
 Travel Patterns and Cycling opportunites The Household Travel Survey is the largest and most comprehensive source of information on the travel patterns of residents of the Sydney Greater Metropolitan Area
Child- and Youth-friendly Land-use and Transport Planning Guidelines
 Child- and Youth-friendly Land-use and Transport Planning Guidelines Richard Gilbert Centre for Sustainable Transportation (In April 2006, the Centre moved from Toronto, Canada, to the University of Winnipeg)
Evolution of urban transport policies: International comparisons
 Centre for Transport Studies Evolution of urban transport policies: International comparisons Prof Peter Jones Centre for Transport Studies, UCL Presentation to the IATSS GIFTS Workshop, November 2015
Cycling in the Netherlands The City and the region Utrecht
 Cycling in the Netherlands The City and the region Utrecht 8-5-2006 1 The ultimate European lesson? I think we need to make people aware that our traffic concepts of today are not sustainable and will
Canada s Capital Region Delegation to the Velo-City Global 2010 Conference
 Canada s Capital Region Delegation to the Velo-City Global 2010 Conference Report of Findings from Visits, Meetings & Presentations In Amsterdam-Den Haag, Utrecht, Berlin & Copenhagen The Itinerary Copenhagen
Congestion Management in Singapore. Assoc Prof Anthony TH CHIN Department of Economics National University of Singapore
 Congestion Management in Singapore Assoc Prof Anthony TH CHIN Department of Economics National University of Singapore anthonychin@nus.edu.sg Introduction 2 Introduction and What is Traffic Congestion?
Living Streets response to the Draft London Plan
 Living Streets response to the Draft London Plan Contents Living Streets response to the Draft London Plan... 1 About Living Streets... 2 Summary... 2 Consultation response... 3 Chapter 1: Planning London
Dr Neil J. Bristow. 8 th WSD Steel Success Strategies European Steel Conference London, 30 th November H & W Worldwide Consulting
 Dr Neil J. Bristow 8 th WSD Steel Success Strategies European Steel Conference London, 30 th November 2010 neil.j.bristow@hwworldwideconsult.com +61240286268 H & W Worldwide Consulting 1. Brief comparison
2. Transportation in Ottawa Today and Tomorrow
 2. Transportation in Ottawa Today and Tomorrow 2.1 Transportation System Overview The City. The City of Ottawa is the largest municipality in the National Capital Region (NCR). Urban development covers
Congestion Evaluation Best Practices
 Congestion Evaluation Best Practices Todd Litman Victoria Transport Policy Institute Presented International Transportation and Economic Development Conference 10 April 2014 Congestion Indicators Indicator
Chapter 2 Current and Future Conditions
 Chapter 2 Current and Future Conditions 2.1 An Overview of Ottawa s Transportation System The City of Ottawa is home to about 870,700 people. The city covers an area of 2,760 square kilometres of which
INSIGHTS ON HOW BIKESHARING SUPPORTS URBAN DEVELOPMENT
 INSIGHTS ON HOW BIKESHARING SUPPORTS URBAN DEVELOPMENT INTRODUCTION Recent advances in mobile technology and big data analysis have enabled new opportunities to rethink how people live in and move through
VILNIUS SUMP. Gintarė Krušinskaitė International project manager place your logo here
 VILNIUS SUMP Gintarė Krušinskaitė International project manager Gintare.krusinskaite@vilniustransport.lt place your logo here 19 April, 2017 WHERE DID WE CAME FROM? Mobility management and mobility planning
Michael Cramer MEP. Closing Plenary Velo-City Global. Cycling in Europe. Presentation by Michael Cramer Taipei, March 1 st 2016
 Michael Cramer MEP Closing Plenary Velo-City Global Cycling in Europe Presentation by Michael Cramer Taipei, March 1 st 2016 The fundamental problem in Europe without a change of mobility we will not stop
CAR DEPENDENCY IN SYDNEY: A Case Study of Fairfield City Council
 PLAN9018 Planning Report CAR DEPENDENCY IN SYDNEY: A Case Study of Fairfield City Council PRATIBHA ACHARYA SID 309056802 Urban & Regional Planning & Policy Faculty of Architecture, Design & Planning The
Preview. Tables in your paper Mass Transit as alternative to auto California s problems in urban transportation
 Preview Tables in your paper Mass Transit as alternative to auto California s problems in urban transportation Integrating tables in your writing Commuting in Urban Areas Last time auto and congestion
METRO RTA TRANSIT MASTER PLAN. May 25-26, 2011
 METRO RTA TRANSIT MASTER PLAN May 25-26, 2011 WHAT IS THE TRANSIT MASTER PLAN? A twenty-year plan for METRO RTA What will METRO look like in 2031? 1 TRANSIT TECHNOLOGIES 2 TRANSIT TECHNOLOGIES Transit
Walking and urban planning. Maurizio TIRA Environmental Engineer, Full Professor of Town and regional planning Università degli Studi di Brescia
 Walking and urban planning Environmental Engineer, Full Professor of Town and regional planning Università degli Studi di Brescia The presentation analyses the main obstacles to walking and shows how planning
mobile Bicycle promotion as part of transport and city planning
 mobile2020 11.09.2013 Bicycle promotion as part of transport and city planning Introduction IBC In the last decade a new paradigm on cities and urban transport is developing. New trends on accessibility
University of Leeds Travel Plan
 University of Leeds Travel Plan 2015-2018 Contents 1: Introduction 1.1 What is a Travel Plan? 1.2 Why do we need one? 1.3 Sustainability Strategy 2: Overview 2.1 The bigger picture 2.2 The City scale 2.3
Regression Analysis of Travel Indicators and Public Transport Usage in Urban Areas
 Regression Analysis of Travel Indicators and Public Transport Usage in Urban Areas M. Moeinaddini, Z. Asadi-Shekari, M. Zaly Shah, A. Hamzah Abstract Currently, planners try to have more green travel options
Investment in Active Transport Survey
 Investment in Active Transport Survey KEY FINDINGS 3 METHODOLOGY 7 CYCLING INFRASTRUCTURE 8 Riding a bike 9 Reasons for riding a bike 9 Mainly ride on 10 Comfortable riding on 10 Rating of cycling infrastructure
Travel Behavior, Transport Policy, and Sustainable Transport in Germany and the USA
 Travel Behavior, Transport Policy, and Sustainable Transport in Germany and the USA Similarities between Germany and the USA Federal system of government, tradition of local self-government Strong economy,
Oil Crises and Climate Challenges 30 Years of Energy Use in IEA Countries
 Crises and 30 Years of Energy Use in IEA Countries Fridtjof Unander, International Energy Agency ISED Meeting, UN, 13 September 2004 Aim of the Study Review of trends in energy use and CO 2 emissions since
Canada. UK France. Walk, Bike, Transit Share of Trips
 1950s 1960s Today Relationship between Share of Urban Trips by Transit, Bicycle, and Foot and Per Capita Annual CO 2 Emissions from Road and Rail Transport in Australia, Canada, the USA and EU Countries,
WHITE PAPER: TRANSIT SERVICE FOR SOUTH SHAGANAPPI
 9/27/2012 TRANSIT PLANNING WHITE PAPER: TRANSIT SERVICE FOR SOUTH SHAGANAPPI 2012 Calgary Transit 1 Table of Contents Purpose... 3 Area of Change... 3 Background... 3 Access to destinations... 5 Connecting
Preview. Second midterm Tables in your paper Mass Transit as alternative to auto California s problems in urban transportation
 Preview Second midterm Tables in your paper Mass Transit as alternative to auto California s problems in urban transportation Score Distribution 1 st Midterm 2 nd Midterm 3.5-4.0 8% 21% 3.0-3.5 23% 34%
Assessing the Reality: Transport and Land Use Planning to Achieve Sustainability
 Assessing the Reality: Transport and Land Use Planning to Achieve Sustainability David Banister Professor of Transport Studies Director of the Transport Studies Unit University of Oxford Introduction 1.
Clouds, Crowds, and Traffic: What 10 Emerging Megatrends Mean for the Future of Transportation
 Portland State University PDXScholar TREC Friday Seminar Series Transportation Research and Education Center (TREC) 11-1-2013 Clouds, Crowds, and Traffic: What 10 Emerging Megatrends Mean for the Future
SOCIALLY AND ENVIRONMENTALLY SUSTAINABLE URBAN TRANSPORT
 SOCIALLY AND ENVIRONMENTALLY SUSTAINABLE URBAN 1 Not only for clean air, but for basic human rights, those without cars must also be able to move without fear of being killed. 2 Bogotá is far from being
ABERDEEN: CITY OF THE FUTURE
 ABERDEEN: CITY OF THE FUTURE A contribution towards discussions on a future transport strategy for Aberdeen and its Region Prepared by the Centre for Transport Research University of Aberdeen June 2010
A Critical Review of International Road Safety Databases
 A Critical Review of International Road Safety Databases George Yannis, Eleonora Papadimitriou, Katerina Folla National Technical University of Athens, Greece, Department of Transportation Planning and
METRO Light Rail: Changing Transit Markets in the Phoenix Metropolitan Area
 METRO Light Rail: Changing Transit Markets in the Phoenix Metropolitan Area Abhishek Dayal, AICP Planner III, METRO Light Rail Phoenix, AZ BACKGROUND Transit in the Phoenix Region Transit services in the
A Comparative Study on Urban Transport system and Related Environmental Impact in Asian Mega-cities: Beijing, Shanghai and Tokyo
 A Comparative Study on Urban Transport system and Related Environmental Impact in Asian Mega-cities: Beijing, Shanghai and Tokyo Prof. Kebin He Tsinghua University Workshop of IGES/APN Mega-city Project
LaSalle E-REGI Index 2017 EUROPEAN REGIONAL ECONOMIC GROWTH INDEX
 LaSalle E-REGI Index 2017 EUROPEAN REGIONAL ECONOMIC GROWTH INDEX LaSalle Investment Management LaSalle E-REGI Index 2017 1 01 METHODOLOGY 02 2017 RESULTS 03 THE CONSISTENT: KEY TARGET MARKETS 04 THE AFFLUENT:
Gerald Ollivier Lead Transport Specialist World Bank, New Delhi. Transforming Cities through Integrated Planning Corridor Scale
 Gerald Ollivier Lead Transport Specialist World Bank, New Delhi Transforming Cities through Integrated Planning Corridor Scale JOB ACCESSIBILITY: ZHENGZHOU A: LINE 1, 2, AND 3 AND WALKING: 12% B. SCENARIO
How Travel Demand Has Been Changing. Susan Handy Asilomar 2015
 How Travel Demand Has Been Changing Susan Handy Asilomar 2015 Annual VMT per Capita in U.S. 12,000 10,000 8,000 6,000 4,000 2,000-1936 1940 1944 1948 1952 1956 1960 1964 1968 1972 1976 1980 1984 1988 1992
International Journal of Research (IJR) Vol-1, Issue-8, September *
 Vol-1, Issue-8, September *") Development towards Sustainable Transportation Planning in India through Management of Non-motorized Transport Akshay Patil 1 * & 2 * 1 3 rd year B. Tech Planning student at College of Engineering Pune,
Development towards Sustainable Transportation Planning in India through Management of Non-motorized Transport Akshay Patil 1 * & 2 * 1 3 rd year B. Tech Planning student at College of Engineering Pune,
About the Active Transportation Alliance
 About the Active Transportation Alliance Chicagoland s voice for better biking, walking and transit Founded 1985 7,000 members, ~33 full time staff Serve Chicago metro region 1 More Cars, More Driving
Integrated Pedestrian Simulation in VISSIM
 Integrated Pedestrian Simulation in VISSIM PTV worldwide MUGS Conference October 30-31, 2008 Wellington Founded > 1979 30 years fast approaching Employees > Approximately 800 persons in the PTV Group worldwide
CONDUITS DST-Tel Aviv-Yafo Case Study
 CONDUITS DST-Tel Aviv-Yafo Case Study Introduction The city of Tel Aviv-Yafo is the nucleus of the Tel Aviv metropolitan area and serves as the financial and cultural centre of Israel. With a population
Appendix T 1: Additional Supporting Data
 Appendix T 1: Additional Supporting Data Project Delivery Delays with the implementation of the 2000 TIP became apparent early in the decade. In response to direction among policy officials, ARC began
BUS RAPID TRANSIT. A Canadian Perspective. McCormick Rankin International. John Bonsall P.Eng
 BUS RAPID TRANSIT A Canadian Perspective Why choose BRT? Because it is a practical and cost effective rapid transit solution for the most common types of land use in urban Canada Operating experience shows
Developing a Birmingham Transport Space Allocation policy. David Harris Transport Policy Manager Economy Directorate Birmingham City Council
 Developing a Birmingham Transport Space Allocation policy David Harris Transport Policy Manager Economy Directorate Birmingham City Council Birmingham s Sustainable Urban Mobility Plan Birmingham Connected
Integrated Urban Mobility
 Integrated Urban Mobility The Berlin Experience Forum Urba 2015 Conference Montreal, 23 th March 2011 Maria Krautzberger Permanent Secretary of State, Senate Department for Urban Development, Berlin The
APPENDIX C. Systems Performance Report C-1
 APPENDIX C Systems Performance Report C-1 System Performance Report & Requirements According to the FAST Act, a long range transportation plan needs to include a system performance report and subsequent
PLANNING FOR SUSTAINABLE PEDESTRIAN INFRASTRUCTURE NALIN SINHA INITIATIVE FOR TRANSPORTATION & DEVELOPMENT PROG. (ITD), DELHI
, DELHI") PLANNING FOR SUSTAINABLE PEDESTRIAN INFRASTRUCTURE NALIN SINHA INITIATIVE FOR TRANSPORTATION & DEVELOPMENT PROG. (ITD), DELHI India s Road Network 5 million kms: Total road length 2.6 mn kms: Surfaced
PLANNING FOR SUSTAINABLE PEDESTRIAN INFRASTRUCTURE NALIN SINHA INITIATIVE FOR TRANSPORTATION & DEVELOPMENT PROG. (ITD), DELHI India s Road Network 5 million kms: Total road length 2.6 mn kms: Surfaced
Land Use and Cycling. Søren Underlien Jensen, Project Manager, Danish Road Directorate Niels Juels Gade 13, 1020 Copenhagen K, Denmark
 Land Use and Cycling Søren Underlien Jensen, Project Manager, Danish Road Directorate Niels Juels Gade 13, 1020 Copenhagen K, Denmark suj@vd.dk Summary: Research about correlation between land use and
The seamless journey The seamless journey: Public transport links with walking and cycling
 The seamless journey The seamless journey: Public transport links with walking and cycling The PEP Workshop Kyiv, Ukraine June 8-9, 2011 Susanne Stölting UITP - A global membership UITP is... The network
Urban Transport Policy-making changing perspectives and consequences
 Urban Transport Policy-making changing perspectives and consequences Peter Jones, UCL ITLS, University of Sydney, 28 th March 2018 Overview Changing urban transport policy perspectives From car-based to
What s Health Got to Do With It? Health and Land Use Planning
 What s Health Got to Do With It? Health and Land Use Planning CANDACE RUTT, PH.D. EXECUTIVE DIRECTOR APRIL 13 TH, 2016 Planning and Public Health Planning + Public Health Healthy Communities Healthier
Philadelphia Bus Network Choices Report
 Philadelphia Bus Network Choices Report JUNE 2018 SEPTA Table of Contents Executive Summary...7 What if transit gave us more freedom?... 8 What is this report?... 8 The main conclusions... 9 What is happening
1 Road and HGV danger in London. Hannah White, Freight & Fleet Programme Manager November 2017
 1 Road and HGV danger in London Hannah White, Freight & Fleet Programme Manager November 2017 2 London and its transport networks London: 8.6m residents + 30m visitors 30m journeys per day 6.3m by bus
Launceston's Transport Futures. Greater travel options for the people of Launceston
 Launceston's Transport Futures Greater travel options for the people of Launceston Final Draft 13 Jan 2014 1 Page Number Executive summary 3 What is Transport Futures? 4 Vision 6 Economy, access and liveability
Transportation Master Plan Advisory Task Force
 Transportation Master Plan Advisory Task Force Network Alternatives & Phasing Strategy February 2016 BACKGROUND Table of Contents BACKGROUND Purpose & Introduction 2 Linking the TMP to Key Council Approved
BIKE TRANSIT INTEGRATION IN NORTH AMERICA. John Pucher & Ralph Buehler
 BIKE TRANSIT INTEGRATION IN NORTH AMERICA John Pucher & Ralph Buehler Synergies: Bicycling and Public Transport: Perfect Together? Cycling extends catchment areas of transit stops far beyond walking range
Comparison of urban energy use and carbon emission in Tokyo, Beijing, Seoul and Shanghai
 International Workshop on Urban Energy and Carbon Modeling, February 5-6, 28, AIT Centre, Asian Institute of Technology, Pathumthani, Thailand Comparison of urban energy use and carbon emission in Tokyo,
Cities Connect. Cities Connect! How Urbanity Supports Social Inclusion
 Cities Connect! How Urbanity Supports Social Inclusion Todd Litman Victoria Transport Policy Institute Metropolis Toronto, Canada - 14 June 2006 Cities Connect People with people. People with jobs. People
BUILDING THE CASE FOR TRAVEL OPTIONS IN WASHING TON COUNTY. Image: Steve Morgan. Image: Steve Morgan
 BUILDING THE CASE FOR TRAVEL OPTIONS IN WASHING TON COUNTY Image: Steve Morgan Image: Steve Morgan Image: TriMet Image: TriMet WHAT ARE TRAVEL OPTIONS PROGRAMS? Travel options programs encourage residents,
2012 Annual Conference THE HEAT IS ON! A New World Competition
 2012 Annual Conference THE HEAT IS ON! A New World Competition Going for Gold! Review of Global Hotel Performance with a focus on Olympic performance Elizabeth Winkle, STR Global InterContinental Buckhead
INFRASTRUCTURE: Using the Grid to Create a more Self-Sustaining Downtown. Studio Spring 2013
 EMERGENT FUTURES The San Diego Section of the American Society of Civil Engineers (ASCE) released a new report, the 2012 San Diego County Infrastructure Report Card. Since the last San Diego Report Card
Performance Measure Summary - Denver-Aurora CO. Performance Measures and Definition of Terms
 Performance Measure Summary - Denver-Aurora CO There are several inventory and performance measures listed in the pages of this Urban Area Report for the years from 1982 to 2014. There is no single performance
What future for mid-sized cities? Prof. Emer. Antony Stathopoulos National Technical University of Athens
 What future for mid-sized cities? Prof. Emer. Antony Stathopoulos National Technical University of Athens These cities can range in size from 50,000 to 250,000 in population. Street in Larnaca in 1878
Roundtable on integrated and sustainable urban transport. Mio Suzuki (University of Tokyo) Hiroki Nakamura (Chuo University)
 Hiroki Nakamura (Chuo University)") Roundtable on integrated and sustainable urban transport Mio Suzuki (University of Tokyo) Hiroki Nakamura (Chuo University) Contents Current situation of cycling in Japan Public bike system in Japan Example
Roundtable on integrated and sustainable urban transport Mio Suzuki (University of Tokyo) Hiroki Nakamura (Chuo University) Contents Current situation of cycling in Japan Public bike system in Japan Example
Performance Measure Summary - Chicago IL-IN. Performance Measures and Definition of Terms
 Performance Measure Summary - Chicago IL-IN There are several inventory and performance measures listed in the pages of this Urban Area Report for the years from 1982 to 2014. There is no single performance
Performance Measure Summary - San Jose CA. Performance Measures and Definition of Terms
 Performance Measure Summary - San Jose CA There are several inventory and performance measures listed in the pages of this Urban Area Report for the years from 1982 to 2014. There is no single performance
Urban planners have invested a lot of energy in the idea of transit-oriented
 DOES TRANSIT-ORIENTED DEVELOPMENT NEED THE TRANSIT? D A N I E L G. C H AT M A N Urban planners have invested a lot of energy in the idea of transit-oriented developments (TODs). Developing dense housing
Lucintel. Publisher Sample
 Lucintel http://www.marketresearch.com/lucintel-v2747/ Publisher Sample Phone: 800.298.5699 (US) or +1.240.747.3093 or +1.240.747.3093 (Int'l) Hours: Monday - Thursday: 5:30am - 6:30pm EST Fridays: 5:30am
Land Use and Transport for Low Carbon Cities
 Land Use and Transport for Low Carbon Cities Sunny Kodukula, Project Coordinator, Wuppertal Institute for Climate, Energy and Environment UNCRD - Environmentally Sustainable Transport (EST) Forum October
Access BART: TOD and Improved Connections. October 29, 2008
 Access BART: TOD and Improved Connections October 29, 2008 1 Access BART Study Goals Evaluate at the system-level land use and access scenarios to optimize ridership Identify station clusters that provide