Land Use and Transport for Low Carbon Cities
|
|
|
- Edwina Francis
- 5 years ago
- Views:
Transcription
1 Land Use and Transport for Low Carbon Cities Sunny Kodukula, Project Coordinator, Wuppertal Institute for Climate, Energy and Environment UNCRD - Environmentally Sustainable Transport (EST) Forum October 2018, Ulaanbataar, Mongolia
2 Cities Cannot live without them, cannot live in them, Can we adapt them? Home to over 50% of the population Economic centres for countries Magnets for opportunities Larger the cities higher the labour opportunities Are also large polluters Consume land and energy Contribute to environmental problems at a larger scale

3 Slumless smokeless cities (1902) Garden city Green Metropolis Ebenezer Howard 2 cities built! - Welwyn Garden City and Letchworth Garden City, both in Hertfordshire England

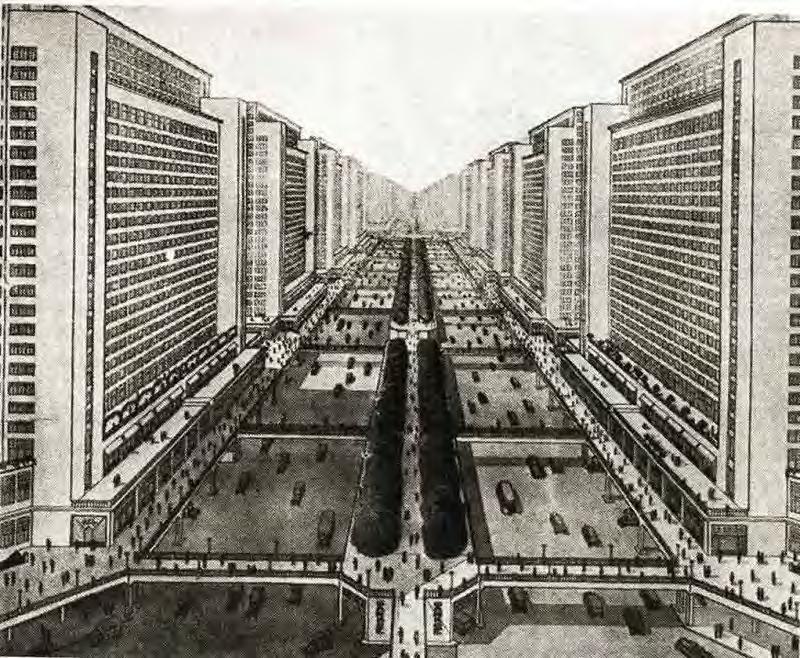
4 The 1925 view of a 1950 city


5 Atomurbia (1946)
6 The Le Corbusier Model
7 Kinds of cities 1: Monocentric city 2: Dispersed city Or how cities evolved and how we want them - Black arrows are strong links - Brown arrows are weak links 3: Composite city 4: Urban Village Concept of Alain Bertaud, 2001

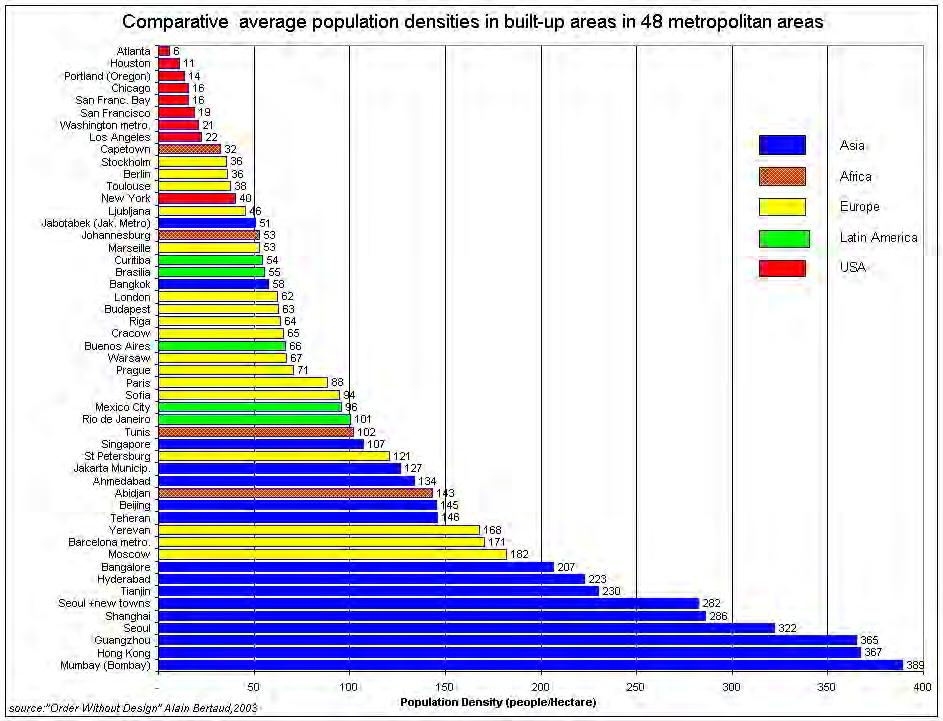
8 Way we live Paris: 7,877,000 people 1,176 km 2 Jakarta: 14,908,000 people 2,942 km 2 Moscow: 8,543,000 people Shanghai: 7,397,000 people 470 km km 2 Berlin: 4,212,000 people 1,176 km 2 Alain Bertaud, 2001 London: 6,626,000 people 1,062 km 2 New York: 10,752,000 people 2,674 km 2 Scale: 100,000 people


9 Way we move Cities with similar population and the use of private transport Figures not to scale. Source: The Neptis Foundation, 2007

10 Mexico city Change from 1910 until date

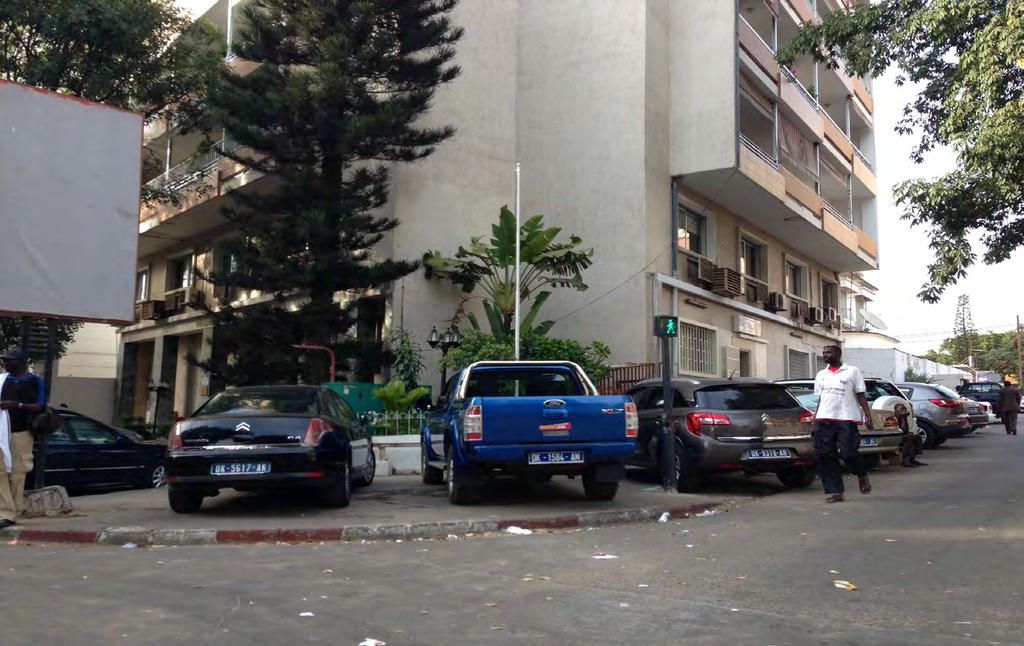
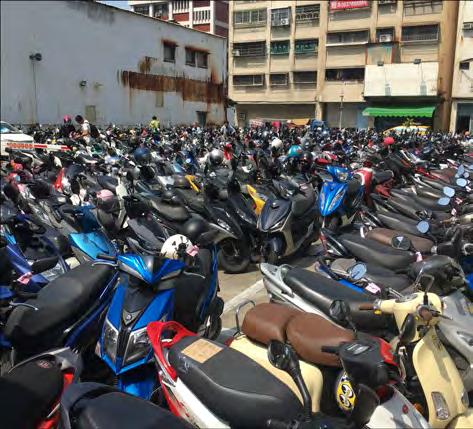
11 What it does to our cities Photo by Santhosh Kodukula, 2011

12 Still we like our cars and we give them what they want


13 Precious space 6

14 Resulting in

15 Transport and energy demand
16 Global emissions GLOBAL ANTHROPOGENIC EMISSIONS 38 GtCO 2 THE TRANSPORT SECTOR A major contributor to global anthropogenic CO 2 emissions TRANSPORT EMISSIONS 8.8 GtCO 2 ROAD TRANSPORT EMISSIONS 6.5 GtCO 2 4.6% 10.6% Other 77% Transport 23% 73.9% 46.5% 53.5% 10.9% LEGEND RAIL AVIATION ROAD MARINE HEAVY-DUTY VEHICLES LIGHT-DUTY VEHICLES Source: Kodjak D, 2015, Policies To Reduce Fuel Consumption, Air Pollution, and Carbon Emissions from vehicles in G20 Nations, May 2015, The International Council for Clean Transportation (ICCT) Figure 2.
17 Public Transit and urban density Urban Density vs Public Transport use Public Transport 65.00% 60.00% 55.00% 50.00% 45.00% 40.00% 35.00% 30.00% 25.00% 20.00% 15.00% 10.00% 5.00% Oslo 2013 Vilnius 2011 Melbourne 2016 Stuttgart 2004 Bremen 2004 Boston 2016 Budapest 2011 Malmö 2011 San Jose 2016 Jakarta 2011 Indore 2011 Berlin 2012 Munich 2011 Eindhoven 2004 Bogota 2008 Moscow Madrid 2006 Chicago 2016 Tokyo 2008 Stockholm 2004 London 2016 Milan 2007 Amsterdam 2014 Brussels 2010 Vancouver 2016 Turin 2004 Singapore 2011 Bilbao 2004 Rajkot 2011 Shanghai 2011 Delhi 2011 Pune-Pimpri Chinchwad 2011 Osaka 2000 Barcelona 2013 Paris 2010 Mumbai 2011 Country Australia Austria Belgium Canada China Colombia Denmark France Germany Hungary India Indonesia Italy Japan Lithuania Netherlands New Zealand Norway Poland Russia Singapore Spain Sweden Switzerland Taiwan United Kingdom United States 0.00% 0K 1K 2K 3K 4K 5K 6K 7K 8K 9K 10K 11K 12K 13K 14K 15K 16K 17K 18K 19K 20K 21K 22K Urban Density Sum of Urban Density vs. sum of Public Transport. Color shows details about Country. The marks are labeled by City and sum of F9. Source: Kodukula and Rat, 2018


18 Air Quality In most of the developing cities India and China are getting worse Majority of urban emissions from transport Source: FLICKR/Wayne/bdphoto1 Source: GIZ Photo DVD

19 Induced Demand Greater Demand for space Impact on health Deterioration of environment Impact on traffic Demand for travel Source: Claudio Olivares, based on Wuppertal Institute
 About 500,000 public transport trips / weekday Atlanta, GA, USA Population: 5.33 million Urban area: 162 km2 CO2 Emissions from urban transport: 0.")
20 Tale of two cities Population: 5.25 million Urban area: 4,280 km 2 CO2 Emissions from urban transport: 7.5 T CO 2 /ha/yr (public + private transport) About 500,000 public transport trips / weekday Atlanta, GA, USA Population: 5.33 million Urban area: 162 km2 CO2 Emissions from urban transport: 0.7 T CO2 /ha/yr (public + private transport) About 2.6 million trips / day 953 million boardings/year Barcelona, Spain

21 Car oriented planning Low Density Segregated Land Use Excessive road infrastructure Preference to mobility over accessibility
22 Why do cities grow? What is land use/transport? What influences it? What does it influence? Source: Sustainable Urban Transport Plans (SUTP) and urban environment: Policies, effects, and simulations


23 The 3Ds of land-use Density Diversity / mixed land use Design Destinations (availability of jobs etc.) Distance to transit
24 Density


25 Houston, TX, USA Source: Density: How not to Inhuman scale Not integrated with transit Segregated zoning What is the problem with a downtown? Source:

26 Diversity Is this diversity?

27 Diversity Mixed Land-use reduces the necessity to make some trips Distance travelled is greatly reduced Complemented by a good public realm with space for walking and cycling Source: City of Buenos Aires, 2015


28 Design: Who do we give the space? Source: City of Buenos Aires, 2015

29 Who do we design the spaces for Source: City of Buenos Aires, 2015

30 Design of services Not just urban space Source: City of Buenos Aires, 2015
31 Transit Oriented Development A transit spine Core high density Decreasing densities Transit line Medium-density residential High-density commercial and residential Transit station High-density residential

32 In the TOD Core is Transit bound Walking at 200 m Cycling upto 800 m

33 Example from Curitiba

34 Intervention from Bogota Govt. to locate public facilities (schools, colleges, recreational centers, etc.) along PT corridors Bogota built several schools along TransMilenio corridor

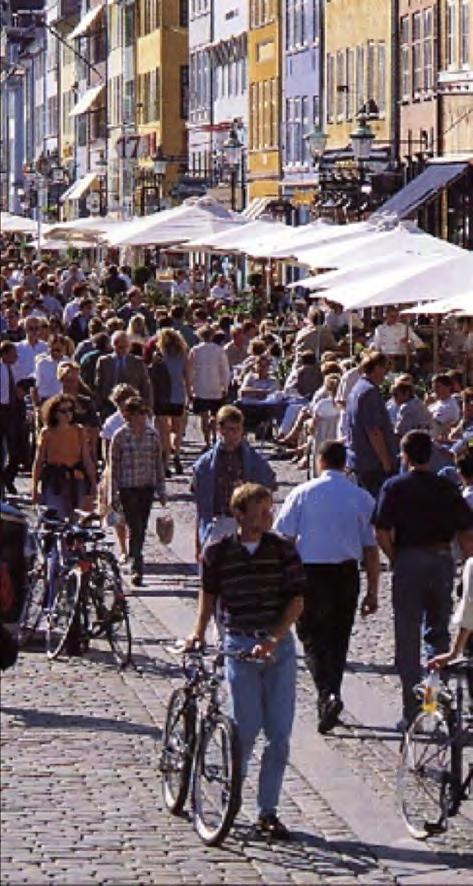
35 Copenhagen Concept of 1947 Over 170 kms of s-tog train lines Over 400 km of bicycle lanes
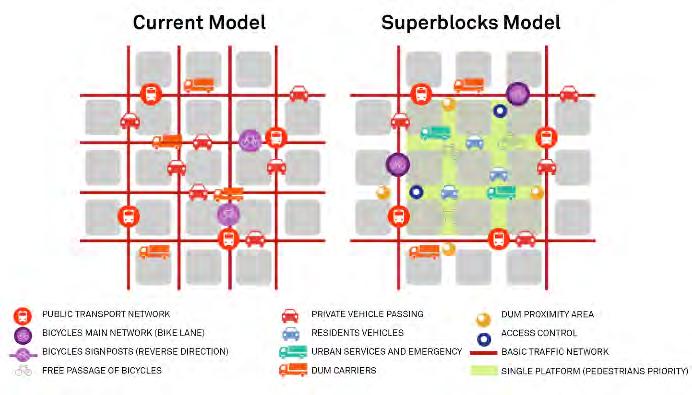
36 Barcelona
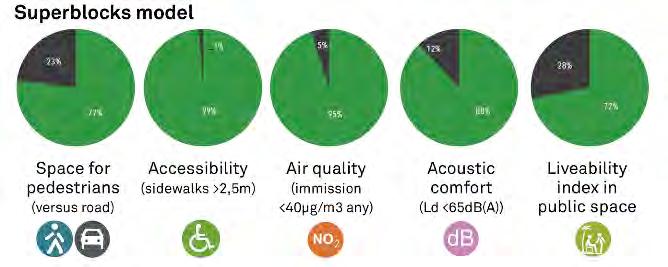
37 Superblocks benefits
38 In conclusion Growing Economy Car ownership Traffic volumes Urban Sprawl Longer trips Time lost in traffic Higher infrastructure costs Climate Change Higher emissions Air pollution Road Safety Higher speeds Increased Fatalities Conflict among modes Energy Consumption Transport consumes about 30% of energy GHG Emissions
 Equivalency road width: In order to")

 Mixed Traffic")


39 What carries how much? Suburban Rail (e.g. Mumbai) Equivalency road width: In order to carry 20,000 automobile commuters PHPD, a highway must be at least 18 lanes wide. (assumption 1.2 passengers per automobile) Mixed Traffic Regular Bus BRT single lane Cyclists Pedestrians Light Rail BRT double lane Heavy Rail/ Metro PPHPD Range 1.5k-2k 5k 9k 14k 19k 18k 20k?? 40k 60k 60k 90k Maximum PPHPD achieved 2k 8k 15k, Curitiba 14k 19k 20k 43k, Bogota 80k, HKK >100k, Mumbai Source: Manfred Breithaupt (2016) based on Botma & Papendrecht, TU Delft 1991 and own figures
40 We know it is bad but 50 CHART 1 Average time spent commuting to work in selected metropolitan areas in Brazil and other countries¹, ² (In minutes) Shanghai São Paulo Rio de Janeiro Brazilian MAs London Stockholm Recife Federal District New York Tokyo Belo Horizonte Sydney Salvador Paris Madrid Toronto Curitiba Fortaleza Berlin Belém Montréal Chicago Vancouver Boston San Francisco Los Angeles Porto Alegre Santiago Seattle Milan Barcelona Source: Brazil - National Household Sample Survey (PNAD/IBGE); Santiago (Chile) data available at: < data from all other metropolitan areas from Toronto Board of Trade (2012). Notes: 1 Tokyo: 2005; Santiago and Europe: 2006; Brazil: 2009; Australia, Canada, Shanghai and USA: ² Commute time data from Eurostat is available only at the regional level. However, the delimitation of these boundaries is not strictly defined and may vary greatly across European MAs. Data from the USA is based on Metropolitan Statistical Area.

41 What to prioritise Cities for People OR City for cars


42 How do we do it? Integrate land use and transport Don t focus on single corridor solutions Integrate, integrate, integrate Don t control land prices but guide urban development Know what kind of city you want!
43 Questions for you. Land Value Capture Any other alternatives to TOD? What is being done in your city?
44 Thanks for the attention Sunny Kodukula Project Coordinator Wuppertal Institute, Germany T: F: Skype: santhosh.kodukula LinkedIn:
Concept of Sustainable Transport and integrated Land Use Planning- An Overview. Manfred Breithaupt GIZ Water, Energy, Transport
 Concept of Sustainable Transport and integrated Land Use Planning- An Overview Manfred Breithaupt GIZ Water, Energy, Transport The adverse impacts of growth in motorization - in economic, environmental
Public Transport as a Necessity for Active Transport
 03.05.2017 Seite 1 Public Transport as a Necessity for Active Transport Manfred Breithaupt Urban Transport Consultant to GIZ Active Transport requires an attractive Public Transport System and its Integration
Urban Development and Transport Linkages
 The SUTP Webinar Series Urban Development and Transport Linkages Tuesday, 29 July 2014, 18:00-19:00 CEST On behalf of Page 1 Webinar Team & Agenda Welcome by Mathias Merforth GIZ - Transport Policy Advisory
Urban Transport Policy and Planning Documents For Transportation Researchers, Transport Policy Makers and Decision Makers
 Johannesburg Integrated Transport Plan 2003 / 2008: http://www.joburg.org.za/content/view/1250/78/ Africa South Africa Public Transport Action Plan, Phase 1 (2007-2010): Catalytic Integrated Rapid PublicTransport
AREA TOTALS OECD Composite Leading Indicators. OECD Total. OECD + Major 6 Non Member Countries. Major Five Asia. Major Seven.
 Reference series Composite leading indicators OECD Composite Leading Indicators AREA TOTALS 7-03- 19 OECD Total 19 OECD + Major 6 Non Member Countries 19 Major Seven 19 Major Five Asia 19 Euro area 19
FACT Sheet. FIFA Competition winners at a glance. Men s Competitions. FIFA World Cup (staged every four years)
") FIFA Competition winners at a glance Men s Competitions FIFA World Cup (staged every four years) 2022 Qatar 2018 Russia 2014 Brazil 32/64 2010 South Africa, Johannesburg 32/64 Netherlands Spain 0:1 AET
FIFA Competition winners at a glance Men s Competitions FIFA World Cup (staged every four years) 2022 Qatar 2018 Russia 2014 Brazil 32/64 2010 South Africa, Johannesburg 32/64 Netherlands Spain 0:1 AET
THE WORLD COMPETITIVENESS SCOREBOARD 2011
 THE WORLD COMPETITIVENESS SCOREBOARD 2011 98.557 94.063 92.588 92.011 90.782 90.219 89.259 87.824 86.475 86.418 86.313 85.707 84.380 84.120 81.629 81.619 81.100 80.278 79.799 78.499 77.599 77.101 76.827
outline 1. why cycle? 2. (safety health) 3. safe system 4. what next
 3. safe system 4. what next") outline 1. why cycle? 2. (safety health) 3. safe system 4. what next In a city of many cyclists, why do they ride? Copenhageners reasons for cycling to and from work (multiple answers) 56% it s faster
outline 1. why cycle? 2. (safety health) 3. safe system 4. what next In a city of many cyclists, why do they ride? Copenhageners reasons for cycling to and from work (multiple answers) 56% it s faster
Public Transport and Development: Making It Work
 Public Transport and Development: Making It Work Robert T. Dunphy Urban Land Institute World Bank Transport Forum 2006 March 28, 2006 Transportation Development Disconnect Now Few Then places w/o car Many
Win-Win Transportation Solutions
 Win-Win Transportation Solutions Todd Litman Victoria Transport Policy Institute Presented Lipinski Symposium on Transportation Policy Chicago, Illinois 15 October 2007 What is The Transportation Problem?
2017 City RepTrak. The Most Reputable Cities in the World. September 28th, 2017 Nicolas G. Trad
 2017 City RepTrak The Most Reputable Cities in the World September 28th, 2017 Nicolas G. Trad 1 What we are going to see during this webinar: Managing the reputation Cities why and how City RepTrak 2017
The Good, The Bad and The Ugly: Planning for Reduced Car Dependence in European and Other Global Cities
 The Good, The Bad and The Ugly: Planning for Reduced Car Dependence in European and Other Global Cities Jeffrey Kenworthy Professor in Sustainable Cities Frankfurt University of Applied Sciences, Frankfurt,
TomTom European Congestion Index
 TomTom European Congestion Index Disclaimer All copyrights, commercial rights, design rights, trademarks and other elements considered intellectual property that are published in this report are reserved
FACT Sheet. FIFA Competition winners at a glance. FIFA Men s Competitions. FIFA World Cup (staged every four years)
") FIFA Competition winners at a glance FIFA Men s Competitions FIFA World Cup (staged every four years) 2022 Qatar 32/64 2018 Russia 32/64 2014 Brazil, Rio de Janeiro 32/64 Germany Argentina 1-0 AET 2010
FIFA Competition winners at a glance FIFA Men s Competitions FIFA World Cup (staged every four years) 2022 Qatar 32/64 2018 Russia 32/64 2014 Brazil, Rio de Janeiro 32/64 Germany Argentina 1-0 AET 2010
IGU. Immediate Challenges for Clean and Affordable Gas Mobility in Europe IGU WGCPARIS2015. Eugene Pronin Gazprom export LLC, IGU WOC
 Immediate Challenges for Clean and Affordable Gas Mobility in Europe WGCPARIS2015 WORLD GAS CONFERENCE Eugene Pronin Gazprom export LLC, WOC 1 The Plan Triennium Working Program WOC 5 (Utilization of Gas)
Road Safety Initiatives at the International Transport Forum :
 Road Safety Initiatives at the International Transport Forum : IRTAD 2016 annual report Zero Road Deaths and Serious Injuries Report Safer City Streets Initiatives TRB Annual Meeting Joint IRTAD / NHTSA
International cooperation to improve the safety of European pedestrian crossings
 International cooperation to improve the safety of European pedestrian crossings Francesco Mazzone Head of International Assessment Programmes ACI Automobile Club d Italia Polis Conference Barcelona, 25
Canada s Capital Region Delegation to the Velo-City Global 2010 Conference
 Canada s Capital Region Delegation to the Velo-City Global 2010 Conference Report of Findings from Visits, Meetings & Presentations In Amsterdam-Den Haag, Utrecht, Berlin & Copenhagen The Itinerary Copenhagen
Child- and Youth-friendly Land-use and Transport Planning Guidelines
 Child- and Youth-friendly Land-use and Transport Planning Guidelines Richard Gilbert Centre for Sustainable Transportation (In April 2006, the Centre moved from Toronto, Canada, to the University of Winnipeg)
Big data analytics for enrichment of rural area content tourism in Okhotsk sub-prefecture of Japan
 Big data analytics for enrichment of rural area content tourism in Okhotsk sub-prefecture of Japan Ali Bakdur, Fumito Masui, Michal Ptaszynski Kitami Institute of Technology, Dept. of Computer Science,
SUSTAINABILITY, TRANSPORT, & HEALTH. Ralph Buehler, Virginia Tech
 SUSTAINABILITY, TRANSPORT, & HEALTH Ralph Buehler, Virginia Tech Prepared for National Academies Roundtable on Science and Technology for Sustainability 6 December 2013 Overview Trends in Motorization
Round of 16 qualified teams... 3 Group A Russia, Saudi Arabia, Egypt, Uruguay... 7 Group B Portugal, Spain, Morocco, IR Iran...
 Round of 16 qualified teams... 3 Group A Russia, Saudi Arabia, Egypt, Uruguay... 7 Group B Portugal, Spain, Morocco, IR Iran... 9 Group C France, Australia, Peru, Denmark...11 Group D Argentina, Iceland,
Infrastructure and Programs. What does the data say? Advancing Non-motorized Transportation in Vermont 11/15/09
 Advancing Non-motorized Transportation in Vermont A reply from the university point of view Lisa Aultman-Hall Professor and Director Figure 4 Why Canadians Cycle more than Americans: A Comparative Analysis
Sustainable Transport in Developing Cities -Factors for Success
 Sustainable Transport in Developing Cities -Factors for Success Manfred Breithaupt GIZ Water, Energy, Transport Seite 1 Outline Liveable Cities & Urban Life Failures in Urban and Transport Planning Concept
VILNIUS SUMP. Gintarė Krušinskaitė International project manager place your logo here
 VILNIUS SUMP Gintarė Krušinskaitė International project manager Gintare.krusinskaite@vilniustransport.lt place your logo here 19 April, 2017 WHERE DID WE CAME FROM? Mobility management and mobility planning
OECD employment rate increases to 68.4% in the third quarter of 2018
 Paris, 17th January 2019 News Release: 3rd Quarter 2018 OECD employment rate increases to 68.4% in the third quarter of 2018 The OECD area employment rate the share of the working-age population with jobs
Country fact sheet South Korea
 ESRA results Country fact sheet South Korea The ESRA project is a joint initiative of research institutes in 25 countries aiming at collecting comparable national data on road users opinions, attitudes
2014 FIFA World Cup Brazil Official Hospitality Programme Hospitality Request Form Version 6 14 th March 2013
 Official Programme Request Form THE Aquarela Series Best Suites available for Rio de Janeiro, Sao Paulo & Belo Horizonte including OM, 2x SF, F Aquarela Series ONE 442 total (22x RIO, 26x SAO, 22x BHZ)
Global BRT Trends COST Action Conference
 Global BRT Trends COST Action Conference Lloyd Wright Brussels, Belgium 29 November 2011 Bus Rapid Transit Planning Guide EU COST is a core partner in the production of the 4 th Edition of the BRT Planning
Walkable Cities. A Presentation by Michalis Lambrinos Ministry of Transport, Communications and Works
 Walkable Cities A Presentation by Michalis Lambrinos Ministry of Transport, Communications and Works Contents What Makes a City Walkable Why is Walkability Important The Theory of Walkability Restrict
Insert the title of your presentation here
 Insert the title of your presentation here Intermodality and Partnerships to make public transport more attractive Heather Presented Allen by Name Programme Here Director Sustainable Job Title - Date Transport
Global Construction Outlook: Laura Hanlon Product Manager, Global Construction Outlook May 21, 2009
 Global Construction Outlook: Short-term term Pain, Long-term Gain Laura Hanlon Product Manager, Global Construction Outlook May 21, 2009 What This Means for You The world is set to be hit this year with
Experience from India Future Perspectives
 Experience from India Future Perspectives The 2 nd Asia BRTS Conference September 29 and 30, 2014 Amdavad Prof. Shivanand Swamy Executive Director Centre of Excellence in Urban Transport, CEPT University
Transport statistics as exposure data in road safety analysis. Alexandre Santacreu 5 th ITF TRANSPORT STATISTICS MEETING, April 2018, Paris
 Transport statistics as exposure data in road safety analysis Alexandre Santacreu 5 th ITF TRANSPORT STATISTICS MEETING, 25-26 April 2018, Paris 2 International Traffic Safety Data and Analysis Group IRTAD
Bus Rapid Transit: How Delhi Compares
 Bus Rapid Transit: How Delhi Compares Delhi BRT Modern Low Floor CNG Buses are a big improvement: Lower Particulate emissions than TransMilenio Grade A Cycling Facilities Bike flows at peak are as high
Cycling Inclusive Transport Planning
 Cycling Inclusive Transport Planning Dr. Anvita Arora, Dr. Mark Zuidgeest*, Mark Kirkels Interface for Cycling Expertise *Cycling Academic Network ADB Transport Forum, Manila Activity Clinic 11 May 27th,
ALL ABOUT THE 2016 RIO SUMMER GAMES
 ALL ABOUT THE 2016 RIO SUMMER GAMES ALL ABOUT THE 2016 RIO SUMMER GAMES The 2016 summer games in rio VENEZUELA COLOMBIA ATLANTIC OCEAN PERU RECIFE PACIFIC OCEAN BOLIVIA BRASILIA RIO DE JANEIRO A FIRST
SOCIALLY AND ENVIRONMENTALLY SUSTAINABLE URBAN TRANSPORT
 SOCIALLY AND ENVIRONMENTALLY SUSTAINABLE URBAN 1 Not only for clean air, but for basic human rights, those without cars must also be able to move without fear of being killed. 2 Bogotá is far from being
Complete Streets 101: The Basics
 Complete Streets 101: The Basics Michigan Municipal League - Capital Conference March 21, 2017 Chip Smith, AICP - Senior Planner - Wade Trim Inc. and City Council member City of Ann Arbor 2017 MML Capital
Assessing Australia s Innovative Capacity in the 21 st Century
 Assessing Australia s Innovative Capacity in the 21 st Century Professor Joshua Gans MBS & IPRIA University of Melbourne November, 2003 This presentation is based on the National Innovative Capacity Project,
Climate Change & India
 Climate Change & India New Delhi How has India warmed over the past 117 years? How the temperatures have increased seasonally? How far away we are from 1.5 degree C target? Methodology 117 years (1901-1916)
2012 Annual Conference THE HEAT IS ON! A New World Competition
 2012 Annual Conference THE HEAT IS ON! A New World Competition Going for Gold! Review of Global Hotel Performance with a focus on Olympic performance Elizabeth Winkle, STR Global InterContinental Buckhead
New rules, new opportunities: a potential for growth
 #TV year New rules, new opportunities: a potential for growth June 19th, 2015 Jacques Balducci Eurodata TV Worldwide Deputy Sales Director Worldwide TV viewing remains strong World daily viewing time Average
Urbanization and sustainable development David Satterthwaite, IIED
 Urbanization and sustainable development David Satterthwaite, IIED How can urbanization be a problem if All rich nations are highly urbanized; all the poorest nations predominantly rural All the most successful
28th Nov 2014 Chandramauli Shukla CEO, BCLL, Bhopal
 BRTS@BHOPAL 28th Nov 2014 Chandramauli Shukla CEO, BCLL, Bhopal Vehicular growth & Modal Share 17.96 6.71 1981 2011 Population growth Since 1981, the population of Bhopal has multiplied about 2.5 times
Organizing Entity Host City Start Date End Date Remarks Held in New York 04 December December 2017 Confirmed
 Organizing Entity Host Start Date End Date Remarks France 04 December 2017 05 December 2017 Confirmed United Kingdom 13 November 2017 14 November 2017 Confirmed Senegal Held in Dakar 02 November 2017 03
BRT Standard 2016 Edition. Jacob Mason Transport Research and Evaluation Manager July 26, 2016
 BRT Standard 2016 Edition Jacob Mason Transport Research and Evaluation Manager July 26, 2016 Overview 1. Context 2. What is Bus Rapid Transit (BRT)? 3. What is the BRT Standard? 4. Why Was It Created?
The Emotional Factor in a Bid Presentation
 The Emotional Factor in a Bid Presentation Noor Ahmad Hamid ICCA Asia Pacific Regional Office noor@iccaap.com ICCA - TAIWAN MICE Bidding Workshop 2014 1896 Athens 1900 Paris 1904 St. Louis 1908 London
Max Sort Sortation Option - Letters
 Max Sort Sortation Option - Letters Western Europe Prices Product Code PS5 PS6 Austria* 0.330 7.550 0.330 7.400 Belgium* 0.370 3.700 0.370 3.540 Denmark* 0.620 5.350 0.620 4.215 Finland* 0.385 4.400 0.385
How To Encourage More Efficient Transportation in Brazilian Cities
 How To Encourage More Efficient Transportation in Brazilian Cities Todd Litman Victoria Transport Policy Institute Presented Seminar on Discouraging The Use Of Cars São Paulo, Brazil 3 September 2013 Creating
Clouds, Crowds, and Traffic: What 10 Emerging Megatrends Mean for the Future of Transportation
 Portland State University PDXScholar TREC Friday Seminar Series Transportation Research and Education Center (TREC) 11-1-2013 Clouds, Crowds, and Traffic: What 10 Emerging Megatrends Mean for the Future
Notes on Transport and Land-use (adapted from Lectures by Suman Maitra, Lecturer, URP, BUET) Table 2: Theoretically expected impacts of land use
 Table 2: Theoretically expected impacts of land use") Notes on Transport and Land-use (adapted from Lectures by Suman Maitra, Lecturer, URP, BUET) Table 2: Theoretically expected impacts of land use Table 3: Theoretically expected impacts of transport Table
Notes on Transport and Land-use (adapted from Lectures by Suman Maitra, Lecturer, URP, BUET) Table 2: Theoretically expected impacts of land use Table 3: Theoretically expected impacts of transport Table
Stockholm s tourism industry. November 2016
 Stockholm s tourism dustry. November 2016 Durg the month of November ca 1.1 million guest were recorded at commercial accommodations the county of Stockholm. This was an crease of 5 compared to November
World exports as a share of GDP
 World exports as a share of GDP 35% 30% 25% 20% 15% 1991 1993 1995 1997 1999 2001 2003 2005 2007 2009 Source: WTO, World Bank. World goods and service exports US$ trillions Commercial services (L) Total
PESHAWAR Bus Rapid TRANSIT. By Engr. Haroon Rashid Ph. D Scholar, MS in Transportation Planning and B.Sc Civil Engineering
 PESHAWAR Bus Rapid TRANSIT By Engr. Haroon Rashid Ph. D Scholar, MS in Transportation Planning and B.Sc Civil Engineering 1 OUTLINE Aim and Objective What is BRT? Why BRT? BRT as High Performance Transit
2018 International Sports Calendar
 January 2018 30 Dec - 06 January Tennis Hopman Cup Perth, Western Australia 31 Dec - 07 January Tennis Brisbane International Brisbane, Queensland 03 Jan - 07 January Cricket 5th Ashes Test - Australia
Stockholm s tourism industry. December 2016
 Stockholm s tourism dustry. December 2016 Durg the month of December ca 0.9 million guest were recorded at commercial accommodations the county of Stockholm. This was an crease of 12 compared to December
Israel Innovation Authority
 Israel Innovation Authority Danny Biran VP, International Division innovationisrael.org.il Hi-Tech - Major Impact on the Israeli Economy of Employees Of Business Sector GDP of Exports 4.3 Global Leadership
Cycling in the Netherlands The City and the region Utrecht
 Cycling in the Netherlands The City and the region Utrecht 8-5-2006 1 The ultimate European lesson? I think we need to make people aware that our traffic concepts of today are not sustainable and will
Interested in learning more? Global Information Assurance Certification Paper. Copyright SANS Institute Author Retains Full Rights
 Global Information Assurance Certification Paper Copyright SANS Institute Author Retains Full Rights This paper is taken from the GIAC directory of certified professionals. Reposting is not permited without
Road Transport Problem Diagnosis
 Road Transport Problem Diagnosis + Atmospheric Pollution + Noise + Vibration Road Traffic Congestion + Road Traffic Injuries Life span Obesity Sleep BP School IIT Delhi 2007 FRIENDS & URBAN TRANSPORT Light
Multi-criteria Evaluation of Traffic Signal Control Manfred Boltze and Wei Jiang 1
 Multi-criteria Evaluation of Traffic Signal Control Manfred Boltze and Wei Jiang Transport Planning and Traffic Engineering, Technische Universität Darmstadt Future City 2017: Urban Sustainable Development
2. Transportation in Ottawa Today and Tomorrow
 2. Transportation in Ottawa Today and Tomorrow 2.1 Transportation System Overview The City. The City of Ottawa is the largest municipality in the National Capital Region (NCR). Urban development covers
Helsinki. Explaining Active Transportation Success in a City with Winter. Karl Saidla, Ph.D. Candidate, University of Ottawa, Human Kinetics
 Helsinki Explaining Active Transportation Success in a City with Winter Karl Saidla, Ph.D. Candidate, University of Ottawa, Human Kinetics Thanks! University of Ottawa Finland Futures Research Centre-University
Elements for the Biennial Review And Assessment of the World Timber Situation SELECTED DATA AND ANALYSIS.
 Elements for the Biennial Review And Assessment of the World Timber Situation 2015-2016 SELECTED DATA AND ANALYSIS Frances Maplesden Content Results of the 2016 Joint Forest Sector Questionnaire Secondary
Young Researchers Seminar 2009
 Young Researchers Seminar 2009 Torino, Italy, 3 to 5 June 2009 LOCALISATION OF SHOPPING MALLS IN SCANDINAVIA Planning regulations as a policy instrument for reducing greenhouse gas emissions Institute
APPENDIX - Rules and Regulations Important modifications. September 2017
 APPENDIX - Rules and Regulations 2018 Important modifications September 2017 Art. 13 Prizes Health Insurance is available upon application to winning candidates according to need and eligibility. A. «Prix
Global Cable: Market trends & business models
 Global Cable: Market trends & business models Guy Bisson, Ampere Analysis January 2018 1 Cable TV penetration 2005: Cable TV drove market with multiple high penetration/low ARPU markets 90 80 70 Netherlands
Chapter 2 Current and Future Conditions
 Chapter 2 Current and Future Conditions 2.1 An Overview of Ottawa s Transportation System The City of Ottawa is home to about 870,700 people. The city covers an area of 2,760 square kilometres of which
International Journal of Research (IJR) Vol-1, Issue-8, September *
 Vol-1, Issue-8, September *") Development towards Sustainable Transportation Planning in India through Management of Non-motorized Transport Akshay Patil 1 * & 2 * 1 3 rd year B. Tech Planning student at College of Engineering Pune,
Development towards Sustainable Transportation Planning in India through Management of Non-motorized Transport Akshay Patil 1 * & 2 * 1 3 rd year B. Tech Planning student at College of Engineering Pune,
Appendix Urban Change in Western Europe, : Statistical Background
 Appendix Urban Change in Western Europe, 1 945-80: Statistical Background ...
EVENT LOCATION DATE. Training Course 2 London 19 June. Study Club Clinical Topic High Wycombe 24 June
 United Kingdom. Training Course 2 London 19 June Study Club Clinical Topic High Wycombe 24 June MasterClass (carried from previous year) London 26 June Training Course 2 London 26 June MasterClass (carried
METRO RTA TRANSIT MASTER PLAN. May 25-26, 2011
 METRO RTA TRANSIT MASTER PLAN May 25-26, 2011 WHAT IS THE TRANSIT MASTER PLAN? A twenty-year plan for METRO RTA What will METRO look like in 2031? 1 TRANSIT TECHNOLOGIES 2 TRANSIT TECHNOLOGIES Transit
GLOBAL BAROMETER OF HOPE AND DESPAIR FOR 2011
 GLOBAL BAROMETER OF HOPE AND DESPAIR FOR 2011 Volume 1: Statistical Report Findings based on responses from more than 64,000 scientifically selected cross-section of Men and Women from all socioeconomic
Gerald Ollivier Lead Transport Specialist World Bank, New Delhi. Transforming Cities through Integrated Planning Corridor Scale
 Gerald Ollivier Lead Transport Specialist World Bank, New Delhi Transforming Cities through Integrated Planning Corridor Scale JOB ACCESSIBILITY: ZHENGZHOU A: LINE 1, 2, AND 3 AND WALKING: 12% B. SCENARIO
TARGETING CITIES AND COUNTRIES REBECCA BAVINGER, MPA SEPTEMBER 21, 2016
 TARGETING CITIES AND COUNTRIES REBECCA BAVINGER, MPA SEPTEMBER 21, 2016 BLOOMBERG PHILANTHROPIES PUBLIC HEALTH PROGRAMS Tobacco Control 2007-2016 Road Safety 2007-2019 Maternal and Reproductive Health
I. World trade in Overview
 I. Table I.1 Growth in the volume of world merchandise exports and production by major product group, 1995-3 ( change) 1995-21 22 23 World merchandise exports 7. -.5 3. 4.5 Agricultural products 3.5 2.5
Country fact sheet Germany
 Country fact sheet Germany ESRA 2015 results The ESRA project is a joint initiative of research institutes in 17 European countries aiming at collecting comparable national data on road users opinions,
Coolest Cities Results Summary
 Coolest Cities Results Summary About Coolest Cities Canada s six largest urban areas provide homes and jobs for almost 15 million people, nearly half of our population. Transporting these citizens to and
Economics of Highway Spending and Traffic Congestion. Todd Litman Victoria Transport Policy Institute Presented Strong Towns Webinar 3 February 2016
 Economics of Highway Spending and Traffic Congestion Todd Litman Victoria Transport Policy Institute Presented Strong Towns Webinar 3 February 2016 Motor Vehicle Travel is Peaking Annual Vehicle Mileage
An Incentive-Based Approach to Curbing Automobile Use in the Washington, DC Metropolitan Area
 An Incentive-Based Approach to Curbing Automobile Use in the Washington, DC Metropolitan Area Emily Freimuth Daniel Selden Andrew Kimmel Brendan Shera The Problem Urban Sprawl Increased Commuting from
The economic value of the EU shipping industry. Andrew P Goodwin
 The economic value of the EU shipping industry Andrew P Goodwin 2 nd April 2014 Introduction Shipping is a vital facilitator of world trade 135 % Increase in world GDP in the last two decades 180 % Increase
U.S. Civilian Unemployment Rate
 Chart 1 U.S. Civilian Unemployment Rate 11 10 9 8 % 7 6 5 4 3 2 14710147101471014710147101471014710147101471014710147101471014710147101471014710147101471014710147101471014710147101471014710147 1990 1991
Public Health in the Public Realm: Influencing Street Design with Health in Mind Dr. David McKeown Medical Officer of Health
 Public Health in the Public Realm: Influencing Street Design with Health in Mind Dr. David McKeown Medical Officer of Health Complete Streets Forum April 23, 2010 Common Goals of Public Health and Complete
Global economic cycle has slowed
 Year-on-year % change Confidence index, 50= no change Global economic cycle has slowed 25% 70 20% International trade growth 65 15% 10% Industrial production growth 60 5% 55 0% 50-5% Business confidence
FACTSHEET on Bike sharing and public bicycle system
 FACTSHEET on Bike sharing and public bicycle system This paper was prepared by: SOLUTIONS project This project was funded by the Seventh Framework Programme (FP7) of the European Commission www.uemi.net
Understanding the Pattern of Work Travel in India using the Census Data
 Understanding the Pattern of Work Travel in India using the Census Data Presented at Urban Mobility India Hyderabad (India), November 5 th 2017 Nishant Singh Research Scholar Department of Civil Engineering
Canada. UK France. Walk, Bike, Transit Share of Trips
 1950s 1960s Today Relationship between Share of Urban Trips by Transit, Bicycle, and Foot and Per Capita Annual CO 2 Emissions from Road and Rail Transport in Australia, Canada, the USA and EU Countries,
Update of trade weights data underlying the EERs and HCIs
 August 2017 Update of trade weights data underlying the EERs and HCIs The trade weights underlying the calculation of the effective exchange rates (EERs) of the euro and the harmonised competitiveness
Lithuanian export: is it time to prepare for changes? Aleksandr Izgorodin Expert
 Lithuanian export: is it time to prepare for changes? Aleksandr Izgorodin Expert Export is the main locomotive behind growth in LT economy Lithuania: change in real GDP and its components, % 78,2 71,8
Modal Integration with other modes. Jorge Minteguiaga
 Symposium on Public Transportation in Indian Cities with Special focus on Bus Rapid Transit (BRT) System New Delhi 20-21 Jan 2010 Modal Integration with other modes. Jorge Minteguiaga Content of this presentation
Traits of a Global Market for Advanced Human Capital How can the Global Demand for Post-secondary Education be met...
 Traits of a Global Market for Advanced Human Capital How can the Global Demand for Post-secondary Education be met... Washington D.C. May 23, 2002 .why are we here? Economic and social development are
National Transfer Accounts in Mexico
 National Transfer Accounts in Mexico Policy implications: labor market Iván Mejía Guevara imejiag@stanford.edu Stanford University 12th Global Meeting of the NTA Network, Mexico City, July 23-27, 2018
Understanding the trip and user characteristics of the combined bicycle and transit mode
 Delft University of Technology Understanding the trip and user characteristics of the combined bicycle and transit mode Shelat, Sanmay; Huisman, R.; van Oort, Niels Publication date 2017 Document Version
Arms industry statistics
 BRIEFING PAPER Number CBP 7842, 21 December 2016 Arms industry statistics By Rachel Kift and Rob Page Contents: 1. Global defence export market 2. UK defence export market www.parliament.uk/commons-library
DEVELOPMENT AID AT A GLANCE
 DEVELOPMENT AID AT A GLANCE STATISTICS BY REGION 5. EUROPE 2018 edition All the data in this report are available at: http://www.oecd.org/dac/financing-sustainable-development/ 5.1. ODA TO EUROPE - SUMMARY
Urban Pathways. FACTSHEET on Bike sharing and public bicycle system 2017
 Urban Pathways FACTSHEET on Bike sharing and public bicycle system 2017 This paper was prepared by: SOLUTIONS project This project was funded by the Seventh Framework Programme (FP7) of the European Commission
INFRASTRUCTURE: Using the Grid to Create a more Self-Sustaining Downtown. Studio Spring 2013
 EMERGENT FUTURES The San Diego Section of the American Society of Civil Engineers (ASCE) released a new report, the 2012 San Diego County Infrastructure Report Card. Since the last San Diego Report Card
BRAZIL S INVESTMENT CLIMATE
 São Paulo Rio de Janeiro Brasília Curitiba Recife Belo Horizonte Campo Grande London Lisbon Shanghai Beijing Miami Buenos Aires Johannesburg BRAZIL S INVESTMENT CLIMATE - 2011 DURVAL DE NORONHA GOYOS JR.
Using Public Policies to Promote Walking, Cycling, and Public Transport
 Using Public Policies to Promote Walking, Cycling, and Public Transport John Pucher, Rutgers University http://policy.rutgers.edu/faculty/pucher/ Worldwide Travel Trends Increasing daily travel distances