Cape Cod Commission Guidelines for Transportation Impact Assessment Technical Bulletin Revised January 9, 2003
|
|
|
- Clinton Jacobs
- 5 years ago
- Views:
Transcription

1 Cape Cod Commission Guidelines for Transportation Impact Assessment Technical Bulletin Revised January 9, 2003 Part 1 Part 2 Part 3 Part 4 Part 5 DRI Overall Guidelines for Transportation Impact Assessment Fair Share Overview and Methodology Automobile Trip Reduction Access Management Functional Classification of Roads This Technical Bulletin is intended for the use of planners and engineers in the preparation and review of traffic impact studies. Communities will also find these documents useful for local transportation planning.
2 Cape Cod Commission Guidelines for Transportation Impact Assessment Technical Bulletin Part 1 - Development of Regional Impact Overall Guidelines for Transportation Impact Assessment Revised January 9, 2003 The following guidelines were compiled as a representation of basic information to be included in traffic analysis sections of Development of Regional Impact (DRI) traffic assessments. Specific projects may warrant that additional information also be included. The primary intention of these guidelines is to ensure consistency among reports produced for review and that necessary information is developed in compliance with the Regional Policy Plan (RPP). The guidelines are outlined below. These guidelines are designed to be general and may be amended in the future as new research becomes available. These guidelines are applicable to all projects to varying degrees. Not all of the guidelines must be fully addressed in a DRI traffic assessment for every project; however, any deviation from such should be justified and/or agreed to by the Cape Cod Commission (CCC). A. Project Introduction 1. Proposal Description - A brief description of the proposed development and study area. The boundaries of this study area should be well defined and documented in the scope of the DRI traffic assessment but must include all Regional Roadway links and intersections where the development is expected to increase peak hour traffic. The total build-out of the development anticipated by the proponent must also be clearly stated. 2. Locus Map - to set context regionally a. Site plotted centrally on United States Geographical Survey (USGS) map or similar Geographic Information System (GIS) map base; b. Site plotted on State Highway Map or assessors map with locus defined; and, c. Map showing proposed site in relation to existing passenger and freight facilities and lines including rail, bus, ferry, bicycling, and walking modes. Also, the map should include all sensitive receptors such as schools, hospitals, elderly housing, parks, etc. identified in the scope where appropriate. 3. Site Access and Context Map A map at an appropriate scale showing site access as well as all properties and their accesses/driveways within 500 feet of the proposed development. The Map should also include any driveway interconnects to other properties as well as type and approximate size of nearby developments. 4. Site Plan - indicating proposed "footprint" of the project relative to other buildings on the site and showing all land owned by the proponent and all access to/from the site, Guidelines for Transportation Impact Assessment Page 1-1 Overall Guidelines for DRI Transportation Impact Assessment Revised January 9, 2003
3 including bicycle, pedestrian, transit, and rail access where appropriate. A standard engineering scale should be used. B. Existing Conditions 1. Roadway Network - indicating jurisdictional responsibilities of each roadway link within the study area and indicating regional roadway links and intersections. (The road network should include all roads used to access the regional roadway network from the site, if applicable.) 2. Traffic Volumes - a Base Year traffic flow map should be developed covering the entire study area. The Base Year for all transportation review should be the year of the DRI application. Exceptions may be allowed by the CCC in unusual circumstances. Peak Season average weekday volumes should be shown for 24 hours and the AM and PM peak hours in all cases. Saturday peak conditions should also be included for retail developments or other high weekend generators. Actual count volumes that are factored to base year levels should be no greater than two (2) years old and should include heavy vehicle counts. (Heavy vehicles are defined as any single or combination vehicle with more than two axles, 2-axle Recreational Vehicles, 2-axle box trucks, or buses.) Any adjustment factors or growth rates used should be cited and referenced. Actual traffic counts performed during April through November are preferred. Traffic studies based on counts conducted in December through March may be accepted at the discretion of the CCC, but require approval prior to submission. Traffic volumes under average season conditions should also be included in the analyses. Adjustment factors used for non-peak traffic counts should be cited, referenced, and fully justified. The annual Traffic Counting Report published by the CCC provides seasonal variation factors. 3. Pedestrian and bicycle counts may be required for specific developments. Transit usage should also be quantified on a site-specific basis. 4. Air quality analysis may be required for specific developments. 5. Crash History and Analysis - a minimum of three (3) most recent years available to identify problem locations using state and local data. A written request should be made initially to the local police department and the Massachusetts Highway Department for crash records. Analysis of crashes and the potential safety impacts of development and redevelopment must be included for all regional road links, at all intersections of regional roads, and at local road intersections with regional roads that are used by a project for access to the regional road network, where the project is expected to Guidelines for Transportation Impact Assessment Page 1-2 Overall Guidelines for DRI Transportation Impact Assessment Revised January 9, 2003
4 increase traffic by 25 or more trips during the project's peak season peak hour. Locations with an average of three or more crashes per year or a higher than average crash rate, as compared to the latest three years of local, regional, or state data, shall require measures to mitigate potential safety impacts of the development and redevelopment to comply with Minimum Performance Standard All measures to mitigate safety impacts must be consistent with Goal and its supporting Minimum Performance Standards. 6. Capacity and Level of Service (LOS) Analysis a Base Year capacity and level of service analysis shall be computed for the roadway network including site driveways, site access links and intersections (if appropriate), and all regional roadway elements (including links, intersections, U-Turns, rotaries, roundabouts, interchanges, bridges, etc.) LOS analysis shall include heavy vehicle percentages as measured and where appropriate. Performance indicators such as delay, travel time, v/c ratio, queue length, and traffic density, shall be documented in this section. A weave, merge, diverge and ramp road segment analysis shall be included where applicable. Also, departure lane merge capacity should be addressed as required and saturation flow rates adjusted accordingly. These analyses shall be performed using the most recent Highway Capacity Manual, and any updates published by the Transportation Research Board. If computer software is used for intersection analysis, the most recent version of Highway Capacity Software (HCS from the McTrans Center of the University of Florida, Gainsville) shall be used for analysis. Substitute software may also be used and will be considered for comparative analysis where applicable, such as SYNCHRO (from Trafficware of Albany, CA). SIDRA (from Akcelik & Associates of Melbourne, Australia) analysis is required for all analysis of rotaries and roundabouts. C. Trip Generation LOS analysis shall be based on typical peak season worst case conditions as well as average season conditions. The CCC may also request examining a specific peak hour depending on the type of development and location. Generally, it is the hour during which the development has the greatest number of trips in and out (also called the Peak of Generator ) which should be analyzed. Performance indicators such as volume to capacity ratio (v/c ratio), and delay should be reported regardless of value (e.g., v/c ratios greater than as well as less than 1.0, and seconds of delay greater than as well as less than 80 should be presented). 1. ITE Rates - the DRI traffic assessment should, as an initial analysis, use the unadjusted Institute of Traffic Engineers (ITE) rates for the particular land use code and be presented in this section of the report. The most recent edition of the Trip Generation manual published by ITE should be used for all land use codes. Trip generation should be developed using the "fitted curve" equations when statistically appropriate and used according to the methods outlined. Trip generation should be based on square footage in the case of most commercial development and on units in the case of most residential development. An alternative basis may be allowed by the Guidelines for Transportation Impact Assessment Page 1-3 Overall Guidelines for DRI Transportation Impact Assessment Revised January 9, 2003
5 CCC where appropriate. For peak hour analyses, the Peak of Generator trip generation will be used. 2. Alternative Trip Generation - may be submitted and will be considered for comparative purposes where appropriate. Alternative Trip Generation may be accepted and/or recommended by the CCC. Any alternative trip generation should meet, at a minimum, the ITE guidelines for alternative studies as noted in the ITE Trip Generation Handbook, October 1998 or its updates if published by ITE. 3. In some multi-use developments, land use interactions may reduce trip generation. The ITE method outlined in ITE Trip Generation Handbook, October 1998 or its updates if published by ITE should be followed. All resulting reductions are to be documented. 4. In the case of developments within Growth/Activity Centers (See MPS ), a 10% reduction of peak hour trip generation is allowed and for Growth Incentive Zones, a 25% reduction of peak hour trip generation is allowed for the purposes of analyzing peak hour impacts. However, neither are applicable to site driveways on regional roadways, or local roads used to access a development. These amounts should be outlined in a table. (Note that these reductions do not apply to trip reduction requirements as shown in Part 3 of these guidelines. See 7. below.) 5. An estimate of new heavy vehicle traffic to the site should also be included to assist in LOS analysis and trip reduction analysis under Build conditions. 6. The order in which the various adjustments to trip generation are to be computed is as follows: a. Base trip generation from ITE (Weekday, AM peak hour of generator, PM peak hour of generator, Saturday, Saturday peak hour of generator); b. Multi-use development interaction reduction (if applicable) based on ITE methodology; After steps a. and b., the 25% weekday trip reduction requirement of Goal is calculated. c. Reduction of Peak Hour trips by 25% for (required) trip reduction program / mitigation d. Reduction of Peak Hour trips by 10% if in a certified Growth / Activity Center and a reduction of 25% if in a certified Growth Incentive Zone. For example, a large, multiuse development may generate 4250 weekday average trips and 450 Saturday peak hour trips (step a.). The ITE land-use interaction method may reduce this to 4000 weekday trips and 430 Saturday peak hour trips (step b). Then, the 25% weekday trip reduction requirement is 25% of 4000 or 1000 trips. Guidelines for Transportation Impact Assessment Page 1-4 Overall Guidelines for DRI Transportation Impact Assessment Revised January 9, 2003
6 Next, the peak hour trips are reduced through trip reduction by 25% to 323 trips (step c.) The project is also in a certified Growth / Activity Center. The peak hour trips are reduced by another 10% to 290 peak hour trips. From this number, additional new trips / pass-by trips breakout as noted below may be applicable. D. Trip Distribution 1. Distribution - all generated vehicle trips to/from the site through all access points are to be documented. The following trips should be considered for all developments: a. Primary/Site - "one which the purpose of the trip is shopping and the trip pattern is generally home-to-shopping-to-home." b. Pass-By/Site - "directly from the traffic stream passing the facility on the adjacent street system and does not require a diversion from another roadway." The amount of Pass-by trips should be based on the most recent data from ITE, but should be no more than the amount allowed by MEPA or 25%, whichever is lower. Pass-By/Site trips credits may be allowed for the following land uses: Retail, banks, supermarkets, hardware stores, convenience stores, fast-food and high-turnover restaurants, gas stations, building material stores (provided a majority of the business sales are to retail, not wholesale, customers), video rental stores, pharmacy / drug stores No pass-by trip credit should be taken for the following uses: Residential, medical and dental offices and clinics, hospitals, churches, schools, offices, libraries, industrial, manufacturing, warehousing, self-storage, automotive sales and services, theatres, golf courses and driving ranges, arenas, athletic facilities and fields, gyms, casinos, bowling alleys, and night clubs. The CCC should be consulted if additional clarification is needed. A development within 500 feet of a regional roadway/intersection with average daily traffic flows which will support the development may be able to take up to the maximum pass-by trip credit (see above guidelines) for regional roadway links and intersections beyond this regional roadway/intersection. All roads/intersections connecting from the development to this supporting roadway should consider all trip generation (i.e. no pass-by credit.) The key regional roadway access intersection analysis should consider additional turns created by pass-by traffic. Developments not within 500 feet of a regional roadway capable of supporting the development will only be allowed pass-by trip credits limited to the adjacent street peak hour trips multiplied by the appropriate pass-by rate (see above guidelines.) Guidelines for Transportation Impact Assessment Page 1-5 Overall Guidelines for DRI Transportation Impact Assessment Revised January 9, 2003
7 2. Trip generation summary a graphical or tabular summary of trip distribution and trip generation outlining new trips to and from the proposed development should be submitted. E. Future Conditions 1. Traffic Volumes - for the "no-build" and "build" scenarios should be graphically shown for the AM, PM, and if applicable, Saturday peak hour of generator peak season and average season. Future conditions should cover a five-year time horizon as a minimum. This five-year horizon should be from the Base Year as defined in section B-2. a. A graphical summary should be submitted showing the five-year (from Base Year) No Build traffic volumes. Background baseline traffic growth should be included in future year background volumes. The traffic assignment for all other planned developments should be combined with future year background volumes to develop the "no-build" traffic volumes. b. A graphical summary of project-generated new trips on regional roadway links and intersections after adjustments should be submitted which includes increased peak hour trip distribution to the last trip. c. The traffic assignment for the proposed development should then be added to the no-build volumes to generate five-year "build" volumes. 2. Current Projects - table of DRI, local and/or MEPA projects, transit service, and infrastructure improvement projects within the study area covering at a minimum a five-year time horizon. Proponents should contact state agencies, the CCC, and local communities regarding the impact of other known projects in the affected study area to determine how to incorporate those impacts in the study. 3. Capacity Analysis and LOS Analysis - capacity and LOS under future conditions should be computed for no build and build, without and with mitigation measures in place, for peak and average season. The performance indicators as documented above in the Existing Conditions section of the report should again be computed and depicted in tabular form. The analysis must cover all regional roadway elements, site driveway intersections, and any intervening roadways between the development and the regional roadway access. Where applicable, heavy vehicle percentages are to be estimated from actual data and included in the LOS analysis. 4. Signal Warrant Analysis - using the most recent edition of Manual on Uniform Traffic Control Devices Handbook, Federal Highway Administration (FHWA). Locations to be analyzed include all unsignalized study area intersections. 5. Summary - tabular summary comparing level-of-service performance indicators for base-case, five-year "no-build", and five-year "build" scenarios. Guidelines for Transportation Impact Assessment Page 1-6 Overall Guidelines for DRI Transportation Impact Assessment Revised January 9, 2003
8 F. Mitigation Measures All assessments should include but not be limited to the following: 1. Mitigation Actions - future year performance degradation must be fully mitigated to equivalent "no build" levels of performance indicators such as delay and v/c ratios. Improvements should address safety-related problems at high crash locations as identified in RPP Goal Additional Analysis - capacity analyses of all mitigation measures should be computed as outlined above. Impacts on wetlands, archaeological resources, right-ofway availability, historic resources, scenic resources, community character, etc., should also be examined for all mitigation proposed to determine the feasibility of implementation. Impacts of traffic mitigation on air quality may be necessary when required by MEPA or when the increase in raw trip generation is 3,000 or more daily vehicle trips. The most current emissions model should be used, if an analysis is required. 3. Optional Mitigation under certain circumstances, it may possible to mitigate the impacts of development on parts of the Regional Roadway system which are impacted by fewer than 25 trips through a transit equivalency buyout. The applicant should discuss the possibility of using this buyout with the CCC before applying it. If approved for use by the CCC, the following procedure should be followed: (a.) The applicant should choose a study area wide cutoff for actual peak hour mitigation by selecting a number of new peak hour trips of less than 25. (b.) For all links inside the cutoff, a summation of the vehicle miles of travel (VMT) covered in the actual mitigation plan should be calculated by multiplying the number of peak hour peak season trips on each Regional Roadway link by the length of each link, and summing over the links inside the cutoff. (c.) The overall VMT of the project should be calculated by multiplying the project s new peak hour trips by the analysis trip length as defined in Part 3 of these guidelines. (d.) The remaining VMT to be mitigated should be calculated by subtracting the result of (2.) from the result of (3.). This net VMT should be mitigated through a fee paid to CCC/Barnstable County based on the transit equivalency of this VMT as outlined in Part 3 of these guidelines. These funds will be expended by the CCC to improve transportation in the project s study area and/or town(s) and/or according to MPS (e.) The applicant is still responsible for providing mitigation as directed by MPS and other RPP requirements for all links and intersections inside the cutoff area. Guidelines for Transportation Impact Assessment Page 1-7 Overall Guidelines for DRI Transportation Impact Assessment Revised January 9, 2003
9 4. Commitment - the report should clearly identify the individual costs of the proposed improvements. Conceptual improvement plans should be developed showing the recommended proposed improvements. The party agreeing to be responsible for the implementation of the proposed improvements should also be clearly identified. A mechanism by which these commitments will be executed and their intended duration should be indicated where applicable. Also, a schedule of when, in relation to any project phasing, particular improvements need to be implemented, should be outlined. 5. On-Site Improvements - the proposed site layout in relation to the existing right-ofway should be clearly shown. Also, the following should be included: a. Scaled plan showing existing and proposed layout lines, building and parking lot areas, driveways and land usage. b. Proposed geometric changes and widening (driveways, storage lanes, and acceleration/deceleration lanes). c. Construction Schedule - of proposed mitigation measures for construction traffic impacts, noise and dust pollution from construction equipment, and any capacity restraints on the existing network during construction. 6. Off-Site Improvements - the proposed improvements in relation to the existing rightof-way should be clearly shown. Also, the following should be included: a. Scaled plan showing existing and proposed layout lines; b. Proposed geometric changes and widening (storage lanes, acceleration/deceleration lanes); c. Proposed signalization and/or signal improvements including conceptual phasing and timing; and d. Implementation Strategy and Construction Schedule - of proposed mitigation measures for construction traffic impacts, noise and dust pollution from construction equipment, and any capacity restraints on the existing network during construction. 7. Fair Share Mitigation Analysis include all proposed fair share analysis and commitment per Part 2 of the Technical Bulletin G. Trip Reduction Measures Per Part 3 of the Technical Bulletin including Trip Reduction Plan, Trip Reduction Calculations, Land Donation Analysis, Transit Equivalency Calculations, etc. Guidelines for Transportation Impact Assessment Page 1-8 Overall Guidelines for DRI Transportation Impact Assessment Revised January 9, 2003
10 H. Other Analysis which Should Be Included: I. Appendix a. Stopping sight distance analyses / sight distance measurements - sight distance requirements according to the most recent A Policy on Geometric Design of Highways and Streets published by the American Association of State Highway and Transportation Officials (AASHTO) must be addressed. This includes Stopping Sight Distance at proposed site drives and affected area intersections. Include letter signed by a licensed professional engineer or licensed surveyor certifying sight distances. b. A parking analysis including the number of required spaces under town zoning and the number of proposed spaces. If any additional parking spaces above zoning are proposed, an analysis as to why the spaces are needed must be submitted for Commission review based on MPS The analysis should be objective and consistent with ITE s Parking Generation or other such national studies based on actual parking accumulation. The following list identifies data that should be included in each report. This list is to be consistently followed when displaying data and analyses: 1. Recorded traffic counts a. Turning movement counts, including heavy vehicles b. Directional volume counts c. Existing AM/PM peak period and 24 hour traffic volumes including Peak Hour Factors by approach d. Future year peak hour traffic volumes e. Adjustment factors and sources 2. Preliminary sketches and layout plans 3. Capacity and LOS analysis data a. Lane geometry b. Assumed signal phasing and timing c. Assumed saturation flow rates d. All worksheets or computer outputs 4. ITE land use code sheets or other summary sheets showing trip generation calculations 5. ITE multi-use development trip reduction estimate sheets, if applicable 6. Signal warrant analysis sheets Guidelines for Transportation Impact Assessment Page 1-9 Overall Guidelines for DRI Transportation Impact Assessment Revised January 9, 2003
11 J. Analysis and Design Standards The most recent editions of the following publications are applicable: 1. Highway Capacity Manual, Transportation Research Board. 2. Trip Generation, Institute of Transportation Engineers. 3. Manual on Uniforms Traffic Control Devices Handbook and Massachusetts Amendments. 4. Massachusetts Highway Department Design Manual. 5. American Association of State Highway and Transportation Officials (AASHTO) Handbook. 6. Parking Generation, Institute of Transportation Engineers. Guidelines for Transportation Impact Assessment Page 1-10 Overall Guidelines for DRI Transportation Impact Assessment Revised January 9, 2003
12 Cape Cod Commission Guidelines for Traffic Impact Assessment Technical Bulletin Part 2 - Fair Share Overview and Methodology Revised January 9, 2003 The Cape Cod Commission Regional Policy Plan (RPP), includes the following Minimum Performance Standard (MPS) regarding mitigation of transportation impacts: MPS Developments of Regional Impact shall provide for full mitigation of project impacts on all regional road links, at all intersections of regional roads, and at local road intersections with regional roads that are used by the project for access to the regional road network In lieu of mitigation of traffic impacts concurrent with project development, the Commission, at its discretion, may allow a fair-share payment of funds to Barnstable County Other MPS outline acceptable mitigation strategies. Please refer to Goal of the RPP Introduction The provision for a payment of funds commensurate with project impacts in RPP Minimum Performance Standard necessitates a reasonable and rational method for determining fair share financial contributions for traffic mitigation proposed by Development of Regional Impact (DRI) applicants. The method outlined in this part of the Technical Bulletin is most likely to be used in the evaluation of automobile traffic impacts on intersection capacity. The Commission may require improvements or a fair share financial contribution towards the cost of constructing capacity improvements to the regional roadway system and connectors necessitated by traffic attributable to the development of the project site. These improvements include mitigation strategies described under RPP Goal Improvements that benefit only the applicant shall be entirely the applicant's responsibility and are not considered in the fair share determination. Examples of this may include acceleration and deceleration lanes for site access points, left turn lanes which only provide access to the site, and traffic signals located at the applicant's driveway(s). Methodology Applicants are responsible for mitigation at each Study Area Location where, after adjustments, there is an increase in traffic during the project s peak hour as outlined in MPS Mitigation at each study area Location shall, at a minimum, be designed to add capacity sufficient to accommodate the background traffic anticipated under the analysis year determined for the project scope, as well as the applicant's DRI traffic while maintaining or improving Guidelines for Transportation Impact Assessment Page 2-1 Fair Share Overview and Methodology Revised January 9, 2003
13 performance indicators (average delay, reserve capacity, volume/capacity [V/C ratio], etc., as appropriate). Such mitigation must be in accordance with the access requirements, standards, and policies of the appropriate state, regional, or local jurisdictions as determined by the Commission. Fair share contributions are at the discretion of the Commission. In addition, such mitigation shall be consistent with RPP Goal Thus, proposed fair share contributions shall not be acceptable at locations where any of the following is true: The intersection or road link will operate at LOS E or F without actual improvements, due to the resulting safety hazards (MPS ); A safety deficiency exists under Base Year no-build conditions (MPS and MPS ); The fair share mitigation would degrade community character, scenic resources, and/or natural resources (MPS ); and The fair share mitigation involving signalization, intersection widening, or road widening is in local or national historic districts (MPS ). The Capacity Addition created by mitigation is equal to the Capacity With Mitigation minus the Capacity Without Mitigation. Capacity means the maximum traffic volume possible with LOS E. When more than one measure of LOS is possible at a Location, such as the various movements at an unsignalized intersection, then the most sensitive measure, i.e., any one movement operating at LOS E/F, is the movement used to determine the capacity. Traffic volumes for all movements should be factored by a constant so that all movements will remain a fixed percentage of the total volume at the Location. The sum of the volumes of all movements is the Capacity for that scenario. Capacity Without Mitigation will be that of the given Location's existing geometric configuration under prevailing traffic conditions (such as peak hour factor, vehicle mix, and other assumptions consistent with the pattern of existing traffic and projected traffic growth) combined with DRI traffic (and then factored to meet the LOS E maximum volumes). Capacity With Mitigation will be that of the given Location's proposed (mitigated) configuration under prevailing traffic conditions, given the pattern of existing traffic and projected traffic growth combined with DRI traffic (and then factored to meet the LOS E maximum volumes.) Capacity Addition = Capacity With Mitigation - Capacity Without Mitigation The fair share proportion at a Location is equal to the DRI Traffic divided by the Capacity Addition, as reflected in the following formula: Fair Share Proportion = DRI Traffic / Capacity Addition The cost of mitigation at a Location is the public cost for the responsible agency(ies) to provide the mitigation. This includes the following Mitigation Elements: 1. Design of the mitigation; Guidelines for Transportation Impact Assessment Page 2-2 Fair Share Overview and Methodology Revised January 9, 2003
14 2. Right-of-way appraisal and acquisition; 3. Construction of the mitigation; 4. Inspection and management of the construction; and 5. Environmental cleanup, permits, and mitigation. Mitigation Cost = Sum of the above Mitigation Elements The fair share at a Location is equal to the fair share proportion times the cost of the mitigation, as reflected in the following formula: Fair Share = Fair Share Proportion x Mitigation Cost The applicant's Fair Share Contribution at each location is equal to the Fair Share at each location less the estimated value of Mitigation Elements (item h. above) performed at the expense of the applicant for the specific location prior to the issuance of a certificate of compliance. The Fair Share Contribution should likewise be reduced by the amount, if any, which is assessed in other agencies' transportation impact fees and the transportation portion of municipalities' local impact fees which are directly related to the specific location. Fair Share Contribution = Fair Share - (Performance of Mitigation Elements + Transportation Impact Fees) The Fair Share Total Contribution is equal to the sum of the applicant's fair shares at all locations. Fair Share Total Contribution = Sum of all Locations' Fair Share Contribution For Locations which have been analyzed through a previous DRI review, and where such Locations were (1) identified for necessary improvements and (2) improvements are already constructed or construction is pending, subsequent DRIs impacting the Location may make a fair share contribution if the additional DRI traffic does not degrade LOS of the improved location beyond LOS D. In limited circumstances, the applicant may make use of Fair Share analyses created by previous DRIs, subject to CCC review. The Fair Share Process may be applied to subsequent DRIs in the same manner as stipulated above. Guidelines for Transportation Impact Assessment Page 2-3 Fair Share Overview and Methodology Revised January 9, 2003
15 Cape Cod Commission Guidelines for Traffic Impact Assessment Technical Bulletin Part 3 - Automobile Trip Reduction Revised January 9, 2003 This part of the Traffic Impact Assessment Technical Bulletin describes approaches to meeting the goal of the Regional Policy Plan to reduce dependence on automobiles. In particular, it discusses approaches to meeting Minimum Performance Standards (MPS) under goal 4.1.2: To reduce and/or offset the expected increase in motor vehicular trips on public roadways and to reduce dependency on automobiles. Background Providing alternative modes of transportation to reduce the region's dependence on the automobile is an important goal of the Regional Policy Plan. No less than 85% of the respondents to the 1995 Cape Cod Residents Survey wanted to encourage the provision of alternate modes of transportation. Reducing our dependence on the automobile is a significant challenge and an ambitious goal. Many of the goals and strategies of the Cape Cod Commission and the towns are to encourage alternatives to automobiles. To achieve these goals, the Regional Policy Plan requires Developments of Regional Impact to offset a minimum of 25% of their projected traffic volumes with alternatives to automobile travel (refer to MPS ). Possible strategies include carpooling programs, enhanced pedestrian and bicycle accessibility and transit. Methods and Strategies The first step in complying with RPP Goal is to determine average traffic generated for that land use. Sources of this data typically include the Institute of Transportation Engineers (ITE) Trip Generation or may include observations of similar land uses. See Part 1 of these guidelines for additional requirements and multi-land use development adjustments. Also, heavy vehicle volumes should be estimated. Consistent with MPS , any vehicle with more than two axles shall be counted as the ratio of the number of vehicle axles to two. For example, a development expected to generate ten, 5 axle truck trips per day, shall subtract 10 ten trips from the estimated weekday traffic and add (10 * 5)/2 = 25 trips to the weekday trip generation estimate. (This trip generation adjustment is for trip reduction purposes only and is not included in the peak hour analysis. Peak hour analysis should account directly for heavy vehicle traffic. See Part 1 of the Technical Bulletin for more information.) The required trip reduction is 25% of the average daily traffic generated by that type of land use. MPS requires trip reduction of only 12.5% of average weekday traffic for development within Growth Incentive Zones. For such developments, the full 25% peak hour trip reduction for purposes of peak hour traffic analysis is allowed when the 12.5% trip reduction is met. Applicants may propose a combination of the strategies identified below to achieve the required trip reduction. In all cases, applicants are encouraged to identify and evaluate strategies that are Guidelines for Transportation Impact Assessment Page 3-1 Automobile Trip Reduction Revised January 9, 2003
16 appropriate for their project. Sources of data should be identified and methods used should be justified. In-kind strategies are those that the applicant can and will implement as a condition of the project. These may include enhancing bicycle and pedestrian access to a project, implementing shuttle service to and from the project, and carpooling. The effectiveness of various strategies depends on the type of land use, proximity to existing transit corridors, walking and bicycling characteristics of the area and other factors. Additional transportation demand management ideas include: Support Measures Transportation Services Economic Incentives Preferential parking for Provide/subsidize vans for Subsidize transit passes car/vanpoolers vanpoolers On-site bicycle racks/lockers Provide public transportation Incentives and allowances for using alternate modes of transportation Showers and changing facilities for Guaranteed ride home program -- bikers / joggers (company car, rental car, cab, designated driver Arrange employee work hours to Park & ride lots -- match transit schedules Compressed work weeks -- Flexible work hours for ridesharers -- Transportation coordinator Trip reduction monitoring program Delivery services In addition, MPS allows a portion of the trip reduction to be met through transit when a transit service is located immediately adjacent to a development. The trip reduction program should include securing (or maintaining) a bus stop and/or shelter at the location and employee / customer use incentives such as discount passes, posted schedules, etc. The credit for developments with adjacent year round service is 5% and with seasonal only service (running a minimum of eight weeks including July and August), 2.5% of the average daily traffic. A financial commitment to a strategy may also be used to comply with RPP Goal For example, a project could participate in funding a project to initiate and operate variable message signs or information programs to reduce automobile travel on Cape Cod. The amount paid depends on the program cost and the expected traffic reduction. The principles of Part 2 - Fair Share should be followed. Donation and permanent conservation of land above other open space requirements capable of producing the number of trips to be reduced is allowable under the RPP. (MPS a) At a minimum, the preservation of vacant developable land should meet the following requirements: Guidelines for Transportation Impact Assessment Page 3-2 Automobile Trip Reduction Revised January 9, 2003
17 The land should include the entirety of an individual, buildable lot; The lot should be permanently protected through donation to a conservation entity such as a town conservation commission or an appropriate non-profit land trust, or through a MGL, Chapter 184, conservation restriction. The method of protection must extinguish future development potential, including prohibiting access to offsite development through the protected parcel; The lot should have legal frontage; The lot should meet the zoning requirements in effect including allowed use, minimum lot size, front, side, and rear setbacks, maximum building and lot coverage, maximum building height; The theoretical use of the property should be allowed under zoning; The theoretical use trip generation credit should be based on the same land use and trip generation values/formulas as the development trip generation; and, In the case of commercial development, it is possible to conserve residentially zoned property provided it meets the requirements above. The trip generation credit would be for theoretical residential development, not commercial development on residentially zoned land. A monetary commitment to public transportation, based on the estimated cost of public transportation and the expected vehicle miles traveled by automobiles to and from the site, and the expected term of the project, for a period not less than 20 years. The use of standard values and cost estimates for the monetary commitment to public transportation should be used as identified below (See example estimation sheet at end of this section): TRIP LENGTH (to be filled in on line 2. of the Transit Equivalency estimation sheet) Project Use Analysis Trip Length Residential 4.64 Average Returning Home Trip Length Retail 2.75 Average Shopping Trip Length Medical / Dental / Hospital 4.82 Average Medical Dental Trip Length Church 3.25 Average Religious Trip Length School / College 4.98 Average School Trip Length Office 6.19 Average Earn a Living General Cat. Trip Length Library 3.44 Average Other Family / Personal Business Trip Length Industrial 6.19 Average Earn a Living General Cat. Trip Length Manufacturing 6.19 Average Earn a Living General Cat. Trip Length Movie / Theater 5.7 Average Other Social / Recreational Trip Length Restaurant 3.2 Average Out to Eat Trip Length Hotel / Motel 4.07 Avg. of Out to Eat, Other Soc.& Rec., Shopping, and Return Home (Private) Sports / Recreation 5.7 Average Other Social and Recreational (including golf, spectator, etc.) Mini Warehouse / Self Storage 3.44 Average Other Family & Personal Business Guidelines for Transportation Impact Assessment Page 3-3 Automobile Trip Reduction Revised January 9, 2003 Basis
18 Project Use Analysis Trip Length Automotive Sales / Service 3.44 Average Other Family & Personal Business Bank 3.44 Average Other Family & Personal Business Base: All lengths one-half 1995 National Transportation Survey for each category. Note: Table subject to update and changes as new information becomes available. New National Passenger Transportation Survey data is expected early Check with the CCC for latest values. Basis TRANSIT COST (to be filled in on line 5. of the Transit Equivalency estimation sheet) Year of DRI Approval Bus Cost 2002 $ $ $ $ $ $59.46 Table subject to update and changes as new information becomes available. Check with the CCC for latest values. Based on CCRTA data. Transit Costs - Transit costs are tied to capital equipment and labor costs, which often rise faster than inflation. As of August, 2002, the CCC recommends 3.5% transit inflation rate on line 12 of the estimation sheet. Check with the CCC for changes. Escrow Interest - Long term interest rates vary over time. As of August 2002, the CCC recommends 1.5% interest earned on escrow on line 13 of the worksheet. Check with the CCC for changes. Calculation of Factor - The calculation to determine the factor on line 15 is as follows: Define: Transit inflation rate = t (as a fraction) Interest earned on escrow = e (as a fraction) Years of Operation = m Then the factor (line 15) is: { [ (1+t) / (1+e) ]^m 1 } / { [ (1+t) / (1+e) ] 1 } Guidelines for Transportation Impact Assessment Page 3-4 Automobile Trip Reduction Revised January 9, 2003
19 Plan Publication and Information Final trip reduction plans may be published by the CCC on its transportation website to inform the public of the plan. In addition, all plans should include a provision to post the following web address: (or similar CCC address per CCC direction) in trip reduction literature, at ride matching boards, in employee trip reduction reminders, etc. Guidelines for Transportation Impact Assessment Page 3-5 Automobile Trip Reduction Revised January 9, 2003
20 Transit Equivalency: Example Calculation Line 1. Identify number of trips 300 trips per day 2. Identify average trip length (see Technical Memorandum) 4.64 mile(s) 3. Determine 25% of total VMT 25% x 300 x 4.64 = 348 daily VMT 4. Year of DRI Approval Transit Cost $ per hour 6. Bus Capacity 30 seats 7. Bus Operating Speed 20 mph 8. Assume 100% Occupancy 9. Cost per passenger $ = $0.09 per mile 10. Daily Cost 348 x $0.09 = $30.05 per day 11. First Year Cost 365 x $30.05 = $10,968 Analysis for One Time Payment 12. Transit Inflation Rate = 3.5% 13. Interest Earned on Escrow* = 1.5% K Years of Operation = Factor based on inflation, interest, & years of operation = years of operation, one time payment is x $10,968 = $265,700 *Consult CCC staff for current available rate
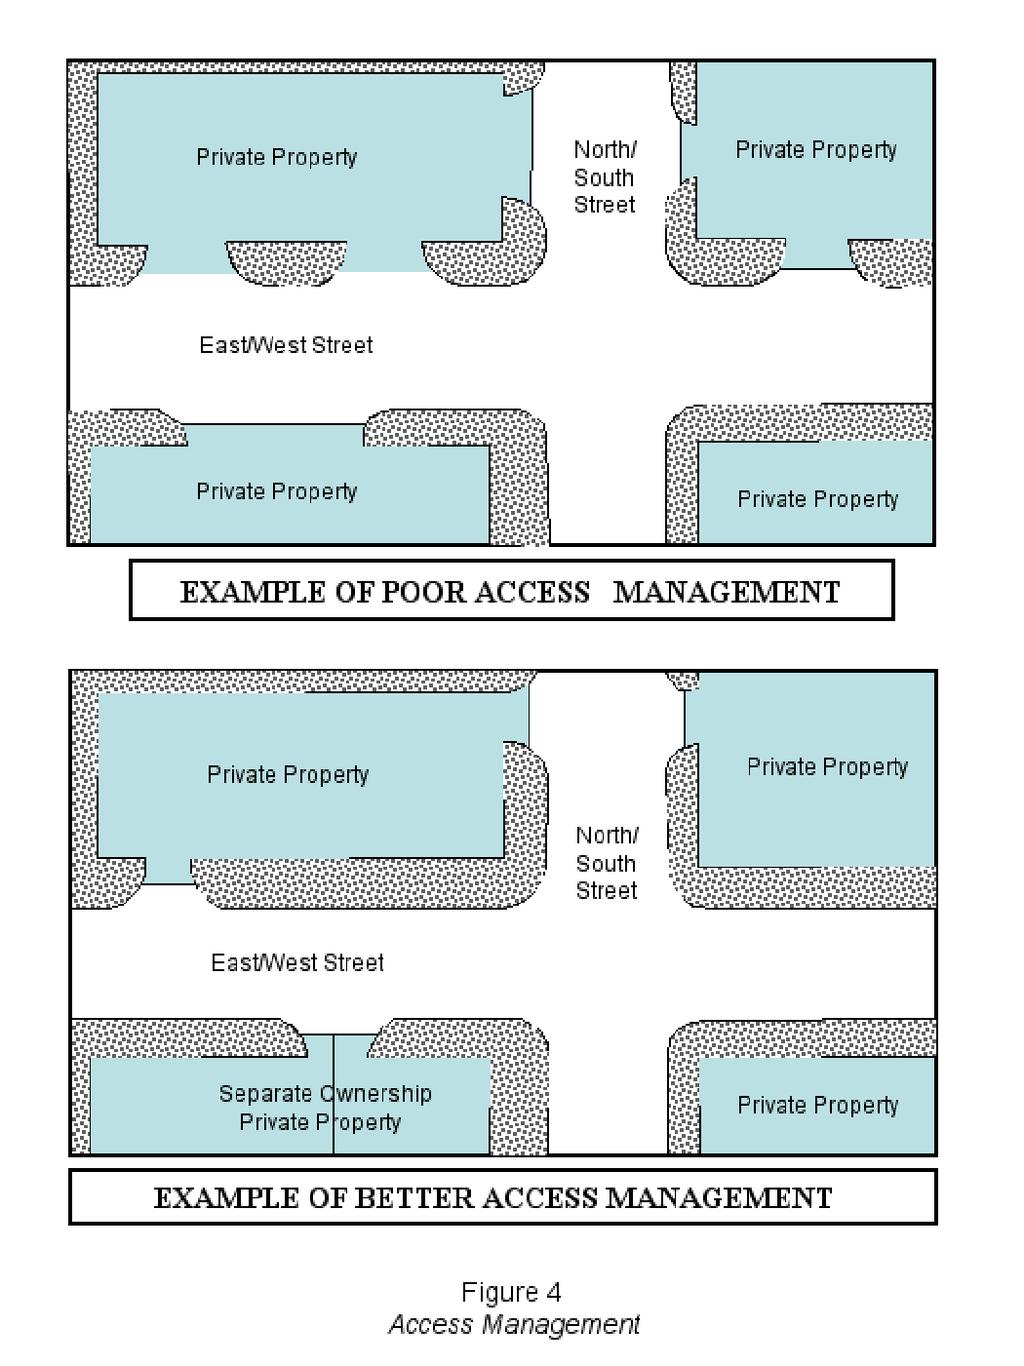
21 Cape Cod Commission Guidelines for Traffic Impact Assessment Technical Bulletin Part 4 - Access Management Revised January 9, 2003 In the past, traffic congestion was generally alleviated through roadway widening and new road construction, not by finding more efficient ways of using the existing roadway system. In the past, lack of access management and the proliferation of driveway access to major roadways resulted in the public funding the widening of roads, upgraded infrastructure, and the construction of new roads. Recently, this approach is becoming less feasible. Coordination of land use and transportation planning through access management can benefit all users of Cape Cod roadways and businesses along roadways that are experiencing deterioration in accessibility and safety. Recent legislation encourages finding ways to more efficiently manage our current transportation system. Nationally, federal funding is being reduced for roadway system expansion through the Clean Air Act Amendments of 1990, the Intermodal Surface Transportation Efficiency Act of 1991 (ISTEA), and the Transportation Equity Act for the 21 st Century of 1998 (TEA21). Regionally, Barnstable County s Regional Policy Plan echoes this direction through its goals and policies. Locally, each town s Local Comprehensive Plan provides a look into the future with these goals and policies in place. This technical bulletin assists landowners and local officials in establishing the balance between land access and mobility for various types of roads. Towns may incorporate access management in their local comprehensive planning and in their local regulations through the regulatory powers of their local Planning and Zoning Boards. What Is Access Management? Access Management is a way to organize traffic movements to better use existing roadway capacity that results in continued economic viability of adjacent land development. Corridors where access management is employed can sustain a higher level of development. Access management is also a way to lengthen the useful life of roadways without adding traffic lanes. This is accomplished through controlling access location and spacing, prohibiting turn movements, provision of turn lanes, location of median barriers, and access geometry. Every driveway creates the potential for accidents at conflict points, where the paths of traffic traveling the roadway intersect with the paths of traffic turning into and out of driveways. Reducing the number of driveways and increasing the spacing between driveways and intersections separates these conflict areas. See Figures 1 through 3. Appropriate driveway spacing simplifies the driving task by locating driveways along the roadway such that drivers can monitor one driveway at a time, rather than several simultaneously. Longer driveway spacing reduces the amount of information a driver must acquire, process, and react to, thus simplifying the driving task. Shorter driveway spacing Guidelines for Transportation Impact Assessment Page 4-1 Access Management Revised January 9, 2003
22 4 WAY INTERSECTION 32 POINTS OF CONFLICT Figure 1 Access Management
23 T - INTERSECTION 9 POINTS OF CONFLICT Figure 2 Access Management
24 ROUNDABOUT 8 POINTS OF CONFLICT Figure 3 Access Management
25
26 requires the driver to watch for traffic entering and exiting several driveway locations at once while maintaining control of his own vehicle. Figure 4 shows examples of poor and better access management. Advantages of Access Management The economic viability of adjacent land development along a roadway experiencing traffic congestion and high accident rates will be impacted by further deterioration in traffic conditions. Without restrictions on access, traffic congestion will increase, lower travel speeds will result, and longer travel delays and higher accident rates will occur throughout the corridor. With access management, a greater amount of development can be served by a roadway because a greater amount of traffic can be served with longer driveway spacing, better access location, coordinated traffic control and better driveway design. It is a valuable tool for preventing the loss of roadway capacity that often accompanies high traffic generating development. The loss of roadway capacity most often occurs along roadway corridors with numerous adjacent commercial developments such as Route 28 in Yarmouth, Route 6 in Eastham, and Route 6A in Orleans. Access management applied to arterial roads can maintain the road's function within the overall transportation system to serve through traffic, resulting in higher accessibility in the region. Access management measures that separate turning vehicles from through vehicles create more efficient flow of traffic and minimize accidents. Barnstable County s Regional Policy Plan recommends that each town identify areas in need of access management techniques to minimize accidents and relieve traffic congestion. A critical time to consider access changes occurs when new development is proposed and when adjacent roadway and intersection improvements are proposed. This technical bulletin is intended to promote awareness of the impact of continued uncontrolled access and consideration of access management as a way for local authorities to deal with congestion. It also reviews some of the access management requirements of the Regional Policy Plan. Access Management Techniques The most effective use of the following techniques is when new developments are being proposed, when redevelopment or change of use occurs, and when roadway and traffic control improvements are planned. Traffic impact studies provide an opportunity to address access management. Economic incentives may also be a feasible way to encourage access management for existing businesses. Relating Roadway Function With Land Access And Mobility The relationship between mobility and land access for various classifications of roadways is shown in Figure 5. Higher mobility is characterized by higher speeds and uniform traffic flows Guidelines for Transportation Impact Assessment Page 4-2 Access Management Revised January 9, 2003
TRAFFIC STUDY GUIDELINES Clarksville Street Department
 TRAFFIC STUDY GUIDELINES Clarksville Street Department 9/1/2009 Introduction Traffic studies are used to help the city determine potential impacts to the operation of the surrounding roadway network. Two
TRAFFIC IMPACT STUDY CRITERIA
 Chapter 6 - TRAFFIC IMPACT STUDY CRITERIA 6.1 GENERAL PROVISIONS 6.1.1. Purpose: The purpose of this document is to outline a standard format for preparing a traffic impact study in the City of Steamboat
Clackamas County Comprehensive Plan
 ROADWAYS The County s road system permits the movement of goods and people between communities and regions, using any of a variety of modes of travel. Roads provide access to virtually all property. They
1609 E. FRANKLIN STREET HOTEL TRAFFIC IMPACT STUDY EXECUTIVE SUMMARY
 1609 E. FRANKLIN STREET HOTEL TRAFFIC IMPACT STUDY EXECUTIVE SUMMARY Prepared for: The Town of Chapel Hill Public Works Department Traffic Engineering Division Prepared by: HNTB North Carolina, PC 343
Highway 111 Corridor Study
 Highway 111 Corridor Study June, 2009 LINCOLN CO. HWY 111 CORRIDOR STUDY Draft Study Tea, South Dakota Prepared for City of Tea Sioux Falls Metropolitan Planning Organization Prepared by HDR Engineering,
TRANSPORTATION ANALYSIS REPORT US Route 6 Huron, Erie County, Ohio
 TRANSPORTATION ANALYSIS REPORT US Route 6 Huron, Erie County, Ohio December 12, 2012 Prepared for: The City of Huron 417 Main Huron, OH 44839 Providing Practical Experience Technical Excellence and Client
Traffic Impact Analysis Walton Acres at Riverwood Athletic Club Clayton, NC
 Traffic Impact Analysis Walton Acres at Riverwood Athletic Club Clayton, NC 1. TABLE OF CONTENTS INTRODUCTION...1 1.1. Site Location and Study Area...1 1.2. Proposed Land Use and Site Access...2 1.3.
Traffic Impact Study. Westlake Elementary School Westlake, Ohio. TMS Engineers, Inc. June 5, 2017
 TMS Engineers, Inc. Traffic Impact Study Westlake Elementary School Westlake, Ohio June 5, 2017 Prepared for: Westlake City Schools - Board of Education 27200 Hilliard Boulevard Westlake, OH 44145 TRAFFIC
CHAPTER 4 TRANSPORTATION IMPACT STUDY TABLE OF CONTENTS
 CHAPTER 4 TRANSPORTATION IMPACT STUDY TABLE OF CONTENTS Section Title Page 4.1 Introduction... 4-1 4.1.1 General... 4-1 4.1.2 Applicant Responsibility... 4-1 4.1.3 Capacity and Safety Issues... 4-1 A.
Technical Memorandum TRAFFIC IMPACT STUDY. RIDLEY ROAD CONVENIENCE STORE Southampton County, VA. Prepared for: Mr. David Williams.
 Technical Memorandum TRFFIC IMPCT STUDY RIDLEY ROD CONVENIENCE STORE Southampton County, V Prepared for: Mr. David Williams By: Charles Smith, P.E., PTOE EPR Charlottesville, V July 2014 1 TBLE OF CONTENTS
TRAFFIC IMPACT STUDY And A TRAFFIC SIGNAL WARRANT ANALYSIS FOR A SENIOR LIVING AND APARTMENT DEVELOPMENT
 TRAFFIC IMPACT STUDY And A TRAFFIC SIGNAL WARRANT ANALYSIS FOR A SENIOR LIVING AND APARTMENT DEVELOPMENT DEERFIELD TOWNSHIP, WARREN COUNTY, OHIO Nantucket Circle and Montgomery Road () Prepared for: ODLE
Traffic Impact Study WestBranch Residential Development Davidson, NC March 2016
 Traffic Impact Study WestBranch Residential Development Davidson, NC March 216 TRAFFIC IMPACT STUDY FOR THE WestBranch Residential Development LOCATED IN DAVIDSON, NC Prepared For: Lennar Carolinas, LLC
Chapter 4 Traffic Analysis
 Chapter 4 Traffic Analysis PURPOSE The traffic analysis component of the K-68 Corridor Management Plan incorporates information on the existing transportation network, such as traffic volumes and intersection
METHODOLOGY. Signalized Intersection Average Control Delay (sec/veh)
") Chapter 5 Traffic Analysis 5.1 SUMMARY US /West 6 th Street assumes a unique role in the Lawrence Douglas County transportation system. This principal arterial street currently conveys commuter traffic
Chapter 5 Traffic Analysis 5.1 SUMMARY US /West 6 th Street assumes a unique role in the Lawrence Douglas County transportation system. This principal arterial street currently conveys commuter traffic
City of Homewood Transportation Plan
 City of Homewood Transportation Plan Prepared for: City of Homewood, Alabama Prepared by: Skipper Consulting, Inc. May 2007 TABLE OF CONTENTS INTRODUCTION... 1 BACKGROUND INFORMATION... 1 EXISTING TRANSPORTATION
Traffic Impact Analysis Chatham County Grocery Chatham County, NC
 Chatham County Grocery Chatham County, NC TABLE OF CONTENTS 1. INTRODUCTION... 1 1.1. Location and Study Area... 1 1.2. Proposed Land Use and Access... 2 1.3. Adjacent Land Uses... 2 1.4. Existing ways...
CITY OF ALPHARETTA DOWNTOWN MASTER PLAN TRAFFIC EVALUATION
 CITY OF ALPHARETTA DOWNTOWN MASTER PLAN TRAFFIC EVALUATION June 2015 CITY OF ALPHARETTA DOWNTOWN MASTER PLAN TRAFFIC EVALUATION Introduction The Alpharetta Downtown Master Plan was developed in the fall
CITY OF COCOA BEACH 2025 COMPREHENSIVE PLAN. Section VIII Mobility Element Goals, Objectives, and Policies
 CITY OF COCOA BEACH 2025 COMPREHENSIVE PLAN Section VIII Mobility Element Goals, Objectives, and Policies Adopted August 6, 2015 by Ordinance No. 1591 VIII MOBILITY ELEMENT Table of Contents Page Number
TRAFFIC ASSESSMENT River Edge Colorado
 TRAFFIC ASSESSMENT River Edge Colorado Submitted by: Fehr & Peers 621 17th Street, Ste. 231 Denver, CO 8293 (33) 296-43 December, 21 App. M-2 Traffic Assessment River Edge Colorado December 21 TABLE OF
5858 N COLLEGE, LLC N College Avenue Traffic Impact Study
 5858 N COLLEGE, LLC nue Traffic Impact Study August 22, 2016 Contents Traffic Impact Study Page Preparer Qualifications... 1 Introduction... 2 Existing Roadway Conditions... 5 Existing Traffic Conditions...
Transportation Impact Study Guidelines AS ADOPTED BY REGION OF WATERLOO COUNCIL SEPTEMBER 18, 2013 REPORT NO. P
 Transportation Impact Study Guidelines AS ADOPTED BY REGION OF WATERLOO COUNCIL SEPTEMBER 18, 2013 REPORT NO. P-13-088 HOUSEKEEPING EDITS APPLIED UPDATED TO FILE VERSION 4, JULY 22, 2014 TABLE OF CONTENTS
TRAFFIC IMPACT STUDY COMPREHENSIVE UPDATE TOWN OF THOMPSON S STATION, TENNESSEE PREPARED FOR: THE TOWN OF THOMPSON S STATION
 TRAFFIC IMPACT STUDY COMPREHENSIVE UPDATE TOWN OF THOMPSON S STATION, TENNESSEE PREPARED FOR: THE TOWN OF THOMPSON S STATION Transportation Consultants, LLC 1101 17 TH AVENUE SOUTH NASHVILLE, TN 37212
Truck Climbing Lane Traffic Justification Report
 ROUTE 7 (HARRY BYRD HIGHWAY) WESTBOUND FROM WEST MARKET STREET TO ROUTE 9 (CHARLES TOWN PIKE) Truck Climbing Lane Traffic Justification Report Project No. 6007-053-133, P 101 Ι UPC No. 58599 Prepared by:
City of Wayzata Comprehensive Plan 2030 Transportation Chapter: Appendix A
 A1. Functional Classification Table A-1 illustrates the Metropolitan Council s detailed criteria established for the functional classification of roadways within the Twin Cities Metropolitan Area. Table
Circulation in Elk Grove includes: Motor vehicles, including cars and trucks
 Circulation, as it is used in this General Plan, refers to the many ways people and goods move from place to place in Elk Grove and the region. Circulation in Elk Grove includes: Motor vehicles, including
Traffic Impact Study. Roderick Place Columbia Pike Thompson s Station, TN. Transportation Group, LLC Traffic Engineering and Planning
 F i s c h b a c h Transportation Group, LLC Traffic Engineering and Planning Traffic Impact Study Roderick Place Columbia Pike Thompson s Station, TN Prepared March 2016 Ms. Gillian L. Fischbach, P.E.,
Transportation Impact Study for Abington Terrace
 Transportation Impact Study for Abington Terrace Abington Township, Montgomery County, PA Sandy A. Koza, P.E., PTOE PA PE License Number PE059911 Prepared by McMahon Associates, Inc. 425 Commerce Drive,
5.0 Roadway System Plan
 Southwest Boise Transportation Study Page 16 5.0 Roadway System Plan The Roadway System Plan outlines roadway improvements in the Initial Study Area. It forecasts future deficiencies on the arterial system,
Magnolia Place. Traffic Impact Analysis. Prepared for: City of San Mateo. Prepared by: Hexagon Transportation Consultants, Inc.
 Magnolia Place Traffic Impact Analysis Prepared for: City of San Mateo Prepared by: Hexagon Transportation Consultants, Inc. Updated January 4, 2010 Table of Contents 1. Introduction...1 2. Existing Conditions...6
Develop a Multi-Modal Transportation Strategy (Theme 6)
") DEVELOP A MULTI-MODAL TRANSPORTATION STRATEGY (THEME 6) WHY IS THIS THEME ADDRESSED? Develop a Multi-Modal Transportation Strategy (Theme 6) Statement of Ideal Reduce resident and visitor reliance on single
DEVELOP A MULTI-MODAL TRANSPORTATION STRATEGY (THEME 6) WHY IS THIS THEME ADDRESSED? Develop a Multi-Modal Transportation Strategy (Theme 6) Statement of Ideal Reduce resident and visitor reliance on single
SELECTED ROADWAY CAPACITY ANALYSIS
 CHAPTERFOUR SELECTED ROADWAY CAPACITY ANALYSIS 4.1 SELECTED ROADWAY CAPACITY ANALYSIS Introduction Capacity analysis was performed on six selected roadways within the Dearborn County study area using the
THIS PAGE LEFT BLANK INTENTIONALLY
 GA SR 25 Spur at Canal Road Transportation Impact Analysis PREPARED FOR GLYNN COUNTY, GEORGIA 1725 Reynolds Street, Suite 300 Brunswick, Georgia 31520 PREPARED BY 217 Arrowhead Boulevard Suite 26 Jonesboro,
A Traffic Operations Method for Assessing Automobile and Bicycle Shared Roadways
 A Traffic Operations Method for Assessing Automobile and Bicycle Shared Roadways A Thesis Proposal By James A. Robertson Submitted to the Office of Graduate Studies Texas A&M University in partial fulfillment
4.0 TRAFFIC IMPACT STUDIES
 SECTION 4 4.0 TRAFFIC IMPACT STUDIES 4.1 TRAFFIC IMPACT STUDY REQUIREMENTS The City has established Traffic Impact Study (TIS) requirements for the purpose of ensuring that both the quantitative and qualitative
Route 28 (South Orleans Road)/Route 39 (Harwich Road)/Quanset Road Intersection
/Route 39 (Harwich Road)/Quanset Road Intersection") TRAFFIC FEASIBILITY STUDY Route 28 (South Orleans Road)/Route 39 (Harwich Road)/Quanset Road Intersection Orleans, Massachusetts Prepared for: Town of Orleans Prepared by: Fay, Spofford & Thorndike, LLC
TRAFFIC FEASIBILITY STUDY Route 28 (South Orleans Road)/Route 39 (Harwich Road)/Quanset Road Intersection Orleans, Massachusetts Prepared for: Town of Orleans Prepared by: Fay, Spofford & Thorndike, LLC
D.13 Transportation and Traffic
 This section addresses transportation and traffic issues and impacts related to the Proposed Project. Section D.13.1 provides a description of the affected environment for the Proposed Project. Applicable
TRAFFIC IMPACT ANALYSIS
 TRAFFIC IMPACT ANALYSIS FOR THE CHAMPAIGN UNIT#4 SCHOOL DISTRICT PROPOSED HIGH SCHOOL (SPALDING PARK SITE) IN THE CITY OF CHAMPAIGN Final Report Champaign Urbana Urbanized Area Transportation Study 6/24/2014
Recommended Roadway Plan Section 2 - Land Development and Roadway Access
 Recommended Roadway Plan Section 2 - Land Development and Roadway Access SECTION 2 Land Development and Roadway Access 2.1 Land Use and Access Management The Federal Highway Administration (FHWA) defines
Traffic Impact Analysis (TIA) Process and Procedures Manual. September 2017
 Process and Procedures Manual. September 2017") Traffic Impact Analysis (TIA) Process and Procedures Manual Post Office Box 664 101 Huntersville-Concord Road Huntersville, NC 28070 Phone 704-766-2220 Fax 704-992-5528 www.huntersville.org (c) 2017, Town
Traffic Impact Analysis (TIA) Process and Procedures Manual Post Office Box 664 101 Huntersville-Concord Road Huntersville, NC 28070 Phone 704-766-2220 Fax 704-992-5528 www.huntersville.org (c) 2017, Town
AMATS Complete Streets Policy
 AMATS Complete Streets Policy Table of Contents: Section 1. Definition of Complete Streets Section 2. Principles of Complete Streets Section 3. Complete Streets Policy Section 4. Consistency Section 5.
SECTION 1 - TRAFFIC PLANNING
 SECTION 1 - TRAFFIC PLANNING 1.1 TRAFFIC OPERATIONS 1.1.1 Roadway Functional Classification The Multnomah County Comprehensive Framework Plan s Policy 34: Trafficways and the Functional Classification
Brian McHugh, Buckhead Community Improvement District. SUBJECT: Wieuca Road at Phipps Boulevard Intersection Improvements Project
 MEMO TO: FROM: Brian McHugh, Buckhead Community Improvement District Jagan Kaja, AICP, WSP Parsons Brinckerhoff SUBJECT: Wieuca Road at Phipps Boulevard Intersection Improvements Project DATE: October
NM-POLICY 1: Improve service levels, participation, and options for non-motorized transportation modes throughout the County.
 Transportation PRINCE WILLIAM COUNTY 2008 COMPREHENSIVE PLAN NON-MOTORIZED PLAN CONTENTS Goals, Policies, and Action Strategies Table 4 (Bike Facility Classifications and Descriptions) Table 5 (Bike Facility
MCTC 2018 RTP SCS and Madera County RIFP Multi-Modal Project Eval Criteria GV13.xlsx
 MCTC 8 RTP SCS and Madera County RIFP Multi-Modal Project Eval Criteria GV.xlsx Madera County Transportation Commission Regional Transportation Plan / Sustainable Communities Strategy Multi-Modal Project
Chapter 2: Standards for Access, Non-Motorized, and Transit
 Standards for Access, Non-Motorized, and Transit Chapter 2: Standards for Access, Non-Motorized, and Transit The Washtenaw County Access Management Plan was developed based on the analysis of existing
City of Novi Non-Motorized Master Plan 2011 Executive Summary
 City of Novi Non-Motorized Master Plan 2011 Executive Summary Prepared by: February 28, 2011 Why Plan? Encouraging healthy, active lifestyles through pathway and sidewalk connectivity has been a focus
Project Report. South Kirkwood Road Traffic Study. Meadows Place, TX October 9, 2015
 Meadows Place, TX October 9, 2015 Contents 1 Introduction... 1 2 Data Collection... 1 3 Existing Roadway Network... 2 4 Traffic Volume Development... 2 5 Warrant Analysis... 3 6 Traffic Control Alternative
BETHEL ROAD AND SEDGWICK ROAD CORRIDOR STUDY
 DRAFT PLAN City Council Meeting August 14, 2017 STUDY AREA Sedgwick Corridor State Route 160, principal arterial with Class 3 access management designation, commuter and freight route, connection to SR
6060 North Central Expressway Mixed-Use Site Dallas, Texas
 Volume 1 Traffic Impact Analysis 6060 North Central Expressway Mixed-Use Site Dallas, Texas April 30, 2018 Kimley-Horn and Associates, Inc. Dallas, Texas Project #063238300 Registered Firm F-928 Traffic
Date: September 7, Project #: Re: Spaulding Youth Center Northfield, NH Property. Traffic Impact Study
 To: Ms. Susan C. Ryan Spaulding Youth Center 72 Spaulding Road Northfield, NH 03276 Date: September 7, 2017 Project #: 52455.00 From: Robin Bousa Director of Transportation Systems Re: Spaulding Youth
Regional Transportation Needs Within Southeastern Wisconsin
 Regional Transportation Needs Within Southeastern Wisconsin #118274 May 24, 2006 1 Introduction The Southeastern Wisconsin Regional Planning Commission (SEWRPC) is the official areawide planning agency
ROADSOADS CONGESTION HAMPTON SYSTEMYSTEM MANAGEMENT. Part II Roadway Congestion Analysis Mitigation Strategies and Evaluation
 HAMPTON ROADSOADS CONGESTION MANAGEMENT SYSTEMYSTEM Part II Roadway Congestion Analysis Mitigation Strategies and Evaluation Presented by: Dwight Farmer, PE Deputy Executive Director, Transportation April
Subject: Solberg Avenue / I-229 Grade Separation: Traffic Analysis
 MEMORANDUM Transportation Bill Troe, AICP Jason Carbee, AICP 12120 Shamrock Plaza Suite 300 Omaha, NE 68154 (402) 334-8181 (402) 334-1984 (Fax) To: Project File Date: Subject: Solberg Avenue / I-229 Grade
Solana Beach Comprehensive Active Transportation Strategy (CATS)
") Solana Beach Comprehensive Active Transportation Strategy (CATS) 3.0 Goals & Policies The Solana Beach CATS goals and objectives outlined below were largely drawn from the Solana Beach Circulation Element
Solana Beach Comprehensive Active Transportation Strategy (CATS) 3.0 Goals & Policies The Solana Beach CATS goals and objectives outlined below were largely drawn from the Solana Beach Circulation Element
Route 7 Corridor Study
 Route 7 Corridor Study Executive Summary Study Area The following report analyzes a segment of the Virginia State Route 7 corridor. The corridor study area, spanning over 5 miles in length, is a multi
RESOLUTION NO ?? A RESOLUTION OF THE CITY OF NEPTUNE BEACH ADOPTING A COMPLETE STREETS POLICY
 RESOLUTION NO. 2018-?? A RESOLUTION OF THE CITY OF NEPTUNE BEACH ADOPTING A COMPLETE STREETS POLICY WHEREAS, safe, convenient, and accessible transportation for all users is a priority of the City of Neptune
Gateway Transportation Study
 Gateway Transportation Study Amherst, Massachusetts SUBMITTED TO University of Massachusetts Amherst Town of Amherst SUBMITTED BY Vanasse Hangen Brustlin, Inc. Watertown, Massachusetts March 213 Back of
Operational Comparison of Transit Signal Priority Strategies
 Operational Comparison of Transit Signal Priority Strategies Revision Submitted on: November, 0 Author: Adriana Rodriguez, E.I Assistant Engineer Parsons Brinckerhoff 0 South Orange Avenue, Suite 00 Orlando,
PINESTONE TRAFFIC IMPACT STUDY Travelers Rest, South Carolina
 PINESTONE TRAFFIC IMPACT STUDY Travelers Rest, South Carolina Prepared for Longbranch Development Prepared by January 13, 219 ii Table of Contents Subject Page Signature Page... i Table of Contents...
Transportation Master Plan Advisory Task Force
 Transportation Master Plan Advisory Task Force Network Alternatives & Phasing Strategy February 2016 BACKGROUND Table of Contents BACKGROUND Purpose & Introduction 2 Linking the TMP to Key Council Approved
Exhibit 1 PLANNING COMMISSION AGENDA ITEM
 Exhibit 1 PLANNING COMMISSION AGENDA ITEM Project Name: Grand Junction Circulation Plan Grand Junction Complete Streets Policy Applicant: City of Grand Junction Representative: David Thornton Address:
#!! "$% ##! &! # '#! % $ #!
 Executive Summary US Highway 16 (US 16) is the primary corridor connecting Rapid City to the Black Hills region. It serves a growing population of commercial and residential traffic, as well as seasonal
3.9 - Transportation and Traffic
 Transportation and Traffic 3.9 - Transportation and Traffic This section describes the potential transportation and traffic effects of project implementation on the project site and its surrounding area.
Access Management Guidelines February 2013 THE CITY OF
 Access Management Guidelines February 2013 THE CITY OF Table of Contents Introduction 2 Review and Approval Process 5 Technical Guidelines 9... 10... 12 3. Separation Distance: Non-Signalized All-Turns
Preliminary Transportation Analysis
 Preliminary Transportation Analysis Goals of a Robust, Multimodal Transportation Network Safe Accessible/Connected Efficient Comfortable Context-Sensitive Motor Vehicle: Continue to analyze the data to
Item to be Addressed Checklist Consideration YES NO N/A Required Description Complete Streets Guidelines
 Passaic County Complete Streets Checklist - Concept Development Project Name Item to be Addressed Checklist Consideration YES NO N/A Required Description Complete Streets Guidelines Existing Plans Have
MUTCD Part 6G: Type of Temporary Traffic Control Zone Activities
 MUTCD Part 6G: Type of Temporary Traffic Control Zone Activities 6G.01 Typical Applications Each temporary traffic control (TTC) zone is different. Many variables, such as location of work, highway type,
INDUSTRIAL BUILDING 3009 HAWTHORNE ROAD CITY OF OTTAWA TRANSPORTATION OVERVIEW REVISED. Prepared for: Canada Inc.
 INDUSTRIAL BUILDING 3009 HAWTHORNE ROAD CITY OF OTTAWA TRANSPORTATION OVERVIEW REVISED Prepared for: 7849648 Canada Inc. Octiober 1, 2015 114-598 Overview_2.doc D. J. Halpenny & Associates Ltd. Consulting
University Hill Transportation Study Technical Memorandum Alternatives Modeling and Analysis May 2007
 Technical Memorandum May 2007 Syracuse Metropolitan Transportation Council Edwards and Kelcey with Wallace Roberts and Todd Alta Planning and Design CONTENTS SECTION ONE- INTRODUCTION...1 SECTION TWO-
Joe Rocca P.Eng., Traffic and Asset Management Supervisor. Review for Proposed Kingsway Sports and Entertainment Complex, City of Greater Sudbury
 LETTER REPORT TO: Joe Rocca P.Eng., Traffic and Asset Management Supervisor FROM: Brett Sears and Ubaid Ali, WSP SUBJECT: Review for Proposed Kingsway Sports and Entertainment Complex, City of Greater
Traffic Impact Statement
 Traffic Impact Statement Mixed Use Development, US 41 and Old Trail Drive aka Tide-Starbucks 4900 9 th Street North General Development Site Plan (GDSP) Collier County, FL 10/6/2015 Prepared for: Prepared
DUNBOW ROAD FUNCTIONAL PLANNING
 DUNBOW ROAD FUNCTIONAL PLANNING Final Report August 3, 216 #31, 316 5th Avenue NE Calgary, AB T2A 6K4 Phone: 43.273.91 Fax: 43.273.344 wattconsultinggroup.com Dunbow Road Functional Planning Final Report
List of Attachments. Location Map... Site Plan... City of Lake Elsinore Circulation Element... City of Lake Elsinore Roadway Cross-Sections...
 List of Attachments Exhibits Location Map... Site Plan... City of Lake Elsinore Circulation Element... City of Lake Elsinore Roadway Cross-Sections... Existing Lane Geometry and Traffic Controls... Existing
Traffic Impact Study Little Egypt Road Development Denver, North Carolina June 2017
 Traffic Impact Study Little Egypt Road Development Denver, North arolina June 2017 N. Little Egypt Road DQ\ QDQFLQJ VDOHV RU RWKHU SHUIRUPDQFH EDVHG FULWHULD Proposed Site Driveways Site Driveway 1 TRAFFI
Shockoe Bottom Preliminary Traffic and Parking Analysis
 Shockoe Bottom Preliminary Traffic and Parking Analysis Richmond, Virginia August 14, 2013 Prepared For City of Richmond Department of Public Works Prepared By 1001 Boulders Pkwy Suite 300, Richmond, VA
Access Location, Spacing, Turn Lanes, and Medians
 Design Manual Chapter 5 - Roadway Design 5L - Access Management 5L-3 Access Location, Spacing, Turn Lanes, and Medians This section addresses access location, spacing, turn lane and median needs, including
Access Management Regulations and Standards
 Access Management Regulations and Standards Efficient highway operation Reasonable property access Concept of Access Management The way to manage access to land development while simultaneously preserving
Anne Arundel County BICYCLE, PEDESTRIAN, TRANSIT ASSESSMENT GUIDELINES
 Anne Arundel County BICYCLE, PEDESTRIAN, TRANSIT ASSESSMENT GUIDELINES December 2018 TABLE OF CONTENTS I. Executive Summary 3 II. When Is A Bicycle Pedestrian Transit Assessment (BPTA) Required? 4 III.
2025 Comprehensive Plan for the City of Temple Terrace Florida. Mobility Element. Adopted by City Council June 30, 2009
 2025 Comprehensive Plan for the City of Temple Terrace Florida Mobility Element Adopted by City Council June 30, 2009 Effective Date September 22, 2009 GOAL 2: To protect and promote the quality of life
LIVERPOOL TRANSPORTATION MODELING TECHNICAL MEMO MAY 2009
 LIVERPOOL TRANSPORTATION MODELING TECHNICAL MEMO MAY 2009 Syracuse Metropolitan Transportation Council 100 Clinton Square 126 N. Salina Street, Suite 100 Syracuse, NY 13202 Telephone (315) 422-5716; Fax
Design of Turn Lane Guidelines
 Design of Turn Lane Guidelines CTS Transportation Research Conference May 24, 2012 Howard Preston, PE Minnesota Department of Transportation Research Services Office of Policy Analysis, Research & Innovation
ENHANCED PARKWAY STUDY: PHASE 2 CONTINUOUS FLOW INTERSECTIONS. Final Report
 Preparedby: ENHANCED PARKWAY STUDY: PHASE 2 CONTINUOUS FLOW INTERSECTIONS Final Report Prepared for Maricopa County Department of Transportation Prepared by TABLE OF CONTENTS Page EXECUTIVE SUMMARY ES-1
REGIONAL BICYCLE AND PEDESTRIAN DESIGN GUIDELINES
 REGIONAL BICYCLE AND PEDESTRIAN DESIGN GUIDELINES November 16, 2011 Deb Humphreys North Central Texas Council of Governments Bicycle and Pedestrian Advisory Committee Snapshot of the Guide 1. Introduction
Glenn Avenue Corridor Traffic Operational Evaluation
 Glenn Avenue Corridor Traffic Operational Evaluation PREPARED FOR: THE CITY OF AUBURN PREPARED BY: DECEMBER 2007 Glenn Avenue Corridor Study--Auburn, Alabama TABLE OF CONTENTS Introduction... 1 Background
Following are our comments and findings based on the site visit and review of the complete Traffic Impact Study:
 3600 Horizon Boulevard Suite 250 Trevose, Pennsylvania 19053-4900 Voice 215.355.3577 Fax 215.355.3147 www.ekcorp.com November 1, 2006 Pennsylvania Department of Transportation Bureau of Highway Safety
Owl Canyon Corridor Project Overview and Summary
 Owl Canyon Corridor Project Overview and Summary December 22, 2008 The Owl Canyon corridor (generally the connection between the I-25 / Larimer County Road 70 interchange and the US 287 / Larimer County
US 19 Pedestrian and Bicycle Safe Access to Transit Corridor Study
 US 19 Pedestrian and Bicycle Safe Access to Transit Corridor Study DRAFT Technical Memorandum #6 Cost and Benefit Evaluation Methodology August 2016 Prepared for: FLORIDA DEPARTMENT OF TRANSPORTATION DISTRICT
Table of Contents FIGURES TABLES APPENDICES. Traffic Impact Study Hudson Street Parking Garage MC Project No.: A Table of Contents
 Traffic Impact Study Hudson Street Parking Garage MC Project No.: 151714A Table of Contents Table of Contents I. INTRODUCTION... 2 II. EXISTING CONDITIONS... 5 III. 215 EXISTING TRAFFIC CONDITIONS... 6
Roadway Classification Design Standards and Policies. Pueblo, Colorado November, 2004
 Roadway Classification Design Standards and Policies Pueblo, Colorado November, 2004 Table of Contents Page Chapter 1. General Provisions 1.1 Jurisdiction 3 1.2 Purpose and Intent 3 1.3 Modification 3
Tonight is an opportunity to learn about the Study and ask questions of the Study Team members.
 Exhibit 1 Welcome Second Open House Tonight is an opportunity to learn about the Study and ask questions of the Study Team members. A first Public Open House was held on September 18th, 2013 which presented
Highway 49, Highway 351 and Highway 91 Improvements Feasibility Study Craighead County
 Highway 49, Highway 351 and Highway 91 Improvements Feasibility Study Craighead County Executive Summary March 2015 Highway 49, Highway 351 and Highway 91 Improvements Feasibility Study Craighead County
TABLE OF CONTENTS TABLE OF CONTENTS... I APPENDICES... III LIST OF EXHIBITS... V LIST OF TABLES... VII LIST OF ABBREVIATED TERMS...
 TABLE OF CONTENTS TABLE OF CONTENTS... I APPENDICES... III LIST OF EXHIBITS... V LIST OF TABLES... VII LIST OF ABBREVIATED TERMS... IX 1 INTRODUCTION... 1 1.1 Project Overview... 1 1.2 Analysis Scenarios...
HENDERSON DEVELOPMENT 213, 217, 221, 221 ½, 223 HENDERSON AVENUE and 65 TEMPLETON STREET OTTAWA, ONTARIO TRANSPORTATION OVERVIEW.
 HENDERSON DEVELOPMENT 213, 217, 221, 221 ½, 223 HENDERSON AVENUE and 65 TEMPLETON STREET OTTAWA, ONTARIO TRANSPORTATION OVERVIEW Prepared for: 2294170 Ontario Inc. February 2, 2017 117-652 Report_1.doc
INTRODUCTION THOROUGHFARE SYSTEM CLASSIFICATIONS
 INTRODUCTION The thoroughfare plan will assist public officials in the development of a specialized system for efficient and safe movement of vehicular traffic while minimizing potential conflicts with
Arterial Management Plan for US Route 250 and State Route 623
 Arterial Management Plan for US Route 250 and State Route 623 June 25, 2014 Brad Shelton, AICP Access Management and Traffic Impact Analysis Programs Manager Transportation and Mobility Planning Division
Site Improvements
 Sections Included In This Standard: 1.1 Bicycle Facilities 1.2 Guardrails 1.3 Parking Bumpers 1.4 Traffic Signage 1.5 Traffic Signals 1.6 Traffic Impact Studies 1.7 Vision Triangle 1.8 Bus Stop Shelters
EXECUTIVE SUMMARY... vii 1 STUDY OVERVIEW Study Scope Study Area Study Objectives
 Contents EXECUTIVE SUMMARY... vii 1 STUDY OVERVIEW... 1-1 1.1 Study Scope... 1-1 1.2 Study Area... 1-1 1.3 Study Objectives... 1-3 2 EXISTING CONDITIONS... 2-1 2.1 Existing Freeway Conditions... 2-4 2.1.1
CHAPTER 7 ACCESS MANAGEMENT. Background. Principles of Access Management. Hennepin County Transportation Systems Plan (HC-TSP)
") CHAPTER 7 ACCESS MANAGEMENT Background Principles of Access Management Hennepin County Transportation Systems Plan (HC-TSP) Chapter 7 Access Management 7.1 Background Access management has become an important
CHAPTER 7 ACCESS MANAGEMENT Background Principles of Access Management Hennepin County Transportation Systems Plan (HC-TSP) Chapter 7 Access Management 7.1 Background Access management has become an important
List of Exhibits...ii
 One Brickell Traffic Study TABLE OF CONTENTS List of Exhibits...ii EXECUTIVE SUMMARY...1 1. INTRODUCTION...2 1.1 Study Area...2 1.2 Study Objective...5 2. EXISTING TRAFFIC CONDITIONS...6 2.1 Data Collection...6
Access Management Regulations and Standards
 Access Management Regulations and Standards January 2014 Efficient highway operation Reasonable property access Concept of Access Management The way to manage access to land development while preserving