M R O. February 25, Mr. David Brandt, City Manager City of Cupertino Torre Avenue Cupertino, California 95014
|
|
|
- Tamsin White
- 5 years ago
- Views:
Transcription
1 0 Plaza Drive Rocklin, California PHONE (96) City of Cupertino 0300 Torre Avenue Cupertino, California 9504 FAX (96) Subject: State Route 85 Lanes Project Initial Study with Proposed Negative Declaration/Environmental Assessment Traffic and Transportation/Pedestrian and Bicycle Facilities Analysis Dear Mr. Brandt: As requested, MRO Engineers, Inc., has completed a review of the Traffic and Transportation/Pedestrian and Bicycle Facilities analysis completed with respect to the proposed State Route 85 Lanes Project in Santa Clara County, California. The proposed project is the subject of an Initial Study with Proposed Negative Declaration/Environmental Assessment (IS/EA), which was prepared by the State of California Department of Transportation (Caltrans) in cooperation with the Santa Clara Valley Transportation Authority (VTA) in December 03. The IS/EA incorporates the results of the final Traffic Operations Analysis Report completed by DKS in association with URS in November 03. This letter report documents the results of our detailed review of the traffic and transportation analysis presented in the IS/EA. PROJECT DESCRIPTION The proposed project extends the entire length of State Route 85 (SR 85), as well as including short segments of US 0 at the north and south ends of SR 85. Along the 4.-mile length of SR 85, the proposed project would convert the existing high-occupancy vehicle (HOV) lanes (one in each direction) to express lanes, which would accommodate toll-paying single-occupant vehicles (SOV) in addition to HOVs. A second express lane would be added in each direction between SR 87 and I- 80, including almost the entire stretch of SR 85 through the City of Cupertino. The precise locations where the widening to provide the second express lane would begin and end are not known, as this information is not provided in the IS/EA. The entire project would be constructed within the existing freeway right-of-way. The project includes provision of a -foot buffer between the general purpose lanes and the express lanes. In areas where a single express lane would be located, that buffer zone would be provided by narrowing the adjacent lanes (i.e., one general purpose lane and one HOV lane) to feet (from the typical feet). Thus, no median width reduction would occur in the SR 85 segments with a single express lane. The IS/EA is not clear as to whether the same approach would be used in the areas with two express lanes, or if an additional two feet of widening would be undertaken to provide the buffer. The express lanes would be located in the freeway median, which would become narrower where a second express lane is provided. (No change in median width would occur where a single express lane is provided.) Assuming the added express lanes are -feet wide, the existing 46-foot median
2 Page would be reduced to feet in the section with two express lanes each way, assuming the two-foot buffer is provided through narrowing of the adjacent lanes, as described above. If that narrowing does not occur (i.e., a two-foot buffer strip is constructed), the median width would be reduced even further, to about 0 feet. In addition, an auxiliary lane (. miles long) would be constructed along northbound SR 85 within the City of Cupertino. It would connect the existing South De Anza Boulevard on-ramp and the Stevens Creek Boulevard off-ramp. That lane would be constructed along the outer (i.e., right-hand) edge of the road, including widening of up to 4 feet. No auxiliary lanes are proposed in the southbound direction. Attachment A contains a schematic diagram of the proposed project, illustrating the number of express lanes and the locations of the access zones serving those lanes. REVIEW OF TRAFFIC AND TRANSPORTATION / PEDESTRIAN AND BICYCLE FACILITIES ANALYSIS The traffic and transportation system impacts associated with the proposed State Route 85 Lanes project are addressed in Section..3 Traffic and Transportation/Pedestrian and Bicycle Facilities of the IS/EA. Our review of that analysis revealed several issues that must be addressed prior to approval by Caltrans of the proposed project and its environmental documentation. These issues are presented below.. Failure to Identify Significant Impacts Review of the level of service tables presented in the IS/EA revealed multiple examples of significant impacts that were ignored. In each case, the freeway segment level of service is shown to degrade from an acceptable level of service (i.e., LOS D or better) to LOS E or F, or from LOS E to LOS F. Specific examples include the following: Table Northbound AM Peak Hour General Purpose Lanes o Between Blossom Hill Eastbound On-ramp and Westbound On-ramp: LOS D (No Build) to LOS E (Build) o Between I-80 Northbound On-ramp and Homestead On-ramp: LOS E (No Build) to LOS F (Build) PM Peak Hour General Purpose Lanes o Between Blossom Hill Eastbound On-ramp and Westbound On-ramp: LOS D (No Build) to LOS E (Build) o Between Almaden way Northbound and Southbound On-ramps: LOS E (No Build) to LOS F (Build) o Between Southbound Almaden way On-ramp and Camden Off-ramp: LOS D (No Build) to LOS E (Build) o Between Winchester On-ramp and Lane Drop: LOS D (No Build) to LOS F (Build) o Between Lane Drop and Saratoga Off-ramp: LOS D (No Build) to LOS E (Build)
3 Page 3 Table Southbound PM Peak Hour General Purpose Lanes o Between Saratoga On-ramp and Winchester Off-ramp: LOS E (No Build) to LOS F (Build) Table Northbound AM Peak Hour General Purpose Lanes o Between Santa Teresa On-ramp and SR 87 On-ramp: LOS D (No Build) to LOS E (Build) PM Peak Hour General Purpose Lanes o Between Almaden way Northbound and Southbound On-ramps: LOS E (No Build) to LOS F (Build) o Between I-80 Northbound On-ramp and Homestead On-ramp: LOS C (No Build) to LOS F (Build) Table Southbound AM Peak Hour General Purpose Lanes o Between Blossom Hill Westbound and Eastbound On-ramps: LOS D (No Build) to LOS E (Build) PM Peak Hour General Purpose Lanes o Between SR 8 On-ramp and Fremont Off-ramp: LOS E (No Build) to LOS F (Build) o Between Blossom Hill Off-ramp and Westbound Blossom Hill On-ramp: LOS D (No Build) to LOS F (Build) o Between Blossom Hill Westbound and Eastbound On-ramps: LOS E (No Build) to LOS F (Build) Mitigation measures for these impacts or a project alternative that would avoid the impacts must be identified. The results of the modified analysis should be documented in an environmental impact report/environmental impact statement (EIR/EIS), which must then be circulated for public review and comment.. Failure to Analyze Project Impacts on Non-Freeway Roadways The IS/EA and the supporting DKS/URS documentation present an in-depth analysis of traffic operations on SR 85 and the affected segments of US 0. However, absolutely no analysis is presented with respect to the proposed project s impacts on non-freeway facilities. This is clearly insufficient, as review of the travel demand forecasts presented as Tables 5- through 5-4 in the DKS/URS document reveals substantial changes in traffic patterns at the many SR 85 access locations. (This traffic volume information is not included in the IS/EA itself. It can only be found by searching through the sizable quantity of ancillary material on the Caltrans District 4 website. We note that the critical DKS/URS traffic operations analysis document is not even attached to the IS/EA as an appendix.)
4 Page 4 A number of examples can be cited to demonstrate the substantial effect of the proposed project on local street operations in and near Cupertino, including the following: AM peak period Northbound (IS/EA, Table 5-) o SR 85 off-ramp to Saratoga-Sunnyvale Road: 683 added peak-period vehicles in 05 and 746 added in 035; and o SR 85 off-ramp to Stevens Creek Boulevard: 7 additional peak-period vehicles in 05 and 035. PM peak period Northbound (IS/EA, Table 5-) o SR 85 off-ramp to Saratoga-Sunnyvale Road: 34 added peak-period vehicles in 05 and 67 added in 035. AM peak period Southbound (IS/EA, Table 5-3) o SR 85 on-ramp from Saratoga-Sunnyvale Road: 55 added peak-period vehicles in 05 and 39 added in 035. PM peak period Southbound (IS/EA, Table 5-5) o SR 85 on-ramp from Saratoga-Sunnyvale Road: 37 added peak-period vehicles in 05 and 9 added in 035; and o SR 85 on-ramp from Stevens Creek Boulevard: 49 additional peak-period vehicles in 05 and 34 added in 035. In each of these cases, this added on- or off-ramp traffic represents additional vehicles at the intersections where the freeway ramps meet the local street system, as well as on the nearby local street segments. The IS/EA completely ignores this substantial additional traffic, and the potential for significantly increased congestion and delay. At a minimum, the environmental document must be amended to included detailed level of service analyses (weekday AM and PM hours) at the following locations in and near Cupertino: SR 85 Northbound Ramps/De Anza Boulevard, SR 85 Southbound Ramps/De Anza Boulevard, De Anza Boulevard/Prospect Road, De Anza Boulevard/Stevens Creek Boulevard, SR 85 Northbound Ramps/Stevens Creek Boulevard, SR 85 Southbound Ramps/Stevens Creek Boulevard, SR 85 Northbound On-ramp/Homestead Road, and SR 85 Southbound Off-ramp/Homestead Road. The results of these analyses should be documented in an EIR/EIS, and circulated for further public review and comment. 3. Failure to Consider Pedestrian and Bicycle System Impacts As noted above, Section..3 of the IS/EA is labeled, Traffic and Transportation/Pedestrian and Bicycle Facilities. However, a
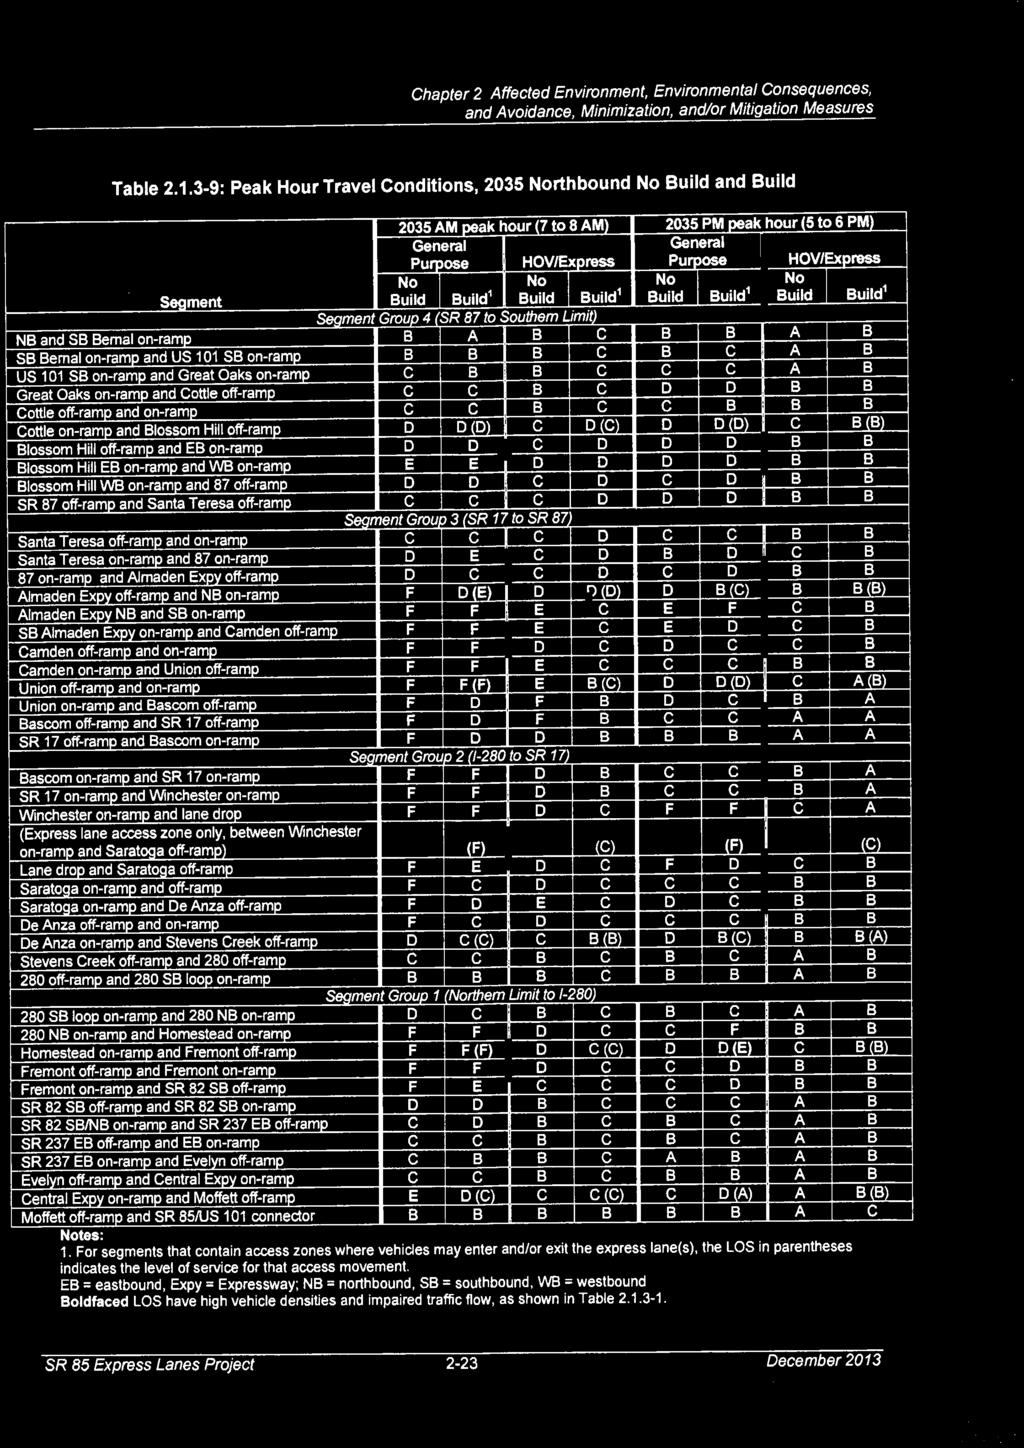
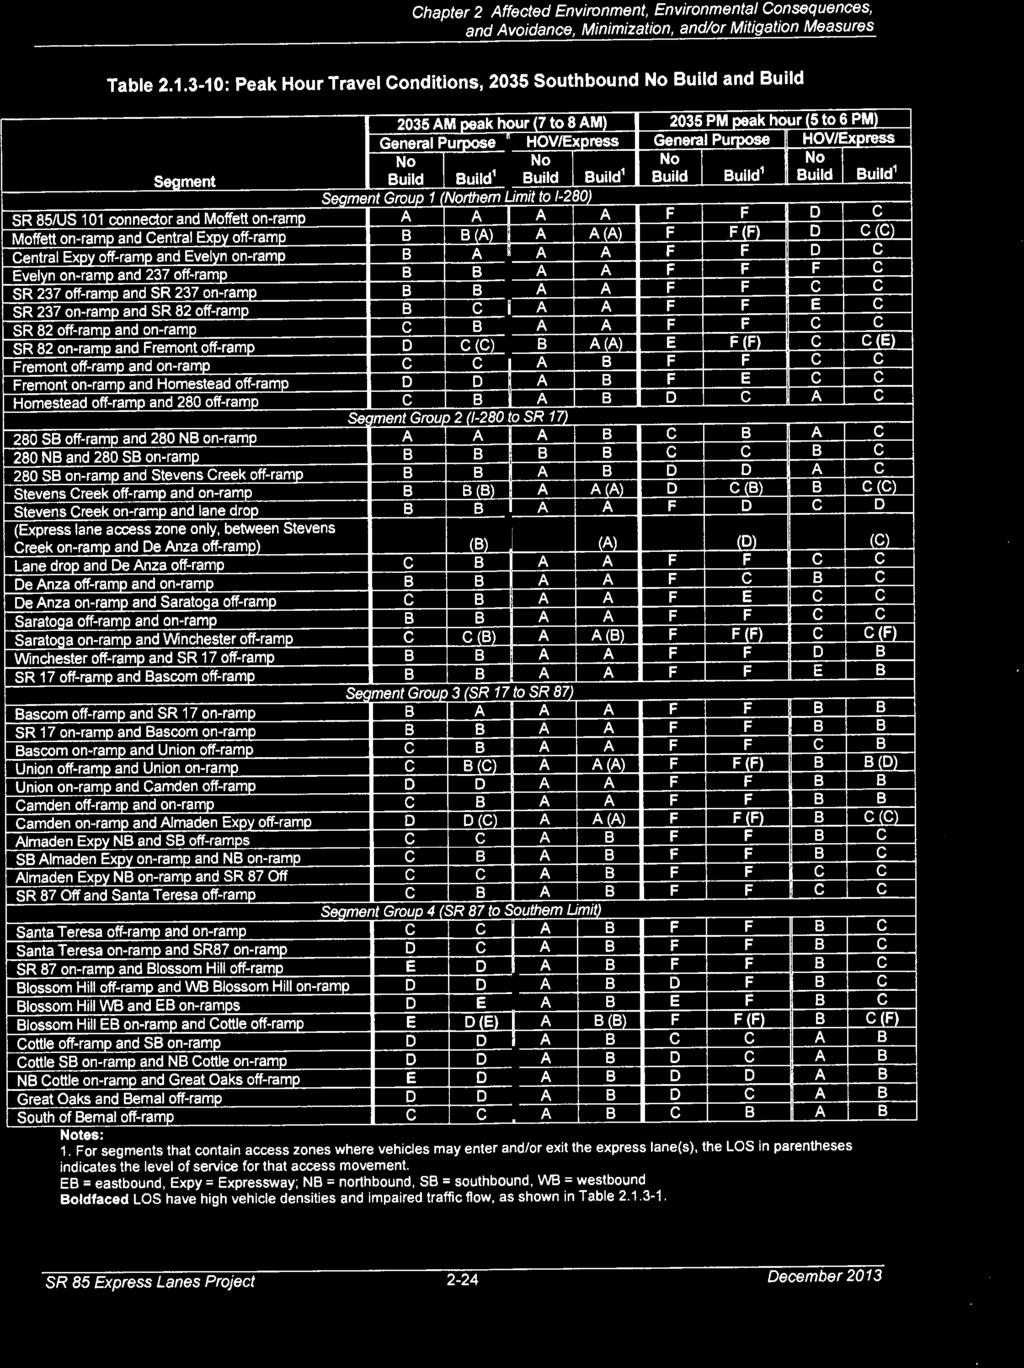
5 Page 5 search of the IS/EA for the words pedestrian and bicycle finds practically no results. Neither of those words appears in Section..3, which purports to describe the project s impacts on the pedestrian and bicycle transportation systems. Moreover, the words pedestrian and bicycle do not appear anywhere in the DKS/URS document that provides the basis for the material presented in Section..3 of the IS/EA. In fact, other than section headings and Table of Contents listings, the only instances in which these words are used in connection with the transportation analysis is in IS/EA Table S-: Summary of Impacts and Avoidance, Minimization, and/or Mitigation Measures (IS/EA, p. ii), where it states that: The project would not affect any pedestrian or bicycle facilities. Unfortunately, there is no basis for this conclusion as, clearly, no analysis of any sort was conducted to establish whether the proposed project would have significant impacts on the pedestrian and bicycle transportation systems. As described above, the travel demand forecasts prepared for the IS/EA indicate that substantial redistribution of traffic will occur on the local street system in the vicinity of SR 85. It is not unreasonable to suggest that additional traffic might occur in locations that represent hazards to pedestrians or bicyclists. The IS/EA completely ignores this possibility. Such analyses must be conducted and incorporated into an EIR/EIS, which fully addresses the impacts of the proposed project. 4. Assembly Bill No. 03 Level of Service Standard IS/EA page -4 states that one of the two purposes of the proposed project is to: Maintain consistency with provisions defined in AB 03 (004) and AB 574 (007) to implement express lanes in an HOV [high-occupancy vehicle] lane system in Santa Clara County. AB 03 established certain operational parameters for the high-occupancy toll (HOT) lane system authorized by the bill. In particular, it states: Implementation of the [HOT lanes] program shall ensure that Level of Service C, as measured by the most recent issue of the Highway Capacity Manual, as adopted by the Transportation Research Board, is maintained at all times in the high-occupancy vehicle lanes, except that subject to a written agreement between [Caltrans] and VTA that is based on operating conditions of the high-occupancy vehicle lanes, Level of Service D shall be permitted on the high-occupancy vehicle lanes. No evidence is provided in either the IS/EA or the DKS/URS document with respect to whether the written agreement allowing LOS D exists. In lieu of documented proof of the agreement referenced above, it is inappropriate to use LOS D as the significance criterion; LOS C should be used. The IS/EA text reflects uncertainty with regard to the applicable level of service standard. Several instances can be found where the IS/EA refers to the statutory requirement of LOS C/D or similar wording. (IS/EA, pp. -3, -8, -0, -, -6, and -8) With these
6 Page 6 references to LOS C/D, the authors seem unsure as to whether the standard is LOS C, LOS D, or perhaps the boundary between LOS C and LOS D. Unfortunately, neither the IS/EA nor the DKS/URS report presents a specific set of significance criteria for traffic operations, although the analysis approach suggests that LOS D has been considered to be the minimum acceptable level of service. Specifically, the level of service tables use bold font to indicate high vehicle densities and impaired traffic flow, and only locations at LOS E or F are designated as such. Locations operating at LOS D or better are not highlighted using bold font. For comparison, Attachment B contains copies of the level of service tables for 05 and 035 (IS/EA, Table..3-5, Table..3-6, Table..3-9, and Table..3-0) on which we have manually highlighted locations operating at LOS D. These tables illustrate the substantial number of additional locations that would have high vehicle densities and impaired traffic flow if LOS C is the correct level of service standard, rather than LOS D. In 05 (Tables..3-5 and..3-6), general purpose lanes at numerous locations are projected to operate at LOS D under Build conditions, as well as two HOV lane locations in the PM peak hour. Tables..3-9 and..3-0 show that LOS D operations are prevalent in both the general purpose and HOV lanes in 035 under Build conditions. Obviously, clarification is required with respect to whether the applicable level of service standard is LOS C or LOS D. We also note that the AB 03 LOS C or D standard applies only to the HOV/HOT/express lanes, not to the general purpose/mixed-flow lanes. Despite this, the IS/EA and DKS/URS documents treat all lanes the same, with LOS D as the apparent minimum acceptable operation. The level of service standard for the general purpose/mixed-flow lanes is presented in the Guide for the Preparation of Traffic Impact Studies (Caltrans, December 00). As presented in that document: Caltrans endeavors to maintain a target LOS at the transition between LOS C and LOS D... on State highway facilities... This means that LOS C is acceptable and LOS D is not. The approach taken in the IS/EA, where LOS D was considered to be acceptable in the general purpose/mixed-flow lanes, is incorrect. In summary, the level of service results presented in the IS/EA for both the express lanes and the general purpose lanes are misleading, as they incorrectly indicate that segments operating at LOS D are acceptable under the adopted criteria. At a minimum, proof must be provided that LOS D in the express lanes is acceptable based on a written agreement between Caltrans and VTA. Absent such an agreement, LOS C is the legal standard, and the documents must be revised to reflect this. The revised documents must then be recirculated for additional public review and comment, preferably in the form of an EIR/EIS. 5. Invalid Travel Demand Forecasts The travel demand forecasting process employed in the IS/EA is described extensively in that document and the associated DKS/URS documents. One aspect of that process, particularly with regard to the volume of traffic in the express lanes, raises significant questions as to the validity of the traffic projections for the years 05 and 035.
7 Page 7 Related to this issue are several statements in the DKS/URS traffic operations analysis report. Page of that document says: It is important to note mandated performance requirements that must be taken into consideration when designing an express lane project. At the state level, AB 03 mandated that express lanes operate at a Level of Service (LOS) of C or better (LOS D may be used if Caltrans and the operator agree). This corresponds to a target threshold of approximately,650 vph [vehicles per hour] per HOV lane. Page 8 of the DKS/URS report specifically addresses the travel demand forecasting process. Four tables (Tables 5- through 5-4) are presented to show the forecasted No Build and Build traffic volumes throughout the study area for the years 05 and 035. As part of that description, the report states: The volumes presented in the following tables [Tables 5- through 5-4] assume that the maximum volume will be limited to,650 vehicles per hour per lane on the express lanes. More detail about the traffic forecasting process is presented in a technical memorandum titled, SR 85 Lanes Travel Demand Forecasts (Wilbur Smith Associates, January, 0). Figure in that memorandum lays out the Forecast Modeling Methodology. Step 7 in that process includes a process to Set tolls to achieve maximum,650 vehicles per lane per hour for both 05 and 035. The detailed description of step 7 (page 4 of the technical memorandum) says: The volumes presented in the [traffic forecast] tables in this memo assume that the maximum volume will be limited to,650 vehicles per hour per lane on the express lanes. All of the above goes to show that the travel demand forecasts, which purport to demonstrate that the express lanes will operate well within the statutory requirement of,650 vehicles per hour per lane and at highly-acceptable levels of service, have been skewed to ensure a successful outcome. In fact, the traffic forecasting process was structured so as to preclude the express lanes from carrying more than,650 vehicles per hour per lane. Page 7 of the same technical memorandum describes another way in which the travel demand forecasting process has been biased to ensure that the analysis results will reflect favorable express lane operations. As stated there: A basic assumption of the analysis was that some proportion of express lanes traffic demand will never be eligible to use the express lanes. This is to account for the fact that some motorists will not participate in such a program under any circumstances. They may just be opposed to the technology or simply be infrequent users who are unaware of the express lanes and its [sic] potential benefits. These values typically range from 5 to 0 percent.. The higher the proportion of motorists assumed to be ineligible for express lanes usage, the more conservative the revenue forecasts will be. For this study, we assumed the more conservative 0 percent value.
8 Page 8 While the 0 percent value might be more conservative from a revenue analysis perspective, it serves to artificially reduce the volume of traffic projected to use the express lanes, thereby improving the results of the traffic operations analysis for those lanes. In summary, the traffic forecasts for the express lanes were artificially constrained to,650 vehicles per hour per lane to ensure that the statutory requirements established in AB 03 appear to be met. The actual volumes that can be realistically expected in the express lanes are unknown, due to the lack of an unconstrained traffic projection. The actual traffic volumes in the express lanes could be substantially higher than the IS/EA indicates, which would lead to levels of service in those lanes that are much worse than the IS/EA states. Revised traffic volume forecasts are needed that provide a better, more realistic estimation of traffic demand in the express lanes. These should be documented in an EIR/EIS and circulated for public review. 6. Failure to Consider A Reasonable Range of Project Alternatives The IS/EA evaluates two project alternatives: Build and No Build. Two additional build alternatives are briefly addressed (IS/EA, pp. -4-5), both of which were rejected because they included only a single HOV/express lane. The DKS/URS report (page 4) states that three build alternatives were discussed in a project study report (PSR) that was approved by Caltrans on October 6, 00, but no description or discussion of those alternatives is provided. It is not clear whether the project alternatives rejected in the Caltrans PSR included a full range of potential solutions, or were simply variations on the express lane configuration included in the proposed project. The failure to address a reasonable range of feasible alternatives in the IS/EA is a substantial shortcoming, in that it deprives the reviewing public of the ability to consider and comment on the relative merits of a variety of potential solutions to the traffic congestion issues addressed by the proposed project. At a minimum, the IS/EA should include a substantially more detailed summary of the previously-considered alternatives, including descriptions of their physical characteristics, their advantages and disadvantages, and the specific reasons for rejection. Furthermore, we believe it is unacceptable that the IS/EA fails to address a mass transit alternative. A logical alternative would be an extension of the existing VTA light rail system. Other possible alternatives include provision of bus-only lanes or the use of reversible express lanes (which would reflect the high directionality of peak-hour traffic flow on SR 85). 7. Proposed Project Effectively Precludes Future Light Rail Transit As noted above, implementation of the proposed project would reduce the median width along a substantial portion of SR 85 to approximately feet. A cursory review of existing VTA light rail lines in freeway medians using Google Earth indicates that the corridor width for those facilities generally ranges from approximately 30-to-50 feet. The narrowest section we found was on an overpass structure, where approximately a 8-foot-wide LRT corridor exists. This suggests that, if the proposed project is completed, the only way to implement LRT would be in an elevated configuration (i.e., on an above-ground structure), which is almost certainly excessively costly. In effect, implementation of the proposed project would preclude the future provision of light rail transit along the SR 85 corridor. This is unacceptable to the City of Cupertino. 8. Inconsistent Travel Speed Analysis Results The IS/EA includes several tables addressing travel time and speed through the study area in 05 and 035 under both No Build and Build
9 Page 9 conditions. When the travel time results are compared to the travel speed results, though, inconsistencies are apparent that raise questions as to the accuracy and validity of the information. The specific IS/EA tables are as follows: Table..3-7: Peak Hour Travel Times (Minutes), 05 No Build and Build, Table..3-8: 05 Peak Period Network Performance Measure Comparison, Table..3-: Peak Hour Travel Times (Minutes), 035 No Build and Build, and Table..3-: 035 Peak Period Network Performance Measure Comparison. The peak-hour travel times (in minutes) in Table..3-7 and Table..3- were converted to travel speeds (in miles per hour) and those results were compared to the peak-period results presented in Table..3-8 and Table..3-. Tables and below illustrate the results of this comparison process. The conversion from travel time to travel speed employed a segment length of 3.6 miles, as that resulted in a free-flow speed of 65 MPH, which was specified in the footnotes to Tables..3-7 and..3-. Note that several of the travel times presented in Table..3- resulted in a free-flow speed of 64.7 MPH; this is likely due to round-off error on the part of the DKS/URS analyst. Because of the manner in which the information is presented in the IS/EA, direct comparison of the travel speed results is difficult. For example, the travel time tables distinguish between the general purpose lanes and HOV lanes, while the travel speed tables do not. Also, the travel time tables reflect peak hour conditions (i.e., 7:00 8:00 AM and 5:00 6:00 PM), as opposed to the peak period information in the travel speed tables (i.e., 6:00 9:00 AM and 3:00 7:00 PM). Peak period travel speeds, though, should be somewhat higher than peak hour speeds, as they include two or three hours of lower traffic volumes (and higher speeds) in addition to the worstcase peak hour. As shown in Table, in the AM peak in 05, the northbound (peak direction) speeds are particularly questionable. Under No Build conditions, the peak hour travel speed is shown as 35.0 MPH in the general purpose lanes and 56. MPH in the HOV lanes. In contrast, the peak period speed is shown as 37 MPH, which is approximately the same as the peak-hour general purpose lane value. The same is generally true under Build conditions. As noted above, the overall peak period speed (for both lane types combined) should be higher than the peak-hour general purpose lane value. A generally similar pattern exists for the PM peak in the southbound (i.e., peak) direction in 05. Under No Build conditions, the peak period speed (40 MPH) is approximately equal to the peak hour speed in the general purpose lanes (39.8 MPH), while the HOV peak-hour speed (59.7 MPH) is about 50 percent higher. In several cases, the peak-period speed presented in the IS/EA is less than either of the peak-hour values, which defies logic. For example, in the PM peak under Build conditions, the southbound direction has a peak-hour speed of 46.4 MPH for the general purpose lanes and 64. MPH for the HOV lanes. The peak-period speed (both lane types combined) is 4 MPH, which is simply not logical.
10 Page 0 AM Peak Northbound Southbound Lane Type TABLE 05 Travel Speed Comparison Free Flow No Build Build Peak Hour Peak Hour Peak Peak Hour Travel Travel Period Travel Time Speed Time Speed Speed Time Speed (Min.) (MPH) (Min.) (MPH) (MPH) 3 (Min.) (MPH) HOV HOV Peak Period Speed (MPH) 3 PM Peak North bound HOV South bound HOV NOTES: Source: IS/EA, Table..3-7: Peak Hour Travel Times (Minutes), 05 No Build and Build, p. -9. Derived from the travel time values using a segment length of 3.6 miles, which provided a 65.0 MPH free-flow speed. 3 Source: IS/EA, Table..3-8: 05 Peak Period Network Performance Measure Comparison, p Table, which summarizes the year 035 travel speed comparison, shows that, in every case, the peak-period speed presented in the IS/EA is less than either the general purpose or HOV lane speed in the peak hour. Again, these results are illogical, as the peak-period speed (for both lane types combined) will not be lower than the peak-hour speeds for the two individual lane types. As noted above, the peak-period speeds would generally be expected to be higher than the peakhour speeds because they include two or three hours of lower traffic volumes (with higher speeds), in addition to the peak-hour volumes. This demonstrates that the travel speed results documented in the IS/EA are inaccurate and, therefore, misleading. Until the speed estimates can be corrected so that they provide rational results, they are of no value in demonstrating the value of the proposed project. The travel time and speed analyses must be corrected and recirculated for additional public review and comment. The new analyses must include travel speed tables that distinguish between the general purpose lanes and HOV lanes and the travel time tables must be presented for peak period and peak hour.
11 Page AM Peak Northbound Southbound PM Peak Northbound Southbound Lane Type TABLE 035 Travel Speed Comparison Free Flow No Build Build Peak Hour Peak Hour Peak Peak Hour Travel Travel Period Travel Time Speed Time Speed Speed Time Speed (Min.) (MPH) (Min.) (MPH) (MPH) 3 (Min.) (MPH) HOV HOV HOV HOV Peak Period Speed (MPH) 3 NOTES: Source: IS/EA, Table..3-: Peak Hour Travel Times (Minutes), 035 No Build and Build, p. -5. Derived from the travel time values using a segment length of 3.6 miles, which provided a 65.0 MPH free-flow speed. 3 Source: IS/EA, Table..3-: 05 Peak Period Network Performance Measure Comparison, p Inaccurate Characterization of Traffic Operations at SR 85/I-80 The IS/EA incorrectly characterizes SR 85 traffic operations in the vicinity of I-80 as being at an acceptable level of service. Specifically, IS/EA Tables..3- and..3-3, which present peak-hour level of service results for the peak travel directions under existing conditions, indicate that both general purpose and HOV lanes in the vicinity of the SR 85/I-80 interchange operate at acceptable levels of service. In addition, the listing of congested bottleneck locations in the DKS/URS report (pages 8 0) fails to include this critical area. These findings differ from the experience of motorists who drive through this area on a daily basis, which raises questions as to the validity of the traffic operations analysis for existing conditions. The possibility exists that the traffic volumes used in the analysis are artificially low, simply because the slow speeds associated with traffic congestion reduces the number of vehicles passing by the count locations. In short, the existing conditions traffic analysis must be revisited to ensure that it accurately represents operating conditions throughout the study area. In addition, the IS/EA fails to address the likelihood that implementation of the proposed project will intensify or relocate this congestion to the segments where the two-lane express lane cross sections terminate, forcing motorists to merge into a single express lane (i.e., northbound in the
12 Page vicinity of I-80 and southbound near SR 87). Although the environmental documentation does not illustrate the exact location and configuration of the transition zones between the single-lane and the two-lane express lane segments, Table..3-9 shows, for example, that the northbound general purpose lanes between the I-80 on-ramp and the Homestead Road on-ramp will decline from LOS C to LOS F in the PM peak hour upon completion of the project. Similarly, Table..3-0 shows that in the vicinity of SR 87 numerous southbound general purpose lane segments will operate at LOS F under Build conditions in the year 035 PM peak hour. 0. HOV/ Lane Access The DKS/URS report describes the results of travel time tach run data and field observations, which were used to identify existing congestion locations in the general purpose and HOV lanes. In both the AM and PM peak hours, that effort revealed the presence of congestion in certain HOV lane segments. According to the report (pp. 9-0): Field observations indicated that congestion in the HOV lane is not due to the demand exceeding the capacity in these segments, but is due to traffic exiting the HOV lane trying to merge in the general purpose lanes which are congested. Unfortunately, implementation of the proposed project will not remedy this situation. IS/EA Table..3-5 (p. -6) shows that the following northbound express lane access zones will operate at LOS E or F in the AM peak hour: Between the Union Avenue off-ramp and on-ramp, Between the Winchester Boulevard on-ramp and the Saratoga Avenue off-ramp, Between the Homestead Road on-ramp and the Fremont Avenue off-ramp. Deficient express lane access zones in the southbound direction in the year 05 PM peak hour include: Between the Moffett Boulevard on-ramp and the Central way off-ramp, Between the southbound State Route 8 on-ramp and the Fremont Avenue off-ramp, Between the Saratoga Avenue on-ramp and the Winchester Boulevard off-ramp, Between the Camden Avenue on-ramp and the Almaden way off-ramp, and Between the eastbound Blossom Hill Road on-ramp and the Cottle Road off-ramp. The year 035 results are even worse, with an additional deficient location in the northbound direction in the AM peak hour and two additional problem areas in the northbound PM peak hour. Additional deficiencies were also revealed in the southbound direction in the year 035. The feasibility of providing additional express lane access zones should be investigated, as a means to disperse the demand entering and exiting those zones. One candidate location for additional access in both directions would be between the Saratoga Avenue interchange and the Saratoga-Sunnyvale Road/De Anza Boulevard interchange. lane access zones in this segment of SR 85 would reduce the distance that Saratoga residents, for example, would need to travel in the general purpose lanes before entering the northbound express lanes or after exiting the southbound express lanes.
13 Page 3. Questionable Level of Service Analysis Results Review of the level of service tables raised several questions regarding specific analysis results. Table Southbound: HOV/express lanes on three segments of southbound SR 85 are shown to have substantially improved levels of service under Build conditions in the PM peak hour, even though they are in the portion of SR 85 that currently has one HOV lane and will continue to have only one express lane. This is illogical, as implementation of the SR 85 express lanes project will allow additional motorists (i.e., toll-paying SOVs) to use this single lane, which should result in higher lane density and, therefore, equal or lower level of service. Specific locations include: o Between Moffett On-ramp and Central way Off-ramp: LOS E (No Build) to LOS C (Build) o Between Evelyn On-ramp and SR 37 Off-ramp: LOS D (No Build) to LOS C (Build) o Between Northbound SR 8 On-ramp and Southbound SR 8 Off-ramp: LOS D (No Build) to LOS C (Build) Table Southbound: Again, HOV/express lanes on several segments of southbound SR 85 are shown to have better Build level of service results in the PM peak hour, even though they will not have any additional lanes. As noted above, implementation of the proposed project will result in additional motorists using this single express lane. The correct result would reflect higher lane density and equal or lower level of service. Specific locations on this table include: o Between Moffett On-ramp and Central way Off-ramp: LOS D (No Build) to LOS C (Build) o Between Central way Off-ramp and Evelyn On-ramp: LOS D (No Build) to LOS C (Build) o Between Evelyn On-ramp and SR 37 Off-ramp: LOS F (No Build) to LOS C (Build) o Between SR 37 On-ramp and SR 8 Off-ramp: LOS E (No Build) to LOS C (Build) These illogical results raise questions as to the credibility of all of the level of service analysis results. The inaccuracies could stem from the flawed travel demand forecasts (as addressed above) or from the LOS calculation process. In either event, the results must be reviewed and corrected. The corrected analysis must then be recirculated for further public review. CONCLUSION Our review of the Traffic and Transportation/Pedestrian and Bicycle Facilities analysis incorporated into the Initial Study/Environmental Assessment for the proposed State Route 85 Lanes project revealed several issues potentially affecting the validity of the conclusions and recommendations presented in that document. Of particular concern is the failure to identify a number of significant impacts in the general purpose lanes on SR 85 in both 05 and 035. Also of concern is the failure of the IS/EA to address the impacts of the proposed project on local streets and intersections in Cupertino and throughout the length of the project. The IS/EA s shortsighted approach, in which only freeway operations were evaluated, is unacceptable.
14 Page 4 We are also highly concerned about the travel demand forecasts developed as part of the analysis. The documentation of those projections clearly states that the traffic estimates for the HOV/express lanes were artificially constrained in a way that ensured that they would appear to operate at acceptable levels of service and relatively high speeds. In addition, inconsistencies in the travel time and speed estimates presented in the IS/EA potentially provides a misleading and overly-optimistic view of the impacts of the proposed project. Similarly, we find many of the level of service results to be questionable and potentially distorted, requiring that they be reviewed and corrected. Furthermore, we believe that the preparation of an environmental impact report/environmental impact statement (EIR/EIS) is called for, including analyses of an appropriate range of reasonable alternatives to the proposed project. Those alternatives should include at least one mass transit option. These issues and the others described above must be addressed prior to approval by Caltrans of the proposed project and the related environmental documentation. We hope this information is useful. If you have questions concerning any of the items presented here or would like to discuss them further, please feel free to contact me at (96) Sincerely, MRO, INC. Neal K. Liddicoat, P.E. Traffic Engineering Manager
15 ATTACHMENT A State Route 85 Lanes Project Schematic Diagram
16 SR 85 Lanes Project CA 049 / Graphics / Hwy0&85Schematic-Alt7.ppt N87W Shoreline Blvd., Amphitheatre Pkwy., San Antonio Rd. Not To Scale N84W N86W Homestead Rd., I-80, Stevens Creek Blvd. End Double Begin Single Northbound Match Line D Match Line C Northbound El Camino Real, Rte 37, Central Expy./ Evelyn Ave., Moffett Blvd., Fremont Ave Saratoga-Sunnyvale Stevens Creek Blvd., Rd., I-80 Sunnyvale Ave. N83W Saratoga Ave., Saratoga-Sunnyvale Rd. Southbound Southbound S90W Winchester Blvd., SR 7, Bascom Ave., Union Ave. S93aN S9W Moffett Blvd., US 0, Shoreline Blvd. Amphitheatre Pky. San Antonio Rd. Fremont Blvd., Homestead Rd., I-80, Stevens Creak Blvd. N8W El Camino Real, Rte. 37, Central Expy./ Evelyn Ave. Northbound Bascom Ave., SR 7 Camden Ave., Almaden Expy. S93W Fremont Ave., I-80 Saratoga-Sunnyvale Rd., Saratoga Ave. Stevens Creek Blvd. Match Line C Match Line B End Single Begin Double End Single Begin Double SR 87, Blossom Hill Rd. Winchester Blvd., SR 7, Bascom Ave., Union Ave. N80W S94W N8N Southbound Saratoga Ave, Sunnyvale-Saratoga Rd. S95W Cottle Rd., Great Oaks Blvd., Bernal Rd. Blossom Hill Rd., SR 87, Almaden Expy., Camden Ave., Union Ave. Northbound Camden Ave. Bascom Ave., SR 7 Match Line B End Double Begin Single S96W Almaden Ave., SR 87, Blossom Hill Rd. Camden Ave., Union Ave. Southbound Lane Entry Zone (M5-Modified) Lane Exit Zone (M5-Modified) Lane Weave Access Zone (M4 Detail) Match Line A LEGEND General Purpose Lanes Planned Primary Movement (Primary Movement to be Served) Number of Lanes in Segment N S97W Cottle Rd., Great Oaks Blvd., Bernal Rd. Blossom Hill Rd., SR 87, Almaden Expy. XXX XXX Access Point Movement Interchanges Served (in order of priority) SR 85 Lanes Project One and Two Lanes Build Alternative with M4 Weave Detail FIGURE 4- Not To Scale MAY 03
17 SR 85 Lanes Project CA 049 / Graphics / Hwy0&85Schematic-Alt7.ppt Not To Scale Santa Clara / San Mateo County Line HOV Northbound US 0 North of SR 85 HOV Southbound Moffett Blvd. Match Line D HOV/ N4N to Begin Double NB US 0 Direct Connector To NB SR 85 HOV/ NB SR 85 NB US 0 HOV Northbound Lane Entry Zone (M5-Modified) Lane Exit Zone (M5-Modified) Lane Weave Access Zone (M4 Detail) US 0 South of SR 85 LEGEND Match Line A Southbound to SB SR 85 Direct Connector To SB US 0 General Purpose Lanes Planned Primary Movement (Primary Movement to be Served) S35X Number of Lanes in Segment N End Double Continue Single HOV XXX XXX Access Point Movement Interchanges Served (in order of priority) SR 85 Lanes Project One and Two Lanes Build Alternative with M4 Weave Detail FIGURE 4- Con t Not To Scale MAY 03
18 ATTACHMENT B Year 05 and 035 Level of Service Tables With Highlighted LOS D
19
20


21

22
Santa Clara I-280 CORRIDOR STUDY
 Santa Clara I-280 CORRIDOR STUDY OCTOBER 2017 PREPARED BY: 1.1 Background The I-280 Corridor Study within Santa Clara County is a high-level highway planning study led by the Santa Clara VTA, in partnership
US 101 Express Lanes Project Open House WELCOME! Want to learn more?
 Silicon Valley Express Lanes US Project Environmental Phase US Express Lanes Project Open House WELCOME! Want to learn more? VTA staff members are ready to answer your questions! Here is how: 1. Watch
7.0 FREEWAYS CONGESTION HOT SPOT PROBLEM & IMPROVEMENT PROJECT ANALYSIS & DEFINITION
 7.0 FREEWAYS CONGESTION HOT SPOT PROBLEM & IMPROVEMENT PROJECT ANALYSIS & DEFINITION 7.1 INTRODUCTION & METHODOLOGY FEASIBILITY REPORT Congestion hot spot problem locations have been assessed using the
Subject: Solberg Avenue / I-229 Grade Separation: Traffic Analysis
 MEMORANDUM Transportation Bill Troe, AICP Jason Carbee, AICP 12120 Shamrock Plaza Suite 300 Omaha, NE 68154 (402) 334-8181 (402) 334-1984 (Fax) To: Project File Date: Subject: Solberg Avenue / I-229 Grade
Complete Street Analysis of a Road Diet: Orange Grove Boulevard, Pasadena, CA
 Complete Street Analysis of a Road Diet: Orange Grove Boulevard, Pasadena, CA Aaron Elias, Bill Cisco Abstract As part of evaluating the feasibility of a road diet on Orange Grove Boulevard in Pasadena,
INTRODUCTION. The focus of this study is to reduce congestion and improve mobility for all modes of transportation. Figure ES-1 Study Corridor Map
 INTRODUCTION The I-280 Corridor Study is a highway planning study led by Santa Clara VTA, in partnership with the City of Cupertino and in coordination with other stakeholders in the study area. The study
Traffic Circulation Study for Neighborhood Southwest of Mockingbird Lane and Airline Road, Highland Park, Texas
 ARIZONA TEXAS NEW MEXICO OKLAHOMA February 13, 2015 Mr. Meran Dadgostar P.E., R.S. Town of Highland Park 4700 Drexel Dr. Highland Park, Texas 75205 Re: Traffic Circulation Study for Neighborhood Southwest
4. ENVIRONMENTAL IMPACT ANALYSIS 9. TRANSPORTATION AND TRAFFIC
 4. ENVIRONMENTAL IMPACT ANALYSIS 9. TRANSPORTATION AND TRAFFIC 4.9.1 INTRODUCTION The following section addresses the Proposed Project s impact on transportation and traffic based on the Traffic Study
Los Altos Hills Town Council - June 18, 2015 Palo Alto City Council June 22, AGENDA ITEM #2.B Presentation
 Los Altos Hills Town Council - June 18, 2015 Palo Alto City Council June 22, 2015 AGENDA ITEM #2.B Presentation Previous Presentations Los Altos Hills Town Council in May 2014 and February 2015 Palo Alto
Chapter 4 Traffic Analysis
 Chapter 4 Traffic Analysis PURPOSE The traffic analysis component of the K-68 Corridor Management Plan incorporates information on the existing transportation network, such as traffic volumes and intersection
FINAL DESIGN TRAFFIC TECHNICAL MEMORANDUM
 FINAL DESIGN TRAFFIC TECHNICAL MEMORANDUM July 2014 FINAL (SR 43) Project Development and Environment Study From State Road 60 (Adamo Drive) to I-4 (SR 400) Hillsborough County, Florida Work Program Item
MoPac South: Impact on Cesar Chavez Street and the Downtown Network
 MoPac South: Impact on Cesar Chavez Street and the Downtown Network Prepared by: The University of Texas at Austin Center for Transportation Research Prepared for: Central Texas Regional Mobility Authority
TRANSPORTATION ANALYSIS REPORT US Route 6 Huron, Erie County, Ohio
 TRANSPORTATION ANALYSIS REPORT US Route 6 Huron, Erie County, Ohio December 12, 2012 Prepared for: The City of Huron 417 Main Huron, OH 44839 Providing Practical Experience Technical Excellence and Client
METHODOLOGY. Signalized Intersection Average Control Delay (sec/veh)
") Chapter 5 Traffic Analysis 5.1 SUMMARY US /West 6 th Street assumes a unique role in the Lawrence Douglas County transportation system. This principal arterial street currently conveys commuter traffic
Chapter 5 Traffic Analysis 5.1 SUMMARY US /West 6 th Street assumes a unique role in the Lawrence Douglas County transportation system. This principal arterial street currently conveys commuter traffic
University Hill Transportation Study Technical Memorandum Alternatives Modeling and Analysis May 2007
 Technical Memorandum May 2007 Syracuse Metropolitan Transportation Council Edwards and Kelcey with Wallace Roberts and Todd Alta Planning and Design CONTENTS SECTION ONE- INTRODUCTION...1 SECTION TWO-
Magnolia Place. Traffic Impact Analysis. Prepared for: City of San Mateo. Prepared by: Hexagon Transportation Consultants, Inc.
 Magnolia Place Traffic Impact Analysis Prepared for: City of San Mateo Prepared by: Hexagon Transportation Consultants, Inc. Updated January 4, 2010 Table of Contents 1. Introduction...1 2. Existing Conditions...6
EXECUTIVE SUMMARY... vii 1 STUDY OVERVIEW Study Scope Study Area Study Objectives
 Contents EXECUTIVE SUMMARY... vii 1 STUDY OVERVIEW... 1-1 1.1 Study Scope... 1-1 1.2 Study Area... 1-1 1.3 Study Objectives... 1-3 2 EXISTING CONDITIONS... 2-1 2.1 Existing Freeway Conditions... 2-4 2.1.1
Harrah s Station Square Casino
 Transportation Analysis Harrah s Station Square Casino Pittsburgh, Pennsylvania Submitted To: City of Pittsburgh and Pennsylvania Gaming Control Board Prepared By: DKS Associates GAI Consultants December
5.3 TRAFFIC, CIRCULATION AND PARKING
 5.3 TRAFFIC, CIRCULATION AND PARKING This section is based upon the Downtown Lancaster Specific Plan Traffic Impact Analysis (April 2, 2008) and the Downtown Lancaster Specific Plan Parking Analysis (May
TABLE TRAFFIC ANALYSIS SCENARIOS
 4.11 TRANSPORTATION The potential traffic impacts of the proposed project are evaluated in the Buena Park Beach/Orangethorpe Mixed Use Project Traffic Analysis (Traffic Analysis) by Austin-Foust Associates
Northwest Corridor Project Interchange Modification, Interchange Justification and System Analysis Report Reassessment (Phase I)
") Northwest Corridor Project Interchange Modification, Interchange Justification and System Analysis Report Reassessment (Phase I) Introduction The Georgia Department of Transportation (GDOT) prepared a
Northwest Corridor Project Interchange Modification, Interchange Justification and System Analysis Report Reassessment (Phase I) Introduction The Georgia Department of Transportation (GDOT) prepared a
Sketch Level Assessment. of Traffic Issues. for the Fluor Daniel I-495 HOT Lane Proposal. Ronald F. Kirby
 Sketch Level Assessment of Traffic Issues for the Fluor Daniel I-495 HOT Lane Proposal Ronald F. Kirby Director of Transportation Planning National Capital Region Transportation Planning Board (TPB) Metropolitan
San Tomas Expressway
 Implementation Plan San Tomas Expressway Roads and Airports Department August 19, 2003 Implementation Plan San Tomas Expressway County of Santa Clara Roads and Airports Department 101 Skyport Drive San
Lincoln Avenue Road Diet Trial
 Lincoln Avenue Road Diet Trial Data Collection Report June 1, 2015 Department of Transportation Table of Contents I. Introduction...... 3 II. Data Collection Methodology & Results...... 5 A. Traffic Volume
Glenn Avenue Corridor Traffic Operational Evaluation
 Glenn Avenue Corridor Traffic Operational Evaluation PREPARED FOR: THE CITY OF AUBURN PREPARED BY: DECEMBER 2007 Glenn Avenue Corridor Study--Auburn, Alabama TABLE OF CONTENTS Introduction... 1 Background
Highway 111 Corridor Study
 Highway 111 Corridor Study June, 2009 LINCOLN CO. HWY 111 CORRIDOR STUDY Draft Study Tea, South Dakota Prepared for City of Tea Sioux Falls Metropolitan Planning Organization Prepared by HDR Engineering,
Focused Traffic Analysis for the 200 Nellen Avenue Project
 March 13, 2017 Mr. Phil Boyle Town of Corte Madera 300 Tamalpais Drive Corte Madera, CA 94976-0159 Focused Traffic Analysis for the 200 Nellen Avenue Project Dear Mr. Boyle; W-Trans has completed a focused
SETTINGS AND OPPORTUNITIES MOBILITY & ACCESS
 7 mobility & access how do people use el camino what is it like to drive on el camino/to park along el camino what is the pedestrian experience like what is the role of transit along the corridor what
MEMORANDUM. David Mohlenbrok, Environmental Services Manager
 MEMORANDUM DATE: August 10, 2017 TO: FROM: RE: Planning Commission Members David Mohlenbrok, Environmental Services Manager Blue Memo # 1 for Rocklin Station Project Comments Received on Initial Study/Mitigated
Northbound San Jose Avenue & I-280 Off-Ramp Road Diet Pilot Project
 Project Overview Fed by a two-lane Interstate-280 (I-280) off-ramp, high vehicular volumes and speeds are longstanding issues along San Jose Avenue. Residents in the surrounding neighborhoods have expressed
ENHANCED PARKWAY STUDY: PHASE 2 CONTINUOUS FLOW INTERSECTIONS. Final Report
 Preparedby: ENHANCED PARKWAY STUDY: PHASE 2 CONTINUOUS FLOW INTERSECTIONS Final Report Prepared for Maricopa County Department of Transportation Prepared by TABLE OF CONTENTS Page EXECUTIVE SUMMARY ES-1
Abrams Associates. Transportation Impact Analysis. City of Rocklin. Prepared for: David Mohlenbrok City of Rocklin 4081 Alvis Court Rocklin, CA 95677
 Transportation Impact Analysis Sierra College Boulevard Commercial Project City of Rocklin Prepared for: David Mohlenbrok City of Rocklin 081 Alvis Court Rocklin, CA 95677 Prepared by: 1875 Olympic Boulevard,
MOUNTAIN HOUSE SPECIFIC PLAN I 9.1 INTRODUCTION ASSUMPTIONS TRANSPORTATION FACILITIES TRANSPORTATION IMPROVEMENTS PHASING 9.
 CHAPTER NINE: TRANSPORTATION AND CIRCULATION 9.1 INTRODUCTION 9.1 9.2 ASSUMPTIONS 9.1 9.3 TRANSPORTATION FACILITIES 9.1 9.4 TRANSPORTATION IMPROVEMENTS PHASING 9.3 LIST OF FIGURES LIST OF TABLES Figure
Welcome! San Jose Avenue Open House August 25, 2015
 Welcome! San Jose Avenue Open House August 25, 2015 Vision Zero The City and County of San Francisco adopted Vision Zero San Francisco Vision Zero High Injury Network as a policy in 2014, committing an
CITY OF OAKLAND. 27th Street Bikeway Feasibility and Design. Final Report (v3) March 23, Kimley-Horn and Associates, Inc.
 March 23, Kimley-Horn and Associates, Inc.") CITY OF OAKLAND 27th Street Bikeway Feasibility and Design Final Report (v3) March 23, 2007 PREPARED BY: Kimley-Horn and Associates, Inc. Table of Contents 1. Introduction 3 2. 27 th Street/Bay Place Corridor
CITY OF OAKLAND 27th Street Bikeway Feasibility and Design Final Report (v3) March 23, 2007 PREPARED BY: Kimley-Horn and Associates, Inc. Table of Contents 1. Introduction 3 2. 27 th Street/Bay Place Corridor
Appendix C. NORTH METRO STATION AREA TRAFFIC IMPACT STATEMENT 88th Avenue Station
 Appendix C NORTH METRO STATION AREA TRAFFIC IMPACT STATEMENT 88th Avenue Station Prepared for: Regional Transportation Department and URS Corporation as part of the North Metro EIS David Evans and Associates,
Donahue Drive Corridor Traffic Operational Evaluation
 Donahue Drive Corridor Traffic Operational Evaluation PREPARED FOR: THE CITY OF AUBURN PREPARED BY: JANUARY 2007 Donahue Drive Corridor Study--Auburn, Alabama TABLE OF CONTENTS Introduction... 1 Background
4.1 Evaluation Criteria
 Section 3 of the I-280 Corridor Study report discussed potential improvements for the I-280 corridor improve mobility for all modes of transportation. This section evaluates those potential improvements
LSC TRANSPORTATION CONSULTANTS, INC. 516 North Tejon Street Colorado Springs, CO (719) FAX (719)
 FAX (719)") LSC TRANSPORTATION CONSULTANTS, INC. 516 North Tejon Street Colorado Springs, CO 80903 (719) 633-2868 FAX (719) 633-5430 E-mail: lsc@lsccs.com May 15, 2009 Mr. Davis Farrar Western Slope Consulting, LLC
LSC TRANSPORTATION CONSULTANTS, INC. 516 North Tejon Street Colorado Springs, CO 80903 (719) 633-2868 FAX (719) 633-5430 E-mail: lsc@lsccs.com May 15, 2009 Mr. Davis Farrar Western Slope Consulting, LLC
3.9 - Transportation and Traffic
 Transportation and Traffic 3.9 - Transportation and Traffic This section describes the potential transportation and traffic effects of project implementation on the project site and its surrounding area.
CHAPTER 2G. PREFERENTIAL AND MANAGED LANE SIGNS
 2011 Edition - Revision 2 Page 275 Section 2G.01 Scope CHAPTER 2G. PREFERENTIAL AND MANAGED LANE SIGNS 01 Preferential lanes are lanes designated for special traffic uses such as high-occupancy vehicles
Truck Climbing Lane Traffic Justification Report
 ROUTE 7 (HARRY BYRD HIGHWAY) WESTBOUND FROM WEST MARKET STREET TO ROUTE 9 (CHARLES TOWN PIKE) Truck Climbing Lane Traffic Justification Report Project No. 6007-053-133, P 101 Ι UPC No. 58599 Prepared by:
NO BUILD TRAFFIC OPERATIONS
 3. 23 NO BUILD TRAFFIC OPERATIONS This section addresses the operations of the transportation system and details how it would be expected to function under year 23 No Build conditions with the projected
REVIEW OF LOCAL TRAFFIC FLOW / LONG RANGE PLANNING SOLUTIONS STUDY
 ITEM Town of Atherton TRANSPORTATION COMMITTEE STAFF REPORT TO: FROM: MEMBERS OF THE COMMITTEE ROBERT OVADIA, PUBLIC WORKS DIRECTOR DATE: FEBRUARY 12, 2019 SUBJECT: REVIEW OF LOCAL TRAFFIC FLOW / LONG
APPENDIX G: INTERSECTION NEEDS AT OKEECHOBEE BOULEVARD
 APPENDIX G: INTERSECTION NEEDS AT OKEECHOBEE BOULEVARD INTERSECTION NEEDS AT SR 7 and OKEECHOBEE BOULEVARD SR 7 Extension Project Development and Environment (PD&E) Study From Okeechobee Boulevard (SR
Purpose and Need. Chapter Introduction. 2.2 Project Purpose and Need Project Purpose Project Need
 Chapter 2 Purpose and Need 2.1 Introduction The El Camino Real Bus Rapid Transit (BRT) Project (Project) would make transit and other transportation improvements along a 17.6-mile segment of the El Camino
APPENDIXB. Traffic Operations Technical Memorandum
 APPENDIXB Traffic Operations Technical Memorandum Environmental Assessment - Lincoln County, SD 85 th Street: Sundowner Avenue to Louise Avenue November 2017 MEMORANDUM Transportation Jim Kollbaum, PE
Waterford Lakes Small Area Study
 Waterford Lakes Small Area Study Existing Traffic Conditions PREPARED FOR: ORANGE COUNTY PUBLIC WORKS DEPARTMENT TRAFFIC ENGINEERING DIVISION ORLANDO, FLORIDA PREPARED WITH: INWOOD CONSULTING ENGINEERS
Traffic Analysis and Design Report. NW Bethany Boulevard. NW Bronson Road to NW West Union Road. Washington County, Oregon
 Traffic Analysis and Design Report NW Bethany Boulevard NW Bronson Road to NW West Union Road Washington County, Oregon May 2011 Table of Contents Table of Contents Section 1 Executive Summary... 2 Section
APPENDIX S REVISED PAGES OF THE SUPPLEMENTAL TRAFFIC IMPACT ANALYSIS
 APPENDIX S REVISED PAGES OF THE SUPPLEMENTAL TRAFFIC IMPACT ANALYSIS The capacity of the toll plaza was estimated based on data from numerous studies as well as traffic counts conducted at the toll plaza
Reference number /VP. Lafayette Downtown Congestion Study - Additional Traffic Analysis
 To James Hinkamp and Tony Coe, City of Lafayette Date January 19, 2017 Copies Reference number 243381/VP From Michael Iswalt and Vanessa Peers File reference 4-05 Subject Lafayette Downtown Congestion
Marina Loft (DRC 51-R-12)
") Marina Loft (DRC 51-R-12) traffic study prepared for: Cymbal Development OCtober 2012 Traf Tech October 1, 2012 Mr. Asi Cymbal - President Cymbal Development 3470 North Miami Avenue Upper Suite Miami,
Marina Loft (DRC 51-R-12) traffic study prepared for: Cymbal Development OCtober 2012 Traf Tech October 1, 2012 Mr. Asi Cymbal - President Cymbal Development 3470 North Miami Avenue Upper Suite Miami,
3.6 Traffic and Transportation/Pedestrian and Bicycle Facilities
 3.6 Traffic and Transportation/Pedestrian and Bicycle Facilities The information in this section is based on the Traffic Technical Report (2012). The Riverside County Traffic Analysis Model (RIVTAM) (with
Evaluation of M-99 (Broad Street) Road Diet and Intersection Operational Investigation
 Road Diet and Intersection Operational Investigation") Evaluation of M-99 (Broad Street) Road Diet and Intersection Operational Investigation City of Hillsdale, Hillsdale County, Michigan June 16, 2016 Final Report Prepared for City of Hillsdale 97 North Broad
Evaluation of M-99 (Broad Street) Road Diet and Intersection Operational Investigation City of Hillsdale, Hillsdale County, Michigan June 16, 2016 Final Report Prepared for City of Hillsdale 97 North Broad
TABLE OF CONTENTS FEASIBILITY REPORT
 TABLE OF CONTENTS 1.0 Executive Summary... 1 2.0 Introduction... 6 2.1 BACKGROUND... 6 2.2 PURPOSE OF STUDY... 7 2.3 STUDY AREA... 8 2.4 STUDY PROCESS / STAKEHOLDER INVOLVEMENT... 8 3.0 Summary of Freeways
CITY OF WEST LAKE HILLS. Forest View Neighborhood Traffic Calming Study
 CITY OF WEST LAKE HILLS 901 South Mopac Expressway Building V, Suite 220 Austin, Texas 78746 Texas P.E. Firm Registration No. F-929 Klotz Associates Final Report Submittal: March 20, 2015 Revised Final
MEMORANDUM. Charlotte Fleetwood, Transportation Planner
 MEMORANDUM Date: Updated August 22, 2017 To: Organization: Charlotte Fleetwood, Transportation Planner Boston Transportation Department From: Jason DeGray, P.E., PTOE, Regional Director of Engineering
DUNBOW ROAD FUNCTIONAL PLANNING
 DUNBOW ROAD FUNCTIONAL PLANNING Final Report August 3, 216 #31, 316 5th Avenue NE Calgary, AB T2A 6K4 Phone: 43.273.91 Fax: 43.273.344 wattconsultinggroup.com Dunbow Road Functional Planning Final Report
DRAFT. Memo. Range of the Alternatives Considered in the EIS
 Memo Date: Friday, December 09, 2016 Project: To: From: Subject: State Route 30 EIS UDOT Vince Izzo This memorandum summarizes the draft State Route (S.R.) 30 Level 1 screening results. A more detailed
3.0 PROJECT DESCRIPTION
 The following section of the Draft EIR contains a description of the proposed Elk Grove Boulevard/SR 99 Interchange Modification project, consistent with the requirements of CEQA Guidelines Section 15124.
Los Coyotes Country Club Development Plan Traffic Impact Analysis
 Los Coyotes Country Club Development Plan Traffic Impact Analysis Prepared For: Phil Martin Associates 2073007450 Los Coyotes Country Club Development Plan Traffic Impact Analysis June 19, 2014 Prepared
4.12 TRANSPORTATION Executive Summary. Setting
 4.12 TRANSPORTATION 4.12.1 Executive Summary This section is based on the Multimodal Transportation Impact Study (TIS; 2016) prepared by Omni-Means, Ltd. to evaluate projected transportation impact conditions
Foothill Expressway Improvements Between El Monte and San Antonio
 Foothill Expressway Improvements Between El Monte and San Antonio June 29, 2017 - Los Altos Community Meeting Introduction Project Background Agenda Visit Stations: Provide Input and Ask Questions Reconvene:
Stakeholder Focus Group Meeting #3 January 9, 2013 Cattlemens, 2000 Taylor Road, Roseville
 PRESENT Stakeholder Focus Group Meeting #3 January 9, 2013 Cattlemens, 2000 Taylor Road, Roseville PROJECT TEAM REPRESENTATIVES Name Organization Celia McAdam Luke McNeel Caird Leo Heuston Judy Matsui
4 Level of Service Results: HOV and Express Lanes
 4 Level of Service Results: HOV and Express Lanes Considering the importance of managed lanes (such as HOV and express lanes) in improving the overall performance of a corridor, Alameda CTC started monitoring
Addendum to Mitigated Negative Declaration
 Addendum Date: Case No.: 2014.1499E Project Title: (MDSP) - Mission Valencia Green Gateway Streetscape Project Original: 2008.1075, MDSP Mitigated Negative Declaration Project Sponsor: Charlie Ream, San
EVALUATION OF METHODOLOGIES FOR THE DESIGN AND ANALYSIS OF FREEWAY WEAVING SECTIONS. Alexander Skabardonis 1 and Eleni Christofa 2
 EVALUATION OF METHODOLOGIES FOR THE DESIGN AND ANALYSIS OF FREEWAY WEAVING SECTIONS Alexander Skabardonis 1 and Eleni Christofa 2 1: University of California, Berkeley, Institute of Transportation Studies,
Planning Committee STAFF REPORT March 7, 2018 Page 2 of 4 The following MTSOs are being used across the five subregions: Intersection Level of Service
 Planning Committee STAFF REPORT Meeting Date: March 7, 2018 Subject Summary of Issues Recommendations Financial Implications Options Attachments Changes from Committee Review Draft 2017 Multimodal Transportation
Simulating Street-Running LRT Terminus Station Options in Dense Urban Environments Shaumik Pal, Rajat Parashar and Michael Meyer
 Simulating Street-Running LRT Terminus Station Options in Dense Urban Environments Shaumik Pal, Rajat Parashar and Michael Meyer Abstract The Exposition Corridor transit project is a light rail project
Reference: Laguna Canyon Road Traffic Conditions Data Collection Summary
 Stantec Consulting Services Inc. 38 Technology Drive Suite 100, Irvine CA 92618-5312 September 8, 2017 File: 2073014320 Attention: Mark Trestik, Assistant City Engineer City of Beach Department of Public
Bridge Street Corridor Study Report
 Bridge Street Corridor Study Report Prepared for: Prepared by: BRIDGE STREET CORRIDOR STUDY REPORT PREPARED FOR: CITY OF ARROYO GRANDE COMMUNITY DEVELOPMENT DEPARTMENT 300 EAST BRANCH STREET ARROYO GRANDE,
V. ENVIRONMENTAL IMPACT ANALYSIS K. TRANSPORTATION AND CIRCULATION
 V. ENVIRONMENTAL IMPACT ANALYSIS K. TRANSPORTATION AND CIRCULATION ENVIRONMENTAL SETTING The following section is based on the Draft Traffic Circulation Study for the Malibu La Paz Project (Traffic Study),
NEPA and CEQA Transportation Operation Analysis
 3.1 Introduction Chapter 3 Transportation Operation Analysis This chapter includes a transportation analysis of the operational impacts of the following: The National Environmental Policy Act (NEPA) Alternatives
3.2.2 Proposed Road Network within Phase 1B Lands
 3.2.2 Proposed Road Network within Phase 1B Lands Figure 3.1 also shows the proposed road network within the Premier Gateway Phase 1B Employment Area lands, which features two collector roads providing
Traffic Impact Study WestBranch Residential Development Davidson, NC March 2016
 Traffic Impact Study WestBranch Residential Development Davidson, NC March 216 TRAFFIC IMPACT STUDY FOR THE WestBranch Residential Development LOCATED IN DAVIDSON, NC Prepared For: Lennar Carolinas, LLC
Route 7 Corridor Study
 Route 7 Corridor Study Executive Summary Study Area The following report analyzes a segment of the Virginia State Route 7 corridor. The corridor study area, spanning over 5 miles in length, is a multi
TRAFFIC OPERATIONS ANALYSIS REPORT. Pacheco Boulevard Alignment Study and Alternatives Analysis
 TRAFFIC OPERATIONS ANALYSIS REPORT Pacheco Boulevard Alignment Study and Alternatives Analysis PREPARED FOR: CITY OF MARTINEZ AND CONTRA COSTA COUNTY OCTOBER 2016 FINAL REPORT Prepared By: under contract
Road Conversion Study Plumas Street
 Plumas Street Phase I Submitted to The Regional Transportation Commission of Washoe County Submitted by Zong Tian, Ph.D., P.E. Saeedeh Farivar Haiyuan Li, Ph.D. Center for Advanced Transportation Education
Design Traffic Technical Memorandum
 State Road 7 Extension PD&E Study Design Traffic Technical Memorandum Palm Beach County, FL October 2010 State Road 7 Extension PD&E Study Design Traffic Technical Memorandum Palm Beach County, FL Prepared
TECHNICAL MEMORANDUM
 TECHNICAL MEMORANDUM DATE: January 17, 2005 TO: Ted Idlof, URS FROM: Jeff Clark, Fehr & Peers RE: U.S. 50 Interchange Planning Study 1042-2011 This memorandum describes conceptual improvements for the
CITY OF LOS ANGELES INTER-DEPARTMENTAL CORRESPONDENCE
 CITY OF LOS ANGELES INTER-DEPARTMENTAL CORRESPONDENCE Date: May 9, 2017 To: Honorable City Council c/o City Clerk, Room 395, City Hall Attention: Honorable Mike Bonin, Chair, Transportation Committee From:
TRAFFIC IMPACT STUDY COMPREHENSIVE UPDATE TOWN OF THOMPSON S STATION, TENNESSEE PREPARED FOR: THE TOWN OF THOMPSON S STATION
 TRAFFIC IMPACT STUDY COMPREHENSIVE UPDATE TOWN OF THOMPSON S STATION, TENNESSEE PREPARED FOR: THE TOWN OF THOMPSON S STATION Transportation Consultants, LLC 1101 17 TH AVENUE SOUTH NASHVILLE, TN 37212
Clay Street Realignment Project Traffic Study
 Final Clay Street Realignment Project Traffic Study November 24, 2009 Prepared for: City of Placerville RS07-2466 2990 Lava Ridge Court, Suite 200 Roseville, CA 95661 (916) 773-1900 Fax (916) 773-2015
 TRAFFIC IMPACT STUDY CANYON HILLS PROJECT LOS ANGELES, CALIFORNIA INTRODUCTION This traffic analysis has been conducted to identify and evaluate the potential traffic impacts of the proposed Canyon Hills
I-264 CORRIDOR EVALUATION STUDY. September 7, 2016 Eric Stringfield VDOT Planning Director Chris Lawrence AECOM Senior Transportation Engineer
 I-264 CORRIDOR EVALUATION STUDY September 7, 2016 Eric Stringfield VDOT Planning Director Chris Lawrence AECOM Senior Transportation Engineer Study Overview Interchange Locations Study Context Follow-up
Congestion Management Report
 Congestion Management Report F.E. EVERETT TURNPIKE (NORTH), MERRIMACK Segment Length: 7.0 miles Daily Traffic Volumes: 60,000-69,000 Analysis Period: May 2015 Number of Traffic Signals: 0 Number of travel
MEMORANDUM INTRODUCTION/PURPOSE/OVERALL FINDINGS
 MEMORANDUM Date: To: From: Subject: Steve, City of Tacoma Dan Grayuski and Will Lisska, Fehr & Peers Schuster Corridor Trail Project SE12-0265.00 INTRODUCTION/PURPOSE/OVERALL FINDINGS The City of Tacoma
Traffic Impact Analysis Walton Acres at Riverwood Athletic Club Clayton, NC
 Traffic Impact Analysis Walton Acres at Riverwood Athletic Club Clayton, NC 1. TABLE OF CONTENTS INTRODUCTION...1 1.1. Site Location and Study Area...1 1.2. Proposed Land Use and Site Access...2 1.3.
Appendix B: Forecasting and Traffic Operations Analysis Framework Document
 Existing Conditions Report - Appendix Appendix B: Forecasting and Traffic Operations Analysis Framework Document This document defines the methodology and assumptions that will be used in the traffic forecasting
6.0 PEDESTRIAN AND BICYCLE FACILITIES 6.1 INTRODUCTION 6.2 BICYCLE DEMAND AND SUITABILITY Bicycle Demand
 6.0 PEDESTRIAN AND BICYCLE FACILITIES 6.1 INTRODUCTION Bicycle and pedestrian travel along and in the vicinity of the corridor is part of the vision of Somerset and Hunterdon counties and the integrated
APPENDIX H TRAFFIC REPORT
 APPENDIX H TRAFFIC REPORT Keith Higgins Traffic En ginee r WEST END SAND CITY TRAFFIC IMPACT ANALYSIS DRAFT REPORT SAND CITY, CALIFORNIA Prepared for DBO Development No. 3 Monterey, CA Prepared by Keith
Washington DC Section of ITE Project Briefing
 Washington DC Section of ITE Project Briefing November 5, 2015 Renée Hamilton, VDOT, Deputy District Administrator I-66 Outside the Beltway Improvement Area Project Location Virginia 2 Purpose and Need
SANTA CLARA COUNTYWIDE BICYCLE PLAN August 2008
 SANTA CLARA COUNTYWIDE BICYCLE PLAN August 2008 To assist VTA and Member Agencies in the planning, development and programming of bicycle improvements in Santa Clara County. Vision Statement To establish,
List of Exhibits...ii
 One Brickell Traffic Study TABLE OF CONTENTS List of Exhibits...ii EXECUTIVE SUMMARY...1 1. INTRODUCTION...2 1.1 Study Area...2 1.2 Study Objective...5 2. EXISTING TRAFFIC CONDITIONS...6 2.1 Data Collection...6
Date: September 7, Project #: Re: Spaulding Youth Center Northfield, NH Property. Traffic Impact Study
 To: Ms. Susan C. Ryan Spaulding Youth Center 72 Spaulding Road Northfield, NH 03276 Date: September 7, 2017 Project #: 52455.00 From: Robin Bousa Director of Transportation Systems Re: Spaulding Youth
Traffic Impact Study. Westlake Elementary School Westlake, Ohio. TMS Engineers, Inc. June 5, 2017
 TMS Engineers, Inc. Traffic Impact Study Westlake Elementary School Westlake, Ohio June 5, 2017 Prepared for: Westlake City Schools - Board of Education 27200 Hilliard Boulevard Westlake, OH 44145 TRAFFIC
A plan for improved motor vehicle access on Railroad Avenue in Provincetown
 A plan for improved motor vehicle access on Railroad Avenue in Provincetown February 2011 A plan for improved motor vehicle access on Railroad Avenue in Provincetown INTRODUCTION AND PROBLEM IDENTIFICATION
TRAFFIC IMPACT STUDY. Creekside Thornton, Colorado. For. August 2015 November 2015 Revised: August Prepared for:
 TRAFFIC IMPACT STUDY For Creekside Thornton, Colorado August 215 November 215 Revised: August 216 Prepared for: Jansen Strawn Consulting Engineers 45 West 2 nd Avenue Denver, Colorado 8223 Prepared by:
Traffic Impact Analysis Chatham County Grocery Chatham County, NC
 Chatham County Grocery Chatham County, NC TABLE OF CONTENTS 1. INTRODUCTION... 1 1.1. Location and Study Area... 1 1.2. Proposed Land Use and Access... 2 1.3. Adjacent Land Uses... 2 1.4. Existing ways...
Interstate Route 77 / US Route 62 / State Route 687 (Fulton Road) Transportation Improvement Project. Prepared September 6, 2017
 Transportation Improvement Project. Prepared September 6, 2017") EODOT Project: ODOT Project: STA-IR 77-.50; PID 00290 Interstate Route 77 / US Route 62 / State Route 687 (Fulton Road) Transportation Improvement Project Summary of Public Comments Received and Responses
EODOT Project: ODOT Project: STA-IR 77-.50; PID 00290 Interstate Route 77 / US Route 62 / State Route 687 (Fulton Road) Transportation Improvement Project Summary of Public Comments Received and Responses