MICHIGAN CANAL AND DEEP RUN CREEK
|
|
|
- Elijah Miles
- 5 years ago
- Views:
Transcription

1 LOCKPORT, ILLINOIS WEST SIDE FLOOD STUDY OF THE ILLINOIS & MICHIGAN CANAL AND DEEP RUN CREEK Lockport, Illinois WEST SIDE FLOOD STUDY OF THE ILLINOIS & MICHIGAN CANAL AND DEEP RUN CREEK Submitted to: City of Lockport 222 East Ninth Street Lockport, Illinois Submitted by: Manhard Consulting, Ltd. 700 Springer Drive Lombard, Illinois Springer Drive Lombard, Illinois September 4, 2012 September 4, 2012
2 Table of Contents EXECUTIVE SUMMARY 1.0 INTRODUCTION HISTORY OF THE SITE BASE FLOOD ELEVATION DETERMINATION Previous Hydrologic Analysis Previous Hydraulic Analysis Existing Conditions Hydrologic Analysis Basin Description Rainfall Loss Coefficients Hydrologic Calibration Existing Conditions Hydraulic Analysis I&M Canal Fiddyment Creek Big Run & Deep Run Creeks Long Run Creek Hydraulic Calibration RESULTS SITE MODIFICATIONS Deep Run Creek Fiddyment Creek I&M Canal Big Run Creek CONCLUSION REFERENCES 21
3 List of Tables Sub Basin Summary 3.3.1a Milne Creek Sub Basin Summary Sub Basins Land Use and Soil Groups Summary 3.3.2a Milne Creek Sub Basins Land Use and Soil Groups Summary Runoff Curve Number Compilation 3.3.3a Milne Creek Sub Basin Runoff Curve Number Compilation Sub Basin Time of Concentration Summary 3.3.4a Milne Creek Sub Basin Time of Concentration Summary Existing Conditions Stage-Storage Summary Table South Stormwater Pond Weir Discharge Calculation North Stormwater Pond Weir Discharge Calculation Sub-Basin Rainfall Data Lockport Rainfall Data Will County Design Rainfall Table 18. Average Ratios of X-Hour/24-Hour Rainfall for Illinois Table 37. Heavy Rainfall at a Point Illinois State Water Survey 500-year Rainfall in NE Illinois Table 35. Relations between Areal Mean and Point Rainfall Frequency Distributions (taken from Bulletin 70) Incremental Precipitation Distributions (for Critical Storms) Existing Conditions I&M Canal Results Existing Conditions Deep Run Creek Results Existing Conditions 13 th Street Overflow Results Existing Conditions Big Run Creek Results Existing Conditions Fiddyment Creek Results Existing Conditions HEC-HMS Summary (10, 50, 100, 500yr Storms)
4 List of Figures 1. Site Aerial Photo 2. FEMA Firm Panel 3. USGS Map 4. Roadway Map 5. Watershed Map 6. Site Photos (9) 7. Tributary Aerial 8A. Offsite Topography 8B. On-Site Topography 9. Joliet Hydrologic Atlas 10. Intentionally Blank 11. Latest Aerial Photo 12. Hydrologic Connectivity Diagram (HEC-HMS) 13A. Existing Conditions BFE North Study Area 13B. Existing Conditions BFE Middle Study Area 13C. Existing Conditions BFE South Study Area 14A. Frequency Distribution of 24-hour Maximum Rainfall (1-yr thru 10-yr) 14B. Frequency Distribution of 24-hour Maximum Rainfall (25-yr thru 100-yr) 14C. Rainfall Distribution Isohyetal Distribution 100-yr 14D. Rainfall Distribution Isohyetal Distribution 50-yr 14E. Rainfall Distribution Isohyetal Distribution 10-yr 15. Sub-Basin Curve Numbers
5 16. September 1992 Storm Hydrograph Calibration 17. July 1996 Storm Hydrograph Calibration 18A. September 2008 Storm Optimization Trials 18B. September 2008 Storm Hydrograph Calibration 19A. Thiessen Polygons B. Nexrad Pixels High Water Mark Elevations 21A. Fiddyment Creek Survey Data 21B. Fiddyment Creek Survey Data 21C. Deep Run Creek Survey Data 21D. Deep Run Creek Survey Data 21E. Deep Run Creek Survey Data 21F. Deep Run Creek Survey Data 21G. Deep Run Creek Survey Data 21H. 2 nd Avenue Survey Data 22A. Deep Run Diversion HEC-RAS Lateral Weir Structures 22B. Deep Run Diversion HEC-RAS Lateral Weir Structures 22C. 13 th Street Overflow HEC-RAS Lateral Weir Structure 23A. Deep Run Diversion Input Hydrograph Comparison 23B. Deep Run Diversion Input Hydrograph 0.2% 23C. Deep Run Diversion Input Hydrograph 1% 23D. Deep Run Diversion Input Hydrograph 2% 23E. Deep Run Diversion Input Hydrograph 10% th Street Overflow Diversion Hydrograph (2%, 10%, 1%, 0.2%)
6 List of Appendices A. Hydrologic Modeling Data HEC-HMS Input Files A-1. A-2. A-3. Times of Concentration Precipitation Gage Data Stream Gage Data B. Existing Conditions HEC-RAS Modeling B-1. B-2. B-3. B-4. B-5. B-6. I&M Canal Big Run Creek Fiddyment Creek Deep Run Creek Long Run Creek 13 th Street Overflow C. Excerpts From the I&M Canal HEC-1 & HEC-2 Models By ISWS D. Fiddyment Creek WSP2 Model From FEMA E Survey Data Provided By Chevron F. I&M Canal Plan and Profiles by IDNR G. Deep Run Creek Plans by MWRD H. Electronic modeling files on CD
7 EXECUTIVE SUMMARY This report presents detailed floodplain mapping and modeling of the I&M Canal and Deep Run Creek from Division Street north to the decommissioned Chevron refinery in Lockport, Illinois. This report provides updated hydrologic analysis for the I&M Canal, Long Run Creek, Deep Run Creek, Big Run Creek, Fiddyment Creek and Milne Creek, each of which is a tributary with greater than one square mile of drainage area. This report provides detailed calculations of the base flood elevations for the above drainage ways and was prepared in conformance with rules and regulations pertaining to floodplain mapping standards for approval by the Federal Emergency Management Agency, Illinois Department of Natural Resources Office of Water Resources, Will County and the City of Lockport. Computer modeling and analysis utilizes the Army Corps of Engineers Hydrologic Engineering Center (HEC) suite of programs, specifically the Hydrologic Modeling System (HEC-HMS version 3.5) and the unsteady portion of the River Analysis System (HEC-RAS version 4.1.0), along with the calibration capabilities of those models. United States Geologic Survey (USGS) and Cook County precipitation and stream gages within the vicinity of the project were used for the calibration efforts. Watershed analysis approximates a highly complex real world system that is constantly changing, but calibration significantly improves the validity and accuracy of the modeling effort. Based on the use of more accurate topographical information and more detailed modeling than was used in previously developed flood studies of portions of the watershed, the establishment of revised base flood elevations is warranted. This report provides accurate mapping of the base flood elevations along the water courses identified above. The intent is for the City of Lockport to use this data to ensure the safety and well being of their citizens and neighbors through identifying potential flood hazards in greater detail and to create a tool for evaluation of future improvements that will make the stormwater management system more effective. This report will be the basis for a Letter of Map Revision (LOMR). P:\Lplp\Documents\StormWater Reports\Preliminary Stormwater Reports\EXECUTIVE SUMMARY docx

8 1. Introduction This report presents detailed calculations and documentation for the existing conditions base flood elevation (BFE) analysis of the waterways that drain from the confluence of Long Run Creek and the I&M Canal south to Division Street, including Deep Run Creek, in Lockport, Illinois. These waterways include the Illinois and Michigan (I&M) Canal, Long Run Creek, Big Run Creek, Fiddyment Creek, Deep Run Creek and Milne Creek. Figure 1 presents the location of the Site with respect to the surrounding area. This report is organized as follows. Section 1 provides an introduction; Section 2 provides an outline of the history of the I&M Canal and Deep Run Creek as it relates to floodplain and stormwater management; Section 3 details the flood study performed by Manhard Consulting Ltd. for the following surface watersheds: o Big Run Creek o Long Run Creek o Deep Run Creek o I&M Canal o Fiddyment Creek o Milne Creek Section 4 provides existing conditions hydraulic analysis results and discussion; Section 5 provides discussion on recent modifications within the corridor that affect hydraulics; Section 6 provides concluding statements Section 7 documents references used in the preparation of this report Tables, Figures, and Appendices follow Section 7 Appendices to this report contain exhibits showing the calculated base flood elevations and results, and detailed information and computer modeling of the above referenced watersheds. The purpose of this submittal is to present a base flood elevation ( BFE ) for the I&M Canal and Deep Run Creek consistent with the topographical analysis and modeling that is presented herein suitable for submittal of a Letter of Map Revision (LOMR). 2. History of the Site During the planning phase of the I&M Canal in the early 1830s, land along the proposed corridor was designated as Canal Land. The sale of Canal Land was used to fund the building of the I&M Canal. Several railway lines were installed adjacent and through the area as traffic along the I&M Canal dwindled and ceased. This infrastructure provided necessary materials for the continued operation of refineries and other businesses along the canal. The construction of the I&M Canal began in 1836 to connect Lake Michigan with the Illinois River, and was completed in The Canal was originally designed to have a 36-foot bottom width, and a 60- foot waterline at a depth of 6 feet. The total length of the Canal was originally 96.4 miles. Locks, aqueducts and feeder channels maintained the water level in the Canal until it was decommissioned in Texaco Dam downstream P:\Lplp\Documents\StormWater Reports\Final Stormwater Reports\Narrative - Final BFE_ docx 1
9 1933. The Canal was closed to navigation in Since that time, the Canal channel has continued to function as a stormwater drainage channel and the outlet of several tributaries to the east. The tributaries that feed the Canal in the Lockport area are Covenant Creek, School Gully, Long Run, Big Run, Fiddyment Creek, Milne Creek and Fraction Run. Long Run, Big Run, Fiddyment Creek and Milne Creek have been included in detail within this report. Originally, these creeks drained directly to the Des Plaines River. The construction of the I&M Canal, and later, the Chicago Sanitary and Ship Canal (completed in 1900), intercepted or blocked the direct drainage paths that were formerly taken by these creeks, and complicated the management of surface water drainage in the region. Various features constructed in and along the I&M Canal have affected its hydraulics. At the former Texaco refinery site an inverted siphon that runs along the bottom of the channel bed at one location, and a dam that was constructed by Texaco in the 1930s to provide a supply of process water and a tool for flood management. Bridges and other structures have been identified in this report. In April of 1947, and again in July of 1957, major storm events created significant flooding in the region. The flooding by these storms was recorded on the USGS Hydrologic Atlas (see Figure 9). This information was later used by FEMA to delineate the approximate floodplain in this area. The loss of human life and the significant property damage resulting from the 1957 flood led to a public outcry that prompted the Metropolitan Sanitary District to take action. District engineers expedited preparation of the plans that were already in the works for a Deep Run Creek Enlargement project. A photocopy of a project summary sheet dated January 21, 1957 is provided as Figure 22. Texaco cooperated with the District and the City of Lockport, and in the early 1960s, engaged in construction activities in the northern stretch of Deep Run Creek. Deep Run improvements originated at an overflow weir on the west bank of the I&M Canal (approximately one mile north of Second Street) to Sixth Street. The Deep Run Creek improvements were based on a flow rate from 5000 cubic feet per second (cfs) at the diversion to 6500 cfs at the confluence with the Des Plaines River. A copy of the Metropolitan Sanitary District construction plans for this portion of the Deep Run Creek Enlargement project is provided in Appendix G. Review of these photos provides evidence that work to construct a channel for Deep Run Creek through this area was undertaken between those years. The National Flood Insurance Program was implemented in the mid-1970s and Flood Insurance Rate Maps (FIRM) were created for the area. The flood zones that are delineated on the FIRM panels are combined on Figure 2. Preliminary mapping has been prepared, but not adopted by Illinois State Water Survey. The floodplain along the I&M Canal and Deep Run Creek is identified as Zone A, which means that no base flood elevations have been determined for those areas, and therefore, the delineated floodplain is approximate. Detailed studies have been prepared for Fiddyment Creek, Milne Creek and upstream portions of Long Run Creek. Several of these have designated floodways. A comparison of the floodplain depicted on Figure 2 (and the FIRM panels) with the floodplain that is depicted on HA-89 (Figure 9) clearly indicates that the FIRM panels were derived from the Hydrologic Atlas work that was published by the United States Geological Survey in The information depicted does not therefore incorporate any of the flood relief that may have been produced by the construction of the Deep Run Creek Enlargement project or subsequent alterations within the watershed. The effective FIRM panels have a 1995 publication date and thus do not reflect changes made during the years since the flood of record. Illinois State Water Survey, as the Cooperative Technical Partner for FEMA is updating the FIRMs for Will County has published preliminary maps. The floodplain mapped limits or designations have not changed for this location. The Existing Conditions P:\Lplp\Documents\StormWater Reports\Final Stormwater Reports\Narrative - Final BFE_ docx 2
10 BFE Exhibits (Figures 13A - D) include topography for the Chevron Site and downstream areas south of Division Street but north of the confluence of Fraction Run; the data from which this topography was generated was collected by aerial survey photography during a 2009 flight, provided by Chevron for the decommissioned refinery, or Will County 2-ft topography provided by the City of Lockport for other areas. Additional survey data was collected by Ruettiger, Tonnelli & Associates in Deep Run Creek, Fiddyment Creek and along the I&M Canal. Manhard Consulting, Ltd. compiled additional survey data of the bridges crossing the I&M Canal and Deep Run Creek south of 2 nd Avenue and interior to the area between the I&M Canal and Deep Run Creek between 6 th Street and Division Street. Chevron performed channel cleaning of Deep Run Creek from the Sanitary & Ship Canal access drive within their site downstream to Division Street. Cleaning of the I&M Canal to bedrock was performed by Chevron from the Long Run Creek and I&M Canal confluence downstream past 2 nd Avenue to the Milne Creek confluence. The cleaned portions of the I&M Canal and Deep Run Creek have been included within this report. The remaining portions of the I&M Canal waterway are unchanged from previous survey data. This report provides detailed hydrologic and hydraulic analysis of the I&M Canal, Big Run Creek, Fiddyment Creek and Deep Run Creek through the Chevron site. The analysis of Deep Run has been extended to Division Street. An approximate BFE has been determined for the northern limits of the site along Long Run Creek. P:\Lplp\Documents\StormWater Reports\Final Stormwater Reports\Narrative - Final BFE_ docx 3
11 3. Base Flood Elevation Determination 3.1 Previous Hydrologic Analysis Previous hydrologic analysis work was completed in 1994 by the Illinois State Water Survey (ISWS) and published in: Hydrologic and Hydraulic Analyses of the Illinois and Michigan Canal at Lockport, Illinois, which was a continuation of a study that began with the publication of Feasibility of Rehabilitation of the Illinois and Michigan Canal at Lockport, Illinois, by ISWS in 1990). The 1994 ISWS report contains various storm frequency flood hydrographs for the I&M Canal produced in HEC-1. The ISWS evaluated flooding impact on multiple Locks and Dams along the canal, as well as sediment loading and transfer along the creeks and canal. The ISWS reports contain useful information, including survey data of the I&M Canal, monthly base flow measurements and calculations, and hydrologic and hydraulic computer modeling. Where applicable, information from the ISWS report was incorporated into the study presented herein. Excerpts from the reports can be found in Appendix D. The ISWS sub-basin areas and base flows were reviewed prior to utilization in this study. The ISWS sub-basin areas were reexamined for accuracy and revised as necessary. Significantly changes to the tributary areas, sub-basin delineations and watershed parameters were warranted and incorporated into this report. Therefore, the ISWS report was of value, but has been superseded by this report. The FIS studies of Fiddyment and Milne Creeks have been evaluated. Fiddyment Creek and Long Run Creek were previously analyzed using regression equations. This report updates those areas and supersedes those computed discharge values. Milne Creek was originally evaluated using regression equations and the hydrology has been updated within this report. No effort has been made to revise the Milne Creek floodplain mapping. The hydrology was recomputed to provide hydrographs for input into the unsteady HEC-RAS hydraulic modeling at the confluence with the I&M Canal. Regression equations were used for mapping the upstream reaches of Milne Creek, but are beyond the scope of this report. Harza prepared computations for interbasin flow for the Deep Run diversion, the 13 th Avenue diversion and a third diversion downstream of Fraction Run. The Deep Run and 13 th Avenue diversions have been recomputed within this report. However, the diversion south of Fraction Run was not included as it is downstream of the study limits. 3.2 Previous Hydraulic Analysis For the six waterways that drain through the report area only Fiddyment Creek, Long Run Creek, Milne Creek and the I&M Canal have been the subject of previous hydraulic study. The FEMA study of Long Run Creek ends east of the newly constructed Interstate 355, which is 1.2 miles upstream of the Site. Since the model for Long Run ends significantly upstream of the site, it was not used in the BFE analysis presented in this report. The Fiddyment Creek model was created in 1972 using the WSP2 water surface modeling program. Cross-sections from the Fiddyment Creek WSP2 model were input into our HEC-RAS modeling. Letters of Map Revision for upstream portions of Fiddyment Creek were prepared in 1994 and 1995 for the Woodlands Subdivision. Milne Creek was studied using detailed methods by Alfred Benesch in Letters of Map Revision were prepared for Madison Street (1994) and Westwood Estates (1992) along Milne Creek. ISWS performed a hydraulic study on the I&M Canal in 1994, using the HEC-2 program. However, this analysis was never submitted to or approved by the Illinois Department of Natural Resources P:\Lplp\Documents\StormWater Reports\Final Stormwater Reports\Narrative - Final BFE_ docx 4
12 Office of Water Resources (IDNR-OWR) and is therefore not an accepted regulatory model. The ISWS hydraulic report calculated I&M Canal Base Flood Elevations (BFE) using flows generated in the ISWS Hydrologic study of the Canal Base Flood Elevations (BFE) using flows generated in the ISWS Hydrologic study of the Canal. Excerpts from the ISWS Hydrologic Study can be found in Appendix D of this report. Cross section data, collected by Illinois Department of Natural Resources Office of Water Resources, was used from the ISWS report for the Canal for this study. However, the steady state modeling used in the ISWS study was deemed inadequate to accurately model the Deep Run Creek diversion, Big Run Surge Basin and Texaco Dam. An unsteady HEC-RAS model was implemented, superseding the ISWS BFE. 3.3 Existing Conditions Hydrologic Analysis In the mid-1800s the I&M Canal was constructed by the State of Illinois to create a navigable link from Lake Michigan to the Illinois River. Since the completion of its original construction, many adjustments have occurred to the Canal, some natural and others manmade. During the research and field investigation of the upper tributaries conducted for this report, it was found that the north tributaries, which include School Gully and Convent Creek, no longer drain southward, as they historically did, but have been diverted and blocked off by upstream industry. What once was open watercourse is now silt-filled in places. Lemont s portion of the I&M Canal now drains northward to a confluence with the Chicago Sanitary and Ship Canal. This dramatic change in the watershed removes approximately six square miles of drainage area, which once drained through the former Texaco refinery site. Historically, Lake Michigan drained through the I&M Canal to the Illinois River. However, significant alterations to the Canal have resulted in just a small tributary drainage area from the Citgo Refinery, north of the former Texaco refinery site, upstream of the confluence with Long Run Creek. For the purposes of performing an existing conditions hydrologic analysis, the I&M Canal tributary has been divided into eight (8) major tributaries, the former Texaco refinery drainage area, the diversion which feeds Deep Run Creek and the diversion at 13 th Street. A figure showing these tributary drainage areas is provided as Figure 7. The major tributaries are Big Run Creek, Fiddyment Creek, East Long Run Creek, West Long Run Creek, South Branch Long Run Creek, Milne Creek, Sub-basin 10 and Citgo Tributary. Deep Run Creek is located adjacent to the Chicago Sanitary and Ship Canal and receives most of its flow via a diversion from the I&M Canal upstream of the Big Run Surge Basin. The major tributaries were delineated from the USGS Hydrologic Atlas Mokena, Joliet, Sag Bridge and Romeoville Panels, as seen on the Off-Site Topography Exhibit presented on Figure 8A and B. The USGS Hydrologic Atlas Lockport has been printed in its entirety on Figure 9. The Atlas map shows floods of record from the 1947 and 1957 floods. 3.4 Basin Description The largest sub-basin within the watershed is the East Long Run Creek (21 mi 2 ) sub-basin that drains most of Homer Glen and parts of Orland Park, Palos Park, Lemont, and unincorporated Will and Cook Counties. Residential developments encompass sixty percent (60%) of the total drainage area, with agricultural farmlands, woodlands and commercial area making up the rest of the sub-basin. The hydrologic soils consist of 71% type B, 22% type C and 7% type D. The East Long Run Creek sub-basin drains to a USGS stream gage (USGS ), located near the intersection of State Street and Archer Avenue in Lemont. Long Run Creek continues to flow in a westerly direction, which drains the West Long Run Creek sub-basin. West Long Run drains 3.8 mi 2 of mostly unincorporated Cook & Will County and portions of Lemont. Forty-five percent of the drainage area is residential with the remainder being P:\Lplp\Documents\StormWater Reports\Final Stormwater Reports\Narrative - Final BFE_ docx 5

13 predominately woodlands, golf courses and floodplain. The hydrologic soils consist of 74% type B, 17% type C and 9% type D. Long Run Creek drains under the Illinois Central (I.C.) railroad. The south branch of Long Run Creek drains 1.3mi 2 of mostly residential land and type B hydrologic soils. The south branch also drains to the Canadian National/Illinois Central railroad, which then converges with the main branch of Long Run Creek, one mile south of E. Romeo Road (W. 135 th St.). Long Run Creek continues to drain west to its confluence with the I&M Canal, at the north end of the former Texaco Refinery. The Citgo tributary drains 2.2 mi 2 of mostly industrial area directly to the I&M Canal. The northernmost portion of the I&M Canal mainly acts as a series of interlocked detention ponds in smaller, more frequent storm events. In larger events, these small berms overtop and act as an open watercourse. To simplify this process, we analyzed this stretch of the I&M Canal using reach (channel) routing within the hydrologic model. South of the Citgo Refinery is a largely undeveloped tributary, identified in this report as Sub-basin 10, being 0.9 mi 2 in total drainage area. A large portion of this area is mapped as known floodplain and Army Corp of Engineers jurisdictional wetlands, west of the I.C. railroad. The hydrologic soils consist of 83% type B, 6% type C and 11% type D. Like the Citgo tributary, Sub-basin 10 drains directly to the I&M Canal and serves as open storage for backwaters from the I&M Canal as evidenced by the presence of significant wetlands. For the purpose of refining the input to the flood model, topographic 2-ft contours were acquired from Will County to provide additional information, as the 10-ft contours from the USGS mapping were inconclusive due to the relatively flat grades present in this area. Big Run Creek drains 2.4 mi 2, consisting of thirty percent (30%) residential development and thirtytwo percent (32%) agricultural farmland; the remainder is a mix of commercial developments and woodlands. The hydrologic soils consist of 87% type B, 6% type C and 7% type D, which drain west under the Canadian National/Illinois Central railroad. Big Run Creek then enters the former Texaco site at the eastern property line and is channelized to the discharge into the Big Run Surge Basin, previously known as Pelligrini Lake, which ultimately releases to the I&M Canal through a weir outlet structure. The Surge Basin currently provides the water supply for fire protection for Shell s crude oil tanks located at the decommissioned refinery. Fiddyment Creek drains 4.9 mi 2 of largely residential development (39%) and agricultural farmland (38%). The hydrologic soils consist of 59% type B, 33% type C and 8% type D that drain west under the Canadian National/Illinois Central railroad. Much like Big Run Creek, Fiddyment Creek enters the site from the east, where it is channelized directly to the I&M Canal. The Milne Creek watershed consists of 2.4 square miles of mostly urbanized tributary area. Runoff curve numbers vary across the six (6) subbasins from a low of 69 to a high of 82. Storm sewers govern the minor drainage system flow direction and tributary limits, directing flow to Milne Creek. Fiddyment Creek at railroad P:\Lplp\Documents\StormWater Reports\Final Stormwater Reports\Narrative - Final BFE_ docx 6

14 The existing stormwater runoff generated from the decommissioned Texaco refinery was also considered as it contributed 580 acres of potential runoff. Four prominent stormwater storage areas lie within the Chevron owned decommissioned refinery. The North Stormwater Pond releases over a weir into a point at the confluence of Long Run Creek and the I&M Canal. The North Stormwater Pond was designed and constructed in the early 1970s as a reservoir to supply fire suppression water to the North tank farm area of the refinery. The design of the North Stormwater Pond incorporated water quality treatment features, but has historically South Stormwater Pond outlet provided relatively little detention storage. North Gate Drainage Ditch and Little Run ultimately drain to a lift station, from which a battery of pumps lift the surface water into the North Stormwater Pond. As previously described, Big Run Surge Basin is located just upstream of the confluence of Big Run Creek with the I&M Canal. Big Run Creek discharges to the I&M Canal through the Surge Basin over a weir. The Surge Basin replaced the North Stormwater Pond as the reservoir that supplies water for fire suppression measures at the Shell Tank Farm. The South Stormwater Ponds are located in the southwestern portion of the Site along the eastern bank of Deep Run Creek. Water is routed to the South Stormwater Ponds through the South Stormwater Channel and the Santa Fe Lift Station. During periods of high flow, the South Stormwater Channel Lift Station can be used to augment the flow into the South Stormwater Pond. Shell Pipeline Company, LLC, (Shell) operates a Tank Farm on approximately 130 acres within the 580-ac former Texaco refinery site. Shell currently stores crude oil in sixteen aboveground tanks; the tanks are filled and emptied through pipeline. The sixteen tanks are located within containment berms (or cells ) to minimize any contamination if the tanks were to be breached. These containment berms are designed to accommodate the 25-year runoff event in addition to storing a catastrophic failure of the tank structure. Collected stormwater from these containment areas (the fourth detention area) releases into the stormwater drainage system of the refinery land at the discretion of the Tank Farm operators and is pumped via a lift station to the North Stormwater Pond. The old refinery drainage sub-basins were delineated using one (1) foot aerial topography, as seen on the Existing Conditions BFE Exhibits presented as Figures 13A and 13B. Survey data was collected via aerial topography circa 1993 and again in The runoff curve number (CN) losses were calculated using the SCS methodology. Times of concentration were computed using either the Clark Method for the streams and channels or the SCS method (TR-55) for the smaller tributaries. Stage-storage-discharge tables were generated for the North and South Stormwater Ponds using the aerial topography and detailed point shots provided by Trihydro Corporation. Through watershed analysis of the existing conditions, it was found that the refinery-site stormwater runoff is negligible as the timing of the peak is substantially different from the timing of the drainage peaks of Long Run Creek, the primary source of flooding. Deep Run Creek is unlike any of the other drainage basins, in that it receives its primary source of water from the I&M Canal from a lateral weir structure in the west bank of the I&M Canal. Deep Run Creek has a total sub-basin drainage area of 268 acres, but generates a peak flow of 1705 cfs P:\Lplp\Documents\StormWater Reports\Final Stormwater Reports\Narrative - Final BFE_ docx 7
15 at the diversion from the I&M Canal, during the 100-year, 48-hour storm. This elevated flow rate is due to the lateral diversion from the I&M Canal. The originally designed Deep Run Creek flow rate was an estimated 5000 cfs, based on information from the original Deep Run channel improvements. Further details of Deep Run Creek may be found in the hydraulic section of this report and in Appendix G. 3.5 Rainfall The Lockport Development Code specifies a rainfall table based on information contained in ISWS Bulletin 70 (Huff and Angel, 1989). Figure 14A and 14B provide isohyetal precipitation distributions for the six-county area surrounding Chicago. These distributions are for 24-hour durations for the 1-, 2-, 5-, 10-, 25-, 50- and 100-year frequencies. The flow ratios which were used to determine precipitation values for storm events other than the 24-hour duration events are provided on Table 18. The table was extrapolated for the 120-hour and 240-hour storm by using Appendix A precipitation values for these longer durations for Northeastern Illinois and dividing by the Northeastern Illinois 24-hour precipitation value. This yields ratios of 1.31 and 1.47 for the 120- hour and 240-hour storms respectively. Figure 14A and B isohyetal maps were digitized and overlaid on the sub-basin areas. Results of this analysis can be found in Figures 14C - D. The 4.75-inch contour of the 10%, 24-hour event bisected the Chevron site. Since the 4.5-inch and 5- inch contours were not in close proximity all the sub-basins used this precipitation value for the 10%, 24-hour event. The 2% (50-year), 24-hour storm showed more variation. To calculate the incremental precipitation values an average distance between the isohyetal lines was determined. The isohyetal lines were then offset to determine intermediate values. The sub-basins used the average value based on the incremental lines rounding to the nearest 0.05-inches. A similar method was used for the 1% (100-year) event. For the 0.2% (500-year) event a value of inches for the 24-hour storm was used for all basins as recommended by ISWS in the June 15, 1999 letter from ISWS (Table 3.5.6). Table summarizes these findings. Due to the size of the total drainage basin (40.2 mi 2 ), areal reduction was implemented in order to more accurately model the theoretical precipitation events. ISWS Bulletin 70 - Table 35 (Table in this report), depicts Huff s relationships between the frequency distribution of point and areal mean rainfall in areas ranging from 10 to 400 square miles (Huff and Angel, 1989). A conservative value derived from the 25 mi 2 data table was utilized to generate the final 100-year rainfall data. A critical duration storm analysis using the theoretical quartile storm distributions presented in ISWS Bulletin 70 was evaluated. The 1 st -Quartile was used for storms of durations up to 6-hours. The 2 nd -Quartile was used for the 12-hour duration and, for the 18- and 24-hour durations, the 3 rd - Quartile was used. For storm events longer than 24 hours the 4 th -Quartile distribution was utilized. This conforms to standard engineering practice for Northeastern Illinois. 3.6 Loss Coefficients Loss method procedures were performed using the SCS (now NRCS) method as presented in Urban Hydrology for Small Watersheds (Technical Release 55), June ArcGIS 9 was used to calculate CN values, the hydrologic soil group shapefiles were downloaded from the NRCS website and a land use shapefile was created by digitizing land uses from circa 2009 aerial map. These layers were intersected with the sub basin boundaries to create CNs automatically for each subbasin. A database was created to sum the areas of each distinct land use/soil combination and weighted CN values were calculated. The CN summary is included in table P:\Lplp\Documents\StormWater Reports\Final Stormwater Reports\Narrative - Final BFE_ docx 8
16 The time of concentration and storage coefficients were initially generated using the Clark Unit hydrograph method, as described in Graf s 1982 report, A Technique for Estimating Time of Concentration and Storage Coefficient Values for Illinois Streams: and revised by calibration analysis as appropriate. The TR-55 time of concentration method was used for sub-basins with developed land and sheet flow conditions, which is standard practice for this region, while the Clark methodology is popular and appropriate for larger stream and channel systems. 3.7 Hydrologic Calibration The runoff losses for East Long Run Creek and Big Run Creek were calibrated using the September 1992 storm event as a base. Fiddyment Creek, the I&M Canal and Deep Run Creek used the September 2008 storm event. In calibrating, rainfall data were utilized from the following gages: Sawmill Creek rain gage (USGS ) 5 minute record Gages 14, 15, 16 and 19 gages (Cook County Precipitation Network) daily record Stella and St. Charles gages (Illinois Climate Network Data) daily record East Branch DuPage River at Bolingbrook (USGS ) daily record The Sawmill Creek gage was the only gage that provided other than daily total rainfall for events earlier than The Sawmill gage distribution curve was used to develop the 1992 rain gage distributions. This was based on the ratio of the daily value compared to the Sawmill Creek gage daily value. This provided suitable time intervals for calibration purposes for the 1992 storm. Using GIS, Thiessen polygons were created based on the daily gage values. The Thiessen polygons were overlaid on the sub-basins and weighted average daily precipitation was created based on area. Each sub-basin either utilized a created gage in HEC-HMS based on the weighted average and Sawmill Creek distribution, or the actual gage data with the Sawmill distribution if it was completely within a Theissen polygon. Nexrad radar information was utilized for the 2008 storm event. Using GIS the tributary sub-basins were overlaid with the Nexrad radar distributions. This generated individual gage data for each sub-basin including daily values and distributions. Radar precipitation was referenced to actual gage data to account for discrepancies between the radar and gage information. This was done using statistical analysis. This method computes a ratio adjustment of radar to gage, then multiplies all rainfall amounts by that ratio. After adjustment, the Nexrad precipitation for Gages 15 and 16 were within 3% and 1.5% respectively of the measured gage rainfall. Sawmill Creek was within 19% of the gage data. We believe that the proximity of the Sawmill Creek gage to the Nexrad radar station created this larger difference due to the limitations of radar accurately collecting cloud data in very close proximity to the station. For hydraulic calibration USGS stream gage Long Run Creek was used for all evaluated storm events. Sub-basin East Long Run Creek ends at the stream gage and was therefore selected for lumped parameter calibration. Using HEC-HMS s optimization functions the Clark Storage coefficient (R), time of concentration (Tc), Runoff Curve Number (CN), initial abstraction and recession constant were evaluated. The optimization function used was the Peak Weighted- RMS factor, which balances both peak flows and runoff volume by minimizing the error of both parameters. The model appeared to be most sensitive to CN, followed by R, Tc and initial abstraction. The recession constant had little impact to peak flows or computed runoff. Initial calculations for East Long Run Creek were CN 73, R 9.13, Tc 4.5 hours, initial abstraction was left to HEC-HMS to compute based on CN and the recession constant was set at 0.8. Reductions to the CN resulted in significantly increasing errors in runoff volume (under computing) P:\Lplp\Documents\StormWater Reports\Final Stormwater Reports\Narrative - Final BFE_ docx 9
17 and steepened the falling leg of the hydrograph. After several optimization attempts the CN was preserved at 73. The Clark Storage Coefficient, R had a significant effect on both the shape of the hydrograph and the peak flow rate, but little impact on runoff volume. This subbasin has significant depressional areas and detention. Therefore increasing the R factor to 22.0 is reasonable as an alternative to attempting a more complex detention basin analysis of the entire watershed. This resulted in the best match of peak volumes and peak flows. The hydrograph peak was several hours different than the stream gage. Increasing time of concentration to 6.4 hours shifted the peak to coincide with the gage peak. This had a small impact on the peak volume and flow, but was compensated by slight changes to the R factor, which is already reflected above. HEC-HMS was allowed to compute initial abstractions for all subbasins on the initial runs (the default value). Computed peak flows reached 709 cfs compared to a gage flow of 707 cfs for the 1992 event. Volumes were 1.39 inches of excess runoff versus 1.38 inches from the gage (1992). Calibration of the 1992 event resulted in a 0.95% difference in runoff volume and a 0.29% difference in peak flow. The shape of the hydrograph was virtually identical to the stream gage. A similar methodology was used for the more complex 2008 storm. The 1992 parameters were used as the initial condition for the 2008 storm. After optimization CN preserved at 73, but the impervious percentage was increased to 23%, which is equal to a CN of 83. The storage coefficient, time of concentration, initial abstraction and recession constant remain unchanged. Sixteen years of additional development within this sub-basin justifies the increased imperviousness. The 2008 event did not calibrate as well as the single peak 1992 event. Partly this is due to the 2008 event being a multiple peak storm as well as development in the watershed adding to the complexity of the sub-basin. However, perhaps more importantly, the volume of the storm was preserved. This will result in a more accurate flood plain elevation downstream through the I&M Canal compared to calibration to the peak flow with under-reported volume. This is especially true for longer duration storms. Computed peak flows were 917 cfs versus a gage value of 1220 cfs, a difference of 24.8%. However, the volume of discharge runoff of 4.05 inches matches exactly with the gage data volume. The July 1996 event was also analyzed. No survey data along the I&M Canal or the tributaries were available, therefore only the hydrology was calibrated. This storm event was a single peak event similar to the 1992 event, but of a significantly greater magnitude. Observed peak flows at the Long Run Stream gage reached 5310 cfs. Precipitation at the Sawmill gage reached inches in 24 hours. Gage 15 in Cook County reported inches over the same time period. This exceeds the 100-year, 24-hour rainfall of 8.34 inches for this area, not including aerial reduction. Calibration resulted in a reduction of the runoff CN to a value of 61. Time of concentration was modified to 4.5 hours and the Storage Coefficient calibrated to 7.0. This produced a peak flow of 5276 cfs with 5.86 inches of runoff compared to the 5.93 inches reported at this station. Peak flows calibrated to 0.6% to observed flows and runoff volumes were within 1.7% of observed. The comparison can be seen in the Figure below. The results of the calibration lead to questions on what the runoff CN should be for the tributary, which showed a variation from 61 to 83. Additional storm events were evaluated to determine the measured runoff volume in comparison to the precipitation. Seven additional storms were incorporated into the analysis, which were the storms of July 1990, November 1990, February 1997, July 2003, August 2004, August 2007 and December Only the runoff volumes were computed for these events to determine the corresponding CN values. The time of concentration, storage coefficients and peak flows were not computed. The winter storms (November through February) resulted in runoff CNs from 84 to 91. These storms were obviously influenced by frozen ground or melting snow and were discarded as unrealistic. The July 2003 storm also was P:\Lplp\Documents\StormWater Reports\Final Stormwater Reports\Narrative - Final BFE_ docx 10
18 discarded as the computed CN was 105, which is theoretically impossible. The remaining events produced CNs between 73 and 75, which match very well with the 1992 event. Therefore, the CN was fixed at 73. The result of this calibration may be seen in graphical form below and in Figures 16, 17 and 18, as well as the detailed calibration data found in Table of this report. Comparing modeled values to measured values and anecdotal evidence from the July 1996, September 1992, and September 2008 storms validated this calibration. Using the same calibrated runoff loss coefficients and assuming uniform rainfall, the 2008 storm was modeled; the graphical results are presented in Figure 3.2 below. Discrepancies between the modeled and measured discharges may be explained by limitations of lumped parameter modeling, lack of additional detail of the intricacies of the significant upstream watershed and the low density of precipitation and stream gages. However, these results were achieved through a process that exceeds standard engineering practices that typically calibrate only peak flow rates and ignore the runoff volume and the shape of the hydrograph Flow(cfs) :00 00:00 12:00 00:00 12:00 00:00 09Sep Sep Sep1992 EASTLONGRUNCREEKRUN: FLOW ELONGRUNCREEK-1992RUN:1992_CALIBRATIONFLOW Figure: 1992 Gage vs. Computed As can be seen in the 2008 hydrograph below the multiple peaks do appear in the HEC-HMS calculated hydrograph, but not to the magnitude witnessed in the observed data. Observing the incremental precipitation, a single strong peak occurs just as the Archer Avenue gage begins discharging storm flows. As the storm progresses several minor precipitation peaks are evident. During the calibration efforts to match peak flow rates the HEC-HMS model peak occurred sooner and less steeply than the gage. The possibility that the gage was clogged with debris or was experiencing a mechanical problem could explain the sudden spike in discharge. Further evidence of this anomaly is in the timing of the peak, as it preceded the observed peak by several hours. Attempts to lengthen the time of concentration caused warping of the hydrograph shape and further deviations from the observed gage hydrograph. Additional runoff volume by altering the P:\Lplp\Documents\StormWater Reports\Final Stormwater Reports\Narrative - Final BFE_ docx 11
19 imperviousness or CN resulted in a significant increase in flow rates during the earlier parts of the storm with a substantial increase in observed runoff volume. 1,400 1,200 1, Flow(cfs) Sep2008 ELONGRUNCREEK-1992RUN:2008_CALIBRATIONFLOW ELONGRUNCREEK-2008OPT:2008CALIBRATIONF&VFLOW-OBSERVED Figure: 2008 Gage vs. Computed Precip (in) Sep2008 ELONGRUNCREEK-2008OPT:2008CALIBRATIONF&VPRECIP-INC Figure: 2008 Nexrad Incremental Precipitation P:\Lplp\Documents\StormWater Reports\Final Stormwater Reports\Narrative - Final BFE_ docx 12
20 Surveyed high water marks were identified and collected after the September 2008 storm event. In nearly all cases the calibrated water surface elevations were greater than measured high water elevations, providing a conservative model of this complex system. This calibration is further described in the hydraulic calibration section of this report. Other events including the July 1996 event were considered. However, the information provided by these events could not be reliably calibrated due to the lack of survey data or high water marks at the site. The magnitude of the July 1996 storm creates several problems. Some of the precipitation gages in the area inaccurately reported rainfall, debris blocked one of the bridges of the I&M Canal and electrical problems caused pump failure at the site. Additionally, the Archer Avenue stream gage reported a significantly different flow than the other events, which is likely due to the lack of reservoir routing in this complex upstream system. Additionally, this event significantly exceeded the 500-year storm event and therefore, the calibration efforts for 1996 were only an internal check and not of sufficient accuracy or reliability for inclusion in this report. In the Figure below note the calculated peak of nearly 2000 cfs that precedes the main peak by nearly 12 hours. This accounts for much of the discrepancy between the runoff volumes. This further emphasizes the existence of significant upstream depressional area in the watershed which was not included in this analysis. The provides strong evidence that the hydrologic modeling methodology is conservative and appropriate. 6,000 5,000 4,000 Flow(cfs) 3,000 2,000 1, Jul1996 ELONGRUNCREEK-1996RUN:1996_CALIBRATIONFLOW ELONGRUNCREEK-1996RUN:1996_CALIBRATIONFLOW-OBSERVED Figure: 1996 Nexrad Incremental Precipitation Several variables were utilized from the original ISWS hydrologic analysis, which include reach routing lengths and base flows from the various major tributaries. This information, along with the drainage areas and loss coefficients as previously described, were compiled and input into USACE HEC-HMS Version 3.5 modeling program, to generate hydrographs to be input into the hydraulic modeling. P:\Lplp\Documents\StormWater Reports\Final Stormwater Reports\Narrative - Final BFE_ docx 13

21 3.8 Existing Conditions Hydraulic Analysis The six waterways draining through the watershed were analyzed using the USACOE E HEC HEC-RAS Version modeling program. These waterways are the I&M Canal, Deep Run Creek, Big Run Creek Creek, Fiddyment Creek and the 13th Avenue Overflow.. The waterways were analyzed using a single model for each waterway, and unsteady flow analysis to accurately portray the interactions between the various waterways. The inflow hydrographs for the model were read from the hy hydrologic analysis of the watersheds through the DSS functionality of the USACOE E programs. Minimum flows for the waterways were set to insure nsure stability in the unsteady flow models at Upstream of Texaco Dam the beginning and end of the runs, which is standard engineering practice required for unsteady modeling. Interpolated cross cross-sections sections were also added to increase the stability of the models and are also considered to be a standard unsteady modeling procedure. Downstream starting water surface boundary conditions used normal depth d for most of the reaches by taking the slope of the last two cross sections. Fiddyment Creek was the only exception as this tributary steeply drops inches inches or more into the I&M Canal. Normal depth was set at a 5% slope. Output for each of these fifive models is provided in Appendix B,, while the 10%, 2%, 1% and 0.2% critical storm results can be found in Tables through I&M Canal Cross Cross-sections sections from the ISWS 1994 study of the I&M Canal were used for the I& I&M M Canal model. The input file reprinted in the ISWS study was used to recreate the HEC HEC-2 2 model. The geometry from the HEC HEC-2 2 model was then imported into the HEC-RAS HEC model. These cross cross-sections sections were supplemented by survey of additional structures along sseveral everal of the waterways on the Texaco site performed in 1993 and 2009 that were provided by Trihydro Corporation. This survey data was used to input structures crossing the C Canal into the model. Other structures downstream of the Chevron property were co collected llected at IL Route 7 downstream to Division Street by Manhard Consulting, Ltd in The structures that were included in the model were the Texaco dam, located between Fiddyment Creek and the Big Run Surge Basin, and the Deep Run lateral diversion wei weirr that is located north of the Big Run Surge Basin. A recreational bike path along the I&M Canal corridor has been installed since the 1993 aerial topography, effectively raising the western bank of the I&M Canal north of the bridge between cross sections 34 and 35. North of the Deep Run diversion flood stages will overtop portions of the bike path and divert more flow to Deep Run.. To simulate this additional overflow a lateral structure was added to the model upstream of cross section 40. This lateral structure tructure diverts flow and volume out of the I&M Canal. DSS-Vue Vue, version 2.0, was utilized to combine the overflow hydrographs from the Deep Run diversion weir and the bike path overflow. This combined hydrograph was the upstream input for the HEC HEC-RAS unsteady model. Additional modifications to the I&M Canal cross sections were warranted as channel sediment removal has been completed. Pedestrian Bridge near Milne Creek Profile drawings from the Division on of Waterways (now IDNR IDNR- P:\Lplp\Documents\StormWater Reports\Final Final Stormwater Reports Reports\Narrative - Final BFE_ docx 14

22 OWR) circa 1950 were referenced to determine the channel bedrock elevations. The channel cross sections were extended down to these elevations to simulate the cleaned Canal. Cleaning activities occurred after the September 2008 event and do not affect calibration efforts. Downstream of the Chevron property the Canal sections were input based on survey data from IDNR-OWR. This survey work was completed in As this area is downstream of the Texaco Dam sedimentation was significantly less than upstream of the dam. Channel cleaning modifications were taken into account downstream of the Chevron property limits to the confluence with Milne Creek. The IL-7 bridge, two pedestrian bridges and the Division Street bridge were included in the I&M Canal modeling. The upstream pedestrian bridge is located at cross section 18.3, the IL-7 bridge crosses the Canal at section 15.8, the next pedestrian bridge location is at section 14.7 and Division Street is section Three 48-inch concrete pipes divert flow to Deep Run Creek at section This is commonly referred to as the 13th Avenue Diversion Fiddyment Creek Cross-sections for the Fiddyment Creek model consisted of survey cross section data and electronic data generated from HEC-GeoRAS. There was also an existing FEMA model of Fiddyment Creek that extended through the Chevron Site. This model was created using WSP2 in the 1970s. A raster image file of the input data on microfiche was obtained from FEMA; a copy is provided for review in Appendix E. This data was used to recreate the WSP2 cross sections. However, the available data is of poor quality and, for the most part, illegible. Further inquiries with ISWS and FEMA did not prove fruitful and this is the best available information. The model was then integrated with the updated onsite geometry using GeoRAS. The FEMA Fiddyment Creek within the Site model was truncated upstream of the Chevron site, approximately 700 feet, ending just downstream of Archer Avenue. This corresponds with labeled FEMA cross-section E. This was done due to severe model instabilities that were occurring in areas upstream of the Site that could not reasonably be remedied and did not impact this study. It is assumed that steep channel slopes, culverts and questionable data quality caused this condition; and, since no water surface impacts could be attributed to the upstream watershed due to the excessive grade change, truncation is an acceptable practice. Survey was also used to add further detail to the Fiddyment Creek portion of the model. Survey data was used to supplement the GeoRAS cross sections to accurately model the bottom of Fiddyment. Finally, survey data of the Fiddyment bridges was input into the HEC-RAS geometry module. Data for the FEMA model can be found in Appendix E. P:\Lplp\Documents\StormWater Reports\Final Stormwater Reports\Narrative - Final BFE_ docx 15


23 3.8.3 Big Run and Deep Run Creeks GeoRAS was also used to create the cross-sections for the Big Run and Deep Run models, supplemental survey cross section information was provided by Chevron. Information from the Chevron Site survey was used to add the structures along Big Run Creek and Deep Run Creek into the model. Deep Run Creek consisted of channel survey data extending downstream to Division Street, which was provided by Chevron. Additional survey data downstream of the Lockport Waste Water Treatment Plant was collected by Manhard. The City of Lockport 2-ft topography was used to supplement the overbank areas for this reach. Measured high water marks along the Big Run Creek Deep Run Creek at South Stormwater Pond channel compared favorably with modeled values. Deep Run Creek could not be compared to the 2008 model run in that the culverts failed along the Sanitary and Ship Canal access and were replaced with box culverts. Chevron also performed channel cleaning along Deep Run Creek to Division Street, even providing shoreline protection with rip rap material. The Deep Run Creek geometry and survey data reflects these improvements. See Figures 21C through G for details Long Run Creek The Long Run Creek confluence with the I&M Canal is located just north of the North Stormwater Pond on the Chevron property. The area north of the North Stormwater Pond contain a high density of wetland areas and a secondary overflow channel to the I&M Canal. Bedrock is near the ground surface in this area with several wide shallow depressional areas. Due to the added complexity of hydraulics of this location, Long Run Creek was not evaluated in HEC-RAS. There are two sets of culvert crossings for the access roads along the northern property. The northern culvert bank is comprised of 2 8-ft x 3-ft culverts. The southern culvert bank, just upstream of the North Stormwater Pond discharge, is comprised of 2 8-ft x 4-ft culverts. In addition to these drainage structures, a bypass channel 575 feet north of the main confluence allows for Long Run Creek to have a second confluence with the I&M Canal during high flow events. The two culverts and the bypass channel were evaluated in CulvertMaster v3.2 by Bentley Systems. The Deep Run Creek Diversion culverts were evaluated to determine which was most restrictive using tailwater elevation of from the I&M Canal. The bypass channel was evaluated as a roadway overtopping weir using cross section data from the 2009 topography. This analysis produced base flood elevations during the 100-year event of upstream of the north-south service road culvert, near the North Stormwater Pond outfall, and upstream of the culvert under the east-west service road. This analysis is suitable for an approximate Zone A study for the northern portion of the property. P:\Lplp\Documents\StormWater Reports\Final Stormwater Reports\Narrative - Final BFE_ docx 16
24 3.9 Hydraulic Calibration During the storm event of September 1992, high water marks (HWM) were taken at various locations throughout the Texaco site. An exhibit showing the location and elevation of these high water marks is provided in Figure 19. Together with the rainfall data from the storm event these high water marks were used to calibrate the hydraulic modeling. Reductions to parameters within the HEC-RAS modeling included Manning s n-values, and expansion and contraction coefficients, which lowered or raised the maximum water surface elevation to more closely match the measured HWMs. These HWMs were collected at Big Run Creek and the Stormwater Ponds and match very closely to surveyed values. For example, calculated portions of Big Run Creek are within 0.05-ft of measured values at cross section 73. Since the 1992 storm Big Run Creek has been cleaned and excess vegetation removed, this change would account for the 1.29-ft difference at cross section 174 and the 0.77-ft difference at section The model converges back to observed values by section 2250, where the difference is 0.28-ft. Another large storm event occurred during September of After this storm event the I&M Canal, Fiddyment Creek and Deep Run Creek were inspected and high water lines at critical locations were marked. The locations of particular interest were directly upstream and downstream of the Texaco dam, at the overflow of the four culverts conveying flow through Deep Run Creek, and directly south of the South Stormwater Ponds outflow along Deep Run Creek. These high water marks along with the storm calibration described above were implemented in the hydraulic calibration of the modeling for the I&M Canal. As the culverts along Deep Run Creek were replaced due to imminent failure, calibration could not be verified along this reach. The high water marks downstream and upstream of the Texaco Dam were of particular interest to the calibration efforts, because the model indicated a higher variance between the upstream and downstream water surfaces. The dam structure in the model was modified to better reflect the current condition of the dam, which included leakage through the wooden sluice gates of the dam. The dam was modeled to have its gates always slightly open to allow a small amount water to flow through the dam, even when water was not overtopping the dam. This assumption is supported by anecdotal evidence that leakage at the dam was occurring. Water surface elevations calibrated significantly better with this adjustment. A comparison of the high water marks from the 2008 storm event with those in the model for the same storm along Deep Run Creek was performed. The model was not diverting enough flow to Deep Run Creek. Upon further investigation the diversion structure was modified based on survey data which increased the diverted flow to Deep Run, resulting in higher water surface elevations along Deep Run and slightly lower elevations along the I&M Canal upstream of the Texaco Dam. These modeled results were closer to the surveyed values. Final calibration efforts resulted in calculated peak water surface elevations that were higher than surveyed high water levels for the 2008 event. Elevations were within 0.4-ft upstream of the dam and through the 2nd Street Bridge, which are within the limits of standard engineering practice for floodplain modeling. Downstream of the dam water surfaces were 1.8-ft higher than observed and 1.3-ft higher at section 26. These water surface elevations matched much closer when flow from Fiddyment Creek was removed from the model. Therefore, the model is experiencing artificially high water surface elevations due to flow combining from Fiddyment Creek and the I&M Canal that may not be accurate. However, this is a conservative estimate that could not be remedied within standard engineering calibration procedures. The primary calibration parameter was the Manning s n-value. N-values in the I&M Canal were between and Big Run n-values varied from near the surge basin, to 0.03 in the middle segments and to the east of P:\Lplp\Documents\StormWater Reports\Final Stormwater Reports\Narrative - Final BFE_ docx 17
25 the site. Fiddyment Creek n-values ranged from through the trapezoidal sections, up to to the east of the site. Chevron had cleaned and dressed Deep Run Creek from the new culvert installation at the Sanitary and Ship Canal access downstream to Division Street. N-values were for the cleaned channel and upstream of the box culverts. With this calibration the critical storm analysis provides a conservative, but accurate, evaluation of the BFE of the I&M Canal and its tributary waterways. The 2008 storm was used to calibrate the Fiddyment Creek existing condition model. There has been significant remediation performed on Fiddyment Creek within the recent years by Chevron. The existing channel has been cleaned of significant woody vegetation, widened and the slopes flattened. The focus of the modeling effort was to determine the BFE throughout the Chevron site as it is today. Cross-sections were surveyed by Ruettiger, Tonelli & Associates, scenarios were created in the model using the 2008 flow rates and I&M Canal data was created to verify that the maximum Water Surface Elevation (WSEL) from the model matched the September 2008 storm high water marks. This was used to check that the existing condition runoff input for the Fiddyment Creek Basin was reasonable. Fiddyment Creek post remediation measured high water marks were lower than the modeled values. Initially, the WSEL calculated for Big Run Creek was also significantly lower than the observed HWL. This was corrected by using the stage hydrograph from the I&M Canal Section 36 as the downstream boundary condition. After this adjustment, the calculated WSEL was just 0.05-ft above the observed HWL. Calibration Summary Table* WATERWAY (2008) I&M CANAL (2008) I&M CANAL (2008) I&M CANAL (2008) I&M CANAL (1992) BIG RUN (1992) BIG RUN (1992) BIG RUN (1992) BIG RUN (1992) BIG RUN (2008) FIDDYMENT (2008) FIDDYMENT (2008) FIDDYMENT (2008) FIDDYMENT (2008) FIDDYMENT 2008 ASSOCIATED OBSERVED MODELED STREAM IDENTIFIER CROSSDIFFERENCE HWL HWL GAGE SECTION MODEL / / / / *Cross Sections are located on Figures 13A and 13B P:\Lplp\Documents\StormWater Reports\Final Stormwater Reports\Narrative - Final BFE_ docx 18

26 4. Results The modeling results in a conservative estimate of the BFE with the majority of the calculated water surface elevations above the measured high water marks exceeding standard engineering practice accuracy in most locations. The modeling results for the September 2008 storm were generally within 0.5-ft of the observed HWL s in key locations. Backwater affects from the I&M Canal were accounted for by projecting the maximum water surface elevation of the I&M Canal at each confluence along Big Run and Fiddyment Creeks until the BFE of the I&M Canal matched the BFE of the tributary. This is a standard floodplain mapping procedure consistent with FEMA guidelines. The guidelines for this mapping procedure can be found on FEMA website within the publication Guidelines and Specifications for Flood Hazard Mapping Partners (FEMA, 2003). The critical duration analysis indicated that the 48-hour storm generated the highest average peak flood stages on the I&M Canal, Deep Run Creek and the 13th Avenue Overflow. Fiddyment Creek and Big Run Creek peak water levels were achieved during the 18-hour duration. 5. Modifications 5.1 Deep Run Creek The Deep Run Creek culverts have been replaced due to failure. This emergency replacement maintains the access road crossing the creek that provides ingress and egress to the dock area along the Chicago Sanitary and Ship Canal. The culverts at the road crossing failed during recent channel sediment dredging and removal activities and have been replaced with four 10-ft x 4-ft box culverts. This was necessary to preserve access to the Chicago Sanitary and Ship Canal dock. These culverts were sized such that the road crossing will be raised to an elevation that would not be overtopped during a storm event up to the 50-year critical storm. Deep Run Creek crossing to Sanitary & Ship Canal Stormwater storage has been created east of Deep Run Creek between the access road and the South Stormwater Channel as part of Chevron s site remediation process. This area will be preserved for future stormwater management. Downstream of the road crossing accumulated sediments have been removed to bedrock and the channel has been restored and cleaned downstream to Division Street. The historic bridge upstream of IL-7 catastrophically failed during a June 2011 event. This bridge collapse has been cleaned up and this bridge has not been included in the HEC-RAS model. 5.2 Fiddyment Creek Fiddyment Creek was remediated as part of Chevron s ongoing corrective action activities, as required by an EPA RCRA Permit. During this remediation the channel was widened and the slopes regraded. Site visits show that Fiddyment Creek appears stable, with a bedrock bottom, mild channel slopes and adequate, but not excessive, vegetation. The trapezoidal channel of Fiddyment Creek easily contains the base flood within its banks. P:\Lplp\Documents\StormWater Reports\Final Stormwater Reports\Narrative - Final BFE_ docx 19

27 5.3 I&M Canal Part of Chevron s environmental cleanup effort included dredging the I&M Canal in 2008 from their northern property line to the confluence with Milne Creek. Dredging was performed to bedrock. The dredged material was disposed of by Chevron outside of the floodplain limits. How this was incorporated into the modeling has been discussed above. Downstream of the Milne Creek confluence a pedestrian bridge has been installed since the ISWS study. This bridge has been added to the HEC-RAS model. Also, the original wood deck of the pedestrian bridge downstream of IL-7 has been replaced with a concrete deck and new railing for safety. The low chord of the bridge has not changed, but this bridge has been surveyed and input into the model. 5.4 Big Run Creek Big Run Creek has been cleaned and maintained on a periodic basis. The culverts have been assumed clean and free of debris as part of this analysis. Several of these crossings are in a poor state of repair and are anticipated to be replaced in the future. 5.5 Milne Creek The City of Lockport has reported that the Illinois Department of Transportation intends to rehabilitate or replace the culvert system near the confluence with the I&M Canal. What impacts, if any, on the hydrology are unknown at this time. Big Run Creek debris line after Sept Conclusion This report presents the most up to date floodplain analysis for Deep Run Creek and the I&M Canal from the confluence with Long Run Creek south of Division Street. This includes the flow diversions from the I&M Canal to Deep Run that have been implemented to reduce flooding along the I&M Canal. The information presented in this report meets the requirements for Will County, the City of Lockport and the Illinois Department of Natural Resources Office of Water Resources for determining the base flood elevations for flood prone areas for the I&M Canal, Deep Run Creek, Long Run Creek, Big Run Creek and Fiddyment Creek. P:\Lplp\Documents\StormWater Reports\Final Stormwater Reports\Narrative - Final BFE_ docx 20
28 References Angel, J.R., June 15, 1999, Memo: 500-year Rainfall in NE Illinois, Illinois State Water Survey, Champaign, IL Cronshey, R., McCuen, R.H., Miller, N., Rawls, W. and Robins, S., June 1986, Urban Hydrology for Small Watersheds: Technical Release 55, Natural Resources Conservation Service, Conservation Engineering Division, Washington, DC Demissie, M., and Akanbi, A.A., December 1994, Hydrologic and Hydraulic Analyses of the Illinois and Michigan Canal at Lockport, Illinois: Contact Report 576, Illinois State Water Survey, Hydrology Division, Champaign, IL Federal Emergency Management Agency, January 2003, Guidelines and Specifications for Flood Hazard Mapping Partners, Graf, J.B., Graklavs and G., Oberg, K.A., March 1982, A Technique for Estimating Time of Concentration and Storage Coefficient Values for Illinois Streams: Water Resources Investigations 82-22, U.S. Geological Survey, Water Resources Division, Urbana, IL Holmes, R.R. and Kupka, A.L., 1997, Floods of July 18-20, 1996, in Northern Illinois: Report , U.S. Geological Survey, Urbana, IL Huff, F.A., and Angel, J.R., 1989, Frequency Distributions and Hydroclimatic Characteristics of Heavy Rainstorms in Illinois: Bulletin 70, Illinois State Water Survey, Champaign, IL Huff, F.A., and Angel, J.R., 1989b, Frequency Distributions of Heavy Rainstorms in Illinois. Circular 172. Illinois State Water Survey, Champaign, IL Huff, F.A., and Angel, J.R., 1992, Rainfall frequency atlas of the Midwest: Bulletin 71, Illinois State Water Survey, Champaign, IL Huff, Floyd A., Time Distributions of Heavy Rainstorms in Illinois. Circular 173. Illinois State Water Survey, Champaign, IL Singh, K.P. and Ramamurthy, G.S., January 1993, 7-Day, 10-Year Low Flows of Streams in Northeastern Illinois: Contact Report 545, Illinois State Water Survey, Champaign, IL Uchtmann, D.L. and Gehris, B., December 1997, Illinois Drainage Law, College of Agricultural, Consumer and Environmental Sciences, University of Illinois at Urbana-Champaign US Army Corps of Engineers, HEC-HMS Hydrologic Modeling System User s Manual, Version 3.3. Hydrologic Engineering Center, Davis, CA. US Army Corps of Engineers, HEC-RAS River Analysis System User s Manual, Version Hydrologic Engineering Center, Davis, CA. 21
29 6-Apr-11 Sub-Basin CHEVRON REFINERY LOCKPORT, ILLINOIS SUB-BASIN SUMMARY TABLE Area (Ac) CN x Area (Ac) Area (mi 2 ) CN Tc (hr) Lag (min) Stor. Coe. (hr) Base Flow Big Run ** ** Citgo Tributary ** ** Deep Run Trib Deep Run Trib Deep Run Trib Deep Run Trib East Long Run Creek * * Fiddyment Creek ** ** I & M Canal I & M Canal I & M Canal I & M Trib Little Run Creek North Gate Creek North Pond Lift Station Ditch North Pond Trib North Stormwater Pond Big Run Surge Basin South Branch Long Run Creek ** ** South Stormwater Pond Sub-Basin ** ** Sub-Basin Sub-Basin West Long Run Creek ** ** * Tc and Storage Coefficient determined by calibration ** Tc values multiplied by Storage Coefficients multiplied by 2.41 based on calibration results.
30 1-May-12 Sub-Basin LOCKPORT BFE EXTENSION LOCKPORT, ILLINOIS SUB-BASIN SUMMARY TABLE 3.3.1a Area (Ac) CN x Area (Ac) Area (mi 2 ) CN Tc (hr) Lag (min) Stor. Coe. (hr) Base Flow Deep Run ** ** Deep Run ** ** Deep Run Deep Run I&M Canal I&M Canal I&M Canal * * I&M Canal ** ** Milne Milne Milne Milne Milne Trib Milne Trib * Tc and Storage Coefficient determined by calibration ** Tc values multiplied by Storage Coefficients multiplied by 2.41 based on calibration results.
31 CHEVRON REFINERY SUB BASINS LAND USE SUMMARY TABLE CHEVRON REFINERY SUB BASINS SOIL GROUPS SUMMARY (Ac) (Ac) Sub-basins - Land Use Area Sum Perc. Sub-basins - Hydrologic Soil Groups Area Sum Perc. Big Run - Brush-Fair % Big Run - B % Big Run - Commercial % Big Run - C % Big Run - Industrial % Big Run - D % Big Run - Residential-1 ac lots % Big Run - Residential-2 ac lots % Big Run - Residential-Quarter ac lots % Big Run - Roads-Paved w Ditch % Big Run - Row Crop-Straight Row-Good % Big Run - Woods-Grass Combo-Good % Citgo Tributary - Brush-Fair % Citgo Tributary - B % Citgo Tributary - Industrial % Citgo Tributary - C % Citgo Tributary - Open Space-Good % Citgo Tributary - D % Citgo Tributary - Residential-1 ac lots % Citgo Tributary - Residential-Quarter ac lots % Citgo Tributary - Roads-Paved w Ditch % Citgo Tributary - Row Crop-Straight Row-Good % Citgo Tributary - Water % Citgo Tributary - Woods % Citgo Tributary - Woods-Grass Combo-Good % Deep Run Creek 81 - Brush-Fair % Deep Run Creek 81 - B % Deep Run Creek 81 - Industrial % Deep Run Creek 81 - D % Deep Run Creek 82 - Brush-Fair % Deep Run Creek 82 - D % Deep Run Creek 82 - Industrial % Deep Run Trib 83 - Industrial % Deep Run Trib 83 - B % Deep Run Trib 83 - Water % Deep Run Trib 83 - D % Deep Run Trib 84 - Brush-Fair % Deep Run Trib 84 - B % Deep Run Trib 84 - Commercial % Deep Run Trib 84 - D % Deep Run Trib 84 - Industrial % Deep Run Trib 84 - Residential-Quarter ac lots % Deep Run Trib 84 - Water %
32 CHEVRON REFINERY SUB BASINS LAND USE SUMMARY TABLE CHEVRON REFINERY SUB BASINS SOIL GROUPS SUMMARY (Ac) (Ac) Sub-basins - Land Use Area Sum Perc. Sub-basins - Hydrologic Soil Groups Area Sum Perc. East Long Run Creek - Brush-Fair % East Long Run Creek - B % East Long Run Creek - Commercial % East Long Run Creek - C % East Long Run Creek - Residential-1 ac lots % East Long Run Creek - D % East Long Run Creek - Residential-2 ac lots % East Long Run Creek - Residential-Quarter ac lots % East Long Run Creek - Row Crop-Straight Row-Good % East Long Run Creek - Water % East Long Run Creek - Woods-Grass Combo-Good % Fiddyment Creek - Brush-Fair % Fiddyment Creek - B % Fiddyment Creek - Commercial % Fiddyment Creek - C % Fiddyment Creek - Industrial % Fiddyment Creek - D % Fiddyment Creek - Open Space-Fair % Fiddyment Creek - Residential-1 ac lots % Fiddyment Creek - Residential-2 ac lots % Fiddyment Creek - Residential-Quarter ac lots % Fiddyment Creek - Roads-Paved w Ditch % Fiddyment Creek - Row Crop-Straight Row-Good % Fiddyment Creek - Water % Fiddyment Creek - Woods % Fiddyment Creek - Woods-Grass Combo-Good % I&M Canal 91 - Brush-Fair % I&M Canal 91 - B % I&M Canal 91 - Water % I&M Canal 91 - D % I&M Canal 91 - Woods % I&M Canal 92 - Brush-Fair % I&M Canal 92 - D % I&M Canal 92 - Industrial % I&M Canal 92 - Water % I&M Canal 93 - Brush-Fair % I&M Canal 93 - B % I&M Canal 93 - Industrial % I&M Canal 93 - D % I&M Canal 93 - Water % I&M Trib 94 - Brush-Fair % I&M Trib 94 - B % I&M Trib 94 - Residential-Quarter ac lots % I&M Trib 94 - C % I&M Trib 94 - Water % I&M Trib 94 - D %
33 CHEVRON REFINERY SUB BASINS LAND USE SUMMARY TABLE CHEVRON REFINERY SUB BASINS SOIL GROUPS SUMMARY (Ac) (Ac) Sub-basins - Land Use Area Sum Perc. Sub-basins - Hydrologic Soil Groups Area Sum Perc. Little Run - Industrial % Little Run Creek - D % North Gate Creek - Brush-Fair % North Gate Creek - B % North Gate Creek - Industrial % North Gate Creek - D % North Gate Creek - Water % North Pond Lift Station Ditch - Brush-Fair % North Pond Lift Station Ditch - D % North Pond Lift Station Ditch - Industrial % North Pond Trib 75 - Industrial % North Pond Trib 75 - D % North Stormwater Pond - Brush-Fair % North Stormwater Pond - D % North Stormwater Pond - Water % Big Run Surge Basin - Brush-Fair % Pellegrini Lake - D % Big Run Surge Basin - Industrial % Big Run Surge Basin - Water % South Branch Long Run Creek - Brush-Fair % South Branch Long Run Creek - B % South Branch Long Run Creek - Commercial % South Branch Long Run Creek - C % South Branch Long Run Creek - Residential-1 ac lots % South Branch Long Run Creek - D % South Branch Long Run Creek - Residential-Quarter ac lots % South Branch Long Run Creek - Roads-Paved w Ditch % South Branch Long Run Creek - Row Crop-Straight Row-Good % South Branch Long Run Creek - Woods % South Branch Long Run Creek - Woods-Grass Combo-Good % South Stormwater Pond - Brush-Fair % South Stormwater Pond - B % South Stormwater Pond - Industrial % South Stormwater Pond - D % Sub-Basin 10 - Brush-Fair % Sub-Basin 10 - B % Sub-Basin 10 - Industrial % Sub-Basin 10 - C % Sub-Basin 10 - Open Space-Good % Sub-Basin 10 - D % Sub-Basin 10 - Residential-1 ac lots % Sub-Basin 10 - Residential-Quarter ac lots % Sub-Basin 10 - Row Crop-Straight Row-Good % Sub-Basin 10 - Woods % Sub-Basin 10 - Woods-Grass Combo-Good %
34 CHEVRON REFINERY SUB BASINS LAND USE SUMMARY TABLE CHEVRON REFINERY SUB BASINS SOIL GROUPS SUMMARY (Ac) (Ac) Sub-basins - Land Use Area Sum Perc. Sub-basins - Hydrologic Soil Groups Area Sum Perc. Sub-Basin 71 - Commercial % Sub-Basin 71 - B % Sub-Basin 71 - Woods-Grass Combo-Good % Sub-Basin 71 - C % Sub-Basin 71 - D % Sub-Basin 72 - Commercial % Sub-Basin 72 - B % Sub-Basin 72 - Woods-Grass Combo-Good % Sub-Basin 72 - C % Sub-Basin 72 - D % West Long Run Creek - Brush-Fair % West Long Run Creek - B % West Long Run Creek - Commercial % West Long Run Creek - C % West Long Run Creek - Industrial % West Long Run Creek - D % West Long Run Creek - Open Space-Good % West Long Run Creek - Residential-1 ac lots % West Long Run Creek - Residential-2 ac lots % West Long Run Creek - Residential-Quarter ac lots % West Long Run Creek - Roads-Paved w Ditch % West Long Run Creek - Row Crop-Straight Row-Good % West Long Run Creek - Water % West Long Run Creek - Woods % West Long Run Creek - Woods-Grass Combo-Good %
35 MILNE CREEK - LOCKPORT BFE EXTENSION SUB BASINS LAND USE SUMMARY TABLE 3.3.2a MILNE CREEK - LOCKPORT BFE EXTENSION SUB BASINS SOIL GROUPS SUMMARY (Ac) (Ac) Sub-basins - Land Use Area Sum Perc. Sub-basins - Hydrologic Soil Groups Area Sum Perc. Commercial -B % HSG A % Commercial -C % HSG B % Commercial -D % HSG C % HSG D % Industrial -B % Industrial -C % Institutional -B % Institutional -C % Open Space-Fair -B % Open Space-Fair -C % Open Space-Fair -D % Residential-1 ac lots -B % Residential-1 ac lots -C % Residential-Quarter ac lots -B % Residential-Quarter ac lots -C % Row Crop-Straight Row-Good -B % Row Crop-Straight Row-Good -C % Row Crop-Straight Row-Good -D % Woods-Grass Combo-Good -B % Woods-Grass Combo-Good -C %
36 CHEVRON REFINERY RUNOFF CURVE NUMBER COMPILATION TABLE Tributaries Area (Ac) CN x Acres CN Big Run Citgo Tributary Deep Run Creek Deep Run Creek Deep Run Trib Deep Run Trib East Long Run Creek Fiddyment Creek I&M Canal I&M Canal I&M Canal I&M Trib Little Run Creek North Gate Creek North Pond Lift Station Ditch North Pond Trib North Stormwater Pond Pellegrini Lake South Branch Long Run Creek South Stormwater Pond Sub-Basin Sub-Basin Sub-Basin West Long Run Creek
37 CHEVRON REFINERY RUNOFF CURVE NUMBER COMPILATION TABLE 3.3.3a Tributaries Area (Ac) CN x Acres CN Deep Run Deep Run Deep Run Deep Run I&M Canal I&M Canal I&M Canal I&M Canal Milne Milne Milne Milne Milne Trib Milne Trib
38 CHEVRON REFINERY LOCKPORT, ILLINOIS TABLE Clark Unit-Hydrograph Parameters Estimating time of concentration and storage coefficient values for Illinois Streams USGS Water-Resources Investigations Report R/(TC + R) = Apr-11 (TC+R)e = 35.2(L) 0.39 (S) Re = R/(TC+R) x (TC+R)e Tce = (TC+R)e - Re Sub-Basin Area (Ac) Area ( mi 2 ) Stream length (ft) Stream length (mi) Length 75% (mi) 10% 85% 75% Slope (ft/mi) R/(TC + R) (TC+R)e Re TCe Big Run Citgo Tributary Deep Run Trib Deep Run Trib Deep Run Trib Deep Run Trib East Long Run Creek Fiddyment Creek I & M Canal I & M Canal I & M Canal I & M Trib Little Run Creek North Gate Creek North Pond Lift Station Ditch North Pond Trib North Stormwater Pond Big Run Surge Basin South Branch Long Run Creek South Stormwater Pond Sub-Basin Sub-Basin Sub-Basin West Long Run Creek * Adjusted value based on Long Run Creek Calibration models Adjusted Re* Adjusted Tce*
39 LOCKPORT BFE EXTENSION LOCKPORT, ILLINOIS TABLE 3.3.4a Clark Unit-Hydrograph Parameters Estimating time of concentration and storage coefficient values for Illinois Streams USGS Water-Resources Investigations Report R/(TC + R) = Apr-11 (TC+R)e = 35.2(L) 0.39 (S) Re = R/(TC+R) x (TC+R)e Tce = (TC+R)e - Re Sub-Basin Area (Ac) Area ( mi 2 ) Stream length (ft) Stream length (mi) Length 75% (mi) 10% 85% 75% Slope (ft/mi) R/(TC + R) (TC+R)e Re TCe Deep Run Deep Run Deep Run Deep Run I&M Canal I&M Canal I&M Canal I&M Canal Milne Milne Milne Milne Milne Trib Milne Trib * Adjusted value based on Long Run Creek Calibration models Adjusted Re* Adjusted Tce*

40 stage elev. area (ft 2 ) CHEVRON SITE Stage-Storage Summary Tables Existing Conditions TABLE area (ac.) avg. area (ac.) storage i (ac-ft) storage i (ac-ft) North of Long Run from Contours , , , , North of Long Run from RAS , , , , Business Park 1 Depressional Area Incremental Cumulative ELEVATIO AREA 1 (sfarea 3 (sfvolume 1 (ac-ft) Volume 2 (ac-ft) Volume 3 (ac-ft) Volume (ac-ft) , , , ,661 4, ,495 2, ,092 1, ,
41 CHEVRON REFINERY SOUTH STORMWATER POND TABLE ORIFICE DISCHARGE BROAD CREST WEIR DISCHARGE TOTAL DISCHARGE Q = C d A x (2gh) 1/2 Q = C w LH 3/2 C d = 0.62 C w = 3.0 OUTLET ELEV: WEIR ELEV: DIAMETER: 12 in. WEIR LENGTH: 40 ft. Q Q TOTAL ELEV. (cfs) ELEV. (cfs) ELEV. Q
 585.00 0.00 586.00 90 587.00 255 588.00 468 589.")
42 CHEVRON REFINERY NORTH SW POND TABLE BROAD CREST WEIR DISCHARGE Q = C w LH 3/2 C w = 3.0 WEIR ELEV: WEIR LENGTH: 30 ft. ELEV. Q (cfs)
43 Sub-Basin Rainfall Data TABLE Bulletin 70 Rainfall Precipitation Sub-basin 10%, 24-hr 2%, 24-hr 1%, 24-hr 0.2%, 24-hr E Long Run Creek W Long Run Creek Citgo Tributary Sub-basin So Br Long Run Creek Big Run Fiddyment Creek Sub-basin Sub-basin North Gate Creek North Stormwater Pond Little Run I&M Canal Deep Run Creek North Pond LS Ditch Big Run Surge Basin North Pond Trib Deep Run Creek Deep Run Trib Deep Run Trib South Stormwater Pond I&M Canal I&M Canal I&M Canal * Reference : ISWS Bulletin 70
44
45
46
47 ISWS Bulletin 70 Rainfall Distribution TABLE Table 37. Heavy Rainfall at a Point Cumulative Quartiles Percent 1st 2nd 3rd 4th * Reference : ISWS Bulletin 70
48
49
50 Incremental Precipitation Distributions Table Frequency 10% Frequency 2% Duration 1:00 hr Duration 1 hr Precipitation Precipitation 3.20 Aerial Reduction 2.08 Aerial Reduction 2.97 Incremental Precipitation Incremental Precipitation Time (hr) 1st 2nd 3rd 4th Time (hr) 1st 2nd 3rd 4th 0: : : : : : : : : : : : : : : : : : : : : : : : : : : : : : : : : : : : : : : : : : Time Increment 3 minutes
51 Incremental Precipitation Distributions Table Frequency 1% Frequency 0.2% Duration 1 hr Duration 1 hr Precipitation Precipitation 5.12 Aerial Reduction 3.39 Aerial Reduction 4.76 Incremental Precipitation Incremental Precipitation Time (hr) 1st 2nd 3rd 4th Time (hr) 1st 2nd 3rd 4th 0: : : : : : : : : : : : : : : : : : : : : : : : : : : : : : : : : : : : : : : : : :
52 Incremental Precipitation Distributions Table Frequency 10% Frequency 2% Duration 2:00 hr Duration 2 hr Precipitation Precipitation 3.94 Aerial Reduction 2.56 Aerial Reduction 3.67 Incremental Precipitation Incremental Precipitation Time (hr) 1st 2nd 3rd 4th Time (hr) 1st 2nd 3rd 4th 0: : : : : : : : : : : : : : : : : : : : : : : : : : : : : : : : : : : : : : : : : : Time Increment 6 minutes
53 Incremental Precipitation Distributions Table Frequency 1% Frequency 0.2% Duration 2 hr Duration 2 hr Precipitation Precipitation 6.32 Aerial Reduction 4.18 Aerial Reduction 5.88 Incremental Precipitation Incremental Precipitation Time (hr) 1st 2nd 3rd 4th Time (hr) 1st 2nd 3rd 4th 0: : : : : : : : : : : : : : : : : : : : : : : : : : : : : : : : : : : : : : : : : :
54 Incremental Precipitation Distributions Table Frequency 10% Frequency 2% Duration 3:00 hr Duration 3 hr Precipitation 3.04 Precipitation 4.35 Aerial Reduction 2.83 Aerial Reduction 4.05 Incremental Precipitation Incremental Precipitation Time (hr) 1st 2nd 3rd 4th Time (hr) 1st 2nd 3rd 4th 0: : : : : : : : : : : : : : : : : : : : : : : : : : : : : : : : : : : : : : : : : : Time Increment 3 minutes
55 Incremental Precipitation Distributions Table Frequency 1% Frequency 0.2% Duration 3 hr Duration 3 hr Precipitation 4.96 Precipitation 6.98 Aerial Reduction 4.61 Aerial Reduction 6.49 Incremental Precipitation Incremental Precipitation Time (hr) 1st 2nd 3rd 4th Time (hr) 1st 2nd 3rd 4th 0: : : : : : : : : : : : : : : : : : : : : : : : : : : : : : : : : : : : : : : : : :
56 Incremental Precipitation Distributions Table Frequency 10% Frequency 2% Duration 6:00 hr Duration 6 hr Precipitation Precipitation 5.10 Aerial Reduction 3.35 Aerial Reduction 4.79 Incremental Precipitation Incremental Precipitation Time (hr) 1st 2nd 3rd 4th Time (hr) 1st 2nd 3rd 4th 0: : : : : : : : : : : : : : : : : : : : : : : : : : : : : : : : : : : : : : : : : : Time Increment 6 minutes
57 Incremental Precipitation Distributions Table Frequency 1% Frequency 0.2% Duration 6 hr Duration 6 hr Precipitation Precipitation 8.18 Aerial Reduction 5.46 Aerial Reduction 7.68 Incremental Precipitation Incremental Precipitation Time (hr) 1st 2nd 3rd 4th Time (hr) 1st 2nd 3rd 4th 0: : : : : : : : : : : : : : : : : : : : : : : : : : : : : : : : : : : : : : : : : :
58 Incremental Precipitation Distributions Table Frequency 10% Frequency 2% Duration 12:00 hr Duration 12 hr Precipitation Precipitation 5.92 Aerial Reduction 3.97 Aerial Reduction 5.68 Incremental Precipitation Incremental Precipitation Time (hr) 1st 2nd 3rd 4th Time (hr) 1st 2nd 3rd 4th 0: : : : : : : : : : : : : : : : : : : : : : : : : : : : : : : : : : : : : : : : : : Time Increment 12 minutes
59 Incremental Precipitation Distributions Table Frequency 1% Frequency 0.2% Duration 12 hr Duration 12 hr Precipitation Precipitation 9.48 Aerial Reduction 6.47 Aerial Reduction 9.10 Incremental Precipitation Incremental Precipitation Time (hr) 1st 2nd 3rd 4th Time (hr) 1st 2nd 3rd 4th 0: : : : : : : : : : : : : : : : : : : : : : : : : : : : : : : : : : : : : : : : : :
60 Incremental Precipitation Distributions Table Frequency 10% Frequency 2% Duration 18:00 hr Duration 18 hr Precipitation Precipitation 6.39 Aerial Reduction 4.33 Aerial Reduction 6.20 Incremental Precipitation Incremental Precipitation Time (hr) 1st 2nd 3rd 4th Time (hr) 1st 2nd 3rd 4th 0: : : : : : : : : : : : : : : : : : : : : : : : : : : : : : : : : : : : : : : : : : Time Increment 6 minutes
61 Incremental Precipitation Distributions Table Frequency 1% Frequency 0.2% Duration 18 hr Duration 18 hr Precipitation Precipitation Aerial Reduction 7.07 Aerial Reduction 9.94 Incremental Precipitation Incremental Precipitation Time (hr) 1st 2nd 3rd 4th Time (hr) 1st 2nd 3rd 4th 0: : : : : : : : : : : : : : : : : : : : : : : : : : : : : : : : : : : : : : : : : :
62 Incremental Precipitation Distributions Table Frequency 10% Frequency 2% Duration 24 hr Duration 24 hr Precipitation 4.75 Precipitation 6.8 Aerial Reduction 4.61 Aerial Reduction 6.60 Incremental Precipitation Incremental Precipitation Time (hr) 1st 2nd 3rd 4th Time (hr) 1st 2nd 3rd 4th 0: : : : : : : : : : : : : : : : : : : : : : : : : : : : : : : : : : : : : : : : : : Time Increment 12 minutes
63 Incremental Precipitation Distributions Table Frequency 1% Frequency 0.2% Duration 24 hr Duration 24 hr Precipitation 7.75 Precipitation 10.9 Aerial Reductio 7.52 Aerial Reductio Incremental Precipitation Incremental Precipitation Time (hr) 1st 2nd 3rd 4th Time (hr) 1st 2nd 3rd 0: : : : : : : : : : : : : : : : : : : : : : : : : : : : : : : : : : : : : : : : : :
64 Incremental Precipitation Distributions Table Frequency 10% Frequency 2% Duration 48:00 hr Duration 48 hr Precipitation 5.13 Precipitation 7.34 Aerial Reduction 5.03 Aerial Reduction 7.12 Incremental Precipitation Incremental Precipitation Time (hr) 1st 2nd 3rd 4th Time (hr) 1st 2nd 3rd 4th 0: : : : : : : : : : : : : : : : : : : : : : : : : : : : : : : : : : : : : : : : : : Time Increment 12 minutes
65 Incremental Precipitation Distributions Table Frequency 1% Frequency 0.2% Duration 48 hr Duration 48 hr Precipitation 8.37 Precipitation Aerial Reduction 8.12 Aerial Reduction Incremental Precipitation Incremental Precipitation Time (hr) 1st 2nd 3rd 4th Time (hr) 1st 2nd 3rd 4th 0: : : : : : : : : : : : : : : : : : : : : : : : : : : : : : : : : : : : : : : : : :
66 Incremental Precipitation Distributions Table Frequency 10% Frequency 2% Duration 72:00 hr Duration 72 hr Precipitation 5.51 Precipitation 7.89 Aerial Reduction 5.51 Aerial Reduction 7.65 Incremental Precipitation Incremental Precipitation Time (hr) 1st 2nd 3rd 4th Time (hr) 1st 2nd 3rd 4th 0: : : : : : : : : : : : : : : : : : : : : : : : : : : : : : : : : : : : : : : : : : Time Increment 12 minutes
67 Incremental Precipitation Distributions Table Frequency 1% Frequency 0.2% Duration 72 hr Duration 72 hr Precipitation 8.99 Precipitation Aerial Reduction 8.72 Aerial Reduction Incremental Precipitation Incremental Precipitation Time (hr) 1st 2nd 3rd 4th Time (hr) 1st 2nd 3rd 4th 0: : : : : : : : : : : : : : : : : : : : : : : : : : : : : : : : : : : : : : : : : :
68 Incremental Precipitation Distributions Table Frequency 10% Frequency 2% Duration 120:00 hr Duration 120 hr Precipitation Precipitation 8.91 Aerial Reduction 6.22 Aerial Reduction 8.64 Incremental Precipitation Incremental Precipitation Time (hr) 1st 2nd 3rd 4th Time (hr) 1st 2nd 3rd 4th 0: : : : : : : : : : : : : : : : : : : : : : : : : : : : : : : : : : : : : : : : : : Time Increment 12 hours
69 Incremental Precipitation Distributions Table Frequency 1% Frequency 0.2% Duration 120 hr Duration 120 hr Precipitation Precipitation Aerial Reduction 9.85 Aerial Reduction Incremental Precipitation Incremental Precipitation Time (hr) 1st 2nd 3rd 4th Time (hr) 1st 2nd 3rd 4th 0: : : : : : : : : : : : : : : : : : : : : : : : : : : : : : : : : : : : : : : : : :
70 Incremental Precipitation Distributions Table Frequency 10% Frequency 2% Duration 240:00 hr Duration 240 hr Precipitation Precipitation Aerial Reduction 6.98 Aerial Reduction 9.70 Incremental Precipitation Incremental Precipitation Time (hr) 1st 2nd 3rd 4th Time (hr) 1st 2nd 3rd 4th 0: : : : : : : : : : : : : : : : : : : : : : : : : : : : : : : : : : : : : : : : : : Time Increment 6 hours
71 Incremental Precipitation Distributions Table Frequency 1% Frequency 0.2% Duration 240 hr Duration 240 hr Precipitation Precipitation Aerial Reduction Aerial Reduction Incremental Precipitation Incremental Precipitation Time (hr) 1st 2nd 3rd 4th Time (hr) 1st 2nd 3rd 4th 0: : : : : : : : : : : : : : : : : : : : : : : : : : : : : : : : : : : : : : : : : :
72 HEC-RAS River: I&M Canal Reach: SITE Profile: Max WS Reach River Sta Profile Plan Q Total Min Ch El W.S. Elev Crit W.S. E.G. Elev E.G. Slope Vel Chnl Flow Area Top Width Froude # Chl (cfs) (ft) (ft) (ft) (ft) (ft/ft) (ft/s) (sq ft) (ft) SITE Max WS I&M 1% 240hr SITE Max WS I&M 1&120hr SITE Max WS I&M 1%72hr SITE Max WS I&M 1% SITE Max WS I&M 1% 24hr SITE Max WS I&M 1% 18hr SITE Max WS I&M 1% 12hr SITE Max WS I&M 1% 6hr SITE Max WS I&M 1% 3hr SITE Max WS I&M 1% 2hr SITE Max WS I&M 1% 1hr SITE Lat Struct SITE 40 Max WS I&M 1% 240hr SITE 40 Max WS I&M 1&120hr SITE 40 Max WS I&M 1%72hr SITE 40 Max WS I&M 1% SITE 40 Max WS I&M 1% 24hr SITE 40 Max WS I&M 1% 18hr SITE 40 Max WS I&M 1% 12hr SITE 40 Max WS I&M 1% 6hr SITE 40 Max WS I&M 1% 3hr SITE 40 Max WS I&M 1% 2hr SITE 40 Max WS I&M 1% 1hr SITE 39 Max WS I&M 1% 240hr SITE 39 Max WS I&M 1&120hr SITE 39 Max WS I&M 1%72hr SITE 39 Max WS I&M 1% SITE 39 Max WS I&M 1% 24hr SITE 39 Max WS I&M 1% 18hr SITE 39 Max WS I&M 1% 12hr SITE 39 Max WS I&M 1% 6hr SITE 39 Max WS I&M 1% 3hr SITE 39 Max WS I&M 1% 2hr SITE 39 Max WS I&M 1% 1hr SITE Lat Struct SITE 38 Max WS I&M 1% 240hr SITE 38 Max WS I&M 1&120hr SITE 38 Max WS I&M 1%72hr SITE 38 Max WS I&M 1% SITE 38 Max WS I&M 1% 24hr SITE 38 Max WS I&M 1% 18hr SITE 38 Max WS I&M 1% 12hr SITE 38 Max WS I&M 1% 6hr SITE 38 Max WS I&M 1% 3hr SITE 38 Max WS I&M 1% 2hr SITE 38 Max WS I&M 1% 1hr SITE 37 Max WS I&M 1% 240hr SITE 37 Max WS I&M 1&120hr SITE 37 Max WS I&M 1%72hr SITE 37 Max WS I&M 1% SITE 37 Max WS I&M 1% 24hr SITE 37 Max WS I&M 1% 18hr SITE 37 Max WS I&M 1% 12hr SITE 37 Max WS I&M 1% 6hr SITE 37 Max WS I&M 1% 3hr SITE 37 Max WS I&M 1% 2hr SITE 37 Max WS I&M 1% 1hr SITE Lat Struct SITE Lat Struct SITE 36 Max WS I&M 1% 240hr SITE 36 Max WS I&M 1&120hr SITE 36 Max WS I&M 1%72hr SITE 36 Max WS I&M 1% SITE 36 Max WS I&M 1% 24hr SITE 36 Max WS I&M 1% 18hr SITE 36 Max WS I&M 1% 12hr SITE 36 Max WS I&M 1% 6hr SITE 36 Max WS I&M 1% 3hr SITE 36 Max WS I&M 1% 2hr SITE 36 Max WS I&M 1% 1hr SITE 35 Max WS I&M 1% 240hr SITE 35 Max WS I&M 1&120hr SITE 35 Max WS I&M 1%72hr SITE 35 Max WS I&M 1% SITE 35 Max WS I&M 1% 24hr SITE 35 Max WS I&M 1% 18hr SITE 35 Max WS I&M 1% 12hr
73 HEC-RAS River: I&M Canal Reach: SITE Profile: Max WS (Continued) Reach River Sta Profile Plan Q Total Min Ch El W.S. Elev Crit W.S. E.G. Elev E.G. Slope Vel Chnl Flow Area Top Width Froude # Chl (cfs) (ft) (ft) (ft) (ft) (ft/ft) (ft/s) (sq ft) (ft) SITE 35 Max WS I&M 1% 6hr SITE 35 Max WS I&M 1% 3hr SITE 35 Max WS I&M 1% 2hr SITE 35 Max WS I&M 1% 1hr SITE 34.5 Bridge SITE 34 Max WS I&M 1% 240hr SITE 34 Max WS I&M 1&120hr SITE 34 Max WS I&M 1%72hr SITE 34 Max WS I&M 1% SITE 34 Max WS I&M 1% 24hr SITE 34 Max WS I&M 1% 18hr SITE 34 Max WS I&M 1% 12hr SITE 34 Max WS I&M 1% 6hr SITE 34 Max WS I&M 1% 3hr SITE 34 Max WS I&M 1% 2hr SITE 34 Max WS I&M 1% 1hr SITE 33 Max WS I&M 1% 240hr SITE 33 Max WS I&M 1&120hr SITE 33 Max WS I&M 1%72hr SITE 33 Max WS I&M 1% SITE 33 Max WS I&M 1% 24hr SITE 33 Max WS I&M 1% 18hr SITE 33 Max WS I&M 1% 12hr SITE 33 Max WS I&M 1% 6hr SITE 33 Max WS I&M 1% 3hr SITE 33 Max WS I&M 1% 2hr SITE 33 Max WS I&M 1% 1hr SITE 32 Max WS I&M 1% 240hr SITE 32 Max WS I&M 1&120hr SITE 32 Max WS I&M 1%72hr SITE 32 Max WS I&M 1% SITE 32 Max WS I&M 1% 24hr SITE 32 Max WS I&M 1% 18hr SITE 32 Max WS I&M 1% 12hr SITE 32 Max WS I&M 1% 6hr SITE 32 Max WS I&M 1% 3hr SITE 32 Max WS I&M 1% 2hr SITE 32 Max WS I&M 1% 1hr SITE 31 Max WS I&M 1% 240hr SITE 31 Max WS I&M 1&120hr SITE 31 Max WS I&M 1%72hr SITE 31 Max WS I&M 1% SITE 31 Max WS I&M 1% 24hr SITE 31 Max WS I&M 1% 18hr SITE 31 Max WS I&M 1% 12hr SITE 31 Max WS I&M 1% 6hr SITE 31 Max WS I&M 1% 3hr SITE 31 Max WS I&M 1% 2hr SITE 31 Max WS I&M 1% 1hr SITE Inl Struct SITE 30 Max WS I&M 1% 240hr SITE 30 Max WS I&M 1&120hr SITE 30 Max WS I&M 1%72hr SITE 30 Max WS I&M 1% SITE 30 Max WS I&M 1% 24hr SITE 30 Max WS I&M 1% 18hr SITE 30 Max WS I&M 1% 12hr SITE 30 Max WS I&M 1% 6hr SITE 30 Max WS I&M 1% 3hr SITE 30 Max WS I&M 1% 2hr SITE 30 Max WS I&M 1% 1hr SITE 29 Max WS I&M 1% 240hr SITE 29 Max WS I&M 1&120hr SITE 29 Max WS I&M 1%72hr SITE 29 Max WS I&M 1% SITE 29 Max WS I&M 1% 24hr SITE 29 Max WS I&M 1% 18hr SITE 29 Max WS I&M 1% 12hr SITE 29 Max WS I&M 1% 6hr SITE 29 Max WS I&M 1% 3hr SITE 29 Max WS I&M 1% 2hr SITE 29 Max WS I&M 1% 1hr SITE 28 Max WS I&M 1% 240hr SITE 28 Max WS I&M 1&120hr SITE 28 Max WS I&M 1%72hr SITE 28 Max WS I&M 1% SITE 28 Max WS I&M 1% 24hr SITE 28 Max WS I&M 1% 18hr
74 HEC-RAS River: I&M Canal Reach: SITE Profile: Max WS (Continued) Reach River Sta Profile Plan Q Total Min Ch El W.S. Elev Crit W.S. E.G. Elev E.G. Slope Vel Chnl Flow Area Top Width Froude # Chl (cfs) (ft) (ft) (ft) (ft) (ft/ft) (ft/s) (sq ft) (ft) SITE 28 Max WS I&M 1% 12hr SITE 28 Max WS I&M 1% 6hr SITE 28 Max WS I&M 1% 3hr SITE 28 Max WS I&M 1% 2hr SITE 28 Max WS I&M 1% 1hr SITE 27.7 Bridge SITE 27 Max WS I&M 1% 240hr SITE 27 Max WS I&M 1&120hr SITE 27 Max WS I&M 1%72hr SITE 27 Max WS I&M 1% SITE 27 Max WS I&M 1% 24hr SITE 27 Max WS I&M 1% 18hr SITE 27 Max WS I&M 1% 12hr SITE 27 Max WS I&M 1% 6hr SITE 27 Max WS I&M 1% 3hr SITE 27 Max WS I&M 1% 2hr SITE 27 Max WS I&M 1% 1hr SITE 26 Max WS I&M 1% 240hr SITE 26 Max WS I&M 1&120hr SITE 26 Max WS I&M 1%72hr SITE 26 Max WS I&M 1% SITE 26 Max WS I&M 1% 24hr SITE 26 Max WS I&M 1% 18hr SITE 26 Max WS I&M 1% 12hr SITE 26 Max WS I&M 1% 6hr SITE 26 Max WS I&M 1% 3hr SITE 26 Max WS I&M 1% 2hr SITE 26 Max WS I&M 1% 1hr SITE 25 Max WS I&M 1% 240hr SITE 25 Max WS I&M 1&120hr SITE 25 Max WS I&M 1%72hr SITE 25 Max WS I&M 1% SITE 25 Max WS I&M 1% 24hr SITE 25 Max WS I&M 1% 18hr SITE 25 Max WS I&M 1% 12hr SITE 25 Max WS I&M 1% 6hr SITE 25 Max WS I&M 1% 3hr SITE 25 Max WS I&M 1% 2hr SITE 25 Max WS I&M 1% 1hr SITE 24 Max WS I&M 1% 240hr SITE 24 Max WS I&M 1&120hr SITE 24 Max WS I&M 1%72hr SITE 24 Max WS I&M 1% SITE 24 Max WS I&M 1% 24hr SITE 24 Max WS I&M 1% 18hr SITE 24 Max WS I&M 1% 12hr SITE 24 Max WS I&M 1% 6hr SITE 24 Max WS I&M 1% 3hr SITE 24 Max WS I&M 1% 2hr SITE 24 Max WS I&M 1% 1hr SITE 23.5 Bridge SITE 23 Max WS I&M 1% 240hr SITE 23 Max WS I&M 1&120hr SITE 23 Max WS I&M 1%72hr SITE 23 Max WS I&M 1% SITE 23 Max WS I&M 1% 24hr SITE 23 Max WS I&M 1% 18hr SITE 23 Max WS I&M 1% 12hr SITE 23 Max WS I&M 1% 6hr SITE 23 Max WS I&M 1% 3hr SITE 23 Max WS I&M 1% 2hr SITE 23 Max WS I&M 1% 1hr SITE 22 Max WS I&M 1% 240hr SITE 22 Max WS I&M 1&120hr SITE 22 Max WS I&M 1%72hr SITE 22 Max WS I&M 1% SITE 22 Max WS I&M 1% 24hr SITE 22 Max WS I&M 1% 18hr SITE 22 Max WS I&M 1% 12hr SITE 22 Max WS I&M 1% 6hr SITE 22 Max WS I&M 1% 3hr SITE 22 Max WS I&M 1% 2hr SITE 22 Max WS I&M 1% 1hr SITE 21 Max WS I&M 1% 240hr SITE 21 Max WS I&M 1&120hr SITE 21 Max WS I&M 1%72hr SITE 21 Max WS I&M 1% SITE 21 Max WS I&M 1% 24hr
75 HEC-RAS River: I&M Canal Reach: SITE Profile: Max WS (Continued) Reach River Sta Profile Plan Q Total Min Ch El W.S. Elev Crit W.S. E.G. Elev E.G. Slope Vel Chnl Flow Area Top Width Froude # Chl (cfs) (ft) (ft) (ft) (ft) (ft/ft) (ft/s) (sq ft) (ft) SITE 21 Max WS I&M 1% 18hr SITE 21 Max WS I&M 1% 12hr SITE 21 Max WS I&M 1% 6hr SITE 21 Max WS I&M 1% 3hr SITE 21 Max WS I&M 1% 2hr SITE 21 Max WS I&M 1% 1hr SITE 20.9 Max WS I&M 1% 240hr SITE 20.9 Max WS I&M 1&120hr SITE 20.9 Max WS I&M 1%72hr SITE 20.9 Max WS I&M 1% SITE 20.9 Max WS I&M 1% 24hr SITE 20.9 Max WS I&M 1% 18hr SITE 20.9 Max WS I&M 1% 12hr SITE 20.9 Max WS I&M 1% 6hr SITE 20.9 Max WS I&M 1% 3hr SITE 20.9 Max WS I&M 1% 2hr SITE 20.9 Max WS I&M 1% 1hr SITE 20.8 Bridge SITE 20.7 Max WS I&M 1% 240hr SITE 20.7 Max WS I&M 1&120hr SITE 20.7 Max WS I&M 1%72hr SITE 20.7 Max WS I&M 1% SITE 20.7 Max WS I&M 1% 24hr SITE 20.7 Max WS I&M 1% 18hr SITE 20.7 Max WS I&M 1% 12hr SITE 20.7 Max WS I&M 1% 6hr SITE 20.7 Max WS I&M 1% 3hr SITE 20.7 Max WS I&M 1% 2hr SITE 20.7 Max WS I&M 1% 1hr SITE 20 Max WS I&M 1% 240hr SITE 20 Max WS I&M 1&120hr SITE 20 Max WS I&M 1%72hr SITE 20 Max WS I&M 1% SITE 20 Max WS I&M 1% 24hr SITE 20 Max WS I&M 1% 18hr SITE 20 Max WS I&M 1% 12hr SITE 20 Max WS I&M 1% 6hr SITE 20 Max WS I&M 1% 3hr SITE 20 Max WS I&M 1% 2hr SITE 20 Max WS I&M 1% 1hr SITE 19 Max WS I&M 1% 240hr SITE 19 Max WS I&M 1&120hr SITE 19 Max WS I&M 1%72hr SITE 19 Max WS I&M 1% SITE 19 Max WS I&M 1% 24hr SITE 19 Max WS I&M 1% 18hr SITE 19 Max WS I&M 1% 12hr SITE 19 Max WS I&M 1% 6hr SITE 19 Max WS I&M 1% 3hr SITE 19 Max WS I&M 1% 2hr SITE 19 Max WS I&M 1% 1hr SITE 18.4 Max WS I&M 1% SITE 18.2 Max WS I&M 1% SITE 18.1 Max WS I&M 1% SITE 18 Max WS I&M 1% 240hr SITE 18 Max WS I&M 1&120hr SITE 18 Max WS I&M 1%72hr SITE 18 Max WS I&M 1% SITE 18 Max WS I&M 1% 24hr SITE 18 Max WS I&M 1% 18hr SITE 18 Max WS I&M 1% 12hr SITE 18 Max WS I&M 1% 6hr SITE 18 Max WS I&M 1% 3hr SITE 18 Max WS I&M 1% 2hr SITE 18 Max WS I&M 1% 1hr SITE 17 Max WS I&M 1% 240hr SITE 17 Max WS I&M 1&120hr SITE 17 Max WS I&M 1%72hr SITE 17 Max WS I&M 1% SITE 17 Max WS I&M 1% 24hr SITE 17 Max WS I&M 1% 18hr SITE 17 Max WS I&M 1% 12hr SITE 17 Max WS I&M 1% 6hr SITE 17 Max WS I&M 1% 3hr SITE 17 Max WS I&M 1% 2hr SITE 17 Max WS I&M 1% 1hr
76 HEC-RAS River: I&M Canal Reach: SITE Profile: Max WS (Continued) Reach River Sta Profile Plan Q Total Min Ch El W.S. Elev Crit W.S. E.G. Elev E.G. Slope Vel Chnl Flow Area Top Width Froude # Chl (cfs) (ft) (ft) (ft) (ft) (ft/ft) (ft/s) (sq ft) (ft) SITE 16 Max WS I&M 1% 240hr SITE 16 Max WS I&M 1&120hr SITE 16 Max WS I&M 1%72hr SITE 16 Max WS I&M 1% SITE 16 Max WS I&M 1% 24hr SITE 16 Max WS I&M 1% 18hr SITE 16 Max WS I&M 1% 12hr SITE 16 Max WS I&M 1% 6hr SITE 16 Max WS I&M 1% 3hr SITE 16 Max WS I&M 1% 2hr SITE 16 Max WS I&M 1% 1hr SITE 15.9 Max WS I&M 1% SITE 15.7 Max WS I&M 1% SITE 15.1 Max WS I&M 1% SITE 15 Max WS I&M 1% SITE 14.9 Max WS I&M 1% SITE 14.8 Max WS I&M 1% SITE 14.6 Max WS I&M 1% SITE 14.5 Max WS I&M 1% SITE 14 Max WS I&M 1% SITE 13.5 Max WS I&M 1% SITE 13 Max WS I&M 1% SITE 12.1 Max WS I&M 1% SITE 12 Max WS I&M 1% SITE 11.9 Max WS I&M 1% SITE 11.7 Max WS I&M 1% SITE 11.1 Max WS I&M 1% SITE 11 Max WS I&M 1% SITE 10 Max WS I&M 1%
77 HEC-RAS River: Deep Run Reach: Main Profile: Max WS Reach River Sta Profile Plan Q Total Min Ch El W.S. Elev Crit W.S. E.G. Elev E.G. Slope Vel Chnl Flow Area Top Width Froude # Chl (cfs) (ft) (ft) (ft) (ft) (ft/ft) (ft/s) (sq ft) (ft) Main Max WS Deep Run 1%240hr Main Max WS Deep Run 1%120hr Main Max WS Deep Run 1% 72hr Main Max WS Deep Run 1% 48hr Main Max WS Deep Run 1%24hr Main Max WS Deep Run 1%18hr Main Max WS Deep Run 1%12hr Main Max WS Deep Run 1%6hr Main Max WS Deep Run 1%3hr Main Max WS Deep Run 1% 2hr Main Max WS Deep Run 1% 1hr Main Max WS Deep Run 1%240hr Main Max WS Deep Run 1%120hr Main Max WS Deep Run 1% 72hr Main Max WS Deep Run 1% 48hr Main Max WS Deep Run 1%24hr Main Max WS Deep Run 1%18hr Main Max WS Deep Run 1%12hr Main Max WS Deep Run 1%6hr Main Max WS Deep Run 1%3hr Main Max WS Deep Run 1% 2hr Main Max WS Deep Run 1% 1hr Main Max WS Deep Run 1%240hr Main Max WS Deep Run 1%120hr Main Max WS Deep Run 1% 72hr Main Max WS Deep Run 1% 48hr Main Max WS Deep Run 1%24hr Main Max WS Deep Run 1%18hr Main Max WS Deep Run 1%12hr Main Max WS Deep Run 1%6hr Main Max WS Deep Run 1%3hr Main Max WS Deep Run 1% 2hr Main Max WS Deep Run 1% 1hr Main Max WS Deep Run 1%240hr Main Max WS Deep Run 1%120hr Main Max WS Deep Run 1% 72hr Main Max WS Deep Run 1% 48hr Main Max WS Deep Run 1%24hr Main Max WS Deep Run 1%18hr Main Max WS Deep Run 1%12hr Main Max WS Deep Run 1%6hr Main Max WS Deep Run 1%3hr Main Max WS Deep Run 1% 2hr Main Max WS Deep Run 1% 1hr Main Max WS Deep Run 1%240hr Main Max WS Deep Run 1%120hr Main Max WS Deep Run 1% 72hr Main Max WS Deep Run 1% 48hr Main Max WS Deep Run 1%24hr Main Max WS Deep Run 1%18hr Main Max WS Deep Run 1%12hr Main Max WS Deep Run 1%6hr Main Max WS Deep Run 1%3hr Main Max WS Deep Run 1% 2hr Main Max WS Deep Run 1% 1hr Main Max WS Deep Run 1%240hr Main Max WS Deep Run 1%120hr Main Max WS Deep Run 1% 72hr Main Max WS Deep Run 1% 48hr Main Max WS Deep Run 1%24hr Main Max WS Deep Run 1%18hr Main Max WS Deep Run 1%12hr Main Max WS Deep Run 1%6hr Main Max WS Deep Run 1%3hr Main Max WS Deep Run 1% 2hr Main Max WS Deep Run 1% 1hr Main Max WS Deep Run 1%240hr Main Max WS Deep Run 1%120hr Main Max WS Deep Run 1% 72hr Main Max WS Deep Run 1% 48hr Main Max WS Deep Run 1%24hr Main Max WS Deep Run 1%18hr Main Max WS Deep Run 1%12hr Main Max WS Deep Run 1%6hr Main Max WS Deep Run 1%3hr Main Max WS Deep Run 1% 2hr Main Max WS Deep Run 1% 1hr Main Max WS Deep Run 1%240hr Main Max WS Deep Run 1%120hr Main Max WS Deep Run 1% 72hr
78 HEC-RAS River: Deep Run Reach: Main Profile: Max WS (Continued) Reach River Sta Profile Plan Q Total Min Ch El W.S. Elev Crit W.S. E.G. Elev E.G. Slope Vel Chnl Flow Area Top Width Froude # Chl (cfs) (ft) (ft) (ft) (ft) (ft/ft) (ft/s) (sq ft) (ft) Main Max WS Deep Run 1% 48hr Main Max WS Deep Run 1%24hr Main Max WS Deep Run 1%18hr Main Max WS Deep Run 1%12hr Main Max WS Deep Run 1%6hr Main Max WS Deep Run 1%3hr Main Max WS Deep Run 1% 2hr Main Max WS Deep Run 1% 1hr Main Max WS Deep Run 1%240hr Main Max WS Deep Run 1%120hr Main Max WS Deep Run 1% 72hr Main Max WS Deep Run 1% 48hr Main Max WS Deep Run 1%24hr Main Max WS Deep Run 1%18hr Main Max WS Deep Run 1%12hr Main Max WS Deep Run 1%6hr Main Max WS Deep Run 1%3hr Main Max WS Deep Run 1% 2hr Main Max WS Deep Run 1% 1hr Main Max WS Deep Run 1%240hr Main Max WS Deep Run 1%120hr Main Max WS Deep Run 1% 72hr Main Max WS Deep Run 1% 48hr Main Max WS Deep Run 1%24hr Main Max WS Deep Run 1%18hr Main Max WS Deep Run 1%12hr Main Max WS Deep Run 1%6hr Main Max WS Deep Run 1%3hr Main Max WS Deep Run 1% 2hr Main Max WS Deep Run 1% 1hr Main Max WS Deep Run 1%240hr Main Max WS Deep Run 1%120hr Main Max WS Deep Run 1% 72hr Main Max WS Deep Run 1% 48hr Main Max WS Deep Run 1%24hr Main Max WS Deep Run 1%18hr Main Max WS Deep Run 1%12hr Main Max WS Deep Run 1%6hr Main Max WS Deep Run 1%3hr Main Max WS Deep Run 1% 2hr Main Max WS Deep Run 1% 1hr Main Max WS Deep Run 1%240hr Main Max WS Deep Run 1%120hr Main Max WS Deep Run 1% 72hr Main Max WS Deep Run 1% 48hr Main Max WS Deep Run 1%24hr Main Max WS Deep Run 1%18hr Main Max WS Deep Run 1%12hr Main Max WS Deep Run 1%6hr Main Max WS Deep Run 1%3hr Main Max WS Deep Run 1% 2hr Main Max WS Deep Run 1% 1hr Main Max WS Deep Run 1%240hr Main Max WS Deep Run 1%120hr Main Max WS Deep Run 1% 72hr Main Max WS Deep Run 1% 48hr Main Max WS Deep Run 1%24hr Main Max WS Deep Run 1%18hr Main Max WS Deep Run 1%12hr Main Max WS Deep Run 1%6hr Main Max WS Deep Run 1%3hr Main Max WS Deep Run 1% 2hr Main Max WS Deep Run 1% 1hr Main Max WS Deep Run 1%240hr Main Max WS Deep Run 1%120hr Main Max WS Deep Run 1% 72hr Main Max WS Deep Run 1% 48hr Main Max WS Deep Run 1%24hr Main Max WS Deep Run 1%18hr Main Max WS Deep Run 1%12hr Main Max WS Deep Run 1%6hr Main Max WS Deep Run 1%3hr Main Max WS Deep Run 1% 2hr Main Max WS Deep Run 1% 1hr Main Max WS Deep Run 1%240hr Main Max WS Deep Run 1%120hr Main Max WS Deep Run 1% 72hr Main Max WS Deep Run 1% 48hr Main Max WS Deep Run 1%24hr Main Max WS Deep Run 1%18hr
79 HEC-RAS River: Deep Run Reach: Main Profile: Max WS (Continued) Reach River Sta Profile Plan Q Total Min Ch El W.S. Elev Crit W.S. E.G. Elev E.G. Slope Vel Chnl Flow Area Top Width Froude # Chl (cfs) (ft) (ft) (ft) (ft) (ft/ft) (ft/s) (sq ft) (ft) Main Max WS Deep Run 1%12hr Main Max WS Deep Run 1%6hr Main Max WS Deep Run 1%3hr Main Max WS Deep Run 1% 2hr Main Max WS Deep Run 1% 1hr Main Max WS Deep Run 1%240hr Main Max WS Deep Run 1%120hr Main Max WS Deep Run 1% 72hr Main Max WS Deep Run 1% 48hr Main Max WS Deep Run 1%24hr Main Max WS Deep Run 1%18hr Main Max WS Deep Run 1%12hr Main Max WS Deep Run 1%6hr Main Max WS Deep Run 1%3hr Main Max WS Deep Run 1% 2hr Main Max WS Deep Run 1% 1hr Main Max WS Deep Run 1%240hr Main Max WS Deep Run 1%120hr Main Max WS Deep Run 1% 72hr Main Max WS Deep Run 1% 48hr Main Max WS Deep Run 1%24hr Main Max WS Deep Run 1%18hr Main Max WS Deep Run 1%12hr Main Max WS Deep Run 1%6hr Main Max WS Deep Run 1%3hr Main Max WS Deep Run 1% 2hr Main Max WS Deep Run 1% 1hr Main Max WS Deep Run 1%240hr Main Max WS Deep Run 1%120hr Main Max WS Deep Run 1% 72hr Main Max WS Deep Run 1% 48hr Main Max WS Deep Run 1%24hr Main Max WS Deep Run 1%18hr Main Max WS Deep Run 1%12hr Main Max WS Deep Run 1%6hr Main Max WS Deep Run 1%3hr Main Max WS Deep Run 1% 2hr Main Max WS Deep Run 1% 1hr Main Max WS Deep Run 1%240hr Main Max WS Deep Run 1%120hr Main Max WS Deep Run 1% 72hr Main Max WS Deep Run 1% 48hr Main Max WS Deep Run 1%24hr Main Max WS Deep Run 1%18hr Main Max WS Deep Run 1%12hr Main Max WS Deep Run 1%6hr Main Max WS Deep Run 1%3hr Main Max WS Deep Run 1% 2hr Main Max WS Deep Run 1% 1hr Main Max WS Deep Run 1%240hr Main Max WS Deep Run 1%120hr Main Max WS Deep Run 1% 72hr Main Max WS Deep Run 1% 48hr Main Max WS Deep Run 1%24hr Main Max WS Deep Run 1%18hr Main Max WS Deep Run 1%12hr Main Max WS Deep Run 1%6hr Main Max WS Deep Run 1%3hr Main Max WS Deep Run 1% 2hr Main Max WS Deep Run 1% 1hr Main Max WS Deep Run 1%240hr Main Max WS Deep Run 1%120hr Main Max WS Deep Run 1% 72hr Main Max WS Deep Run 1% 48hr Main Max WS Deep Run 1%24hr Main Max WS Deep Run 1%18hr Main Max WS Deep Run 1%12hr Main Max WS Deep Run 1%6hr Main Max WS Deep Run 1%3hr Main Max WS Deep Run 1% 2hr Main Max WS Deep Run 1% 1hr Main Max WS Deep Run 1%240hr Main Max WS Deep Run 1%120hr Main Max WS Deep Run 1% 72hr Main Max WS Deep Run 1% 48hr Main Max WS Deep Run 1%24hr Main Max WS Deep Run 1%18hr Main Max WS Deep Run 1%12hr Main Max WS Deep Run 1%6hr Main Max WS Deep Run 1%3hr
80 HEC-RAS River: Deep Run Reach: Main Profile: Max WS (Continued) Reach River Sta Profile Plan Q Total Min Ch El W.S. Elev Crit W.S. E.G. Elev E.G. Slope Vel Chnl Flow Area Top Width Froude # Chl (cfs) (ft) (ft) (ft) (ft) (ft/ft) (ft/s) (sq ft) (ft) Main Max WS Deep Run 1% 2hr Main Max WS Deep Run 1% 1hr Main Max WS Deep Run 1%240hr Main Max WS Deep Run 1%120hr Main Max WS Deep Run 1% 72hr Main Max WS Deep Run 1% 48hr Main Max WS Deep Run 1%24hr Main Max WS Deep Run 1%18hr Main Max WS Deep Run 1%12hr Main Max WS Deep Run 1%6hr Main Max WS Deep Run 1%3hr Main Max WS Deep Run 1% 2hr Main Max WS Deep Run 1% 1hr Main Max WS Deep Run 1%240hr Main Max WS Deep Run 1%120hr Main Max WS Deep Run 1% 72hr Main Max WS Deep Run 1% 48hr Main Max WS Deep Run 1%24hr Main Max WS Deep Run 1%18hr Main Max WS Deep Run 1%12hr Main Max WS Deep Run 1%6hr Main Max WS Deep Run 1%3hr Main Max WS Deep Run 1% 2hr Main Max WS Deep Run 1% 1hr Main Max WS Deep Run 1%240hr Main Max WS Deep Run 1%120hr Main Max WS Deep Run 1% 72hr Main Max WS Deep Run 1% 48hr Main Max WS Deep Run 1%24hr Main Max WS Deep Run 1%18hr Main Max WS Deep Run 1%12hr Main Max WS Deep Run 1%6hr Main Max WS Deep Run 1%3hr Main Max WS Deep Run 1% 2hr Main Max WS Deep Run 1% 1hr Main Culvert Main Max WS Deep Run 1%240hr Main Max WS Deep Run 1%120hr Main Max WS Deep Run 1% 72hr Main Max WS Deep Run 1% 48hr Main Max WS Deep Run 1%24hr Main Max WS Deep Run 1%18hr Main Max WS Deep Run 1%12hr Main Max WS Deep Run 1%6hr Main Max WS Deep Run 1%3hr Main Max WS Deep Run 1% 2hr Main Max WS Deep Run 1% 1hr Main Max WS Deep Run 1%240hr Main Max WS Deep Run 1%120hr Main Max WS Deep Run 1% 72hr Main Max WS Deep Run 1% 48hr Main Max WS Deep Run 1%24hr Main Max WS Deep Run 1%18hr Main Max WS Deep Run 1%12hr Main Max WS Deep Run 1%6hr Main Max WS Deep Run 1%3hr Main Max WS Deep Run 1% 2hr Main Max WS Deep Run 1% 1hr Main Max WS Deep Run 1%240hr Main Max WS Deep Run 1%120hr Main Max WS Deep Run 1% 72hr Main Max WS Deep Run 1% 48hr Main Max WS Deep Run 1%24hr Main Max WS Deep Run 1%18hr Main Max WS Deep Run 1%12hr Main Max WS Deep Run 1%6hr Main Max WS Deep Run 1%3hr Main Max WS Deep Run 1% 2hr Main Max WS Deep Run 1% 1hr Main Max WS Deep Run 1%240hr Main Max WS Deep Run 1%120hr Main Max WS Deep Run 1% 72hr Main Max WS Deep Run 1% 48hr Main Max WS Deep Run 1%24hr Main Max WS Deep Run 1%18hr Main Max WS Deep Run 1%12hr Main Max WS Deep Run 1%6hr Main Max WS Deep Run 1%3hr Main Max WS Deep Run 1% 2hr
81 HEC-RAS River: Deep Run Reach: Main Profile: Max WS (Continued) Reach River Sta Profile Plan Q Total Min Ch El W.S. Elev Crit W.S. E.G. Elev E.G. Slope Vel Chnl Flow Area Top Width Froude # Chl (cfs) (ft) (ft) (ft) (ft) (ft/ft) (ft/s) (sq ft) (ft) Main Max WS Deep Run 1% 1hr Main Max WS Deep Run 1%240hr Main Max WS Deep Run 1%120hr Main Max WS Deep Run 1% 72hr Main Max WS Deep Run 1% 48hr Main Max WS Deep Run 1%24hr Main Max WS Deep Run 1%18hr Main Max WS Deep Run 1%12hr Main Max WS Deep Run 1%6hr Main Max WS Deep Run 1%3hr Main Max WS Deep Run 1% 2hr Main Max WS Deep Run 1% 1hr Main Max WS Deep Run 1%240hr Main Max WS Deep Run 1%120hr Main Max WS Deep Run 1% 72hr Main Max WS Deep Run 1% 48hr Main Max WS Deep Run 1%24hr Main Max WS Deep Run 1%18hr Main Max WS Deep Run 1%12hr Main Max WS Deep Run 1%6hr Main Max WS Deep Run 1%3hr Main Max WS Deep Run 1% 2hr Main Max WS Deep Run 1% 1hr Main Max WS Deep Run 1%240hr Main Max WS Deep Run 1%120hr Main Max WS Deep Run 1% 72hr Main Max WS Deep Run 1% 48hr Main Max WS Deep Run 1%24hr Main Max WS Deep Run 1%18hr Main Max WS Deep Run 1%12hr Main Max WS Deep Run 1%6hr Main Max WS Deep Run 1%3hr Main Max WS Deep Run 1% 2hr Main Max WS Deep Run 1% 1hr Main Max WS Deep Run 1%240hr Main Max WS Deep Run 1%120hr Main Max WS Deep Run 1% 72hr Main Max WS Deep Run 1% 48hr Main Max WS Deep Run 1%24hr Main Max WS Deep Run 1%18hr Main Max WS Deep Run 1%12hr Main Max WS Deep Run 1%6hr Main Max WS Deep Run 1%3hr Main Max WS Deep Run 1% 2hr Main Max WS Deep Run 1% 1hr Main Max WS Deep Run 1%240hr Main Max WS Deep Run 1%120hr Main Max WS Deep Run 1% 72hr Main Max WS Deep Run 1% 48hr Main Max WS Deep Run 1%24hr Main Max WS Deep Run 1%18hr Main Max WS Deep Run 1%12hr Main Max WS Deep Run 1%6hr Main Max WS Deep Run 1%3hr Main Max WS Deep Run 1% 2hr Main Max WS Deep Run 1% 1hr Main Max WS Deep Run 1%240hr Main Max WS Deep Run 1%120hr Main Max WS Deep Run 1% 72hr Main Max WS Deep Run 1% 48hr Main Max WS Deep Run 1%24hr Main Max WS Deep Run 1%18hr Main Max WS Deep Run 1%12hr Main Max WS Deep Run 1%6hr Main Max WS Deep Run 1%3hr Main Max WS Deep Run 1% 2hr Main Max WS Deep Run 1% 1hr Main Max WS Deep Run 1%240hr Main Max WS Deep Run 1%120hr Main Max WS Deep Run 1% 72hr Main Max WS Deep Run 1% 48hr Main Max WS Deep Run 1%24hr Main Max WS Deep Run 1%18hr Main Max WS Deep Run 1%12hr Main Max WS Deep Run 1%6hr Main Max WS Deep Run 1%3hr Main Max WS Deep Run 1% 2hr Main Max WS Deep Run 1% 1hr Main Max WS Deep Run 1%240hr
82 HEC-RAS River: Deep Run Reach: Main Profile: Max WS (Continued) Reach River Sta Profile Plan Q Total Min Ch El W.S. Elev Crit W.S. E.G. Elev E.G. Slope Vel Chnl Flow Area Top Width Froude # Chl (cfs) (ft) (ft) (ft) (ft) (ft/ft) (ft/s) (sq ft) (ft) Main Max WS Deep Run 1%120hr Main Max WS Deep Run 1% 72hr Main Max WS Deep Run 1% 48hr Main Max WS Deep Run 1%24hr Main Max WS Deep Run 1%18hr Main Max WS Deep Run 1%12hr Main Max WS Deep Run 1%6hr Main Max WS Deep Run 1%3hr Main Max WS Deep Run 1% 2hr Main Max WS Deep Run 1% 1hr Main Max WS Deep Run 1%240hr Main Max WS Deep Run 1%120hr Main Max WS Deep Run 1% 72hr Main Max WS Deep Run 1% 48hr Main Max WS Deep Run 1%24hr Main Max WS Deep Run 1%18hr Main Max WS Deep Run 1%12hr Main Max WS Deep Run 1%6hr Main Max WS Deep Run 1%3hr Main Max WS Deep Run 1% 2hr Main Max WS Deep Run 1% 1hr Main Max WS Deep Run 1%240hr Main Max WS Deep Run 1%120hr Main Max WS Deep Run 1% 72hr Main Max WS Deep Run 1% 48hr Main Max WS Deep Run 1%24hr Main Max WS Deep Run 1%18hr Main Max WS Deep Run 1%12hr Main Max WS Deep Run 1%6hr Main Max WS Deep Run 1%3hr Main Max WS Deep Run 1% 2hr Main Max WS Deep Run 1% 1hr Main Max WS Deep Run 1%240hr Main Max WS Deep Run 1%120hr Main Max WS Deep Run 1% 72hr Main Max WS Deep Run 1% 48hr Main Max WS Deep Run 1%24hr Main Max WS Deep Run 1%18hr Main Max WS Deep Run 1%12hr Main Max WS Deep Run 1%6hr Main Max WS Deep Run 1%3hr Main Max WS Deep Run 1% 2hr Main Max WS Deep Run 1% 1hr Main Max WS Deep Run 1%240hr Main Max WS Deep Run 1%120hr Main Max WS Deep Run 1% 72hr Main Max WS Deep Run 1% 48hr Main Max WS Deep Run 1%24hr Main Max WS Deep Run 1%18hr Main Max WS Deep Run 1%12hr Main Max WS Deep Run 1%6hr Main Max WS Deep Run 1%3hr Main Max WS Deep Run 1% 2hr Main Max WS Deep Run 1% 1hr Main Max WS Deep Run 1%240hr Main Max WS Deep Run 1%120hr Main Max WS Deep Run 1% 72hr Main Max WS Deep Run 1% 48hr Main Max WS Deep Run 1%24hr Main Max WS Deep Run 1%18hr Main Max WS Deep Run 1%12hr Main Max WS Deep Run 1%6hr Main Max WS Deep Run 1%3hr Main Max WS Deep Run 1% 2hr Main Max WS Deep Run 1% 1hr Main Max WS Deep Run 1%240hr Main Max WS Deep Run 1%120hr Main Max WS Deep Run 1% 72hr Main Max WS Deep Run 1% 48hr Main Max WS Deep Run 1%24hr Main Max WS Deep Run 1%18hr Main Max WS Deep Run 1%12hr Main Max WS Deep Run 1%6hr Main Max WS Deep Run 1%3hr Main Max WS Deep Run 1% 2hr Main Max WS Deep Run 1% 1hr Main Max WS Deep Run 1%240hr Main Max WS Deep Run 1%120hr Main Max WS Deep Run 1% 72hr Main Max WS Deep Run 1% 48hr
83 HEC-RAS River: Deep Run Reach: Main Profile: Max WS (Continued) Reach River Sta Profile Plan Q Total Min Ch El W.S. Elev Crit W.S. E.G. Elev E.G. Slope Vel Chnl Flow Area Top Width Froude # Chl (cfs) (ft) (ft) (ft) (ft) (ft/ft) (ft/s) (sq ft) (ft) Main Max WS Deep Run 1%24hr Main Max WS Deep Run 1%18hr Main Max WS Deep Run 1%12hr Main Max WS Deep Run 1%6hr Main Max WS Deep Run 1%3hr Main Max WS Deep Run 1% 2hr Main Max WS Deep Run 1% 1hr Main Max WS Deep Run 1%240hr Main Max WS Deep Run 1%120hr Main Max WS Deep Run 1% 72hr Main Max WS Deep Run 1% 48hr Main Max WS Deep Run 1%24hr Main Max WS Deep Run 1%18hr Main Max WS Deep Run 1%12hr Main Max WS Deep Run 1%6hr Main Max WS Deep Run 1%3hr Main Max WS Deep Run 1% 2hr Main Max WS Deep Run 1% 1hr Main Max WS Deep Run 1%240hr Main Max WS Deep Run 1%120hr Main Max WS Deep Run 1% 72hr Main Max WS Deep Run 1% 48hr Main Max WS Deep Run 1%24hr Main Max WS Deep Run 1%18hr Main Max WS Deep Run 1%12hr Main Max WS Deep Run 1%6hr Main Max WS Deep Run 1%3hr Main Max WS Deep Run 1% 2hr Main Max WS Deep Run 1% 1hr Main Max WS Deep Run 1%240hr Main Max WS Deep Run 1%120hr Main Max WS Deep Run 1% 72hr Main Max WS Deep Run 1% 48hr Main Max WS Deep Run 1%24hr Main Max WS Deep Run 1%18hr Main Max WS Deep Run 1%12hr Main Max WS Deep Run 1%6hr Main Max WS Deep Run 1%3hr Main Max WS Deep Run 1% 2hr Main Max WS Deep Run 1% 1hr Main Max WS Deep Run 1%240hr Main Max WS Deep Run 1%120hr Main Max WS Deep Run 1% 72hr Main Max WS Deep Run 1% 48hr Main Max WS Deep Run 1%24hr Main Max WS Deep Run 1%18hr Main Max WS Deep Run 1%12hr Main Max WS Deep Run 1%6hr Main Max WS Deep Run 1%3hr Main Max WS Deep Run 1% 2hr Main Max WS Deep Run 1% 1hr Main Max WS Deep Run 1%240hr Main Max WS Deep Run 1%120hr Main Max WS Deep Run 1% 72hr Main Max WS Deep Run 1% 48hr Main Max WS Deep Run 1%24hr Main Max WS Deep Run 1%18hr Main Max WS Deep Run 1%12hr Main Max WS Deep Run 1%6hr Main Max WS Deep Run 1%3hr Main Max WS Deep Run 1% 2hr Main Max WS Deep Run 1% 1hr Main Max WS Deep Run 1%240hr Main Max WS Deep Run 1%120hr Main Max WS Deep Run 1% 72hr Main Max WS Deep Run 1% 48hr Main Max WS Deep Run 1%24hr Main Max WS Deep Run 1%18hr Main Max WS Deep Run 1%12hr Main Max WS Deep Run 1%6hr Main Max WS Deep Run 1%3hr Main Max WS Deep Run 1% 2hr Main Max WS Deep Run 1% 1hr Main Max WS Deep Run 1%240hr Main Max WS Deep Run 1%120hr Main Max WS Deep Run 1% 72hr Main Max WS Deep Run 1% 48hr Main Max WS Deep Run 1%24hr Main Max WS Deep Run 1%18hr Main Max WS Deep Run 1%12hr
84 HEC-RAS River: Deep Run Reach: Main Profile: Max WS (Continued) Reach River Sta Profile Plan Q Total Min Ch El W.S. Elev Crit W.S. E.G. Elev E.G. Slope Vel Chnl Flow Area Top Width Froude # Chl (cfs) (ft) (ft) (ft) (ft) (ft/ft) (ft/s) (sq ft) (ft) Main Max WS Deep Run 1%6hr Main Max WS Deep Run 1%3hr Main Max WS Deep Run 1% 2hr Main Max WS Deep Run 1% 1hr Main Max WS Deep Run 1%240hr Main Max WS Deep Run 1%120hr Main Max WS Deep Run 1% 72hr Main Max WS Deep Run 1% 48hr Main Max WS Deep Run 1%24hr Main Max WS Deep Run 1%18hr Main Max WS Deep Run 1%12hr Main Max WS Deep Run 1%6hr Main Max WS Deep Run 1%3hr Main Max WS Deep Run 1% 2hr Main Max WS Deep Run 1% 1hr Main Max WS Deep Run 1%240hr Main Max WS Deep Run 1%120hr Main Max WS Deep Run 1% 72hr Main Max WS Deep Run 1% 48hr Main Max WS Deep Run 1%24hr Main Max WS Deep Run 1%18hr Main Max WS Deep Run 1%12hr Main Max WS Deep Run 1%6hr Main Max WS Deep Run 1%3hr Main Max WS Deep Run 1% 2hr Main Max WS Deep Run 1% 1hr Main Max WS Deep Run 1%240hr Main Max WS Deep Run 1%120hr Main Max WS Deep Run 1% 72hr Main Max WS Deep Run 1% 48hr Main Max WS Deep Run 1%24hr Main Max WS Deep Run 1%18hr Main Max WS Deep Run 1%12hr Main Max WS Deep Run 1%6hr Main Max WS Deep Run 1%3hr Main Max WS Deep Run 1% 2hr Main Max WS Deep Run 1% 1hr Main Max WS Deep Run 1%240hr Main Max WS Deep Run 1%120hr Main Max WS Deep Run 1% 72hr Main Max WS Deep Run 1% 48hr Main Max WS Deep Run 1%24hr Main Max WS Deep Run 1%18hr Main Max WS Deep Run 1%12hr Main Max WS Deep Run 1%6hr Main Max WS Deep Run 1%3hr Main Max WS Deep Run 1% 2hr Main Max WS Deep Run 1% 1hr Main Max WS Deep Run 1%240hr Main Max WS Deep Run 1%120hr Main Max WS Deep Run 1% 72hr Main Max WS Deep Run 1% 48hr Main Max WS Deep Run 1%24hr Main Max WS Deep Run 1%18hr Main Max WS Deep Run 1%12hr Main Max WS Deep Run 1%6hr Main Max WS Deep Run 1%3hr Main Max WS Deep Run 1% 2hr Main Max WS Deep Run 1% 1hr Main Max WS Deep Run 1%240hr Main Max WS Deep Run 1%120hr Main Max WS Deep Run 1% 72hr Main Max WS Deep Run 1% 48hr Main Max WS Deep Run 1%24hr Main Max WS Deep Run 1%18hr Main Max WS Deep Run 1%12hr Main Max WS Deep Run 1%6hr Main Max WS Deep Run 1%3hr Main Max WS Deep Run 1% 2hr Main Max WS Deep Run 1% 1hr Main Max WS Deep Run 1%240hr Main Max WS Deep Run 1%120hr Main Max WS Deep Run 1% 72hr Main Max WS Deep Run 1% 48hr Main Max WS Deep Run 1%24hr Main Max WS Deep Run 1%18hr Main Max WS Deep Run 1%12hr Main Max WS Deep Run 1%6hr Main Max WS Deep Run 1%3hr Main Max WS Deep Run 1% 2hr
85 HEC-RAS River: Deep Run Reach: Main Profile: Max WS (Continued) Reach River Sta Profile Plan Q Total Min Ch El W.S. Elev Crit W.S. E.G. Elev E.G. Slope Vel Chnl Flow Area Top Width Froude # Chl (cfs) (ft) (ft) (ft) (ft) (ft/ft) (ft/s) (sq ft) (ft) Main Max WS Deep Run 1% 1hr Main Max WS Deep Run 1%240hr Main Max WS Deep Run 1%120hr Main Max WS Deep Run 1% 72hr Main Max WS Deep Run 1% 48hr Main Max WS Deep Run 1%24hr Main Max WS Deep Run 1%18hr Main Max WS Deep Run 1%12hr Main Max WS Deep Run 1%6hr Main Max WS Deep Run 1%3hr Main Max WS Deep Run 1% 2hr Main Max WS Deep Run 1% 1hr Main Max WS Deep Run 1%240hr Main Max WS Deep Run 1%120hr Main Max WS Deep Run 1% 72hr Main Max WS Deep Run 1% 48hr Main Max WS Deep Run 1%24hr Main Max WS Deep Run 1%18hr Main Max WS Deep Run 1%12hr Main Max WS Deep Run 1%6hr Main Max WS Deep Run 1%3hr Main Max WS Deep Run 1% 2hr Main Max WS Deep Run 1% 1hr Main Max WS Deep Run 1%240hr Main Max WS Deep Run 1%120hr Main Max WS Deep Run 1% 72hr Main Max WS Deep Run 1% 48hr Main Max WS Deep Run 1%24hr Main Max WS Deep Run 1%18hr Main Max WS Deep Run 1%12hr Main Max WS Deep Run 1%6hr Main Max WS Deep Run 1%3hr Main Max WS Deep Run 1% 2hr Main Max WS Deep Run 1% 1hr Main Max WS Deep Run 1%240hr Main Max WS Deep Run 1%120hr Main Max WS Deep Run 1% 72hr Main Max WS Deep Run 1% 48hr Main Max WS Deep Run 1%24hr Main Max WS Deep Run 1%18hr Main Max WS Deep Run 1%12hr Main Max WS Deep Run 1%6hr Main Max WS Deep Run 1%3hr Main Max WS Deep Run 1% 2hr Main Max WS Deep Run 1% 1hr Main Max WS Deep Run 1%240hr Main Max WS Deep Run 1%120hr Main Max WS Deep Run 1% 72hr Main Max WS Deep Run 1% 48hr Main Max WS Deep Run 1%24hr Main Max WS Deep Run 1%18hr Main Max WS Deep Run 1%12hr Main Max WS Deep Run 1%6hr Main Max WS Deep Run 1%3hr Main Max WS Deep Run 1% 2hr Main Max WS Deep Run 1% 1hr Main Max WS Deep Run 1%240hr Main Max WS Deep Run 1%120hr Main Max WS Deep Run 1% 72hr Main Max WS Deep Run 1% 48hr Main Max WS Deep Run 1%24hr Main Max WS Deep Run 1%18hr Main Max WS Deep Run 1%12hr Main Max WS Deep Run 1%6hr Main Max WS Deep Run 1%3hr Main Max WS Deep Run 1% 2hr Main Max WS Deep Run 1% 1hr Main Max WS Deep Run 1%240hr Main Max WS Deep Run 1%120hr Main Max WS Deep Run 1% 72hr Main Max WS Deep Run 1% 48hr Main Max WS Deep Run 1%24hr Main Max WS Deep Run 1%18hr Main Max WS Deep Run 1%12hr Main Max WS Deep Run 1%6hr Main Max WS Deep Run 1%3hr Main Max WS Deep Run 1% 2hr Main Max WS Deep Run 1% 1hr Main Max WS Deep Run 1%240hr
86 HEC-RAS River: Deep Run Reach: Main Profile: Max WS (Continued) Reach River Sta Profile Plan Q Total Min Ch El W.S. Elev Crit W.S. E.G. Elev E.G. Slope Vel Chnl Flow Area Top Width Froude # Chl (cfs) (ft) (ft) (ft) (ft) (ft/ft) (ft/s) (sq ft) (ft) Main Max WS Deep Run 1%120hr Main Max WS Deep Run 1% 72hr Main Max WS Deep Run 1% 48hr Main Max WS Deep Run 1%24hr Main Max WS Deep Run 1%18hr Main Max WS Deep Run 1%12hr Main Max WS Deep Run 1%6hr Main Max WS Deep Run 1%3hr Main Max WS Deep Run 1% 2hr Main Max WS Deep Run 1% 1hr Main Max WS Deep Run 1%240hr Main Max WS Deep Run 1%120hr Main Max WS Deep Run 1% 72hr Main Max WS Deep Run 1% 48hr Main Max WS Deep Run 1%24hr Main Max WS Deep Run 1%18hr Main Max WS Deep Run 1%12hr Main Max WS Deep Run 1%6hr Main Max WS Deep Run 1%3hr Main Max WS Deep Run 1% 2hr Main Max WS Deep Run 1% 1hr Main Max WS Deep Run 1%240hr Main Max WS Deep Run 1%120hr Main Max WS Deep Run 1% 72hr Main Max WS Deep Run 1% 48hr Main Max WS Deep Run 1%24hr Main Max WS Deep Run 1%18hr Main Max WS Deep Run 1%12hr Main Max WS Deep Run 1%6hr Main Max WS Deep Run 1%3hr Main Max WS Deep Run 1% 2hr Main Max WS Deep Run 1% 1hr Main Max WS Deep Run 1%240hr Main Max WS Deep Run 1%120hr Main Max WS Deep Run 1% 72hr Main Max WS Deep Run 1% 48hr Main Max WS Deep Run 1%24hr Main Max WS Deep Run 1%18hr Main Max WS Deep Run 1%12hr Main Max WS Deep Run 1%6hr Main Max WS Deep Run 1%3hr Main Max WS Deep Run 1% 2hr Main Max WS Deep Run 1% 1hr Main Max WS Deep Run 1%240hr Main Max WS Deep Run 1%120hr Main Max WS Deep Run 1% 72hr Main Max WS Deep Run 1% 48hr Main Max WS Deep Run 1%24hr Main Max WS Deep Run 1%18hr Main Max WS Deep Run 1%12hr Main Max WS Deep Run 1%6hr Main Max WS Deep Run 1%3hr Main Max WS Deep Run 1% 2hr Main Max WS Deep Run 1% 1hr Main Max WS Deep Run 1%240hr Main Max WS Deep Run 1%120hr Main Max WS Deep Run 1% 72hr Main Max WS Deep Run 1% 48hr Main Max WS Deep Run 1%24hr Main Max WS Deep Run 1%18hr Main Max WS Deep Run 1%12hr Main Max WS Deep Run 1%6hr Main Max WS Deep Run 1%3hr Main Max WS Deep Run 1% 2hr Main Max WS Deep Run 1% 1hr Main Max WS Deep Run 1%240hr Main Max WS Deep Run 1%120hr Main Max WS Deep Run 1% 72hr Main Max WS Deep Run 1% 48hr Main Max WS Deep Run 1%24hr Main Max WS Deep Run 1%18hr Main Max WS Deep Run 1%12hr Main Max WS Deep Run 1%6hr Main Max WS Deep Run 1%3hr Main Max WS Deep Run 1% 2hr Main Max WS Deep Run 1% 1hr Main Max WS Deep Run 1%240hr Main Max WS Deep Run 1%120hr Main Max WS Deep Run 1% 72hr Main Max WS Deep Run 1% 48hr
87 HEC-RAS River: Deep Run Reach: Main Profile: Max WS (Continued) Reach River Sta Profile Plan Q Total Min Ch El W.S. Elev Crit W.S. E.G. Elev E.G. Slope Vel Chnl Flow Area Top Width Froude # Chl (cfs) (ft) (ft) (ft) (ft) (ft/ft) (ft/s) (sq ft) (ft) Main Max WS Deep Run 1%24hr Main Max WS Deep Run 1%18hr Main Max WS Deep Run 1%12hr Main Max WS Deep Run 1%6hr Main Max WS Deep Run 1%3hr Main Max WS Deep Run 1% 2hr Main Max WS Deep Run 1% 1hr Main Max WS Deep Run 1%240hr Main Max WS Deep Run 1%120hr Main Max WS Deep Run 1% 72hr Main Max WS Deep Run 1% 48hr Main Max WS Deep Run 1%24hr Main Max WS Deep Run 1%18hr Main Max WS Deep Run 1%12hr Main Max WS Deep Run 1%6hr Main Max WS Deep Run 1%3hr Main Max WS Deep Run 1% 2hr Main Max WS Deep Run 1% 1hr Main Max WS Deep Run 1%240hr Main Max WS Deep Run 1%120hr Main Max WS Deep Run 1% 72hr Main Max WS Deep Run 1% 48hr Main Max WS Deep Run 1%24hr Main Max WS Deep Run 1%18hr Main Max WS Deep Run 1%12hr Main Max WS Deep Run 1%6hr Main Max WS Deep Run 1%3hr Main Max WS Deep Run 1% 2hr Main Max WS Deep Run 1% 1hr Main Max WS Deep Run 1%240hr Main Max WS Deep Run 1%120hr Main Max WS Deep Run 1% 72hr Main Max WS Deep Run 1% 48hr Main Max WS Deep Run 1%24hr Main Max WS Deep Run 1%18hr Main Max WS Deep Run 1%12hr Main Max WS Deep Run 1%6hr Main Max WS Deep Run 1%3hr Main Max WS Deep Run 1% 2hr Main Max WS Deep Run 1% 1hr Main Max WS Deep Run 1%240hr Main Max WS Deep Run 1%120hr Main Max WS Deep Run 1% 72hr Main Max WS Deep Run 1% 48hr Main Max WS Deep Run 1%24hr Main Max WS Deep Run 1%18hr Main Max WS Deep Run 1%12hr Main Max WS Deep Run 1%6hr Main Max WS Deep Run 1%3hr Main Max WS Deep Run 1% 2hr Main Max WS Deep Run 1% 1hr Main 9923 Max WS Deep Run 1%240hr Main 9923 Max WS Deep Run 1%120hr Main 9923 Max WS Deep Run 1% 72hr Main 9923 Max WS Deep Run 1% 48hr Main 9923 Max WS Deep Run 1%24hr Main 9923 Max WS Deep Run 1%18hr Main 9923 Max WS Deep Run 1%12hr Main 9923 Max WS Deep Run 1%6hr Main 9923 Max WS Deep Run 1%3hr Main 9923 Max WS Deep Run 1% 2hr Main 9923 Max WS Deep Run 1% 1hr Main 9814 Max WS Deep Run 1%240hr Main 9814 Max WS Deep Run 1%120hr Main 9814 Max WS Deep Run 1% 72hr Main 9814 Max WS Deep Run 1% 48hr Main 9814 Max WS Deep Run 1%24hr Main 9814 Max WS Deep Run 1%18hr Main 9814 Max WS Deep Run 1%12hr Main 9814 Max WS Deep Run 1%6hr Main 9814 Max WS Deep Run 1%3hr Main 9814 Max WS Deep Run 1% 2hr Main 9814 Max WS Deep Run 1% 1hr Main 9694 Max WS Deep Run 1%240hr Main 9694 Max WS Deep Run 1%120hr Main 9694 Max WS Deep Run 1% 72hr Main 9694 Max WS Deep Run 1% 48hr Main 9694 Max WS Deep Run 1%24hr Main 9694 Max WS Deep Run 1%18hr Main 9694 Max WS Deep Run 1%12hr
88 HEC-RAS River: Deep Run Reach: Main Profile: Max WS (Continued) Reach River Sta Profile Plan Q Total Min Ch El W.S. Elev Crit W.S. E.G. Elev E.G. Slope Vel Chnl Flow Area Top Width Froude # Chl (cfs) (ft) (ft) (ft) (ft) (ft/ft) (ft/s) (sq ft) (ft) Main 9694 Max WS Deep Run 1%6hr Main 9694 Max WS Deep Run 1%3hr Main 9694 Max WS Deep Run 1% 2hr Main 9694 Max WS Deep Run 1% 1hr Main 9582 Max WS Deep Run 1%240hr Main 9582 Max WS Deep Run 1%120hr Main 9582 Max WS Deep Run 1% 72hr Main 9582 Max WS Deep Run 1% 48hr Main 9582 Max WS Deep Run 1%24hr Main 9582 Max WS Deep Run 1%18hr Main 9582 Max WS Deep Run 1%12hr Main 9582 Max WS Deep Run 1%6hr Main 9582 Max WS Deep Run 1%3hr Main 9582 Max WS Deep Run 1% 2hr Main 9582 Max WS Deep Run 1% 1hr Main 9471 Max WS Deep Run 1%240hr Main 9471 Max WS Deep Run 1%120hr Main 9471 Max WS Deep Run 1% 72hr Main 9471 Max WS Deep Run 1% 48hr Main 9471 Max WS Deep Run 1%24hr Main 9471 Max WS Deep Run 1%18hr Main 9471 Max WS Deep Run 1%12hr Main 9471 Max WS Deep Run 1%6hr Main 9471 Max WS Deep Run 1%3hr Main 9471 Max WS Deep Run 1% 2hr Main 9471 Max WS Deep Run 1% 1hr Main 9284 Max WS Deep Run 1%240hr Main 9284 Max WS Deep Run 1%120hr Main 9284 Max WS Deep Run 1% 72hr Main 9284 Max WS Deep Run 1% 48hr Main 9284 Max WS Deep Run 1%24hr Main 9284 Max WS Deep Run 1%18hr Main 9284 Max WS Deep Run 1%12hr Main 9284 Max WS Deep Run 1%6hr Main 9284 Max WS Deep Run 1%3hr Main 9284 Max WS Deep Run 1% 2hr Main 9284 Max WS Deep Run 1% 1hr Main 9032 Max WS Deep Run 1%240hr Main 9032 Max WS Deep Run 1%120hr Main 9032 Max WS Deep Run 1% 72hr Main 9032 Max WS Deep Run 1% 48hr Main 9032 Max WS Deep Run 1%24hr Main 9032 Max WS Deep Run 1%18hr Main 9032 Max WS Deep Run 1%12hr Main 9032 Max WS Deep Run 1%6hr Main 9032 Max WS Deep Run 1%3hr Main 9032 Max WS Deep Run 1% 2hr Main 9032 Max WS Deep Run 1% 1hr Main 8800 Max WS Deep Run 1%240hr Main 8800 Max WS Deep Run 1%120hr Main 8800 Max WS Deep Run 1% 72hr Main 8800 Max WS Deep Run 1% 48hr Main 8800 Max WS Deep Run 1%24hr Main 8800 Max WS Deep Run 1%18hr Main 8800 Max WS Deep Run 1%12hr Main 8800 Max WS Deep Run 1%6hr Main 8800 Max WS Deep Run 1%3hr Main 8800 Max WS Deep Run 1% 2hr Main 8800 Max WS Deep Run 1% 1hr Main 8680 Max WS Deep Run 1%240hr Main 8680 Max WS Deep Run 1%120hr Main 8680 Max WS Deep Run 1% 72hr Main 8680 Max WS Deep Run 1% 48hr Main 8680 Max WS Deep Run 1%24hr Main 8680 Max WS Deep Run 1%18hr Main 8680 Max WS Deep Run 1%12hr Main 8680 Max WS Deep Run 1%6hr Main 8680 Max WS Deep Run 1%3hr Main 8680 Max WS Deep Run 1% 2hr Main 8680 Max WS Deep Run 1% 1hr Main 8546 Max WS Deep Run 1%240hr Main 8546 Max WS Deep Run 1%120hr Main 8546 Max WS Deep Run 1% 72hr Main 8546 Max WS Deep Run 1% 48hr Main 8546 Max WS Deep Run 1%24hr Main 8546 Max WS Deep Run 1%18hr Main 8546 Max WS Deep Run 1%12hr Main 8546 Max WS Deep Run 1%6hr Main 8546 Max WS Deep Run 1%3hr Main 8546 Max WS Deep Run 1% 2hr
89 HEC-RAS River: Deep Run Reach: Main Profile: Max WS (Continued) Reach River Sta Profile Plan Q Total Min Ch El W.S. Elev Crit W.S. E.G. Elev E.G. Slope Vel Chnl Flow Area Top Width Froude # Chl (cfs) (ft) (ft) (ft) (ft) (ft/ft) (ft/s) (sq ft) (ft) Main 8546 Max WS Deep Run 1% 1hr Main 8431 Max WS Deep Run 1%240hr Main 8431 Max WS Deep Run 1%120hr Main 8431 Max WS Deep Run 1% 72hr Main 8431 Max WS Deep Run 1% 48hr Main 8431 Max WS Deep Run 1%24hr Main 8431 Max WS Deep Run 1%18hr Main 8431 Max WS Deep Run 1%12hr Main 8431 Max WS Deep Run 1%6hr Main 8431 Max WS Deep Run 1%3hr Main 8431 Max WS Deep Run 1% 2hr Main 8431 Max WS Deep Run 1% 1hr Main 8318 Max WS Deep Run 1%240hr Main 8318 Max WS Deep Run 1%120hr Main 8318 Max WS Deep Run 1% 72hr Main 8318 Max WS Deep Run 1% 48hr Main 8318 Max WS Deep Run 1%24hr Main 8318 Max WS Deep Run 1%18hr Main 8318 Max WS Deep Run 1%12hr Main 8318 Max WS Deep Run 1%6hr Main 8318 Max WS Deep Run 1%3hr Main 8318 Max WS Deep Run 1% 2hr Main 8318 Max WS Deep Run 1% 1hr Main 8190 Max WS Deep Run 1%240hr Main 8190 Max WS Deep Run 1%120hr Main 8190 Max WS Deep Run 1% 72hr Main 8190 Max WS Deep Run 1% 48hr Main 8190 Max WS Deep Run 1%24hr Main 8190 Max WS Deep Run 1%18hr Main 8190 Max WS Deep Run 1%12hr Main 8190 Max WS Deep Run 1%6hr Main 8190 Max WS Deep Run 1%3hr Main 8190 Max WS Deep Run 1% 2hr Main 8190 Max WS Deep Run 1% 1hr Main 8009 Max WS Deep Run 1%240hr Main 8009 Max WS Deep Run 1%120hr Main 8009 Max WS Deep Run 1% 72hr Main 8009 Max WS Deep Run 1% 48hr Main 8009 Max WS Deep Run 1%24hr Main 8009 Max WS Deep Run 1%18hr Main 8009 Max WS Deep Run 1%12hr Main 8009 Max WS Deep Run 1%6hr Main 8009 Max WS Deep Run 1%3hr Main 8009 Max WS Deep Run 1% 2hr Main 8009 Max WS Deep Run 1% 1hr Main 7875 Max WS Deep Run 1%240hr Main 7875 Max WS Deep Run 1%120hr Main 7875 Max WS Deep Run 1% 72hr Main 7875 Max WS Deep Run 1% 48hr Main 7875 Max WS Deep Run 1%24hr Main 7875 Max WS Deep Run 1%18hr Main 7875 Max WS Deep Run 1%12hr Main 7875 Max WS Deep Run 1%6hr Main 7875 Max WS Deep Run 1%3hr Main 7875 Max WS Deep Run 1% 2hr Main 7875 Max WS Deep Run 1% 1hr Main 7668 Max WS Deep Run 1%240hr Main 7668 Max WS Deep Run 1%120hr Main 7668 Max WS Deep Run 1% 72hr Main 7668 Max WS Deep Run 1% 48hr Main 7668 Max WS Deep Run 1%24hr Main 7668 Max WS Deep Run 1%18hr Main 7668 Max WS Deep Run 1%12hr Main 7668 Max WS Deep Run 1%6hr Main 7668 Max WS Deep Run 1%3hr Main 7668 Max WS Deep Run 1% 2hr Main 7668 Max WS Deep Run 1% 1hr Main 7419 Max WS Deep Run 1%240hr Main 7419 Max WS Deep Run 1%120hr Main 7419 Max WS Deep Run 1% 72hr Main 7419 Max WS Deep Run 1% 48hr Main 7419 Max WS Deep Run 1%24hr Main 7419 Max WS Deep Run 1%18hr Main 7419 Max WS Deep Run 1%12hr Main 7419 Max WS Deep Run 1%6hr Main 7419 Max WS Deep Run 1%3hr Main 7419 Max WS Deep Run 1% 2hr Main 7419 Max WS Deep Run 1% 1hr Main 7237 Max WS Deep Run 1%240hr
90 HEC-RAS River: Deep Run Reach: Main Profile: Max WS (Continued) Reach River Sta Profile Plan Q Total Min Ch El W.S. Elev Crit W.S. E.G. Elev E.G. Slope Vel Chnl Flow Area Top Width Froude # Chl (cfs) (ft) (ft) (ft) (ft) (ft/ft) (ft/s) (sq ft) (ft) Main 7237 Max WS Deep Run 1%120hr Main 7237 Max WS Deep Run 1% 72hr Main 7237 Max WS Deep Run 1% 48hr Main 7237 Max WS Deep Run 1%24hr Main 7237 Max WS Deep Run 1%18hr Main 7237 Max WS Deep Run 1%12hr Main 7237 Max WS Deep Run 1%6hr Main 7237 Max WS Deep Run 1%3hr Main 7237 Max WS Deep Run 1% 2hr Main 7237 Max WS Deep Run 1% 1hr Main 7125 Max WS Deep Run 1%240hr Main 7125 Max WS Deep Run 1%120hr Main 7125 Max WS Deep Run 1% 72hr Main 7125 Max WS Deep Run 1% 48hr Main 7125 Max WS Deep Run 1%24hr Main 7125 Max WS Deep Run 1%18hr Main 7125 Max WS Deep Run 1%12hr Main 7125 Max WS Deep Run 1%6hr Main 7125 Max WS Deep Run 1%3hr Main 7125 Max WS Deep Run 1% 2hr Main 7125 Max WS Deep Run 1% 1hr Main 7000 Max WS Deep Run 1%240hr Main 7000 Max WS Deep Run 1%120hr Main 7000 Max WS Deep Run 1% 72hr Main 7000 Max WS Deep Run 1% 48hr Main 7000 Max WS Deep Run 1%24hr Main 7000 Max WS Deep Run 1%18hr Main 7000 Max WS Deep Run 1%12hr Main 7000 Max WS Deep Run 1%6hr Main 7000 Max WS Deep Run 1%3hr Main 7000 Max WS Deep Run 1% 2hr Main 7000 Max WS Deep Run 1% 1hr Main 6980 Max WS Deep Run 1% 48hr Main 6910 Max WS Deep Run 1% 48hr Main 6658 Max WS Deep Run 1% 48hr Main 6547 Max WS Deep Run 1% 48hr Main 5987 Max WS Deep Run 1% 48hr Main 5711 Max WS Deep Run 1% 48hr Main 5477 Max WS Deep Run 1% 48hr
91 HEC-RAS River: 13th_Street Reach: 1 Profile: Max WS Reach River Sta Profile Plan Q Total Min Ch El W.S. Elev Crit W.S. E.G. Elev E.G. Slope Vel Chnl Flow Area Top Width Froude # Chl (cfs) (ft) (ft) (ft) (ft) (ft/ft) (ft/s) (sq ft) (ft) Max WS 13th_0.2%48hr Max WS 13thOvrflw1%48hr Max WS 13th_2%48hr Max WS 13th_10%48hr Max WS 13th_0.2%48hr Max WS 13thOvrflw1%48hr Max WS 13th_2%48hr Max WS 13th_10%48hr Max WS 13th_0.2%48hr Max WS 13thOvrflw1%48hr Max WS 13th_2%48hr Max WS 13th_10%48hr Max WS 13th_0.2%48hr Max WS 13thOvrflw1%48hr Max WS 13th_2%48hr Max WS 13th_10%48hr Max WS 13th_0.2%48hr Max WS 13thOvrflw1%48hr Max WS 13th_2%48hr Max WS 13th_10%48hr Max WS 13th_0.2%48hr Max WS 13thOvrflw1%48hr Max WS 13th_2%48hr Max WS 13th_10%48hr Culvert Max WS 13th_0.2%48hr Max WS 13thOvrflw1%48hr Max WS 13th_2%48hr Max WS 13th_10%48hr Max WS 13th_0.2%48hr Max WS 13thOvrflw1%48hr Max WS 13th_2%48hr Max WS 13th_10%48hr Max WS 13th_0.2%48hr Max WS 13thOvrflw1%48hr Max WS 13th_2%48hr Max WS 13th_10%48hr Max WS 13th_0.2%48hr Max WS 13thOvrflw1%48hr Max WS 13th_2%48hr Max WS 13th_10%48hr Max WS 13th_0.2%48hr Max WS 13thOvrflw1%48hr Max WS 13th_2%48hr Max WS 13th_10%48hr Max WS 13th_0.2%48hr Max WS 13thOvrflw1%48hr Max WS 13th_2%48hr Max WS 13th_10%48hr Bridge Max WS 13th_0.2%48hr Max WS 13thOvrflw1%48hr Max WS 13th_2%48hr Max WS 13th_10%48hr Max WS 13th_0.2%48hr Max WS 13thOvrflw1%48hr Max WS 13th_2%48hr Max WS 13th_10%48hr
92 HEC-RAS River: Big_Run_Ex Reach: 2 Profile: Max WS Reach River Sta Profile Plan Q Total Min Ch El W.S. Elev Crit W.S. E.G. Elev E.G. Slope Vel Chnl Flow Area Top Width Froude # Chl (cfs) (ft) (ft) (ft) (ft) (ft/ft) (ft/s) (sq ft) (ft) Max WS BigRun1%240hr Max WS BigRun1%120hr Max WS BigRun1%72hr Max WS Big Run1% Max WS BigRun1%24hr Max WS BigRun1%18hr Max WS BigRun1%12hr Max WS BigRun1%6hr Max WS BigRun1%3hr Max WS BigRun1%2hr Max WS BigRun1%1hr Max WS BigRun1%240hr Max WS BigRun1%120hr Max WS BigRun1%72hr Max WS Big Run1% Max WS BigRun1%24hr Max WS BigRun1%18hr Max WS BigRun1%12hr Max WS BigRun1%6hr Max WS BigRun1%3hr Max WS BigRun1%2hr Max WS BigRun1%1hr Max WS BigRun1%240hr Max WS BigRun1%120hr Max WS BigRun1%72hr Max WS Big Run1% Max WS BigRun1%24hr Max WS BigRun1%18hr Max WS BigRun1%12hr Max WS BigRun1%6hr Max WS BigRun1%3hr Max WS BigRun1%2hr Max WS BigRun1%1hr Bridge Max WS BigRun1%240hr Max WS BigRun1%120hr Max WS BigRun1%72hr Max WS Big Run1% Max WS BigRun1%24hr Max WS BigRun1%18hr Max WS BigRun1%12hr Max WS BigRun1%6hr Max WS BigRun1%3hr Max WS BigRun1%2hr Max WS BigRun1%1hr Max WS BigRun1%240hr Max WS BigRun1%120hr Max WS BigRun1%72hr Max WS Big Run1% Max WS BigRun1%24hr Max WS BigRun1%18hr Max WS BigRun1%12hr Max WS BigRun1%6hr Max WS BigRun1%3hr Max WS BigRun1%2hr Max WS BigRun1%1hr Bridge Max WS BigRun1%240hr Max WS BigRun1%120hr Max WS BigRun1%72hr Max WS Big Run1% Max WS BigRun1%24hr Max WS BigRun1%18hr Max WS BigRun1%12hr Max WS BigRun1%6hr Max WS BigRun1%3hr Max WS BigRun1%2hr Max WS BigRun1%1hr Max WS BigRun1%240hr Max WS BigRun1%120hr Max WS BigRun1%72hr Max WS Big Run1% Max WS BigRun1%24hr Max WS BigRun1%18hr Max WS BigRun1%12hr Max WS BigRun1%6hr Max WS BigRun1%3hr Max WS BigRun1%2hr Max WS BigRun1%1hr Max WS BigRun1%240hr Max WS BigRun1%120hr Max WS BigRun1%72hr
93 HEC-RAS River: Big_Run_Ex Reach: 2 Profile: Max WS (Continued) Reach River Sta Profile Plan Q Total Min Ch El W.S. Elev Crit W.S. E.G. Elev E.G. Slope Vel Chnl Flow Area Top Width Froude # Chl (cfs) (ft) (ft) (ft) (ft) (ft/ft) (ft/s) (sq ft) (ft) Max WS Big Run1% Max WS BigRun1%24hr Max WS BigRun1%18hr Max WS BigRun1%12hr Max WS BigRun1%6hr Max WS BigRun1%3hr Max WS BigRun1%2hr Max WS BigRun1%1hr Max WS BigRun1%240hr Max WS BigRun1%120hr Max WS BigRun1%72hr Max WS Big Run1% Max WS BigRun1%24hr Max WS BigRun1%18hr Max WS BigRun1%12hr Max WS BigRun1%6hr Max WS BigRun1%3hr Max WS BigRun1%2hr Max WS BigRun1%1hr Max WS BigRun1%240hr Max WS BigRun1%120hr Max WS BigRun1%72hr Max WS Big Run1% Max WS BigRun1%24hr Max WS BigRun1%18hr Max WS BigRun1%12hr Max WS BigRun1%6hr Max WS BigRun1%3hr Max WS BigRun1%2hr Max WS BigRun1%1hr Max WS BigRun1%240hr Max WS BigRun1%120hr Max WS BigRun1%72hr Max WS Big Run1% Max WS BigRun1%24hr Max WS BigRun1%18hr Max WS BigRun1%12hr Max WS BigRun1%6hr Max WS BigRun1%3hr Max WS BigRun1%2hr Max WS BigRun1%1hr Max WS BigRun1%240hr Max WS BigRun1%120hr Max WS BigRun1%72hr Max WS Big Run1% Max WS BigRun1%24hr Max WS BigRun1%18hr Max WS BigRun1%12hr Max WS BigRun1%6hr Max WS BigRun1%3hr Max WS BigRun1%2hr Max WS BigRun1%1hr Max WS BigRun1%240hr Max WS BigRun1%120hr Max WS BigRun1%72hr Max WS Big Run1% Max WS BigRun1%24hr Max WS BigRun1%18hr Max WS BigRun1%12hr Max WS BigRun1%6hr Max WS BigRun1%3hr Max WS BigRun1%2hr Max WS BigRun1%1hr Culvert Max WS BigRun1%240hr Max WS BigRun1%120hr Max WS BigRun1%72hr Max WS Big Run1% Max WS BigRun1%24hr Max WS BigRun1%18hr Max WS BigRun1%12hr Max WS BigRun1%6hr Max WS BigRun1%3hr Max WS BigRun1%2hr Max WS BigRun1%1hr Max WS BigRun1%240hr Max WS BigRun1%120hr Max WS BigRun1%72hr Max WS Big Run1% Max WS BigRun1%24hr Max WS BigRun1%18hr Max WS BigRun1%12hr Max WS BigRun1%6hr
94 HEC-RAS River: Big_Run_Ex Reach: 2 Profile: Max WS (Continued) Reach River Sta Profile Plan Q Total Min Ch El W.S. Elev Crit W.S. E.G. Elev E.G. Slope Vel Chnl Flow Area Top Width Froude # Chl (cfs) (ft) (ft) (ft) (ft) (ft/ft) (ft/s) (sq ft) (ft) Max WS BigRun1%3hr Max WS BigRun1%2hr Max WS BigRun1%1hr Max WS BigRun1%240hr Max WS BigRun1%120hr Max WS BigRun1%72hr Max WS Big Run1% Max WS BigRun1%24hr Max WS BigRun1%18hr Max WS BigRun1%12hr Max WS BigRun1%6hr Max WS BigRun1%3hr Max WS BigRun1%2hr Max WS BigRun1%1hr Max WS BigRun1%240hr Max WS BigRun1%120hr Max WS BigRun1%72hr Max WS Big Run1% Max WS BigRun1%24hr Max WS BigRun1%18hr Max WS BigRun1%12hr Max WS BigRun1%6hr Max WS BigRun1%3hr Max WS BigRun1%2hr Max WS BigRun1%1hr Max WS BigRun1%240hr Max WS BigRun1%120hr Max WS BigRun1%72hr Max WS Big Run1% Max WS BigRun1%24hr Max WS BigRun1%18hr Max WS BigRun1%12hr Max WS BigRun1%6hr Max WS BigRun1%3hr Max WS BigRun1%2hr Max WS BigRun1%1hr Max WS BigRun1%240hr Max WS BigRun1%120hr Max WS BigRun1%72hr Max WS Big Run1% Max WS BigRun1%24hr Max WS BigRun1%18hr Max WS BigRun1%12hr Max WS BigRun1%6hr Max WS BigRun1%3hr Max WS BigRun1%2hr Max WS BigRun1%1hr Max WS BigRun1%240hr Max WS BigRun1%120hr Max WS BigRun1%72hr Max WS Big Run1% Max WS BigRun1%24hr Max WS BigRun1%18hr Max WS BigRun1%12hr Max WS BigRun1%6hr Max WS BigRun1%3hr Max WS BigRun1%2hr Max WS BigRun1%1hr Max WS BigRun1%240hr Max WS BigRun1%120hr Max WS BigRun1%72hr Max WS Big Run1% Max WS BigRun1%24hr Max WS BigRun1%18hr Max WS BigRun1%12hr Max WS BigRun1%6hr Max WS BigRun1%3hr Max WS BigRun1%2hr Max WS BigRun1%1hr Max WS BigRun1%240hr Max WS BigRun1%120hr Max WS BigRun1%72hr Max WS Big Run1% Max WS BigRun1%24hr Max WS BigRun1%18hr Max WS BigRun1%12hr Max WS BigRun1%6hr Max WS BigRun1%3hr Max WS BigRun1%2hr Max WS BigRun1%1hr Max WS BigRun1%240hr Max WS BigRun1%120hr Max WS BigRun1%72hr
95 HEC-RAS River: Big_Run_Ex Reach: 2 Profile: Max WS (Continued) Reach River Sta Profile Plan Q Total Min Ch El W.S. Elev Crit W.S. E.G. Elev E.G. Slope Vel Chnl Flow Area Top Width Froude # Chl (cfs) (ft) (ft) (ft) (ft) (ft/ft) (ft/s) (sq ft) (ft) Max WS Big Run1% Max WS BigRun1%24hr Max WS BigRun1%18hr Max WS BigRun1%12hr Max WS BigRun1%6hr Max WS BigRun1%3hr Max WS BigRun1%2hr Max WS BigRun1%1hr Max WS BigRun1%240hr Max WS BigRun1%120hr Max WS BigRun1%72hr Max WS Big Run1% Max WS BigRun1%24hr Max WS BigRun1%18hr Max WS BigRun1%12hr Max WS BigRun1%6hr Max WS BigRun1%3hr Max WS BigRun1%2hr Max WS BigRun1%1hr Culvert Max WS BigRun1%240hr Max WS BigRun1%120hr Max WS BigRun1%72hr Max WS Big Run1% Max WS BigRun1%24hr Max WS BigRun1%18hr Max WS BigRun1%12hr Max WS BigRun1%6hr Max WS BigRun1%3hr Max WS BigRun1%2hr Max WS BigRun1%1hr Max WS BigRun1%240hr Max WS BigRun1%120hr Max WS BigRun1%72hr Max WS Big Run1% Max WS BigRun1%24hr Max WS BigRun1%18hr Max WS BigRun1%12hr Max WS BigRun1%6hr Max WS BigRun1%3hr Max WS BigRun1%2hr Max WS BigRun1%1hr Max WS BigRun1%240hr Max WS BigRun1%120hr Max WS BigRun1%72hr Max WS Big Run1% Max WS BigRun1%24hr Max WS BigRun1%18hr Max WS BigRun1%12hr Max WS BigRun1%6hr Max WS BigRun1%3hr Max WS BigRun1%2hr Max WS BigRun1%1hr Max WS BigRun1%240hr Max WS BigRun1%120hr Max WS BigRun1%72hr Max WS Big Run1% Max WS BigRun1%24hr Max WS BigRun1%18hr Max WS BigRun1%12hr Max WS BigRun1%6hr Max WS BigRun1%3hr Max WS BigRun1%2hr Max WS BigRun1%1hr Max WS BigRun1%240hr Max WS BigRun1%120hr Max WS BigRun1%72hr Max WS Big Run1% Max WS BigRun1%24hr Max WS BigRun1%18hr Max WS BigRun1%12hr Max WS BigRun1%6hr Max WS BigRun1%3hr Max WS BigRun1%2hr Max WS BigRun1%1hr Max WS BigRun1%240hr Max WS BigRun1%120hr Max WS BigRun1%72hr Max WS Big Run1% Max WS BigRun1%24hr Max WS BigRun1%18hr Max WS BigRun1%12hr Max WS BigRun1%6hr
96 HEC-RAS River: Big_Run_Ex Reach: 2 Profile: Max WS (Continued) Reach River Sta Profile Plan Q Total Min Ch El W.S. Elev Crit W.S. E.G. Elev E.G. Slope Vel Chnl Flow Area Top Width Froude # Chl (cfs) (ft) (ft) (ft) (ft) (ft/ft) (ft/s) (sq ft) (ft) Max WS BigRun1%3hr Max WS BigRun1%2hr Max WS BigRun1%1hr Max WS BigRun1%240hr Max WS BigRun1%120hr Max WS BigRun1%72hr Max WS Big Run1% Max WS BigRun1%24hr Max WS BigRun1%18hr Max WS BigRun1%12hr Max WS BigRun1%6hr Max WS BigRun1%3hr Max WS BigRun1%2hr Max WS BigRun1%1hr Max WS BigRun1%240hr Max WS BigRun1%120hr Max WS BigRun1%72hr Max WS Big Run1% Max WS BigRun1%24hr Max WS BigRun1%18hr Max WS BigRun1%12hr Max WS BigRun1%6hr Max WS BigRun1%3hr Max WS BigRun1%2hr Max WS BigRun1%1hr Max WS BigRun1%240hr Max WS BigRun1%120hr Max WS BigRun1%72hr Max WS Big Run1% Max WS BigRun1%24hr Max WS BigRun1%18hr Max WS BigRun1%12hr Max WS BigRun1%6hr Max WS BigRun1%3hr Max WS BigRun1%2hr Max WS BigRun1%1hr Culvert Max WS BigRun1%240hr Max WS BigRun1%120hr Max WS BigRun1%72hr Max WS Big Run1% Max WS BigRun1%24hr Max WS BigRun1%18hr Max WS BigRun1%12hr Max WS BigRun1%6hr Max WS BigRun1%3hr Max WS BigRun1%2hr Max WS BigRun1%1hr Max WS BigRun1%240hr Max WS BigRun1%120hr Max WS BigRun1%72hr Max WS Big Run1% Max WS BigRun1%24hr Max WS BigRun1%18hr Max WS BigRun1%12hr Max WS BigRun1%6hr Max WS BigRun1%3hr Max WS BigRun1%2hr Max WS BigRun1%1hr Max WS BigRun1%240hr Max WS BigRun1%120hr Max WS BigRun1%72hr Max WS Big Run1% Max WS BigRun1%24hr Max WS BigRun1%18hr Max WS BigRun1%12hr Max WS BigRun1%6hr Max WS BigRun1%3hr Max WS BigRun1%2hr Max WS BigRun1%1hr
97 HEC-RAS River: Fiddyment Creek Reach: SITE Profile: Max WS Reach River Sta Profile Plan Q Total Min Ch El W.S. Elev Crit W.S. E.G. Elev E.G. Slope Vel Chnl Flow Area Top Width Froude # Chl (cfs) (ft) (ft) (ft) (ft) (ft/ft) (ft/s) (sq ft) (ft) SITE 2227 Max WS Fiddyment1&120hr SITE 2227 Max WS Fiddyment 1%72hr SITE 2227 Max WS Fiddyment 1% SITE 2227 Max WS Fiddyment1%24hr SITE 2227 Max WS Fiddyment1%18hr SITE 2227 Max WS Fiddyment1%12hr SITE 2227 Max WS Fiddyment1%6hr SITE 2227 Max WS Fiddyment1%3hr SITE 2227 Max WS Fiddyment1%2hr SITE 2227 Max WS Fiddyment1%1hr SITE 2141 Max WS Fiddyment1&120hr SITE 2141 Max WS Fiddyment 1%72hr SITE 2141 Max WS Fiddyment 1% SITE 2141 Max WS Fiddyment1%24hr SITE 2141 Max WS Fiddyment1%18hr SITE 2141 Max WS Fiddyment1%12hr SITE 2141 Max WS Fiddyment1%6hr SITE 2141 Max WS Fiddyment1%3hr SITE 2141 Max WS Fiddyment1%2hr SITE 2141 Max WS Fiddyment1%1hr SITE 1720 Max WS Fiddyment1&120hr SITE 1720 Max WS Fiddyment 1%72hr SITE 1720 Max WS Fiddyment 1% SITE 1720 Max WS Fiddyment1%24hr SITE 1720 Max WS Fiddyment1%18hr SITE 1720 Max WS Fiddyment1%12hr SITE 1720 Max WS Fiddyment1%6hr SITE 1720 Max WS Fiddyment1%3hr SITE 1720 Max WS Fiddyment1%2hr SITE 1720 Max WS Fiddyment1%1hr SITE 1715 Bridge SITE 1690 Max WS Fiddyment1&120hr SITE 1690 Max WS Fiddyment 1%72hr SITE 1690 Max WS Fiddyment 1% SITE 1690 Max WS Fiddyment1%24hr SITE 1690 Max WS Fiddyment1%18hr SITE 1690 Max WS Fiddyment1%12hr SITE 1690 Max WS Fiddyment1%6hr SITE 1690 Max WS Fiddyment1%3hr SITE 1690 Max WS Fiddyment1%2hr SITE 1690 Max WS Fiddyment1%1hr SITE 1535 Max WS Fiddyment1&120hr SITE 1535 Max WS Fiddyment 1%72hr SITE 1535 Max WS Fiddyment 1% SITE 1535 Max WS Fiddyment1%24hr SITE 1535 Max WS Fiddyment1%18hr SITE 1535 Max WS Fiddyment1%12hr SITE 1535 Max WS Fiddyment1%6hr SITE 1535 Max WS Fiddyment1%3hr SITE 1535 Max WS Fiddyment1%2hr SITE 1535 Max WS Fiddyment1%1hr SITE 1440 Bridge SITE 1415 Max WS Fiddyment1&120hr SITE 1415 Max WS Fiddyment 1%72hr SITE 1415 Max WS Fiddyment 1% SITE 1415 Max WS Fiddyment1%24hr SITE 1415 Max WS Fiddyment1%18hr SITE 1415 Max WS Fiddyment1%12hr SITE 1415 Max WS Fiddyment1%6hr SITE 1415 Max WS Fiddyment1%3hr SITE 1415 Max WS Fiddyment1%2hr SITE 1415 Max WS Fiddyment1%1hr SITE 1242 Max WS Fiddyment1&120hr SITE 1242 Max WS Fiddyment 1%72hr SITE 1242 Max WS Fiddyment 1% SITE 1242 Max WS Fiddyment1%24hr SITE 1242 Max WS Fiddyment1%18hr SITE 1242 Max WS Fiddyment1%12hr SITE 1242 Max WS Fiddyment1%6hr SITE 1242 Max WS Fiddyment1%3hr SITE 1242 Max WS Fiddyment1%2hr SITE 1242 Max WS Fiddyment1%1hr SITE 1177 Max WS Fiddyment1&120hr SITE 1177 Max WS Fiddyment 1%72hr SITE 1177 Max WS Fiddyment 1% SITE 1177 Max WS Fiddyment1%24hr SITE 1177 Max WS Fiddyment1%18hr SITE 1177 Max WS Fiddyment1%12hr SITE 1177 Max WS Fiddyment1%6hr
98 HEC-RAS River: Fiddyment Creek Reach: SITE Profile: Max WS (Continued) Reach River Sta Profile Plan Q Total Min Ch El W.S. Elev Crit W.S. E.G. Elev E.G. Slope Vel Chnl Flow Area Top Width Froude # Chl (cfs) (ft) (ft) (ft) (ft) (ft/ft) (ft/s) (sq ft) (ft) SITE 1177 Max WS Fiddyment1%3hr SITE 1177 Max WS Fiddyment1%2hr SITE 1177 Max WS Fiddyment1%1hr SITE 1160 Bridge SITE 1143 Max WS Fiddyment1&120hr SITE 1143 Max WS Fiddyment 1%72hr SITE 1143 Max WS Fiddyment 1% SITE 1143 Max WS Fiddyment1%24hr SITE 1143 Max WS Fiddyment1%18hr SITE 1143 Max WS Fiddyment1%12hr SITE 1143 Max WS Fiddyment1%6hr SITE 1143 Max WS Fiddyment1%3hr SITE 1143 Max WS Fiddyment1%2hr SITE 1143 Max WS Fiddyment1%1hr SITE 1107 Max WS Fiddyment1&120hr SITE 1107 Max WS Fiddyment 1%72hr SITE 1107 Max WS Fiddyment 1% SITE 1107 Max WS Fiddyment1%24hr SITE 1107 Max WS Fiddyment1%18hr SITE 1107 Max WS Fiddyment1%12hr SITE 1107 Max WS Fiddyment1%6hr SITE 1107 Max WS Fiddyment1%3hr SITE 1107 Max WS Fiddyment1%2hr SITE 1107 Max WS Fiddyment1%1hr SITE 974 Max WS Fiddyment1&120hr SITE 974 Max WS Fiddyment 1%72hr SITE 974 Max WS Fiddyment 1% SITE 974 Max WS Fiddyment1%24hr SITE 974 Max WS Fiddyment1%18hr SITE 974 Max WS Fiddyment1%12hr SITE 974 Max WS Fiddyment1%6hr SITE 974 Max WS Fiddyment1%3hr SITE 974 Max WS Fiddyment1%2hr SITE 974 Max WS Fiddyment1%1hr SITE 878 Max WS Fiddyment1&120hr SITE 878 Max WS Fiddyment 1%72hr SITE 878 Max WS Fiddyment 1% SITE 878 Max WS Fiddyment1%24hr SITE 878 Max WS Fiddyment1%18hr SITE 878 Max WS Fiddyment1%12hr SITE 878 Max WS Fiddyment1%6hr SITE 878 Max WS Fiddyment1%3hr SITE 878 Max WS Fiddyment1%2hr SITE 878 Max WS Fiddyment1%1hr SITE 769 Max WS Fiddyment1&120hr SITE 769 Max WS Fiddyment 1%72hr SITE 769 Max WS Fiddyment 1% SITE 769 Max WS Fiddyment1%24hr SITE 769 Max WS Fiddyment1%18hr SITE 769 Max WS Fiddyment1%12hr SITE 769 Max WS Fiddyment1%6hr SITE 769 Max WS Fiddyment1%3hr SITE 769 Max WS Fiddyment1%2hr SITE 769 Max WS Fiddyment1%1hr SITE 684 Max WS Fiddyment1&120hr SITE 684 Max WS Fiddyment 1%72hr SITE 684 Max WS Fiddyment 1% SITE 684 Max WS Fiddyment1%24hr SITE 684 Max WS Fiddyment1%18hr SITE 684 Max WS Fiddyment1%12hr SITE 684 Max WS Fiddyment1%6hr SITE 684 Max WS Fiddyment1%3hr SITE 684 Max WS Fiddyment1%2hr SITE 684 Max WS Fiddyment1%1hr SITE 599 Max WS Fiddyment1&120hr SITE 599 Max WS Fiddyment 1%72hr SITE 599 Max WS Fiddyment 1% SITE 599 Max WS Fiddyment1%24hr SITE 599 Max WS Fiddyment1%18hr SITE 599 Max WS Fiddyment1%12hr SITE 599 Max WS Fiddyment1%6hr SITE 599 Max WS Fiddyment1%3hr SITE 599 Max WS Fiddyment1%2hr SITE 599 Max WS Fiddyment1%1hr SITE 550 Bridge SITE 504 Max WS Fiddyment1&120hr SITE 504 Max WS Fiddyment 1%72hr SITE 504 Max WS Fiddyment 1%
99 HEC-RAS River: Fiddyment Creek Reach: SITE Profile: Max WS (Continued) Reach River Sta Profile Plan Q Total Min Ch El W.S. Elev Crit W.S. E.G. Elev E.G. Slope Vel Chnl Flow Area Top Width Froude # Chl (cfs) (ft) (ft) (ft) (ft) (ft/ft) (ft/s) (sq ft) (ft) SITE 504 Max WS Fiddyment1%24hr SITE 504 Max WS Fiddyment1%18hr SITE 504 Max WS Fiddyment1%12hr SITE 504 Max WS Fiddyment1%6hr SITE 504 Max WS Fiddyment1%3hr SITE 504 Max WS Fiddyment1%2hr SITE 504 Max WS Fiddyment1%1hr SITE 409 Max WS Fiddyment1&120hr SITE 409 Max WS Fiddyment 1%72hr SITE 409 Max WS Fiddyment 1% SITE 409 Max WS Fiddyment1%24hr SITE 409 Max WS Fiddyment1%18hr SITE 409 Max WS Fiddyment1%12hr SITE 409 Max WS Fiddyment1%6hr SITE 409 Max WS Fiddyment1%3hr SITE 409 Max WS Fiddyment1%2hr SITE 409 Max WS Fiddyment1%1hr SITE 341 Max WS Fiddyment1&120hr SITE 341 Max WS Fiddyment 1%72hr SITE 341 Max WS Fiddyment 1% SITE 341 Max WS Fiddyment1%24hr SITE 341 Max WS Fiddyment1%18hr SITE 341 Max WS Fiddyment1%12hr SITE 341 Max WS Fiddyment1%6hr SITE 341 Max WS Fiddyment1%3hr SITE 341 Max WS Fiddyment1%2hr SITE 341 Max WS Fiddyment1%1hr SITE 320 Max WS Fiddyment1&120hr SITE 320 Max WS Fiddyment 1%72hr SITE 320 Max WS Fiddyment 1% SITE 320 Max WS Fiddyment1%24hr SITE 320 Max WS Fiddyment1%18hr SITE 320 Max WS Fiddyment1%12hr SITE 320 Max WS Fiddyment1%6hr SITE 320 Max WS Fiddyment1%3hr SITE 320 Max WS Fiddyment1%2hr SITE 320 Max WS Fiddyment1%1hr SITE 218 Max WS Fiddyment1&120hr SITE 218 Max WS Fiddyment 1%72hr SITE 218 Max WS Fiddyment 1% SITE 218 Max WS Fiddyment1%24hr SITE 218 Max WS Fiddyment1%18hr SITE 218 Max WS Fiddyment1%12hr SITE 218 Max WS Fiddyment1%6hr SITE 218 Max WS Fiddyment1%3hr SITE 218 Max WS Fiddyment1%2hr SITE 218 Max WS Fiddyment1%1hr SITE 97 Max WS Fiddyment1&120hr SITE 97 Max WS Fiddyment 1%72hr SITE 97 Max WS Fiddyment 1% SITE 97 Max WS Fiddyment1%24hr SITE 97 Max WS Fiddyment1%18hr SITE 97 Max WS Fiddyment1%12hr SITE 97 Max WS Fiddyment1%6hr SITE 97 Max WS Fiddyment1%3hr SITE 97 Max WS Fiddyment1%2hr SITE 97 Max WS Fiddyment1%1hr SITE Max WS Fiddyment1&120hr SITE Max WS Fiddyment 1%72hr SITE Max WS Fiddyment 1% SITE Max WS Fiddyment1%24hr SITE Max WS Fiddyment1%18hr SITE Max WS Fiddyment1%12hr SITE Max WS Fiddyment1%6hr SITE Max WS Fiddyment1%3hr SITE Max WS Fiddyment1%2hr SITE Max WS Fiddyment1%1hr SITE 36 Bridge SITE Max WS Fiddyment1&120hr SITE Max WS Fiddyment 1%72hr SITE Max WS Fiddyment 1% SITE Max WS Fiddyment1%24hr SITE Max WS Fiddyment1%18hr SITE Max WS Fiddyment1%12hr SITE Max WS Fiddyment1%6hr SITE Max WS Fiddyment1%3hr SITE Max WS Fiddyment1%2hr SITE Max WS Fiddyment1%1hr SITE 15 Max WS Fiddyment1&120hr
100 HEC-RAS River: Fiddyment Creek Reach: SITE Profile: Max WS (Continued) Reach River Sta Profile Plan Q Total Min Ch El W.S. Elev Crit W.S. E.G. Elev E.G. Slope Vel Chnl Flow Area Top Width Froude # Chl (cfs) (ft) (ft) (ft) (ft) (ft/ft) (ft/s) (sq ft) (ft) SITE 15 Max WS Fiddyment 1%72hr SITE 15 Max WS Fiddyment 1% SITE 15 Max WS Fiddyment1%24hr SITE 15 Max WS Fiddyment1%18hr SITE 15 Max WS Fiddyment1%12hr SITE 15 Max WS Fiddyment1%6hr SITE 15 Max WS Fiddyment1%3hr SITE 15 Max WS Fiddyment1%2hr SITE 15 Max WS Fiddyment1%1hr
101 Project: I&M Canal Extension Simulation Run: 10%_48Hr_4th Start of Run: 01Jan2010, 00:00 Basin Model: Basin 1 End of Run: 08Jan2010, 00:00 Meteorologic Model: 1%_48HR_4TH Compute Time: 11May2012, 11:18:46 Control Specifications: 048-Hour Storm Hydrologic Element Drainage Area (MI2) Peak Discharge (CFS) Time of Peak Volume (IN) E Long Run Creek Jan2010, 02: E Long Run to W Long Run Jan2010, 04: W Long Run Creek Jan2010, 01: So Br Long Run Creek Jan2010, 21: W Long Run Junction Jan2010, 03: Sub-Basin Jan2010, 21: Junction-1b Jan2010, 21: to06B Jan2010, 22: North Stormwater Pond Jan2010, 19: North Gate Creek Jan2010, 19: Sub-basin Jan2010, 19: North Gate Junction Jan2010, 19: Little Run Creek Jan2010, 19: Sub-basin Jan2010, 19: North Pond Trib Jan2010, 19: North Pond LS Ditch Jan2010, 19: NPLSD Junction Jan2010, 19: North SW Pond Jan2010, 19: Junction Jan2010, 01: to Jan2010, 02: I & M Canal Jan2010, 19: Junction Jan2010, 02: to Jan2010, 02: Divert Jan2010, 02: to Jan2010, 02: Junction Jan2010, 02: to Jan2010, 02: Big Run Jan2010, 22: Big Run Surge Basin Jan2010, 19: Big Run Junction Jan2010, 22: Junction Jan2010, 00: to Jan2010, 00: Junction Jan2010, 00: to Jan2010, 00: Junction Jan2010, 00: to Jan2010, 00: Junction Jan2010, 00: to Jan2010, 00: Junction Jan2010, 00: to Jan2010, 00: Junction Jan2010, 00: to Jan2010, 00: Junction Jan2010, 00: to Jan2010, 00: Junction Jan2010, 00: to Jan2010, 00: I & M Canal Jan2010, 19: Junction Jan2010, 00: to Jan2010, 00: Fiddyment Creek Jan2010, 23: Junction Jan2010, 00: to Jan2010, 00: Page 1
102 Hydrologic Element Drainage Area (MI2) Peak Discharge (CFS) Time of Peak Volume (IN) Junction Jan2010, 00: to Jan2010, 00: Junction Jan2010, 00: to Jan2010, 00: Junction Jan2010, 00: to Jan2010, 00: Junction Jan2010, 00: to Jan2010, 00: Junction Jan2010, 00: to Jan2010, 00: Junction Jan2010, 00: to Jan2010, 00: Junction Jan2010, 00: to Jan2010, 00: I & M Trib Jan2010, 19: I & M Canal Jan2010, 19: Junction Jan2010, 00: I&M Canal Jan2010, 19: Junction Jan2010, 00: Milne Jan2010, 21: Milne3to Jan2010, 22: Milne Creek Jan2010, 21: Milne Trib Jan2010, 20: Milne-J Jan2010, 21: Milne2to Jan2010, 22: Milne Jan2010, 20: Milne Trib Jan2010, 19: Milne-J Jan2010, 20: Milne1to Jan2010, 20: Milne Jan2010, 19: I&M Canal Jan2010, 19: Junction Jan2010, 20: Junction Jan2010, 23: I&M Canal Jan2010, 19: Junction Jan2010, 23: I&M Canal Jan2010, 19: I & M Out Jan2010, 23: Citgo Tributary Jan2010, 19: Junction-1a Jan2010, 19: to06A Jan2010, 20: South Stormwater Pond Jan2010, 19: Deep Run Trib Jan2010, 19: Deep Run Trib Jan2010, 19: South SW Pond Jan2010, 21: Deep Run Creek Jan2010, 19: DRC Jan2010, 01: Deep Run Creek Jan2010, 19: DRC Jan2010, 00: Deep Run Jan2010, 19: Deep Run Jan2010, 19: DR Jan2010, 19: DRC Jan2010, 00: Deep Run Jan2010, 19: Deep Run Jan2010, 19: DRC-Division Jan2010, 00: Page 2
103 Project: I&M Canal Extension Simulation Run: 2%_48HR_4TH Start of Run: 01Jan2010, 00:00 Basin Model: Basin 1 End of Run: 08Jan2010, 00:00 Meteorologic Model: 1%_48HR_4TH Compute Time: 11May2012, 11:18:56 Control Specifications: 048-Hour Storm Hydrologic Element Drainage Area (MI2) Peak Discharge (CFS) Time of Peak Volume (IN) E Long Run Creek Jan2010, 02: E Long Run to W Long Run Jan2010, 04: W Long Run Creek Jan2010, 01: So Br Long Run Creek Jan2010, 20: W Long Run Junction Jan2010, 03: Sub-Basin Jan2010, 20: Junction-1b Jan2010, 20: to06B Jan2010, 21: North Stormwater Pond Jan2010, 19: North Gate Creek Jan2010, 19: Sub-basin Jan2010, 19: North Gate Junction Jan2010, 19: Little Run Creek Jan2010, 19: Sub-basin Jan2010, 19: North Pond Trib Jan2010, 19: North Pond LS Ditch Jan2010, 19: NPLSD Junction Jan2010, 19: North SW Pond Jan2010, 19: Junction Jan2010, 02: to Jan2010, 02: I & M Canal Jan2010, 19: Junction Jan2010, 02: to Jan2010, 02: Divert Jan2010, 02: to Jan2010, 02: Junction Jan2010, 02: to Jan2010, 02: Big Run Jan2010, 21: Big Run Surge Basin Jan2010, 19: Big Run Junction Jan2010, 21: Junction Jan2010, 00: to Jan2010, 00: Junction Jan2010, 00: to Jan2010, 00: Junction Jan2010, 00: to Jan2010, 00: Junction Jan2010, 00: to Jan2010, 00: Junction Jan2010, 00: to Jan2010, 00: Junction Jan2010, 00: to Jan2010, 00: Junction Jan2010, 00: to Jan2010, 00: Junction Jan2010, 00: to Jan2010, 00: I & M Canal Jan2010, 19: Junction Jan2010, 00: to Jan2010, 00: Fiddyment Creek Jan2010, 22: Junction Jan2010, 00: to Jan2010, 00: Page 1
104 Hydrologic Element Drainage Area (MI2) Peak Discharge (CFS) Time of Peak Volume (IN) Junction Jan2010, 00: to Jan2010, 00: Junction Jan2010, 00: to Jan2010, 00: Junction Jan2010, 00: to Jan2010, 00: Junction Jan2010, 00: to Jan2010, 00: Junction Jan2010, 00: to Jan2010, 00: Junction Jan2010, 00: to Jan2010, 00: Junction Jan2010, 00: to Jan2010, 00: I & M Trib Jan2010, 19: I & M Canal Jan2010, 19: Junction Jan2010, 00: I&M Canal Jan2010, 19: Junction Jan2010, 00: Milne Jan2010, 20: Milne3to Jan2010, 20: Milne Creek Jan2010, 20: Milne Trib Jan2010, 19: Milne-J Jan2010, 20: Milne2to Jan2010, 20: Milne Jan2010, 20: Milne Trib Jan2010, 19: Milne-J Jan2010, 19: Milne1to Jan2010, 20: Milne Jan2010, 19: I&M Canal Jan2010, 19: Junction Jan2010, 20: Junction Jan2010, 00: I&M Canal Jan2010, 19: Junction Jan2010, 00: I&M Canal Jan2010, 19: I & M Out Jan2010, 00: Citgo Tributary Jan2010, 19: Junction-1a Jan2010, 19: to06A Jan2010, 20: South Stormwater Pond Jan2010, 19: Deep Run Trib Jan2010, 19: Deep Run Trib Jan2010, 19: South SW Pond Jan2010, 19: Deep Run Creek Jan2010, 19: DRC Jan2010, 02: Deep Run Creek Jan2010, 19: DRC Jan2010, 00: Deep Run Jan2010, 19: Deep Run Jan2010, 19: DR Jan2010, 19: DRC Jan2010, 00: Deep Run Jan2010, 19: Deep Run Jan2010, 19: DRC-Division Jan2010, 00: Page 2
105 Project: I&M Canal Extension Simulation Run: 1%_48HR_4TH Start of Run: 01Jan2010, 00:00 Basin Model: Basin 1 End of Run: 08Jan2010, 00:00 Meteorologic Model: 1%_48HR_4TH Compute Time: 11May2012, 11:54:21 Control Specifications: 048-Hour Storm Hydrologic Element Drainage Area (MI2) Peak Discharge (CFS) Time of Peak Volume (IN) E Long Run Creek Jan2010, 02: E Long Run to W Long Run Jan2010, 04: W Long Run Creek Jan2010, 00: So Br Long Run Creek Jan2010, 20: W Long Run Junction Jan2010, 03: Sub-Basin Jan2010, 19: Junction-1b Jan2010, 19: to06B Jan2010, 21: North Stormwater Pond Jan2010, 19: North Gate Creek Jan2010, 19: Sub-basin Jan2010, 19: North Gate Junction Jan2010, 19: Little Run Creek Jan2010, 19: Sub-basin Jan2010, 19: North Pond Trib Jan2010, 19: North Pond LS Ditch Jan2010, 19: NPLSD Junction Jan2010, 19: North SW Pond Jan2010, 19: Junction Jan2010, 02: to Jan2010, 02: I & M Canal Jan2010, 19: Junction Jan2010, 02: to Jan2010, 02: Divert Jan2010, 02: to Jan2010, 02: Junction Jan2010, 02: to Jan2010, 02: Big Run Jan2010, 21: Big Run Surge Basin Jan2010, 19: Big Run Junction Jan2010, 21: Junction Jan2010, 00: to Jan2010, 00: Junction Jan2010, 00: to Jan2010, 00: Junction Jan2010, 00: to Jan2010, 00: Junction Jan2010, 00: to Jan2010, 00: Junction Jan2010, 00: to Jan2010, 00: Junction Jan2010, 00: to Jan2010, 00: Junction Jan2010, 00: to Jan2010, 00: Junction Jan2010, 00: to Jan2010, 00: I & M Canal Jan2010, 19: Junction Jan2010, 00: to Jan2010, 00: Fiddyment Creek Jan2010, 22: Junction Jan2010, 00: to Jan2010, 00: Page 1
106 Hydrologic Element Drainage Area (MI2) Peak Discharge (CFS) Time of Peak Volume (IN) Junction Jan2010, 00: to Jan2010, 00: Junction Jan2010, 00: to Jan2010, 00: Junction Jan2010, 00: to Jan2010, 00: Junction Jan2010, 00: to Jan2010, 00: Junction Jan2010, 00: to Jan2010, 00: Junction Jan2010, 00: to Jan2010, 00: Junction Jan2010, 00: to Jan2010, 00: I & M Trib Jan2010, 19: I & M Canal Jan2010, 19: Junction Jan2010, 00: I&M Canal Jan2010, 19: Junction Jan2010, 00: Milne Jan2010, 20: Milne3to Jan2010, 20: Milne Creek Jan2010, 20: Milne Trib Jan2010, 19: Milne-J Jan2010, 20: Milne2to Jan2010, 20: Milne Jan2010, 20: Milne Trib Jan2010, 19: Milne-J Jan2010, 19: Milne1to Jan2010, 20: Milne Jan2010, 19: I&M Canal Jan2010, 19: Junction Jan2010, 19: Junction Jan2010, 00: I&M Canal Jan2010, 19: Junction Jan2010, 00: I&M Canal Jan2010, 19: I & M Out Jan2010, 00: Citgo Tributary Jan2010, 19: Junction-1a Jan2010, 19: to06A Jan2010, 20: South Stormwater Pond Jan2010, 19: Deep Run Trib Jan2010, 19: Deep Run Trib Jan2010, 19: South SW Pond Jan2010, 19: Deep Run Creek Jan2010, 19: DRC Jan2010, 02: Deep Run Creek Jan2010, 19: DRC Jan2010, 00: Deep Run Jan2010, 19: Deep Run Jan2010, 19: DR Jan2010, 19: DRC Jan2010, 00: Deep Run Jan2010, 19: Deep Run Jan2010, 19: DRC-Division Jan2010, 00: Page 2
107 Project: I&M Canal Extension Simulation Run: 0.2%_48HR_4TH Start of Run: 01Jan2010, 00:00 Basin Model: Basin 1 End of Run: 08Jan2010, 00:00 Meteorologic Model: 1%_48HR_4TH Compute Time: 11May2012, 11:55:57 Control Specifications: 048-Hour Storm Hydrologic Element Drainage Area (MI2) Peak Discharge (CFS) Time of Peak Volume (IN) E Long Run Creek Jan2010, 02: E Long Run to W Long Run Jan2010, 04: W Long Run Creek Jan2010, 00: So Br Long Run Creek Jan2010, 20: W Long Run Junction Jan2010, 02: Sub-Basin Jan2010, 19: Junction-1b Jan2010, 19: to06B Jan2010, 21: North Stormwater Pond Jan2010, 19: North Gate Creek Jan2010, 19: Sub-basin Jan2010, 19: North Gate Junction Jan2010, 19: Little Run Creek Jan2010, 19: Sub-basin Jan2010, 19: North Pond Trib Jan2010, 19: North Pond LS Ditch Jan2010, 19: NPLSD Junction Jan2010, 19: North SW Pond Jan2010, 19: Junction Jan2010, 01: to Jan2010, 01: I & M Canal Jan2010, 19: Junction Jan2010, 01: to Jan2010, 01: Divert Jan2010, 01: to Jan2010, 01: Junction Jan2010, 01: to Jan2010, 02: Big Run Jan2010, 21: Big Run Surge Basin Jan2010, 19: Big Run Junction Jan2010, 21: Junction Jan2010, 00: to Jan2010, 00: Junction Jan2010, 00: to Jan2010, 00: Junction Jan2010, 00: to Jan2010, 00: Junction Jan2010, 00: to Jan2010, 00: Junction Jan2010, 00: to Jan2010, 00: Junction Jan2010, 00: to Jan2010, 00: Junction Jan2010, 00: to Jan2010, 00: Junction Jan2010, 00: to Jan2010, 00: I & M Canal Jan2010, 19: Junction Jan2010, 00: to Jan2010, 00: Fiddyment Creek Jan2010, 22: Junction Jan2010, 00: to Jan2010, 00: Page 1
108 Hydrologic Element Drainage Area (MI2) Peak Discharge (CFS) Time of Peak Volume (IN) Junction Jan2010, 00: to Jan2010, 00: Junction Jan2010, 00: to Jan2010, 00: Junction Jan2010, 00: to Jan2010, 00: Junction Jan2010, 00: to Jan2010, 00: Junction Jan2010, 00: to Jan2010, 00: Junction Jan2010, 00: to Jan2010, 00: Junction Jan2010, 00: to Jan2010, 00: I & M Trib Jan2010, 19: I & M Canal Jan2010, 19: Junction Jan2010, 00: I&M Canal Jan2010, 19: Junction Jan2010, 00: Milne Jan2010, 20: Milne3to Jan2010, 20: Milne Creek Jan2010, 20: Milne Trib Jan2010, 19: Milne-J Jan2010, 20: Milne2to Jan2010, 20: Milne Jan2010, 19: Milne Trib Jan2010, 19: Milne-J Jan2010, 20: Milne1to Jan2010, 20: Milne Jan2010, 19: I&M Canal Jan2010, 19: Junction Jan2010, 20: Junction Jan2010, 23: I&M Canal Jan2010, 19: Junction Jan2010, 23: I&M Canal Jan2010, 19: I & M Out Jan2010, 23: Citgo Tributary Jan2010, 19: Junction-1a Jan2010, 19: to06A Jan2010, 20: South Stormwater Pond Jan2010, 19: Deep Run Trib Jan2010, 19: Deep Run Trib Jan2010, 19: South SW Pond Jan2010, 19: Deep Run Creek Jan2010, 19: DRC Jan2010, 01: Deep Run Creek Jan2010, 19: DRC Jan2010, 00: Deep Run Jan2010, 19: Deep Run Jan2010, 19: DR Jan2010, 19: DRC Jan2010, 00: Deep Run Jan2010, 19: Deep Run Jan2010, 19: DRC-Division Jan2010, 00: Page 2
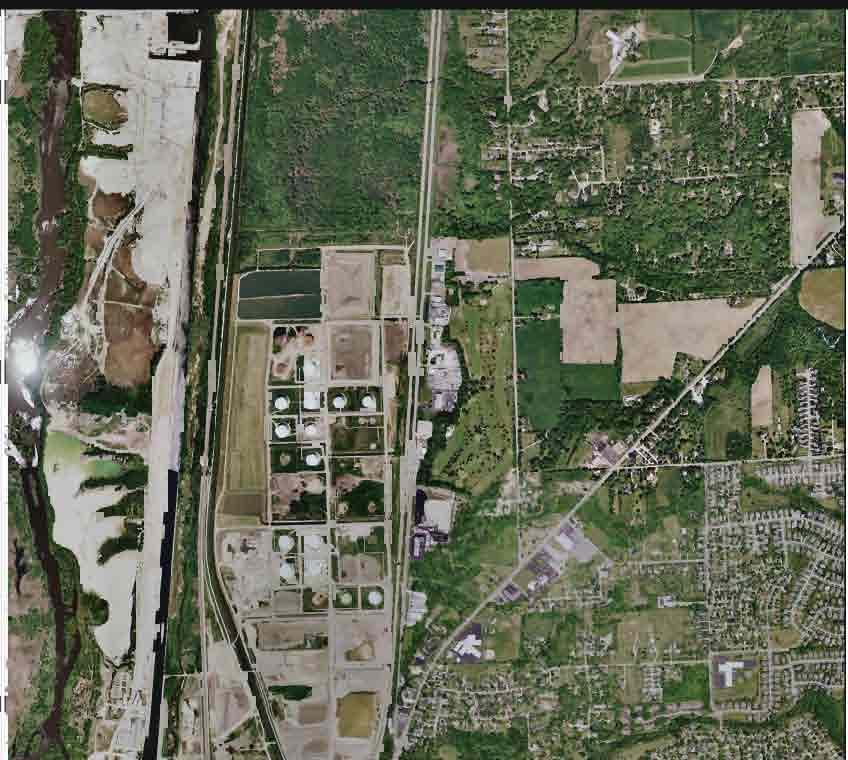
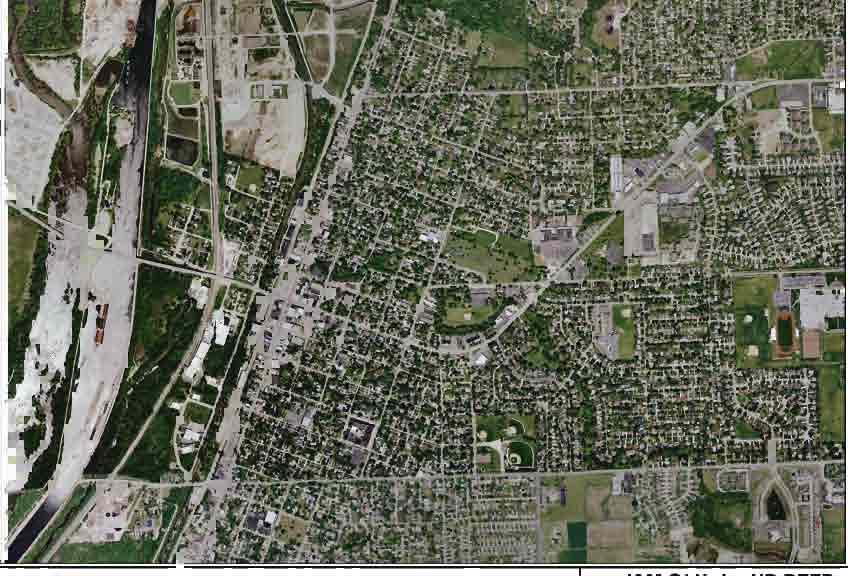
109
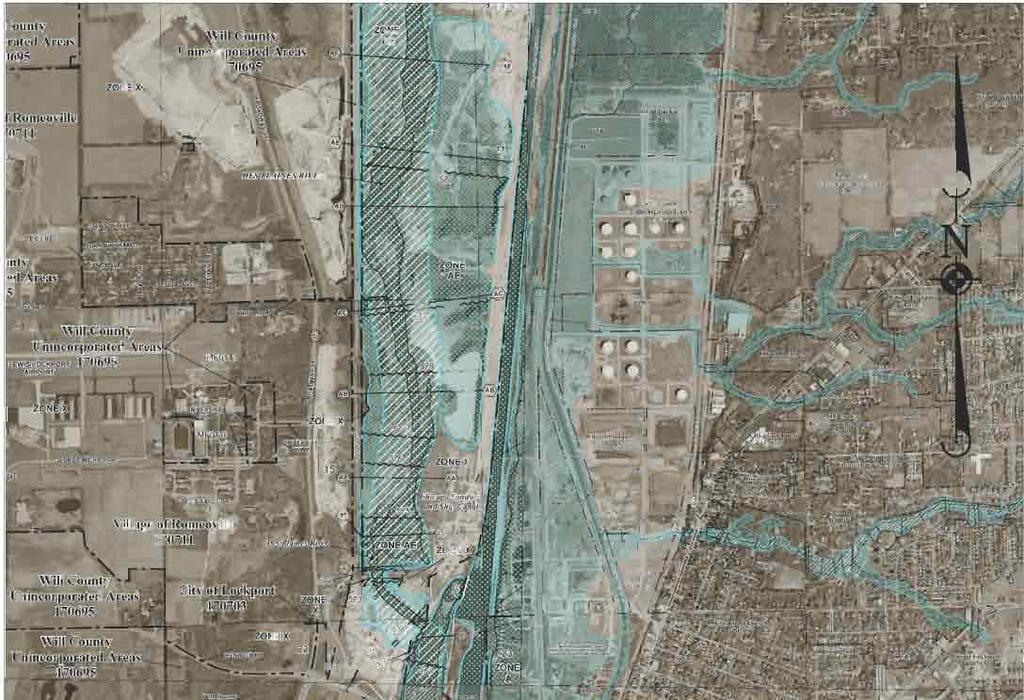
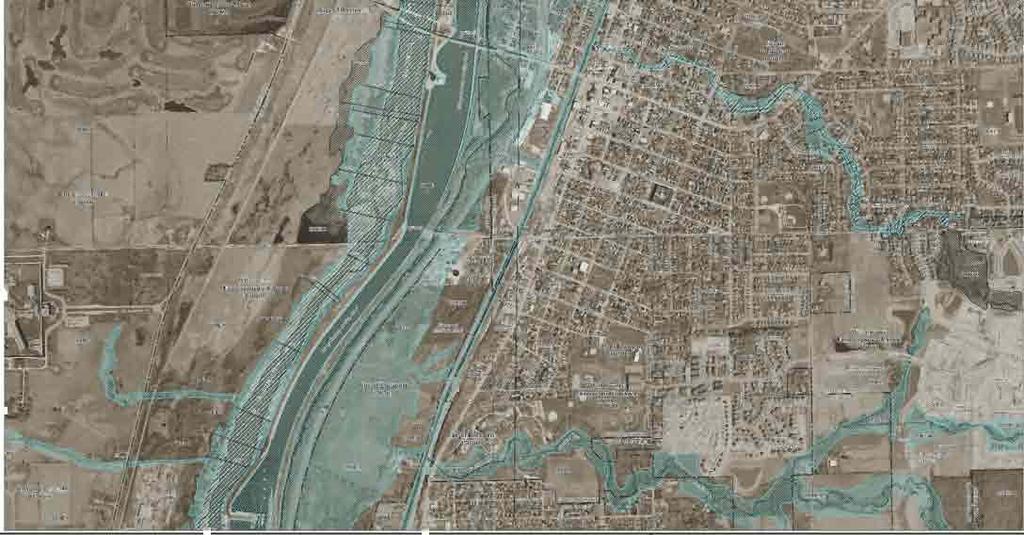
110
111
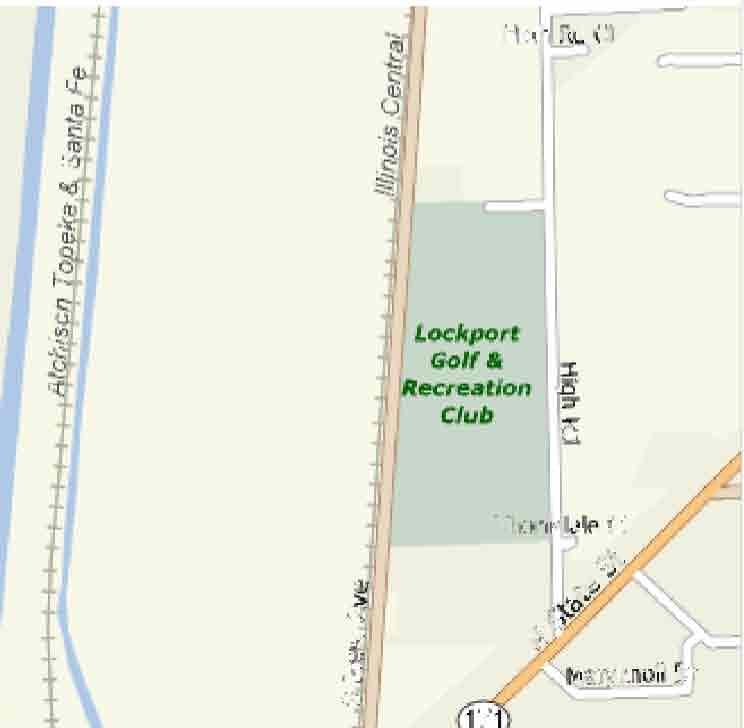
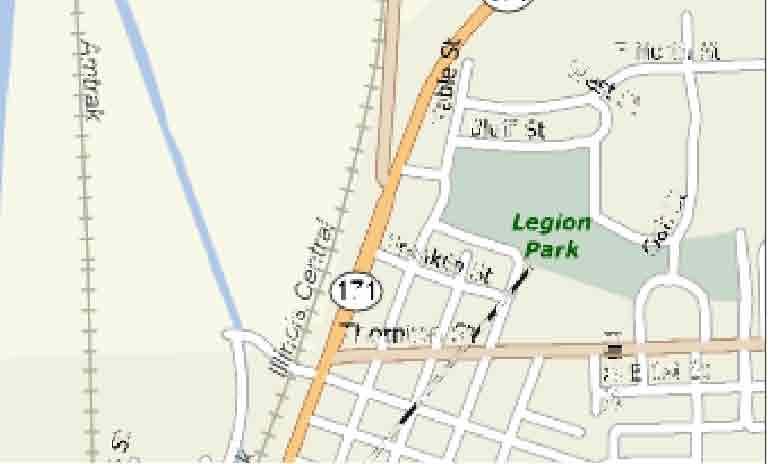
112

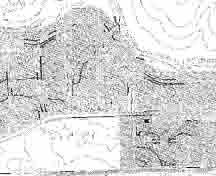
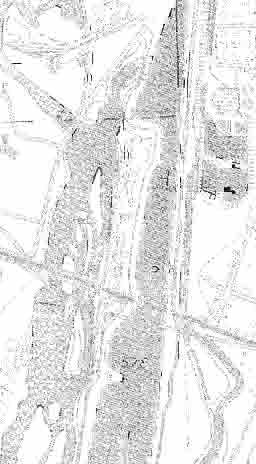
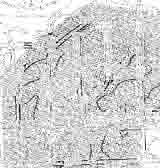
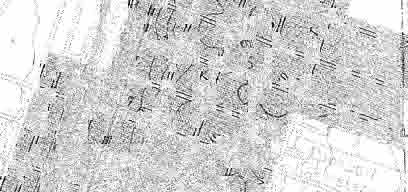
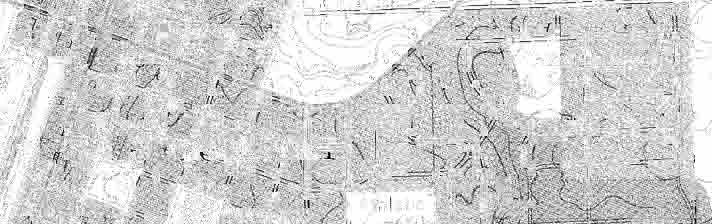
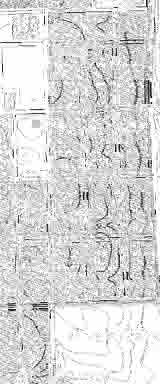

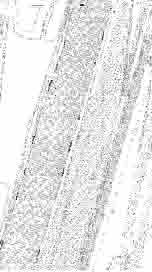
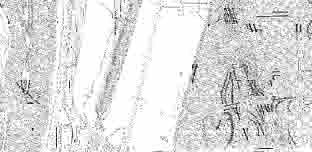
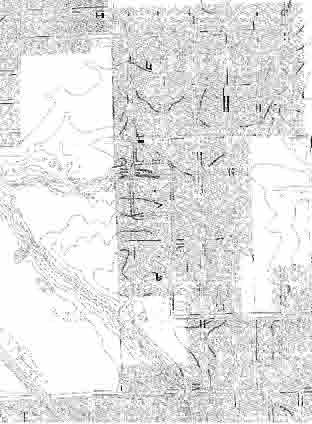
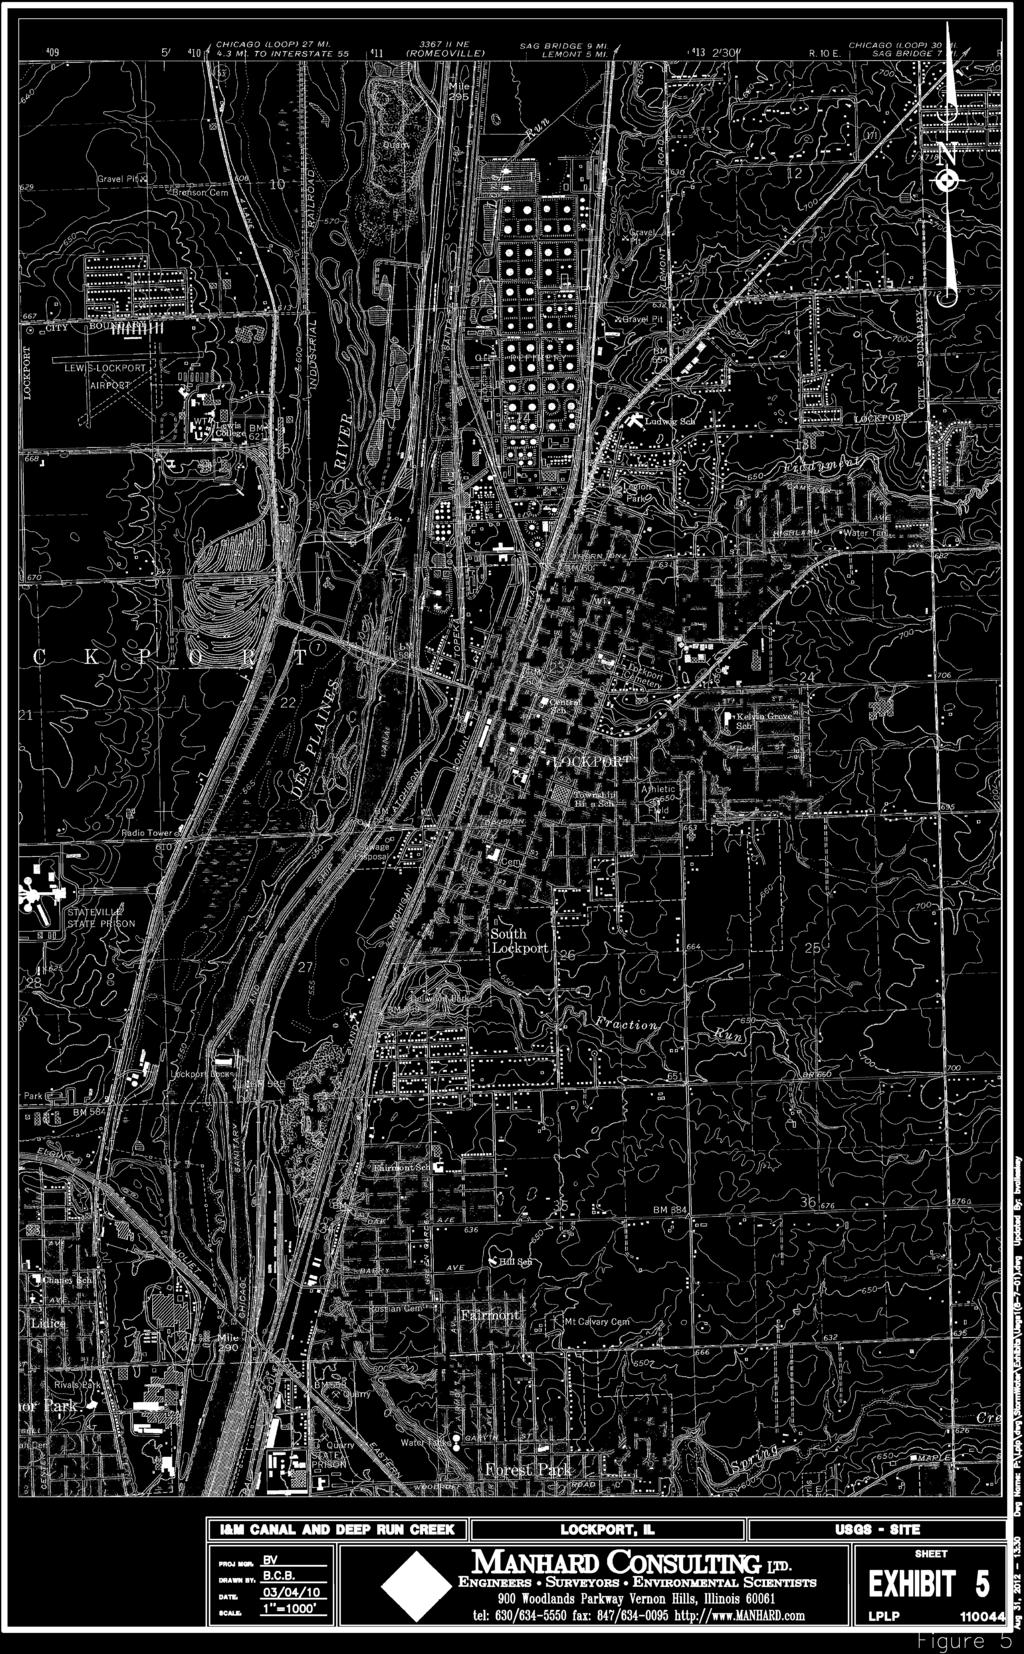
113
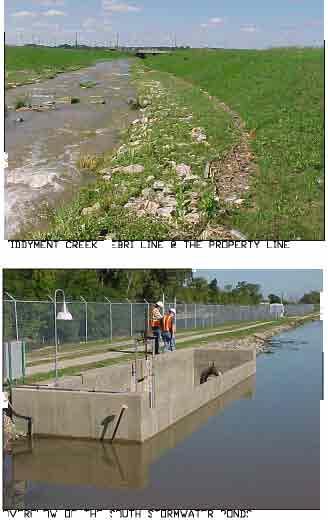
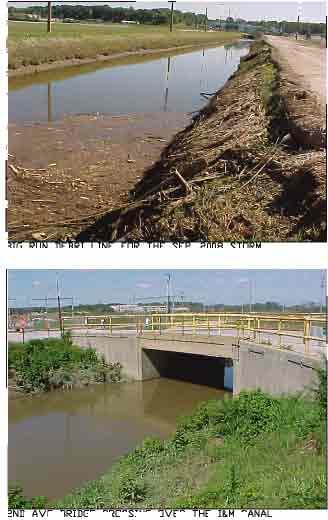
114
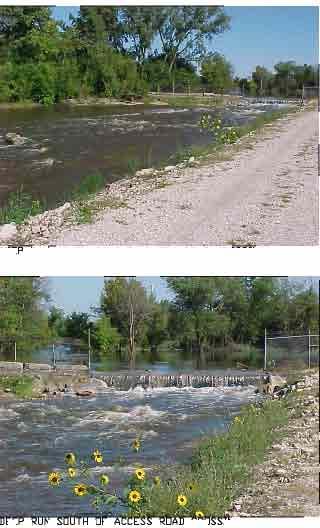
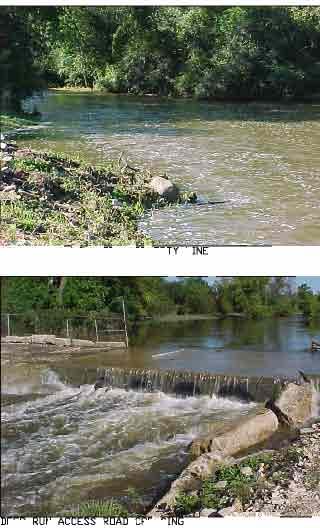
115
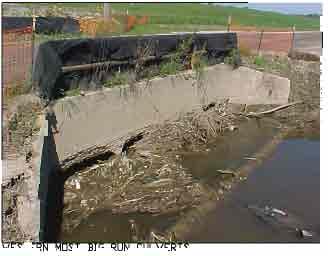
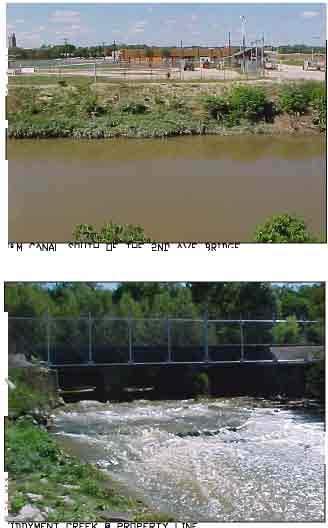
116
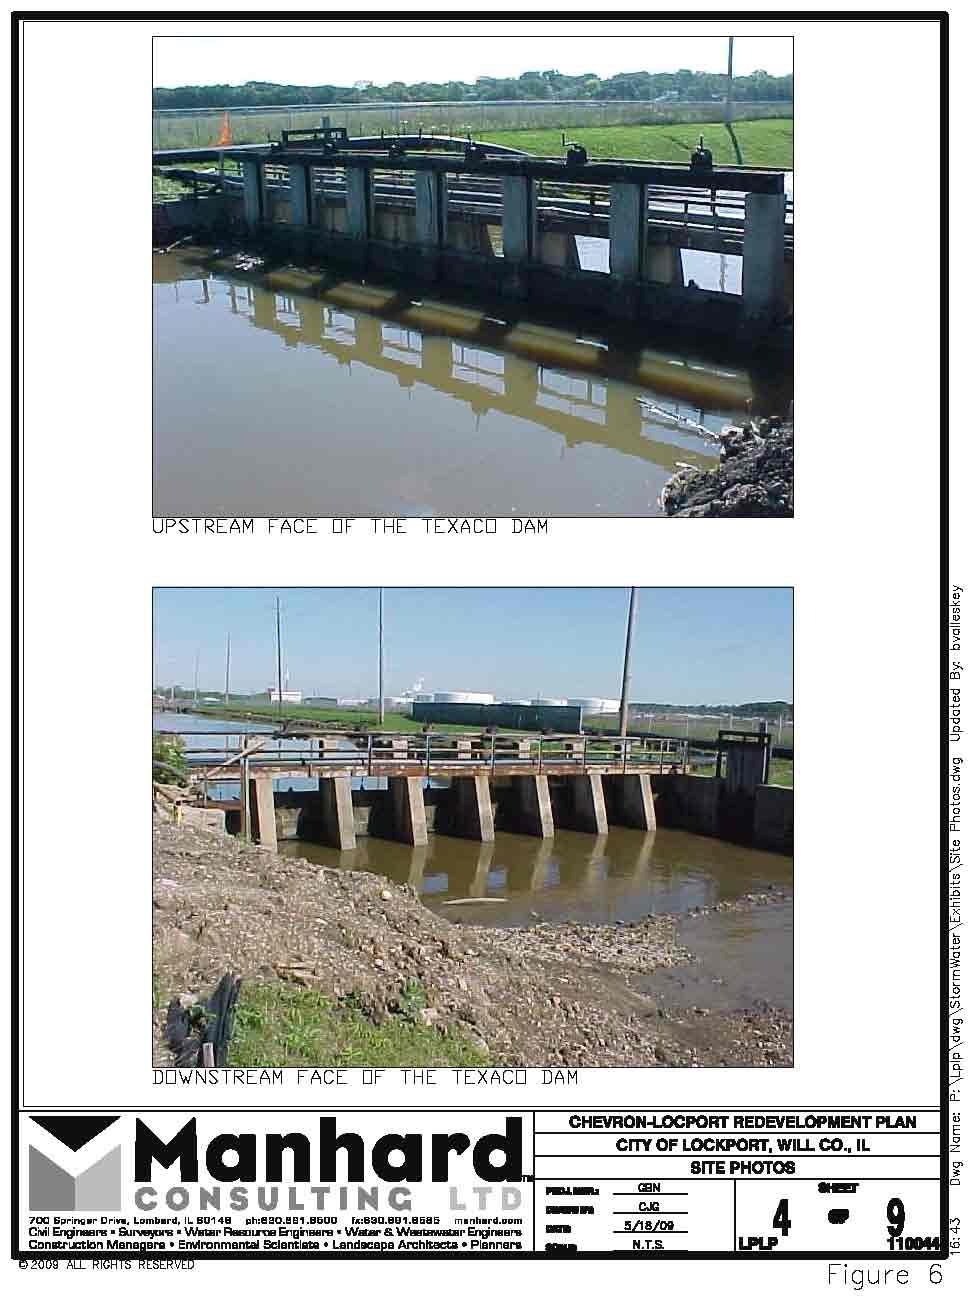
117
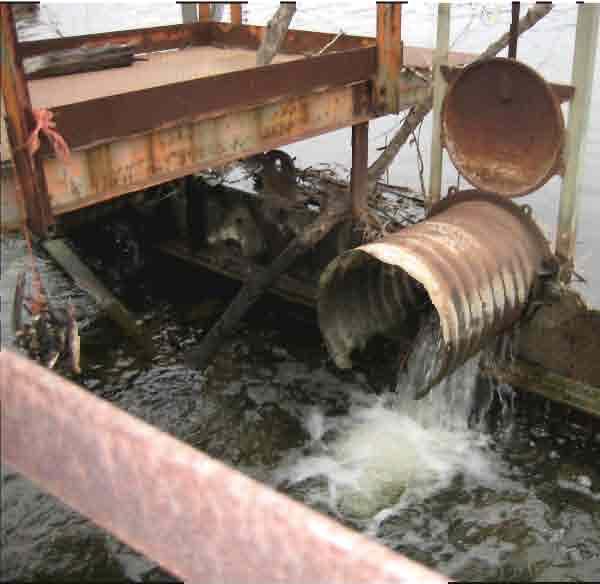

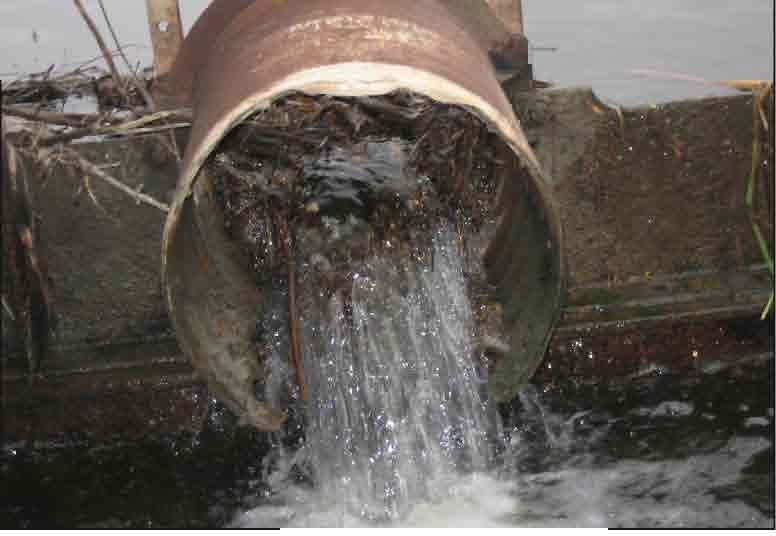

118
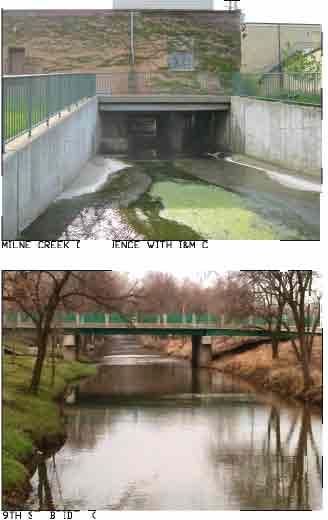
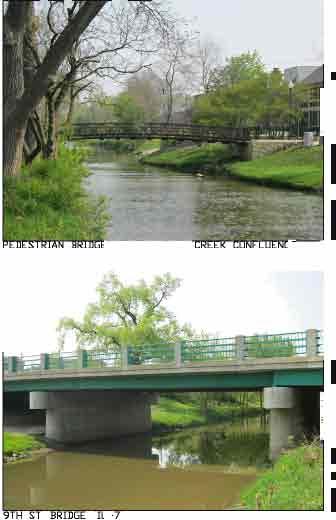
119
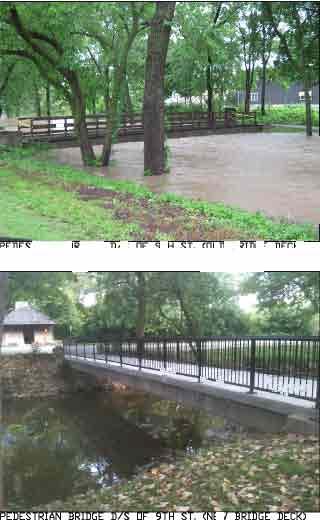
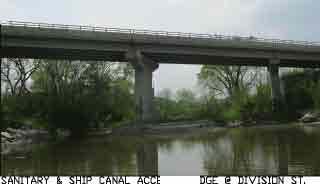
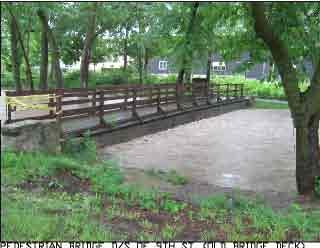
120
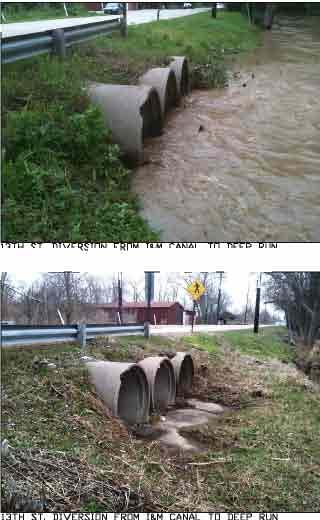
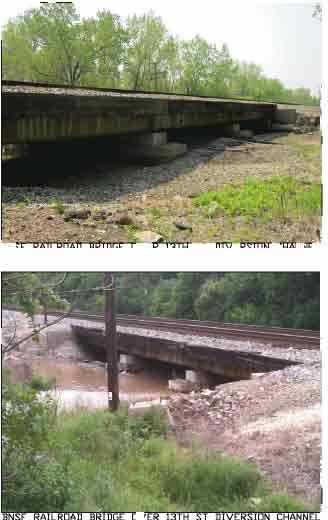
121
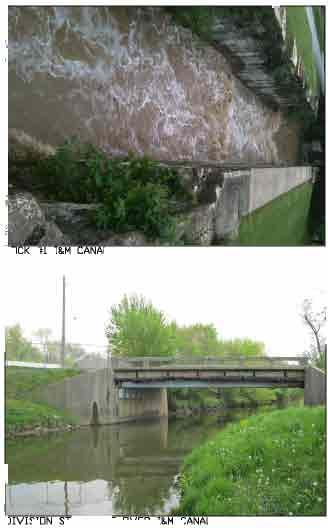
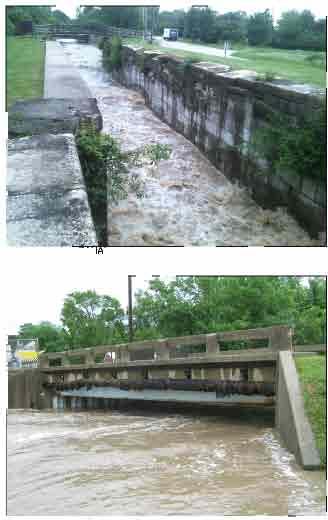
122
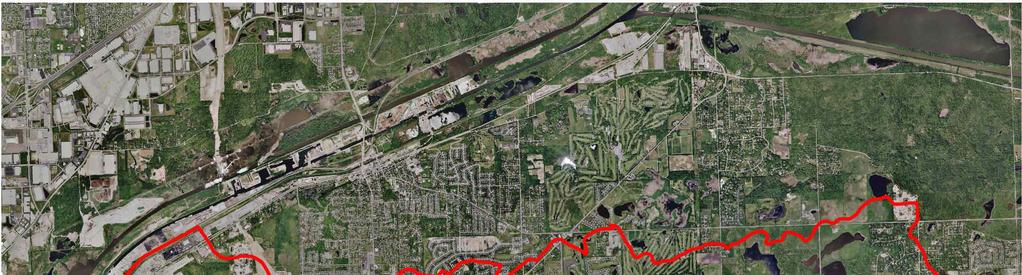

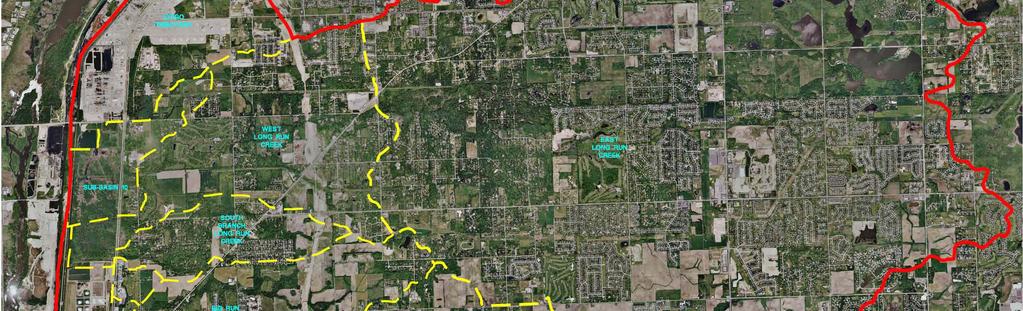
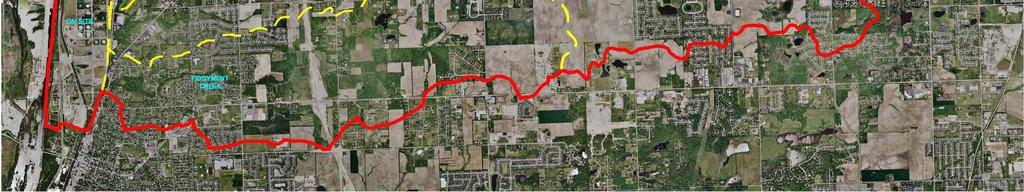
123
124
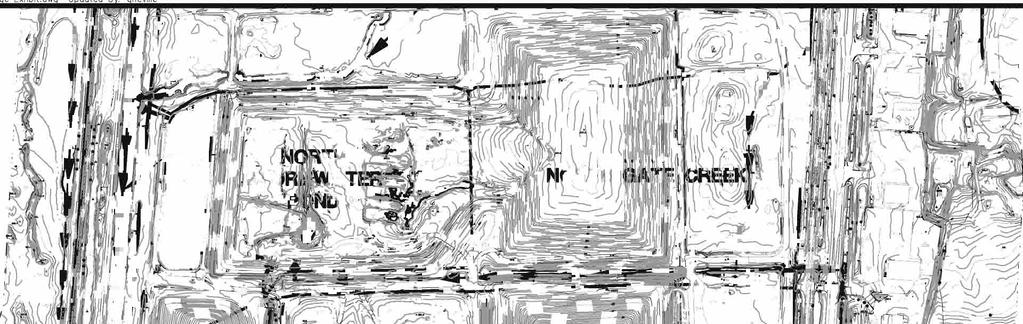
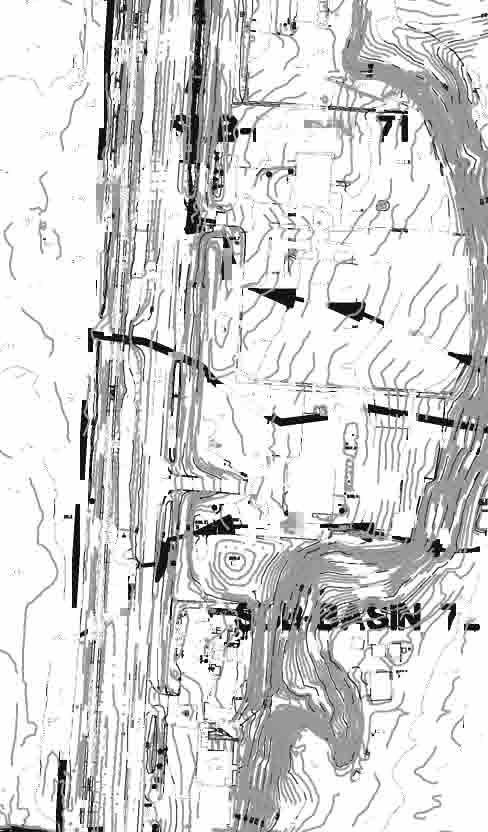
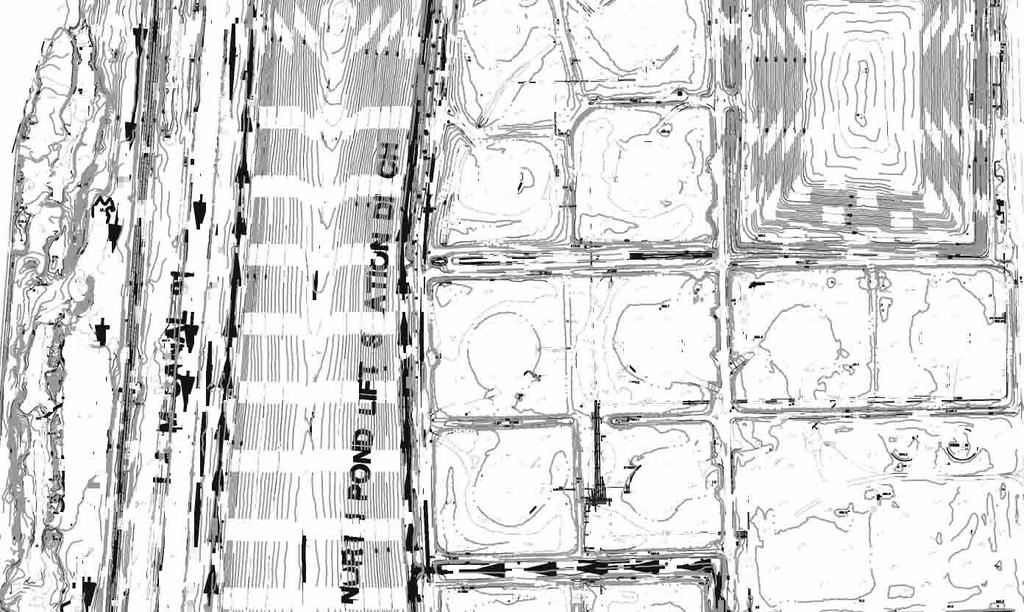
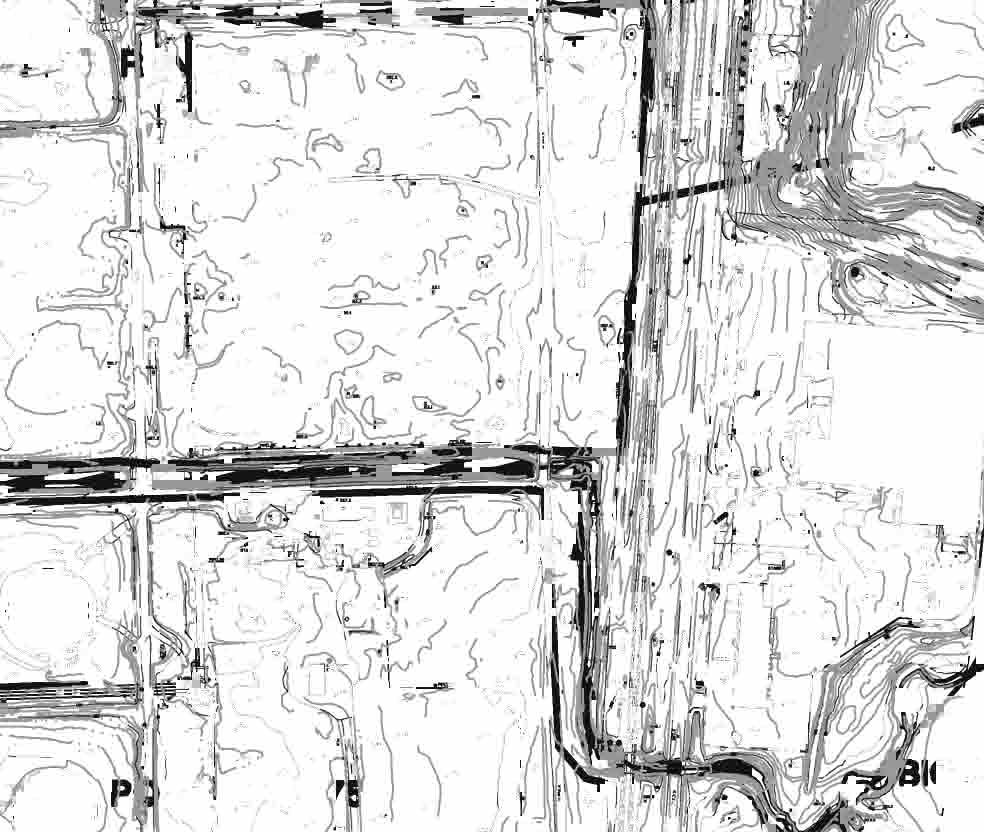
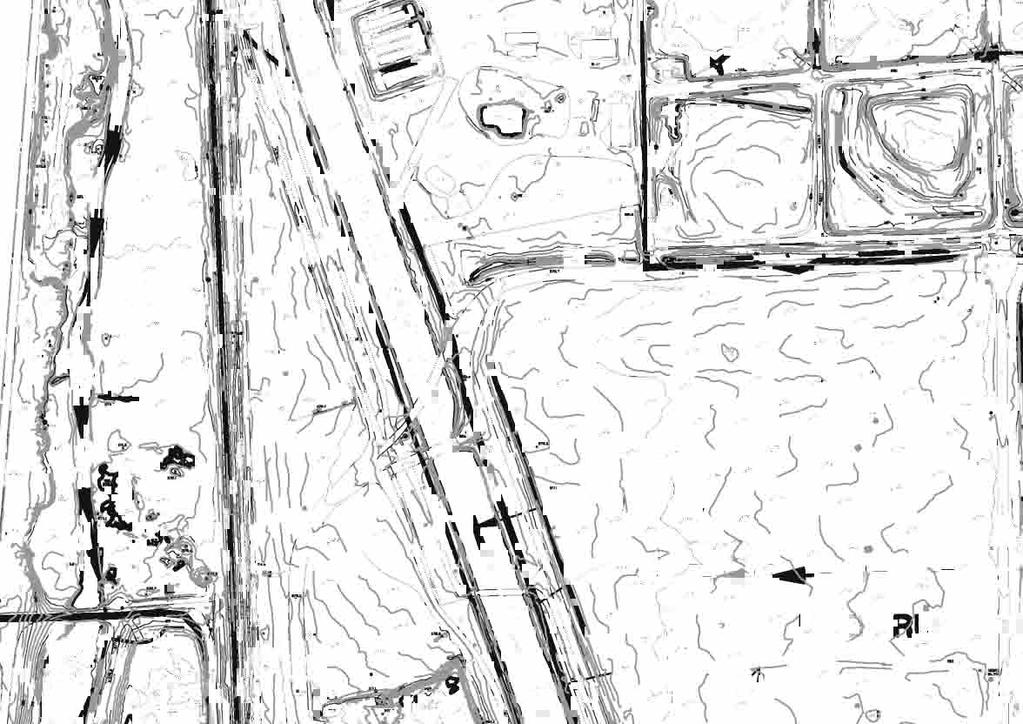


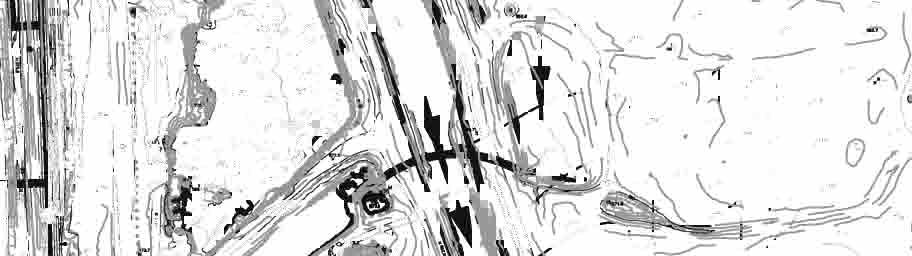
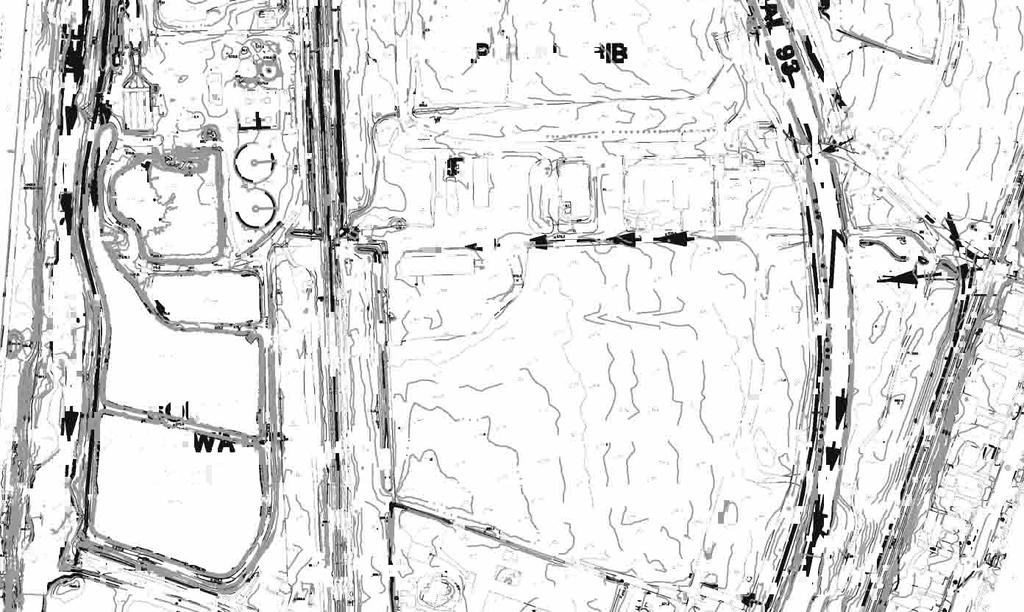
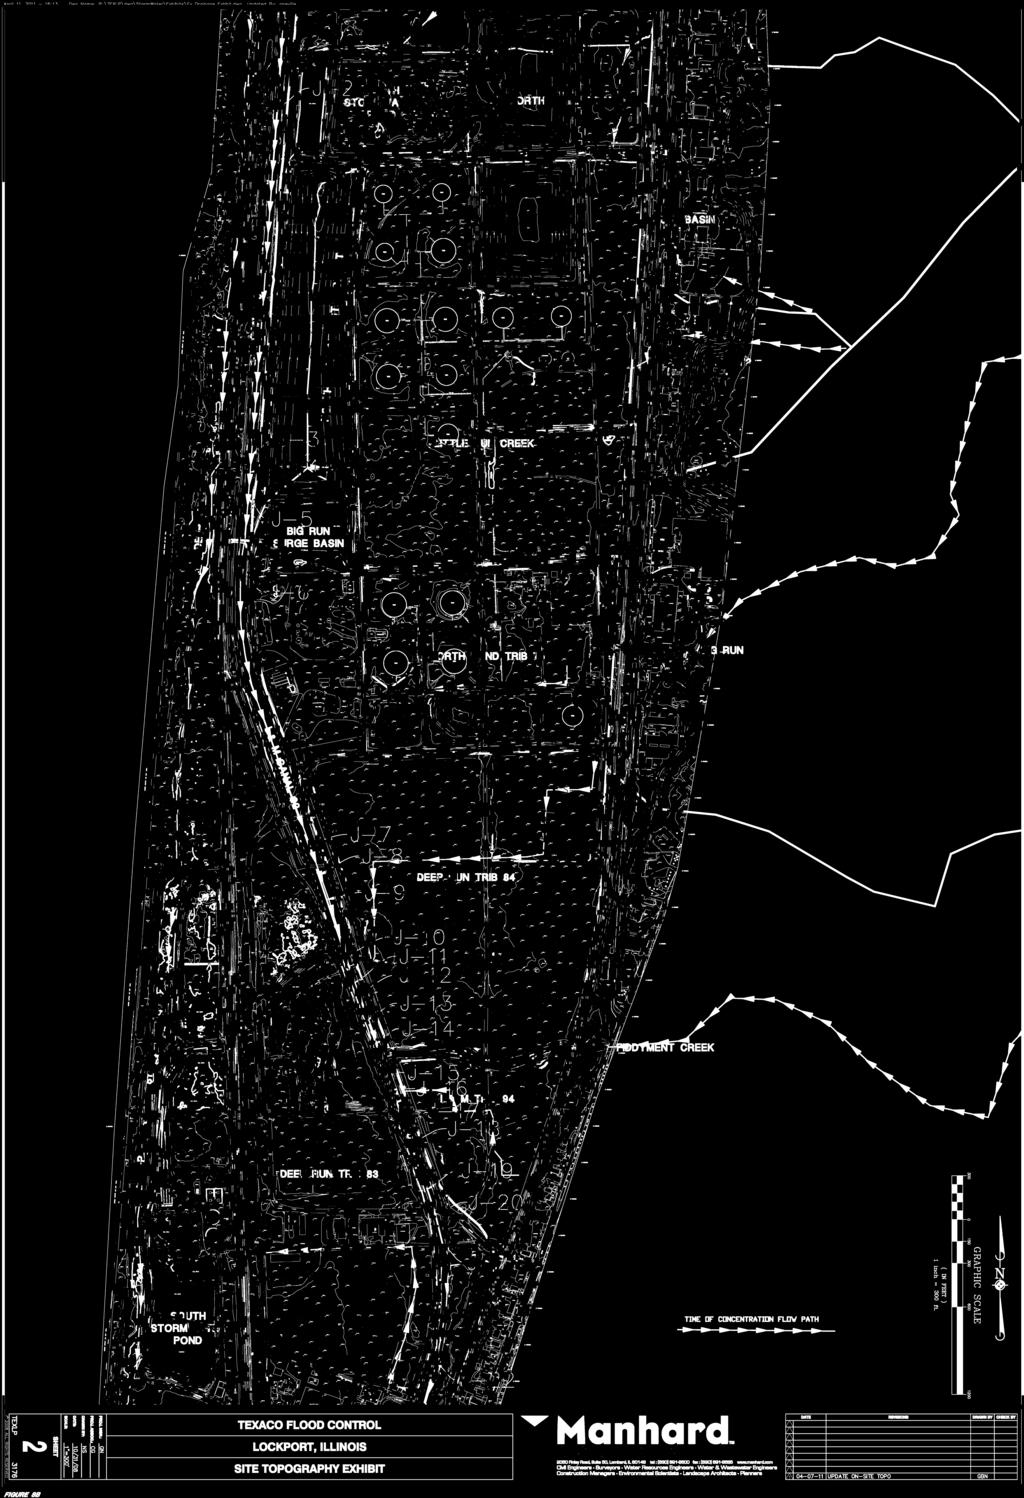
125
OFFICE OF STRUCTURES MANUAL FOR HYDROLOGIC AND HYDRAULIC DESIGN CHAPTER 11 APPENDIX B TIDEROUT 2 USERS MANUAL
 OFFICE OF STRUCTURES MANUAL FOR HYDROLOGIC AND HYDRAULIC DESIGN CHAPTER 11 APPENDIX B TIDEROUT 2 USERS MANUAL APRIL 2011 APRIL 2011 Page 1 Preface TIDEROUT 2, Build 1.22 dated June 29, 2006 is the current
Plan B Dam Breach Assessment
 Plan B Dam Breach Assessment Introduction In support of the Local Sponsor permit applications to the states of Minnesota and North Dakota, a dam breach analysis for the Plan B alignment of the Fargo-Moorhead
Technical Report Culvert A Hydraulic Analysis
 DATE: November 3, 2011 Technical Report Culvert A Hydraulic Analysis TO: FROM: RE: Jim Reiser, P.E. Project Manager Parsons Brinckerhoff, Inc. Kurt Killian, P.E., CFM Parsons Brinckerhoff, Inc. Design
APPENDIX H LAKE OKEECHOBEE FLOOD ROUTINES
 1 2 3 APPENDIX H LAKE OKEECHOBEE FLOOD ROUTINES 1 2 3 4 5 6 7 8 9 10 11 12 13 14 15 16 17 18 19 20 21 22 23 24 25 26 27 28 29 30 31 32 33 34 35 36 37 38 39 40 41 42 43 44 45 LAKE OKEECHOBEE FLOOD ROUTINGS
VIRGINIA SOIL AND WATER CONSERVATION BOARD GUIDANCE DOCUMENT ON DAM BREAK INUNDATION ZONE AND INCREMENTAL DAMAGE ANALYSIS AND MAPPING PROCEDURES
 (Approved XXXXX, 2010) Working Draft Version January 14, 2010 VIRGINIA SOIL AND WATER CONSERVATION BOARD GUIDANCE DOCUMENT ON DAM BREAK INUNDATION ZONE AND INCREMENTAL DAMAGE ANALYSIS AND MAPPING PROCEDURES
Sussex County, DE Preliminary Study Overview
 Sussex County, DE Preliminary Study Overview Coastal study scope: 102 miles of entire County shoreline Revised 102 panels for coastal study Riverine study scope: 14 streams, 67.1 miles, within the Nanticoke
USING A LABYRINTH WEIR TO INCREASE HYDRAULIC CAPACITY. Dustin Mortensen, P.E. 1 Jake Eckersley, P.E. 1
 USING A LABYRINTH WEIR TO INCREASE HYDRAULIC CAPACITY Dustin Mortensen, P.E. 1 Jake Eckersley, P.E. 1 Plum Creek Floodwater Retarding Structure No. 6 is located in an area of Kyle, Texas, that is currently
APPENDIX C VEGETATED EMERGENCY SPILLWAY. VERSION 1.0 March 1, 2011
 APPENDIX C VEGETATED EMERGENCY SPILLWAY VERSION 1.0 March 1, 2011 [NOTE: Could use a better photo more clearly showing the emergency spillway in the context of the dam.] SECTION C-1: DESCRIPTION OF PRACTICE
APPENDIX J HYDROLOGY AND WATER QUALITY
 APPENDIX J HYDROLOGY AND WATER QUALITY J-1 Technical Report on Airport Drainage, Northern Sector Airport and Ordinance Creek Watershed / Preliminary Creek Constructed Natural Channel Culvert J-2 Preliminary
TROUT CREEK WATERSHED (Second Year of Snowline Data)
") Extent of Snow Cover During the 2002 Spring Freshet For the TROUT CREEK WATERSHED (Second Year of Snowline Data) (Penticton Forest District) 1.0 INTRODUCTION The extent of snow cover over a watershed basin
Extent of Snow Cover During the 2002 Spring Freshet For the TROUT CREEK WATERSHED (Second Year of Snowline Data) (Penticton Forest District) 1.0 INTRODUCTION The extent of snow cover over a watershed basin
SECTION 2 HYDROLOGY AND FLOW REGIMES
 SECTION 2 HYDROLOGY AND FLOW REGIMES In this section historical streamflow data from permanent USGS gaging stations will be presented and discussed to document long-term flow regime trends within the Cache-Bayou
TRAFFIC STUDY GUIDELINES Clarksville Street Department
 TRAFFIC STUDY GUIDELINES Clarksville Street Department 9/1/2009 Introduction Traffic studies are used to help the city determine potential impacts to the operation of the surrounding roadway network. Two
Evaluation of June 9, 2014 Federal Emergency Management Agency Flood Insurance Study for Town of Weymouth, Norfolk, Co, MA
 Evaluation of June 9, 2014 Federal Emergency Management Agency Flood Insurance Study for Town of Weymouth, Norfolk, Co, MA Prepared For: Woodard & Curran 95 Cedar Street, Suite 100 Providence, RI 02903
PROFILE OF SACRAMENTO RIVER, FREEPORT TO VERONA, CALIFORNIA,
 PROFILE OF SACRAMENTO RIVER, FREEPORT TO VERONA, CALIFORNIA, FLOOD OF FEBRUARY 1986 By J.C. Blodgett and J.B. Lucas U.S. GEOLOGICAL SURVEY Open-File Report 88-82 CO CM I m r-h CM Sacramento, California
WMS 8.4 Tutorial Hydraulics and Floodplain Modeling HY-8 Modeling Wizard Learn how to model a culvert using HY-8 and WMS
 v. 8.4 WMS 8.4 Tutorial Hydraulics and Floodplain Modeling HY-8 Modeling Wizard Learn how to model a culvert using HY-8 and WMS Objectives Define a conceptual schematic of the roadway, invert, and downstream
Stormwater Level of Service Study - Phase 2 Flooding Adjacent to Rock Creek
 Stormwater Level of Service Study - Phase 2 Flooding Adjacent to Rock Creek City of Fairway, Kansas Fairway Stormwater Level of Service Study - Phase 2 Project No. 108200 Revision 1 12/6/2018 Stormwater
Total Suspended Solids, Stable Flow, and Wet Weather Event Monitoring in the Unnamed Tributary to the Grand River Watershed.
 Total Suspended Solids, Stable Flow, and Wet Weather Event Monitoring in the Unnamed Tributary to the Grand River Watershed December 2004 The Cadmus Group, Inc. Grand Valley State University Annis Water
PRELIMINARY STORM DRAINAGE REPORT
 PRELIMINARY STORM DRAINAGE REPORT DRURY LANE DEVELOPMENT 704 1ST STREET SULTAN, WA 98294-94240 PARCEL #28083200305500 AUDITOR S FILE NO. 1090255 CITY OF SULTAN SNOHOMISH COUNTY, WASHINGTON PREPARED FOR:
JEFFERSON COUNTY, ARKANSAS AND INCORPORATED AREAS
 JEFFERSON COUNTY, ARKANSAS Community Name Community Number ALTHEIMER, CITY OF 050107 HUMPHREY, CITY OF 050108 JEFFERSON COUNTY 050440 (UNINCORPORATED AREAS) PINE BLUFF, CITY OF 050109 REDFIELD, CITY OF
GALLATIN COUNTY, MONTANA AND INCORPORATED AREAS
 GALLATIN COUNTY, MONTANA AND INCORPORATED AREAS Community Name Community Number * BELGRADE, CITY OF 300105 BOZEMAN, CITY OF 300028 GALLATIN COUNTY UNINCORPORATED AREAS 300027 * MANHATTAN, TOWN OF 300034
Evaluating Surge Potential in CSO Tunnels
 14 Evaluating Surge Potential in CSO Tunnels Karen E. Ridgway Tunnels are being proposed to control combined sewer overflow (CSO) in numerous cities in the United States and Canada. The tunnels are intended
Stormwater Management Pond Design Brief. Greely Village Centre - Commercial Phase - Ultimate Conditions - - City of Ottawa -
 Stormwater Management Pond Design Brief Greely Village Centre - Commercial Phase - Ultimate Conditions - - City of Ottawa - December 2008 Ref: 647-07 J.F. Sabourin and Associates Inc. Water Resources and
NEED FOR SUPPLEMENTAL BATHYMETRIC SURVEY DATA COLLECTION
 305 West Grand Avenue, Suite 300 Montvale, New Jersey 07645 Phone 201.930.9890 Fax 201.930.9805 www.anchorqea.com M EMORANDUM To: Caroline Kwan and Nica Klaber U.S. Environmental Protection Agency Region
Minnesota Department of Natural Resources Division of Fish and Wildlife Section of Fisheries. Stream Survey Report. Luxemburg Creek.
 Minnesota F-29-R(P)-24 Area 315 Study 3 March 2016 Minnesota Department of Natural Resources Division of Fish and Wildlife Section of Fisheries Stream Survey Report Luxemburg Creek 2015 Mark Pelham Sauk
3.0 Basin and Watershed Characteristics
 3.0 Basin and Watershed Characteristics 3.1 Basin Characteristics 3.1.1 Crystal Lake Crystal Lake, located in the cities of Burnsville and Lakeville (Dakota County), covers an area of approximately 292
Ellis Y. Byeon, PE Bryan VanderGheynst, PE 1
 Ellis Y. Byeon, PE Bryan VanderGheynst, PE 1 Background Information: City of Trenton, Mercer County Assunpink Creek, Pond Run and Delaware River Lower 2.5 miles of the Assunpink Creek Lower 0.6 miles of
Red River Basin and FM Diversion Hydrology. North Dakota Water Education Foundation Executive Briefing July 13, 2012
 Red River Basin and FM Diversion Hydrology North Dakota Water Education Foundation Executive Briefing July 13, 2012 Red River Basin Total Drainage Area: 45,000 square miles North Dakota Fargo, ND Moorhead,
ENHANCED PARKWAY STUDY: PHASE 2 CONTINUOUS FLOW INTERSECTIONS. Final Report
 Preparedby: ENHANCED PARKWAY STUDY: PHASE 2 CONTINUOUS FLOW INTERSECTIONS Final Report Prepared for Maricopa County Department of Transportation Prepared by TABLE OF CONTENTS Page EXECUTIVE SUMMARY ES-1
CHAPTER 4 SPALDING COUNTY, GEORGIA 4.0 CULVERT DESIGN
 SPALDING COUNTY, GEORGIA CHAPTER 4 4.0 CULVERT DESIGN... 4-1 4.1 INTRODUCTION... 4-1 4.2 SYMBOLS AND DEFINITIONS... 4-1 4.3 ENGINEERING DESIGN CRITERIA... 4-2 4.3.1 FREQUENCY FLOOD... 4-2 4.3.2 VELOCITY
TRAFFIC IMPACT STUDY CRITERIA
 Chapter 6 - TRAFFIC IMPACT STUDY CRITERIA 6.1 GENERAL PROVISIONS 6.1.1. Purpose: The purpose of this document is to outline a standard format for preparing a traffic impact study in the City of Steamboat
Sontek RiverSurveyor Test Plan Prepared by David S. Mueller, OSW February 20, 2004
 Sontek RiverSurveyor Test Plan Prepared by David S. Mueller, OSW February 20, 2004 INTRODUCTION Sontek/YSI has introduced new firmware and software for their RiverSurveyor product line. Firmware changes
Total Suspended Solids, Stable Flow, and Wet Weather Event Monitoring in the Bass River Watershed. December The Cadmus Group, Inc.
 Total Suspended Solids, Stable Flow, and Wet Weather Event Monitoring in the Bass River Watershed December 2004 The Cadmus Group, Inc. Grand Valley State University Annis Water Resources Institute Submitted
Illinois State Water Survey
 Illinois State Water Survey HYDROLOGY DIVISION SWS Contract Report 508 COMPARISON OF 1987 AND 1989 BED PROFILE SURVEYS OF THE LOWER CACHE RIVER by Richard Allgire Office of Sediment and Wetland Studies
HY-8 Version 7.2 Build Date January 17, Federal Highway Administration.
 HY-8 Version 7.2 Build Date January 17, 2012 Federal Highway Administration http://www.fhwa.dot.gov/engineering/hydraulics/software/hy8/index.cfm SIMPLE Simple to use Use for simple culverts and bridges
HURRICANE SANDY LIMITED REEVALUATION REPORT UNION BEACH, NEW JERSEY DRAFT ENGINEERING APPENDIX SUB APPENDIX D SBEACH MODELING
 HURRICANE SANDY LIMITED REEVALUATION REPORT UNION BEACH, NEW JERSEY DRAFT ENGINEERING APPENDIX SUB APPENDIX D SBEACH MODELING Rev. 18 Feb 2015 1 SBEACH Modeling 1.0 Introduction Following the methodology
MADISON COUNTY, ILLINOIS AND INCORPORATED AREAS
 VOLUME 2 OF 2 MADISON COUNTY, ILLINOIS AND INCORPORATED AREAS * * * COMMUNITY COMMUNITY NAME NUMBER ALHAMBRA, VILLAGE OF 170270 ALTON, CITY OF 170437 BETHALTO, VILLAGE OF 170438 COLLINSVILLE, CITY OF 170439
SSO 700 Integrated Watershed Action Plan: Continuous Calibration of a Model
 SSO 700 Integrated Watershed Action Plan: Continuous Calibration of a Model 5 Cities Plus August 16, 2017 Presented by Matt Spidare, P.E MSDGC Victoria Berry, P.E. CH2M Overview of Presentation Project
Modeling of Long Culverts and Stormdrains A Comparison of Different Methods
 Modeling of Long Culverts and Stormdrains A Comparison of Different Methods Shrinivas Kaulgud, P.E., CFM Cheryl Hannan, P.E., CFM, LEED AP October 12, 2017 Presentation Outline Introduction Case Studies
SELBY CREEK SILVERADO TRAIL CULVERT FISH PASSAGE ASSESSMENT
 SELBY CREEK SILVERADO TRAIL CULVERT FISH PASSAGE ASSESSMENT NAPA COUNTY, CALIFORNIA PREPARED BY NAPA COUNTY RESOURCE CONSERVATION DISTRICT 1303 JEFFERSON ST. SUITE 500B NAPA, CALIFORNIA 94559 WWW.NAPARCD.ORG
STUDY REPORT W&AR-03 RESERVOIR TEMPERATURE MODEL ATTACHMENT B DON PEDRO RESERVOIR BATHYMETRIC STUDY REPORT
 STUDY REPORT W&AR-03 RESERVOIR TEMPERATURE MODEL ATTACHMENT B DON PEDRO RESERVOIR BATHYMETRIC STUDY REPORT DON PEDRO RESERVOIR BATHYMETRIC STUDY REPORT Prepared for: TURLOCK IRRIGATION DISTRICT MODESTO
Annex E Bridge Pier Protection Plan
 Annex E Bridge Pier Protection Plan Table E1 Bridge Types and Locations Table E2 Flow Conditions For River Sections Figure E1 Bridge Abutment Protection Figure E2 Bridge Pier Protection Figure E3 Central
Designing Labyrinth Spillways for Less than Ideal Conditions Real World Application of Laboratory Design Methods
 Designing Labyrinth Spillways for Less than Ideal Conditions Real World Application of Laboratory Design Methods Gregory Richards, P.E., CFM, Gannett Fleming, Inc. Blake Tullis, Ph.D., Utah Water Research
SACO RIVER AND CAMP ELLIS BEACH SACO, MAINE SECTION 111 SHORE DAMAGE MITIGATION PROJECT APPENDIX F ECONOMIC ASSESSMENT
 SACO RIVER AND CAMP ELLIS BEACH SACO, MAINE SECTION 111 SHORE DAMAGE MITIGATION PROJECT APPENDIX F ECONOMIC ASSESSMENT Department of the Army New England District, Corps of Engineers 696 Virginia Road
ADOT Statewide Bicycle and Pedestrian Program Summary of Phase IV Activities APPENDIX B PEDESTRIAN DEMAND INDEX
 ADOT Statewide Bicycle and Pedestrian Program Summary of Activities APPENDIX B PEDESTRIAN DEMAND INDEX May 24, 2009 Pedestrian Demand Index for State Highway Facilities Revised: May 29, 2007 Introduction
Indiana LTAP Road Scholar Core Course #10 Culvert Drainage. Presented by Thomas T. Burke, Jr., PhD, PE Christopher B. Burke Engineering, Ltd.
 Indiana LTAP Road Scholar Core Course #10 Culvert Drainage Presented by Thomas T. Burke, Jr., PhD, PE Christopher B. Burke Engineering, Ltd. Objectives Review culvert shapes, end sections, and materials
ADDENDA B Hydrologic and Hydraulic (H&H) Study Guidance 2019
 Study Guidance 2019") 09/25/2018 DRAFT FEMA Region I PA H&H Study ADDENDA B Hydrologic and Hydraulic (H&H) Study Guidance 2019 Region I Federal Emergency Management Agency (FEMA) Public Assistance Hydrologic and Hydraulic (H&H)
09/25/2018 DRAFT FEMA Region I PA H&H Study ADDENDA B Hydrologic and Hydraulic (H&H) Study Guidance 2019 Region I Federal Emergency Management Agency (FEMA) Public Assistance Hydrologic and Hydraulic (H&H)
STRUCTURE S-65 PURPOSE SPILLWAY OPERATION
 STRUCTURE S-65 This structure is a reinforced concrete, gated spillway with discharge controlled by three cable operated, vertical lift gates, and a reinforced concrete lock structure with two pairs of
Chapter 4 Traffic Analysis
 Chapter 4 Traffic Analysis PURPOSE The traffic analysis component of the K-68 Corridor Management Plan incorporates information on the existing transportation network, such as traffic volumes and intersection
SOUTH CAROLINA ELECTRIC & GAS COMPANY COLUMBIA, SOUTH CAROLINA
 SOUTH CAROLINA ELECTRIC & GAS COMPANY COLUMBIA, SOUTH CAROLINA SALUDA HYDROELECTRIC PROJECT FERC NO. 516 DOWNSTREAM TEMPERATURE STUDY DRAFT REPORT MAY 28 Prepared by: SOUTH CAROLINA ELECTRIC & GAS COMPANY
LESOTHO HIGHLANDS DEVELOPMENT AUTHORITY
 LESOTHO HIGHLANDS DEVELOPMENT AUTHORITY FLOW RELEASES DOWNSTREAM OF THE LESOTHO HIGHLANDS WATER PROJECT (LHWP) STRUCTURES (April 2003 to September 2003) TOWER ON MALIBAMATŠO RIVER @ KAO MARCH 2004 OPERATIONS,
Section 10 - Hydraulic Analysis
 Section 10 - Hydraulic Analysis Methodology Documentation Functionality Summary Sizing Methodology Fixed/Resize Combined Flow Storm: Sizing as per d/d Structures.dat Storm vs. Sanitary Methodology HGL/EGL
General Information for Culvert Design
 Design Manual Chapter 2 - Stormwater 2E - Culvert Design 2E-1 General Information for Culvert Design A. Introduction A culvert is a conduit under an embankment that transports stormwater from one side
TOWN OF CHAPEL HILL POLICY AND PROCEDURES FOR TRAFFIC CALMING MEASURES
 TOWN OF CHAPEL HILL POLICY AND PROCEDURES FOR TRAFFIC CALMING MEASURES (Adopted by the Town Council on June 30, 2004) (Revised December 6, 2010) (Revised February 8, 2016) POLICY AND PROCEDURES FOR TRAFFIC
WASHINGTON CONSERVATION DISTRICT STANDARD OPERATING PROCEDURE (S.O.P.)
") Page 1 of 18 Water Monitoring Program WASHINGTON CONSERVATION DISTRICT STANDARD OPERATING PROCEDURE (S.O.P.) No. 1 FLOW MONITORING Page 2 of 18 Water Monitoring Program Standard Operating Procedure No.
Page 1 of 18 Water Monitoring Program WASHINGTON CONSERVATION DISTRICT STANDARD OPERATING PROCEDURE (S.O.P.) No. 1 FLOW MONITORING Page 2 of 18 Water Monitoring Program Standard Operating Procedure No.
Public Notice. Corps File No. LRE Date: March 19, 2017 Expires: March 18, 2022
 US Army Corps of Engineers Detroit District Public Notice Corps File No. LRE-2016-00006-100 Date: March 19, 2017 Expires: March 18, 2022 PUBLIC NOTICE ANNOUNCING REGIONAL CONDITIONS AND WATER QUALITY CERTIFICATIONS
Powder/Tongue River Basin Plan Available Surface Water Determination Task 3D
 Technical Memorandum Subject: Powder/Tongue River Basin Plan Available Surface Water Determination Task 3D Date: February 2002 Prepared by: HKM Engineering Inc. INTRODUCTION Spreadsheet water accounting
Undeveloped Zoning Inventory February 2004
 Undeveloped Zoning Inventory February 2004 Prepared by Planning Department Undeveloped Zoning Inventory February 2004 Project Description: The Undeveloped Zoning Inventory (the Inventory) is a periodic
CLAIBORNE LOCK AND DAM PERTINENT DATA
 CLAIBORNE LOCK AND DAM PERTINENT DATA GENERAL Location Clarke, Monroe, & Wilcox Counties, Alabama; Alabama River, river mile 72.5 Drainage area Millers Ferry to Claiborne sq. mi. 836 Total drainage area
Outline. 1. Overview 2. Population 3. Flooding 4. Land Use 5. References. Overview
 Outline 1. Overview 2. Population 3. Flooding 4. Land Use 5. References Overview The two main rivers in the Cannon River watershed are the Cannon and Straight Rivers. The Cannon River originates in Shields
Final Report August 2005
 2.0 REGIONAL STUDY AREA 2.1 Regional Setting 2.1.1 Topography The Los Angeles Region is located within the western portion of the Transverse Ranges Geomorphic Province. The San Andreas transform fault
Hard Hat Services ph: hardhatinc.com 932 N. Wright St., Suite 160 Naperville, IL 60563
 Interstate Power and Light Company Ottumwa Generation Station CCR Surface Impoundment Annual Inspection Report 154.018.015.003 Report issued: July 03, 2017 Hard Hat Services ph: 877-630-7428 hardhatinc.com
Coquitlam/Buntzen Project Water Use Plan
 Coquitlam/Buntzen Project Water Use Plan Temperature Monitoring Lower Coquitlam River Project Year 3 Report Reference: COQMON#6 Study Period: March 2008 April 2009 Report Date: April 2009 Trow Associates
APPENDIX C. Fluvial and Tidal Hydraulics Report
 APPENDIX C Fluvial and Tidal Hydraulics Report BUENA VISTA LAGOON ENHANCEMENT PROJECT FLUVIAL AND TIDAL HYDRAULICS ANALYSES Prepared for: SANDAG 401 B Street, Suite 800 San Diego, California 92101 Contact:
Creek Trash Assessment (CTA) Methodology (Demonstration: Mill Run Creek, Cheltenham, Pa.)
 Methodology (Demonstration: Mill Run Creek, Cheltenham, Pa.)") Creek Trash Assessment (CTA) Methodology (Demonstration: Mill Run Creek, Cheltenham, Pa.) Mill Run Creek emerges from a storm sewer in Philadelphia to an open creek in Cheltenham. The Creek downstream
Creek Trash Assessment (CTA) Methodology (Demonstration: Mill Run Creek, Cheltenham, Pa.) Mill Run Creek emerges from a storm sewer in Philadelphia to an open creek in Cheltenham. The Creek downstream
HEC 26 Aquatic Organism Passage Design Manual Evolution & Application
 HEC 26 Aquatic Organism Passage Design Manual Evolution & Application Sven Leon, P.E., Hydraulics Engineer Federal Highway Administration 2015 Alaska Fish Passage Meeting October 13 14, 2015 VTRC, Juneau,
Discussion on the Selection of the Recommended Fish Passage Design Discharge
 Discussion on the Selection of the Recommended Fish Passage Design Discharge Introduction The provision of fish passage is a requirement for most proposed culvert and bridge installations in Alberta, depending
HYDROLOGIC AND HYDRAULIC REPORT PROPOSED CULVERT STRUCTURES SR 194, SECTION 10
 HYDROLOGIC AND HYDRAULIC REPORT PROPOSED CULVERT STRUCTURES SR 194, SECTION 10 RACETRACK ROAD CULVERT OVER THE SPRING RUN & GREEN SPRINGS ROAD CULVERT OVER AN UNNAMED TRIBUTARY TO SPRING RUN BERWICK TOWNSHIP
An Analysis of the Travel Conditions on the U. S. 52 Bypass. Bypass in Lafayette, Indiana.
 An Analysis of the Travel Conditions on the U. S. 52 Bypass in Lafayette, Indiana T. B. T readway Research Assistant J. C. O ppenlander Research Engineer Joint Highway Research Project Purdue University
City of Elizabeth City Neighborhood Traffic Calming Policy and Guidelines
 City of Elizabeth City Neighborhood Traffic Calming Policy and Guidelines I. Purpose: The City of Elizabeth City is committed to ensure the overall safety and livability of residential neighborhoods. One
Inner Harbor Navigation Canal (IHNC) Basin 1% (100-yr) and 0.2% (500-yr) Surge and Wave Event Water Levels
 Basin 1% (100-yr) and 0.2% (500-yr) Surge and Wave Event Water Levels") Inner Harbor Navigation Canal (IHNC) Basin 1% (100-yr) and 0.2% (500-yr) Surge and Wave Event Water Levels Dr. John Grieshaber Hurricane Protection Office US Army Corps of Engineers Overview The IHNC basin
Inner Harbor Navigation Canal (IHNC) Basin 1% (100-yr) and 0.2% (500-yr) Surge and Wave Event Water Levels Dr. John Grieshaber Hurricane Protection Office US Army Corps of Engineers Overview The IHNC basin
Cumberland River Flood Preparedness Mapping and Products
 Cumberland River Flood Preparedness Mapping and Products Barry P. Moran, P.E. Hydraulic Engineer Nashville District September 2013 US Army Corps of Engineers BUILDING STRONG Authority: As a result of the
Distribution Restriction Statement Approved for public release; distribution is unlimited.
 CECW-EH Engineer Regulation 1110-2-1451 Department of the Army U.S. Army Corps of Engineers Washington, DC 20314-1000 Engineering and Design ACQUISITION OF LANDS DOWNSTREAM FROM SPILLWAYS FOR HYDROLOGIC
COST EFFECTIVE STORAGE CAPACITY INCREASE FOR ALUMINA TAILINGS DISPOSAL AREA THROUGH SPILLWAY OPTIMISATION
 COST EFFECTIVE STORAGE CAPACITY INCREASE FOR ALUMINA TAILINGS DISPOSAL AREA THROUGH SPILLWAY OPTIMISATION Abstract Lonie I * Tailings and Dams, GHD Brisbane, QLD, Australia Queensland Alumina Limited operates
Dam Breach Inundation Analysis
 Dam Breach Inundation Analysis Using HEC-RAS And GIS TWO CASE STUDIES IN BRITISH COLUMBIA, CANADA Canadian Dam Association 2014 Conference - Banff Alberta Presenters 2 Dwayne Meredith, P.Ag. KWL Vernon
North Diversion Channel Physical Modeling:
 North Diversion Channel Physical Modeling: Bike Notch Implementation Between Vineyard Arroyo Confluence to Osuna Bridge August 29, 2011 Prepared for Albuquerque Metropolitan Arroyo Flood Control Authority
Hydraulic Modeling of Stream Enhancement Methods
 Hydraulic Modeling of Stream Enhancement Methods Matthew J. Curry John J. Levitsky Abstract Development within watersheds increases the amounts of runoff causing stream erosion and degradation of stream
Culvert Design for Low and High Gradient Streams in the Midwest. Dale Higgins, Hydrologist Chequamegon-Nicolet National Forest
 Culvert Design for Low and High Gradient Streams in the Midwest Dale Higgins, Hydrologist Chequamegon-Nicolet National Forest Overview Culvert Design Considerations Hydraulic Terms Culvert Impacts Low
5.0 Roadway System Plan
 Southwest Boise Transportation Study Page 16 5.0 Roadway System Plan The Roadway System Plan outlines roadway improvements in the Initial Study Area. It forecasts future deficiencies on the arterial system,
HISTORY OF CONSTRUCTION
 HISTORY OF CONSTRUCTION CFR 257.73(c)(1) West Boiler Slag Pond Clifty Creek Plant Madison, Indiana October, 2016 Prepared for: Indiana Kentucky Electric Corporation Prepared by: American Electric Power
Stormwater Management Report for the Macri Dixon Condo Block
 for the Macri Dixon Condo Block Town of Milton February 2017 JFSA Ref. No.: 1287-15 Prepared for : Prepared by : David Schaeffer Engineering Ltd. 52 Springbrook Drive, Ottawa, ON K2S 1B9 tel.: 613.836.3884,
Skagit River Historical Flood Elevations and Peak Flow Estimates
 Skagit River Historical Flood Elevations and Peak Flow Estimates to be presented at Skagit River GI H&H Technical Workshop Wednesday, June 17, 2009 Background Corps of Engineers began a General Investigation
Chapter 11. Culverts and Bridges Design Checklist for Culvert Design
 Yes No N/A Design Requirements I. GENERAL DESIGN GUIDELINES Chapter 11. Culverts and Bridges A. Culvert design is in accordance with the Culverts chapter of Volume 2 of the UDFCD Manual for additional
Low Gradient Velocity Control Short Term Steep Gradient Channel Lining Medium-Long Term Outlet Control Soil Treatment Permanent [1]
![Low Gradient Velocity Control Short Term Steep Gradient Channel Lining Medium-Long Term Outlet Control Soil Treatment Permanent [1]](/thumbs/80/80811988.jpg "Low Gradient Velocity Control Short Term Steep Gradient Channel Lining Medium-Long Term Outlet Control Soil Treatment Permanent [1]") Check Dams DRAINAGE CONTROL TECHNIQUE Low Gradient Velocity Control Short Term Steep Gradient Channel Lining Medium-Long Term Outlet Control Soil Treatment Permanent [1] [1] Though not generally considered
Check Dams DRAINAGE CONTROL TECHNIQUE Low Gradient Velocity Control Short Term Steep Gradient Channel Lining Medium-Long Term Outlet Control Soil Treatment Permanent [1] [1] Though not generally considered
CENTER PIVOT EVALUATION AND DESIGN
 CENTER PIVOT EVALUATION AND DESIGN Dale F. Heermann Agricultural Engineer USDA-ARS 2150 Centre Avenue, Building D, Suite 320 Fort Collins, CO 80526 Voice -970-492-7410 Fax - 970-492-7408 Email - dale.heermann@ars.usda.gov
Assessment of Baseline Geomorphic Features at. Proposed Stream Crossings On The Proposed County Road 595. Marquette County, Michigan
 Assessment of Baseline Geomorphic Features at Proposed Stream Crossings On The Proposed County Road 595 Marquette County, Michigan Prepared for: Kennecott Eagle Minerals Company Marquette, Michigan Prepared
Traffic Impact Study. Westlake Elementary School Westlake, Ohio. TMS Engineers, Inc. June 5, 2017
 TMS Engineers, Inc. Traffic Impact Study Westlake Elementary School Westlake, Ohio June 5, 2017 Prepared for: Westlake City Schools - Board of Education 27200 Hilliard Boulevard Westlake, OH 44145 TRAFFIC
Sediment Basin 7E-12. Design Manual Chapter 7 - Erosion and Sediment Control 7E - Design Information for ESC Measures BENEFITS.
 7E-12 Design Manual Chapter 7 - Erosion and Sediment Control 7E - Design Information for ESC Measures Sediment Basin BENEFITS Flow Control Erosion Control Sediment Control Runoff Reduction Flow Diversion
Design of Turn Lane Guidelines
 Design of Turn Lane Guidelines CTS Transportation Research Conference May 24, 2012 Howard Preston, PE Minnesota Department of Transportation Research Services Office of Policy Analysis, Research & Innovation
Huntington District. For More Information Contact (304)
") Zoar Levee & Diversion Dam are located in the Muskingum River Basin highlighted in green to left. The Muskingum River Basin is the site of Ohio s first multiple purpose water management and land conservation
Zoar Levee & Diversion Dam are located in the Muskingum River Basin highlighted in green to left. The Muskingum River Basin is the site of Ohio s first multiple purpose water management and land conservation
I-290 Phase I Study Area OAK PARK AVE AUSTIN BLVD. Reconstruction Area (9 miles) Oak Park RIDGELAND AVE CENTRAL AVE HARLEM AVE. Cicero.
 Oak Park RIDGELAND AVE CENTRAL AVE HARLEM AVE. Cicero.") RIDGELAND AVE OAK PARK AVE AUSTIN BLVD UP-RR BRC-RR ASHLAND AVE Study Area Map I-290 Phase I Study Area 294 UP RR Metra UP-W Illinois Prairie Path 38 Berkeley WOLF RD Hillside MANNHEIM RD Bellwood 290
RIDGELAND AVE OAK PARK AVE AUSTIN BLVD UP-RR BRC-RR ASHLAND AVE Study Area Map I-290 Phase I Study Area 294 UP RR Metra UP-W Illinois Prairie Path 38 Berkeley WOLF RD Hillside MANNHEIM RD Bellwood 290
At each type of conflict location, the risk is affected by certain parameters:
 TN001 April 2016 The separated cycleway options tool (SCOT) was developed to partially address some of the gaps identified in Stage 1 of the Cycling Network Guidance project relating to separated cycleways.
Broadly speaking, there are four different types of structures, each with its own particular function:
 3 The selection of structures 3.1 Introduction In selecting a suitable structure to measure or regulate the flow rate in open channels, all demands that will be made upon the structure should be listed.
U.S. Army Engineer Institute for Water Resources
 Sea Level Change Curve Calculator (2014.88) (DRAFT) U.S. Army Engineer Institute for Water Resources Table of Contents 1. INTRODUCTION... 2 1.1 BACKGROUND... 2 1.1.1 INFORMATION QUALITY ACT... 2 1.2 OVERVIEW...
Calculation of Trail Usage from Counter Data
 1. Introduction 1 Calculation of Trail Usage from Counter Data 1/17/17 Stephen Martin, Ph.D. Automatic counters are used on trails to measure how many people are using the trail. A fundamental question
Traffic Impact Analysis (TIA) Process and Procedures Manual. September 2017
 Process and Procedures Manual. September 2017") Traffic Impact Analysis (TIA) Process and Procedures Manual Post Office Box 664 101 Huntersville-Concord Road Huntersville, NC 28070 Phone 704-766-2220 Fax 704-992-5528 www.huntersville.org (c) 2017, Town
Traffic Impact Analysis (TIA) Process and Procedures Manual Post Office Box 664 101 Huntersville-Concord Road Huntersville, NC 28070 Phone 704-766-2220 Fax 704-992-5528 www.huntersville.org (c) 2017, Town
Assessment of Soil Erosion at a DC Park Facility Spring Valley Park NW Washington, DC
 Assessment of Soil Erosion at a DC Park Facility Spring Valley Park NW Washington, DC Annual Progress Report for FY 2004 Prepared by: Principal Investigators: Inder Bhambri, Ph.D., PE Philip Brach, Ph.D.,
Evaluating the Design Safety of Highway Structural Supports
 Evaluating the Design Safety of Highway Structural Supports by Fouad H. Fouad and Elizabeth A. Calvert Department of Civil and Environmental Engineering The University of Alabama at Birmingham Birmingham,
APPENDIX 2 LAKESHORE ROAD TRANSPORTATION REVIEW STUDY EXECUTIVE SUMMARY
 APPENDIX 2 LAKESHORE ROAD TRANSPORTATION REVIEW STUDY EXECUTIVE SUMMARY Appendix 2 City of Mississauga Lakeshore Road FINAL REPORT Transportation Review Study December 2010 EXECUTIVE SUMMARY Study Purpose
Hard Hat Services ph: hardhatinc.com 932 N. Wright St., Suite 160 Naperville, IL 60563
 Interstate Power and Light Company Ottumwa Generation Station CCR Surface Impoundment Annual Inspection Report 154.018.012.003 Report issued: December 21, 2016 Hard Hat Services ph: 877-630-7428 hardhatinc.com
TOP:001.3 U.S. Fish and Wildlife Service TECHNICAL OPERATING PROCEDURE
 TOP:001.3 March 12, 2015 U.S. Fish and Wildlife Service Marquette Biological Station 3090 Wright Street Marquette, Michigan 49855 U.S.A. and U.S. Fish and Wildlife Service Ludington Biological Station