The Effect of Immobilisation Devices on Radiotherapy Dose Distributions. Alison Gray August 2007
|
|
|
- Arnold Welch
- 5 years ago
- Views:
Transcription
1 The Effect of Immobilisation Devices on Radiotherapy Dose Distributions A thesis submitted in fulfilment of the requirements for the Degree of Master of Applied Science (Medical and Health Physics) By Alison Gray August 2007 School of Applied Sciences RMIT University Melbourne VIC Australia Department of Radiation Oncology Royal North Shore Hospital St Leonards NSW Australia Page 1 of 169
2 Declaration I certify that except where due acknowledgement or reference has been made, the work is that of the author alone; the work has not been submitted previously, in whole or in part, to qualify for any other academic award; the content of the thesis is the result of work which has been carried out since the official commencement date of the approved research program; and, any editorial work, paid or unpaid, carried out by a third party is acknowledged. Alison Gray August 2007 Page 2 of 169
3 Acknowledgements My supervisors, Professor Peter Johnston and Associate Professor Lyn Oliver for their guidance throughout the project and advice while writing this thesis. My fellow Medical Physicists at Royal North Shore Hospital (RNSH) for allowing time and resources to work on this project and providing constructive criticism. Particularly Regina Bromley who guided me in the initial phases of the project, teaching me how to use the Eclipse treatment planning system and verify treatment plans using an anthropomorphic phantom as well as assisting with the initial measurements. Denis Pearsall, the Radiation Oncology department s Mechanical Workshop Technician, for building customised fittings for the Wellhöfer tank to hold the NACP chamber and support water equivalent slabs. Tony Lee, the Radiation Oncology department s Mould Room Technician for making and teaching me how to make foam supports that create air gaps in a slab phantom. The RNSH Radiation Oncologists and Therapists who have supported my work and enabled a new clinical technique to be implemented. All those who were involved in developing the working radiotherapy treatment program (utilising linear accelerators and the Eclipse treatment planning system) and the ionisation chamber and thermoluminescent dosimetry systems at RNSH. Emily Flower and Sandie Fisher for proof reading my thesis. NSW Health for providing funding for the course fees and funding to attend the EPSM 2006 and the 9 th Biennial ESTRO Meeting on Physics and Radiation Technology for Clinical Radiotherapy conferences to present the work conducted as part of this project. All my family and friends, for their support and understanding, throughout the process of completing this degree. Page 3 of 169
4 Summary Typically, when a beam passes through an immobilisation device, the dosimetric effects of that device are ignored or a blanket transmission factor is applied to correct the dose calculation. When the immobilisation device is: not of uniform density; not of uniform thickness or material; or not effectively radio-translucent; this can lead to large inaccuracies in the dose calculation. By including the physical characteristics of the immobilisation device in the dose calculation by the treatment planning system, a more accurate dose distribution may be obtained. However, limitations of some dose calculation algorithms can result in errors beyond low density inhomogeneities, such as those created by immobilisation devices. Previous studies have shown that algorithms utilising the equivalent tissue air ratio inhomogeneity correction method overestimate the dose within and immediately beyond low density inhomogeneities. This is primarily due to the assumption that there is electronic equilibrium at all points in the dose calculation and the inability of the algorithm to account for changes in electron transport caused by inhomogeneities. Aim 1 The first aim of this project was to confirm if the Eclipse pencil beam convolution dose calculation algorithm (when utilising the equivalent tissue air ratio inhomogeneity correction) can calculate the dose distribution and monitor units to within acceptable clinical tolerances when the treatment fields pass though a physically complex and/or low density immobilisation device which is included in the dose calculation. To investigate this aim, treatments were planned using the Eclipse treatment planning system with a 6 MV photon beam passing through four different immobilisation devices (a MEDTEC Contoura belly board, a Sinmed Page 4 of 169
5 Posiboard -2 breast board, a VacFix vacuum bag and a MEDTEC Type-S head extension). The dose distribution and monitor units for the plans were calculated with and without the immobilisation device included in the dose calculation. For each device, a simple case using a solid water slab phantom and a complex case using an anthropomorphic phantom were studied. The plans were delivered and the dose measured using an ionisation chamber for the simple case and thermoluminescent dosimeters for the complex case. For the simple case, the maximum difference between the measured and calculated dose was -8.4% and -1.6% when the immobilisation device was omitted from and included in the dose calculation respectively. For the complex case, the maximum difference between the measured and calculated doses was -7.7% and -2.5% when the immobilisation device was omitted from and included in the dose calculation respectively. For all cases when the immobilisation device was included in the dose calculation, the results were within an acceptable clinical tolerance level of 2.5%. Aim 2 As large air gaps are sometimes created by the use of immobilisation devices, the second aim was to determine the magnitude of any errors in the Eclipse dose calculation for points located beyond large air gaps. To investigate the second aim, 6 MV photon beam depth dose data was measured beyond various thickness of air gap (1, 3, 5, 8, 10, 12.5 and 15 cm) simulated by supporting water equivalent slabs (0.2, 0.5, 1, 2, 3 and 4 cm thickness) above a water phantom. A parallel plate ionisation chamber, immersed in water beyond the air gap, was used for these measurements. The results were then compared to the results predicted by Eclipse. The results indicate that for a given thickness of material before the air gap, as the air gap thickness increases, the dose at the distal surface of the air gap Page 5 of 169
6 decreases. The depth of dose maximum in the material beyond the air gap also increases as the air gap thickness increases. For a given air gap thickness, as the thickness of material placed before the air gap increases, the depth at which the maximum dose occurs, shifts towards the surface. Eclipse does not predict the reduction in dose beyond the air gap for any air gap thickness or the corresponding shift in the depth of dose maximum. As the thickness of material before the air gap increases, the reduction in dose beyond the air gap continues beyond the re-establishment of electronic equilibrium. In the case of 2 cm thick water equivalent material placed before a 15 cm air gap, Eclipse over-predicts the dose by 34% at the surface of the water phantom and by 3%, 3% and 2% at depths of 5, 10 and 15 cm respectively. A scatter analysis found that the reduction in dose beyond the air gap is due to a reduction in scattered radiation reaching the measurement point. Eclipse does not predict this as it does not account for situations of electronic disequilibrium (which occur due to the presence of an air gap) or changes in electron transport caused by inhomogeneities. It is also due to limitations in the equivalent tissue air ratio inhomogeneity correction method when accounting for scattered photons. The current study has shown that including the immobilisation device in the dose calculation when the treatment field passes through the device, improves the accuracy of the dose calculation to within clinical tolerance levels. However, when large air gaps are created by an immobilisation device, significant errors can still result, particularly in the region immediately beyond the air gap. The air gap investigation has extended the range of results obtained from previous studies from a maximum air gap thickness of 5 cm to 15 cm and from a maximum depth beyond the air gap of 4 cm to 15 cm. The data obtained in this study may be used to apply corrections to dose calculations by Eclipse when an air gap is present for a broad range of clinical situations. Page 6 of 169
7 Table of Contents DECLARATION...2 ACKNOWLEDGEMENTS...3 SUMMARY...4 TABLE OF CONTENTS...7 LIST OF ACRONYMS AND ABBREVIATIONS...10 LIST OF TABLES...12 LIST OF FIGURES INTRODUCTION THESIS STRUCTURE PAPERS PRESENTED BACKGROUND THE PROCESS OF RADIATION THERAPY TOLERANCES FOR THE ACCURACY OF DOSE CALCULATIONS THE ECLIPSE TREATMENT PLANNING SYSTEM THE BODY STRUCTURE INCORPORATING OBJECTS OUTSIDE THE BODY STRUCTURE THE ECLIPSE DOSE CALCULATION ALGORITHM Pencil Beam Convolution Algorithm The Equivalent Tissue Air Ratio Inhomogeneity Correction Method DOSIMETRIC EFFECTS OF OBJECTS OUTSIDE THE PATIENT IMMOBILISATION DEVICES Thermoplastics PMMA Boards...44 Page 7 of 169
8 Polystyrene and Polyurethane Foam and Vacuum Bags Other Immobilisation Devices BLOCK TRAYS Surface Dose Transmission TREATMENT COUCHES Carbon Fibre Composites Solid Carbon Fibre Mylar & Carbon Fibre Grid or Tennis String ACCOUNTING FOR THE DOSIMETRIC EFFECTS OF OBJECTS OUTSIDE THE PATIENT AVOIDING BEAM/COUCH INTERSECTION INCLUDING OBJECTS OUTSIDE THE PATIENT IN THE DOSE CALCULATION REPRODUCIBILITY OF PATIENT POSITION INVESTIGATIONS INTO EFFECTS OF AIR CAVITIES AND LOW DENSITY INHOMOGENEITIES ON DOSE CALCULATIONS AIR CAVITIES LOW DENSITY INHOMOGENEITIES INVESTIGATION INTO THE DOSE BEYOND IMMOBILISATION DEVICES MATERIALS PHANTOMS Slab Phantom Anthropomorphic Phantom IMMOBILISATION DEVICES DOSIMETRY SYSTEMS Ionisation Chamber Thermoluminescent Dosimeters METHODS SLAB PHANTOM SET UPS Without Immobilisation Device With Immobilisation Device RANDO PHANTOM SET UPS Without Immobilisation Device With Immobilisation Device RESULTS AND DISCUSSION ERRORS AND UNCERTAINTIES SLAB PHANTOM No Immobilisation Device With Immobilisation Device RANDO PHANTOM No Immobilisation Device With Immobilisation Device CONCLUSIONS INVESTIGATION INTO THE DOSE BEHIND AIR GAPS MATERIALS...97 Page 8 of 169
9 4.1.1 WATER PHANTOM AND PARALLEL PLATE IONISATION CHAMBER WATER EQUIVALENT SLAB PHANTOM AND CYLINDRICAL ION CHAMBER TRANSMISSION MEASUREMENTS METHODS DEPTH DOSE BEYOND AIR GAPS Experimental Set Up Calculating the Dose using Eclipse (Treatment Planning) Experimental Measurements (Treatment Delivery) TRANSMISSION MEASUREMENTS SCATTER ANALYSIS RESULTS ERRORS AND UNCERTAINTIES DEPTH DOSE DATA Depth of Dose Maximum TRANSMISSION RESULTS SCATTER ANALYSIS DISCUSSION SURFACE DOSE AND DOSE IN THE BUILD UP REGION DEPTH OF DOSE MAXIMUM DOSE BEYOND THE DEPTH OF DOSE MAXIMUM CONCLUSIONS DISCUSSION OF COMBINED RESULTS AND CONCLUSIONS SUMMARY OF RESULTS DISCUSSION OF COMBINED RESULTS SLAB PHANTOM WITH IONISATION CHAMBER RANDO PHANTOM WITH TLDS CONCLUSIONS AREAS REQUIRING FURTHER STUDY REFERENCES APPENDICES PAPER PRESENTED AT THE ACPSEM ACT/NSW BRANCH RESEARCH COMMITTEE MEDPHYS06. INSTITUTE OF MEDICAL PHYSICS, SCHOOL OF PHYSICS, UNIVERSITY OF SYDNEY. 1 ST DECEMBER ECLIPSE TREATMENT PLANNING SYSTEM PENCIL BEAM CONVOLUTION DOSE CALCULATION ALGORITHM THE EQUIVALENT TISSUE AIR RATIO INHOMOGENEITY CORRECTION METHOD MEASURED AND ECLIPSE AIR GAP DEPTH DOSE DATA RESULTS OF TRANSMISSION MEASUREMENTS RESULTS OF AIR GAP SCATTER ANALYSIS Page 9 of 169
10 List of Acronyms and Abbreviations AAA AAPM ACPSEM CT CTG ESTRO EPI ETAR Gy IAEA ICRU IMRT LINAC MeV MLC MRI MU MV NACP NE PBC PET PMMA RMI RW SAR SPECT Anisotropic Analytical Algorithm American Association of Physicists in Medicine Australasian College of Physical Scientists and Engineers in Medicine Computed Tomography Certified Therapy Grade European Society for Therapeutic Radiology and Oncology Electronic Portal Imaging Equivalent Tissue Air Ratio Gray International Atomic Energy Agency International Commission on Radiation Units and Measurements Intensity Modulated Radiation Therapy Linear Accelerator Mega-electron-volt Multi-Leaf Collimator Magnetic Resonance Imaging Monitor Unit Megavolt Nordic Association of Clinical Physicists Nuclear Enterprises Pencil Beam Convolution Positron Emission Tomography Polymethylmethacrylate Radiation Measurements Incorporated Rigid Water Scatter Air Ratio Single Photon Emission Computed Tomography Page 10 of 169
11 SSD TAR TLD TMR TPS 2D 3D Source to Surface Distance Tissue Air Ratio Thermoluminescent Dosimetry Tissue Maximum Ratio Treatment Planning System Two Dimensional Three Dimensional Page 11 of 169
12 List of Tables Table 2.1 Surface dose for a 6 MV photon beam when using a block tray (Rao et al 1973)...47 Table 2.2 Immobilisation capabilities for various treatment sites (Verhey 1995).56 Table 2.3 Secondary build up range (depth where electronic equilibrium is reestablished) measured using a Markus chamber for 100 cm SSD, 4 cm solid water before air gap (Wong et al 1992)...59 Table 2.4 Percentage errors at the distal surface of a slab air cavity between the experimental data obtained using a Markus chamber and the ETAR calculated values for 100 cm SSD, 4 cm solid water before air gap (Wong et al 1992) Table 2.5 Percentage difference between the ETAR predicted dose and the dose measured with a thimble ionisation chamber in a 4 cm solid water / 8 cm solid lung / 4 cm solid water phantom (Metcalfe et al 1993)...61 Table 3.1 The percentage difference between the measured and calculated dose for the slab phantom, no immobilisation device set up. The uncertainty for the measured dose is estimated to be ±2% and for the calculated dose ±1% Table 3.2 The percentage difference between the measured and calculated dose for the slab phantom, with immobilisation device set up (Head Extension Board). The uncertainty for the measured dose is estimated to be ±2% and for the calculated dose ±2.5%...84 Table 3.3 The percentage difference between the measured and calculated dose for the slab phantom, with immobilisation device set up (Belly Board, Breast Board and Vacuum Bag). The uncertainty for the measured dose is estimated to be ±2% and for the calculated dose ±2.5%...85 Table 3.4 The percentage difference between the measured and calculated dose for the RANDO phantom, no immobilisation device set up. The uncertainty for the measured dose is estimated to be ±3% and for the calculated dose ±2.5%. 89 Table 3.5 The percentage difference between the measured and calculated dose for the RANDO phantom, with immobilisation device set up. The uncertainty Page 12 of 169
13 for the measured dose is estimated to be ±3% and for the calculated dose ±2.5%...90 Table 4.1 Measured depth dose data and percentage variation of measured depth dose data from Eclipse calculated results beyond various air gaps for 0.5 cm water equivalent material before the air gap. The uncertainty for the measured dose is estimated to be ±2% and for the calculated dose ±2.5% Table 4.2 Measured depth dose data and percentage variation of measured depth dose data from Eclipse calculated results beyond various air gaps for 2.0 cm water equivalent material before the air gap. The uncertainty for the measured dose is estimated to be ±2% and for the calculated dose ±2.5% Table 4.3 Measured depth dose data and percentage variation of measured depth dose data from Eclipse calculated results beyond various air gaps for 4.0 cm water equivalent material before the air gap. The uncertainty for the measured dose is estimated to be ±2% and for the calculated dose ±2.5% Table 4.4 Depth of dose maximum (cm) determined experimentally. The depth of dose maximum measured for an open field was 1.34 cm. The uncertainty is estimated to be ±0.2 cm Table 4.5 Depth of dose maximum (cm) calculated by Eclipse. The depth of dose maximum calculated by Eclipse for an open field was 1.32 cm Table 4.6 Comparison of surface dose results for 4 cm water equivalent material before various air gaps (6 MV, 10 x 10 cm 2 field size, 100 cm SSD) Table 4.7 Comparison of surface dose results for 4 cm water equivalent material before various air gaps (6 MV, 10 x 10 cm 2 field size, 100 cm SSD Page 13 of 169
14 List of Figures Figure 2.1 CT scan of anthropomorphic phantom with mask and head extension board with a body structure (green shading) including only the phantom Figure 2.2 Effect of part of an object not being included in the body structure. The upper part of the object is not included in the body structure on the left image (a) but is included in right image (b)...32 Figure 2.3 Block tray, with (a) and without (b) a block in place Figure 2.4 An illustration of the effect of applying a transmission factor on the dose distribution and MUs. The dose distribution with (a) and without (b) the transmission factor applied is shown Figure 2.5 An example of a treatment through a head extension board where a transmission factor could be applied...35 Figure 2.6 A 3D reconstructed image (a) and beams eye view (b) of a patient on a breast board where the beam passes through varying thickness of a breast board...36 Figure 2.7 A example of a body structure which has been extended to incorporate a head extension board, head rest and face mask Figure 2.8 Carbon fibre grid couch insert. ( Figure 2.9 Tennis String couch insert. ( Figure 2.10 Head extension couch overlay ( Figure 3.1 Certified Therapy Grade Solid Water ( _id=359&oscsid=b7d ea29f2c28797ea701f0441) Figure 3.2 Acrylic and RW3 (Goettingen White Water) Slab Phantoms ( Figure 3.3 A schematic diagram of the slab phantom...66 Page 14 of 169
15 Figure 3.4 RANDO anthropomorphic phantom ( Figure 3.5 MEDTEC Contoura Belly Board ( Figure 3.6 Sinmed Posiboard -2 Breast Board ( Figure 3.7 VacFix Vacuum Bag ( Figure 3.8 MEDTEC Type-S Head Extension ( Figure 3.9 Top left: Four loose Harshaw TLD-100 chips. Top right: Four Harshaw TLD-100 chips wrapped in thin plastic. Bottom left: two halves of a hollow plug used for containing TLDs in a RANDO anthropomorphic phantom. Bottom right: a tissue equivalent plug used throughout a RANDO anthropomorphic phantom Figure 3.10 Plan created in Eclipse for the slab phantom alone Figure 3.11 The set up for the shoulder support region of the head extension board on the slab phantom Figure 3.12 Plans created in Eclipse for the shoulder region of the head extension board with only the phantom included in the body structure (a) and with the phantom and the immobilisation device included in the body structure (b)...79 Figure 3.13 The plans for the RANDO phantom with fields passing through tissue (a) and bone (b)...80 Figure 3.14 Fields created for the RANDO phantom on the breast board with only the phantom included in the body structure (a) and with the phantom and the immobilisation device included in the body structure (b)...81 Figure 4.1 Examples of patient treatments where the field passes through a large air gap prior to entering the patient. (a) A posterior axilla field for a patient on a breast board; (b) a posterior oblique IMRT field to the parotid where the patient is positioned with a face mask on a head rest and PMMA board; and (c) a posterior field to the femur where the patient is positioned using a knee rest...96 Figure 4.2 Illustration of the experimental set up for the air gap experiments for the water phantom (a) and the water equivalent slab phantom (b) Page 15 of 169
16 Figure 4.3 Wellhöfer blue water phantom ( Wellhöfer.com/fileadmin/pdf/products/Relative_Dosimetry/Blue_Phantom.pdf).99 Figure 4.4 Narrow and broad beam geometry (Bushberg et al 2002) Figure 4.5 Experimental set up for the transmission measurements Figure 4.6 Measured and Eclipse depth dose data beyond various air gaps for 0.5 cm water equivalent material before the air gap. The uncertainty for the measured dose is estimated to be ±2% and for the calculated dose ±2.5% Figure 4.7 Measured and Eclipse depth dose data beyond various air gaps for 2.0 cm water equivalent material before the air gap. The uncertainty for the measured dose is estimated to be ±2% and for the calculated dose ±2.5% Figure 4.8 Measured and Eclipse depth dose data beyond various air gaps for 4.0 cm water equivalent material before the air gap. The uncertainty for the measured dose is estimated to be ±2% and for the calculated dose ±2.5% Figure 4.9 The total dose due to scatter from the 0.5 cm water equivalent material before the air gap. The uncertainty in the dose calculation is estimated to be ±2.5% Figure 4.10 The total dose due to scatter from the 2.0 cm water equivalent material before the air gap. The uncertainty in the dose calculation is estimated to be ±2.5% Figure 4.11 The total dose due to scatter from the 4.0 cm water equivalent material before the air gap. The uncertainty in the dose calculation is estimated to be ±2.5% Figure 7.1 Scatter kernels of different dimension: (a) beam, (b) slab, (c) pencil and (d) point (Van Dyk 1999) Figure 7.2 An illustration of the set ups used to determine a tissue air ratio (Khan 2003) Figure 7.3 An illustration of the set ups used to determine a tissue maximum ratio (Khan 2003) Figure 7.4 A schematic illustration of coalescing six CT slices into an effective CT slice (Sontag and Cunningham 1978) Page 16 of 169
17 Figure 7.5 Depth dose data behind various air gaps, for 0.2 cm water equivalent material before the air gap, experimentally determined (a) and Eclipse calculated (b) results. The uncertainty for the measured dose is estimated to be ±2% and for the calculated dose ±2.5% Figure 7.6 Depth dose data behind various air gaps, for 0.5 cm water equivalent material before the air gap, experimentally determined (a) and Eclipse calculated (b) results. The uncertainty for the measured dose is estimated to be ±2% and for the calculated dose ±2.5% Figure 7.7 Depth dose data behind various air gaps, for 1.0 cm water equivalent material before the air gap, experimentally determined (a) and Eclipse calculated (b) results. The uncertainty for the measured dose is estimated to be ±2% and for the calculated dose ±2.5% Figure 7.8 Depth dose data behind various air gaps, for 2.0 cm water equivalent material before the air gap, experimentally determined (a) and Eclipse calculated (b) results. The uncertainty for the measured dose is estimated to be ±2% and for the calculated dose ±2.5% Figure 7.9 Depth dose data behind various air gaps, for 3.0 cm water equivalent material before the air gap, experimentally determined (a) and Eclipse calculated (b) results. The uncertainty for the measured dose is estimated to be ±2% and for the calculated dose ±2.5% Figure 7.10 Depth dose data behind various air gaps, for 4.0 cm water equivalent material before the air gap, experimentally determined (a) and Eclipse calculated (b) results. The uncertainty for the measured dose is estimated to be ±2% and for the calculated dose ±2.5% Figure 7.11 Transmission through water equivalent RW3 slabs for a 6 MV photon beam, 5 x 4 cm 2 field size defined at the isocentre Figure 7.12 Transmission through water equivalent RW3 slabs for a 6 MV photon beam, 10 x 10 cm 2 field size defined at the isocentre Figure 7.13 The dose from scattered radiation created by 0.2 cm of water equivalent material before an air gap as a function of depth beyond the air gap Page 17 of 169
18 for various thickness air gaps. The uncertainty in the dose calculation is estimated to be ±2.5% Figure 7.14 The dose from scattered radiation created by 0.5 cm of water equivalent material before an air gap as a function of depth beyond the air gap for various thickness air gaps. The uncertainty in the dose calculation is estimated to be ±2.5% Figure 7.15 The dose from scattered radiation created by 1.0 cm of water equivalent material before an air gap as a function of depth beyond the air gap for various thickness air gaps. The uncertainty in the dose calculation is estimated to be ±2.5% Figure 7.16 The dose from scattered radiation created by 2.0 cm of water equivalent material before an air gap as a function of depth beyond the air gap for various thickness air gaps. The uncertainty in the dose calculation is estimated to be ±2.5% Figure 7.17 The dose from scattered radiation created by 3.0 cm of water equivalent material before an air gap as a function of depth beyond the air gap for various thickness air gaps. The uncertainty in the dose calculation is estimated to be ±2.5% Figure 7.18 The dose from scattered radiation created by 4.0 cm of water equivalent material before an air gap as a function of depth beyond the air gap for various thickness air gaps. The uncertainty in the dose calculation is estimated to be ±2.5% Page 18 of 169
19 1 Introduction The aim of radiotherapy is to deliver a precise dose of radiation to a well defined target volume with the least possible damage caused to surrounding healthy tissues. The process of radiation therapy using a linear accelerator (LINAC) involves many steps prior to treatment, including treatment simulation and treatment planning. Treatment simulation involves obtaining computed tomography (CT) images of the patient set up in the treatment position for use in the treatment planning stage. Treatment planning is conducted using software referred to as a treatment planning system (TPS). It involves defining the target volume, selecting the optimum radiation beam angles and field sizes, calculating the dose distribution and determining the number of monitor units required to deliver the dose. (A definition of monitor units and how they are calibrated can be found in Section 2.1). The patient s treatment typically occurs daily over a number of weeks (Van Dyk 1999). The International Commission on Radiation Units and Measurements (ICRU) recommends that the absorbed dose to the target volume should be delivered to an accuracy of 5% or better (ICRU Report ). This means that the accuracy for each of the plan and treat steps must be better than 2.5% (Van Dyk 1999). Immobilisation devices are often used to aid patient set up and limit patient motion. They assist in maintaining the accuracy required throughout treatment planning and delivery (Van Dyk 1999, Podgorsak 2003, Van Dyk 2003, Khan 2007). Low density materials, such as foam or carbon fibre/foam composites, are often used to create immobilisation devices with the aim of being radiotranslucent. However, sometimes higher density materials such as solid carbon fibre or plastic are required for strength and rigidity or to create a hinge or pivot Page 19 of 169
20 point to allow the set up to be adjusted or to fix the immobilisation device to the treatment couch. Typically when a beam passes through an immobilisation device, the dosimetric effects of this device are ignored or a blanket transmission factor is applied to the dose calculation. When the immobilisation device is not of uniform density or thickness or not effectively radio-translucent, this can lead to large inaccuracies in the dose calculation. By including the physical characteristics of the immobilisation device in the dose calculation conducted by the TPS, a more accurate dose distribution may be obtained. In the Eclipse TPS (Varian Medical Systems, Palo Alto, CA, USA), this is achieved by including the immobilisation device in the body structure defined during the treatment planning process. Previous studies have shown that algorithms utilising the equivalent tissue air ratio (ETAR) inhomogeneity correction method overestimate the dose within and immediately beyond low density inhomogeneities. This is primarily due to the assumption that there is electronic equilibrium at all points in the dose calculation and the inability of the algorithm to account for changes in electron transport with inhomogeneities. The low density inhomogeneities investigated were typically representative of those within the patient such as lung (Mackie et al 1985, Metcalfe et al 1993, du Plessis et al 2001, Carrasco et al 2004) or small air cavities (Wong et al 1992, Wong et al 1996, Shahine et al 1999, du Plessis et al 2001). The only study found to have investigated the inclusion of an immobilisation device in the dose calculation was by Munjal et al (2006). In this study the dose in an Intensity Modulated Radiation Therapy (IMRT) phantom (a device for simulating the in vivo interaction of radiation with tissue (Burr et al 1991)) was investigated with a field passing through a PMMA (Polymethylmethacrylate) base plate supported approximately 8 cm above the phantom. They found that the PLATO-SUNRISE TPS, which utilises the ETAR method of inhomogeneity Page 20 of 169
21 correction, calculated the dose to within 1.5% at the centre of the phantom. No studies investigating the ability of a TPS to calculate the dose through other immobilisation devices, such as non-uniform or low density devices were found in a literature search. In practice, large air gaps are sometimes created by immobilisation devices which support the patient above the treatment couch. This problem is common when using tilted breast boards, head rests or knee supports. For example, when a posterior field passes through the breast board (see Figure 3.6 (page 68)), the beam may first pass through the treatment couch and/or the base of the breast board, a large air gap then the tilted back support region of the board before entering the patient. When a head rest or knee support is used, fields which pass through the treatment couch may also pass through an air gap between the couch and the patient. Examples of a patient treatment for each of these cases are illustrated in Figure 4.1 (page 96). No studies were found in the literature that investigated the accuracy of a TPS to calculate the dose distribution behind large air gaps (greater than 5 cm) such as those created by immobilisation devices. Aim 1 The first aim of this project was to confirm if the Eclipse pencil beam convolution (PBC) dose calculation algorithm, when utilising the ETAR inhomogeneity correction, can calculate the dose distribution and monitor units to within an acceptable clinical tolerance of 2.5% when the treatment fields pass though a physically complex and/or low density immobilisation device which is included in the dose calculation. Page 21 of 169
22 Aim 2 The second aim of this project was to determine the magnitude of any errors in the Eclipse dose calculation for points located beyond large air gaps. 1.1 Thesis Structure Chapter two discusses the process of radiation therapy and the accuracy achievable throughout the process. The Eclipse TPS and the aspects of: the dose calculation algorithm (such as the inhomogeneity correction method used in this project) and; the use of contoured structures and transmission factors in the dose calculation process; are described. In addition, the previously published work relating to the dosimetric effects of objects outside the patient is reviewed. The accuracy of dose calculations beyond low density inhomogeneities and air cavities is also reviewed. Chapter three describes the materials and methods for the simulation and delivery of simple and complex patient treatments utilising the following four immobilisation devices: MEDTEC Contoura belly board; Sinmed Posiboard -2 breast board; VacFix vacuum bag and; MEDTEC Type-S head extension). A discussion of the results obtained is also included. To create a simple case, treatment plans were created for slabs of water equivalent material simulating a unit density patient with an immobilisation device Page 22 of 169
23 placed above the slabs. A treatment field passed through the immobilisation device and the phantom. Using the LINAC to deliver the planned treatment, the dose at the centre of the water equivalent phantom was measured with an ionisation chamber and compared to the dose predicted by the Eclipse plan. To create a more complex situation, treatment plans were created for an anthropomorphic phantom placed on each of the immobilisation devices with fields passing through the immobilisation device. Thermoluminescent dosimeters were inserted into the anthropomorphic phantom at precise positions to measure the dose delivered at various points within the treatment field. The dose measured was then compared to the dose calculated by Eclipse. Chapter four describes the materials and methods used to investigate the dose beyond large air gaps. Large air gaps that can be created by an immobilisation device were simulated using water equivalent slabs supported above a water phantom. The dose beyond the air gap was measured using a parallel plate ionisation chamber in the water phantom. The measured results were then compared to the dose predicted by Eclipse. A discussion of the results is also included. Chapter five contains a summary of the results from the two studies, a discussion of how the results correlate and the conclusions drawn, with a suggestion of further work that may be continued relating to this project. Chapter six contains the references used throughout this project. Chapter seven contains the Appendices, including further information relating to the Eclipse TPS and an extended set of results. Page 23 of 169
24 1.2 Papers Presented Papers presented during the course of this project include the following: A. Gray*, R. Bromley, L. Oliver, J. Martland, P. Johnston. Verification of the dose calculated in an Eclipse treatment planning system when an immobilisation device is included in the body contour. Engineers and Physical Scientists in Medicine Conference, Noosa, Sunshine Coast, Queensland, September A. Gray*, R. Bromley, L. Oliver, J. Martland, P. Johnston. Verification of the dose calculated in an Eclipse treatment planning system when an immobilisation device is included in the body contour. ACPSEM ACT/NSW Branch Research Committee MedPhys06. Institute of Medical Physics, School of Physics, University of Sydney. 1st December A copy of the presentation can be found in Appendix 7.1. A. Gray*, L. Oliver, S. Brown and P. Johnston. Perturbation of dose caused by large air gaps created by patient positioning devices. 9 th Biennial ESTRO Meeting on Physics and Radiation Technology for Clinical Radiotherapy. Barcelona, Spain, September Abstract accepted. A. Gray*, L. Oliver, S. Brown, P. Johnston. Dose perturbation caused by large air gaps created by immobilisation devices. Engineers and Physical Scientists in Medicine Conference, Fremantle, Western Australia, October Abstract accepted. * Presenter Page 24 of 169
25 2 Background This chapter describes the process of radiation therapy, the accuracy achievable throughout the process, the relevant aspects of the Eclipse TPS and the dose calculation algorithm used throughout this study. It also contains a review of the published literature regarding the dosimetric effects of objects outside the patient as well as the ability of TPSs to calculate the dose within and beyond low density media and air gaps. 2.1 The Process of Radiation Therapy The process of radiation therapy using a LINAC involves many steps, including: Diagnosis and clinical evaluation: o tumour pathobiology, o staging, o site and extent of the disease, o condition of the patient and o all clinical imaging and test information; Therapeutic decisions: o cure/palliation, o treatment modalities; Treatment simulation and imaging for treatment planning: o X-rays, o 3D imaging (CT scans, MRI) and o functional imaging (SPECT, PET); Anatomical volume localisation and 3D contouring based on digital imaging information for: Page 25 of 169
26 o the patient s anatomical volume, o the tumour volume (target site) and o critical structures of normal tissue; Treatment planning to: o determine the optimum treatment configuration (beam modality, energy, direction, size, shape, intensity and dose), o compute the dose distribution and o compute the number of monitor units required for each field; Fabrication of treatment aids such as: o compensators, o bolus, o shielding blocks; Treatment: o the prescription is typically for daily treatments delivered over several weeks; Verification of treatment set up by imaging during the prescribed course of treatment; Patient clinical evaluation during and follow up after treatment (Van Dyk 1999). Immobilisation devices may be used to place the patient in a specific position which allows optimal beam access, assist in providing a reproducible set up and/or limit patient motion (Podgorsak 2003, Van Dyk 2003, Khan 2007). Modern immobilisation devices include: Head and neck or body casts made of: o polyurethane foam such as the Alpha Cradle, o vacuum bags filled with tiny polystyrene balls, o thermoplastic moulds: solid or mesh sheets which can be heated and shaped around the patient which then become rigid when Page 26 of 169
27 cooled (these moulds are attached to the treatment couch or a plastic board placed under the patient). Hand grips or overhead arm positioners: typically used during breast thorax or abdomen treatments to maintain the arms either above the head or beside the body in a well defined position. Tilted boards, often with built in hand grips or arm supports: typically used for lung or breast treatments. Prone breast boards: where the breast to be treated hangs through a cut out section of the board. Belly boards: consisting of a foam cast or foam sections on a frame with a hole for the patient s belly. They are designed for obese patients or to reduce the amount of small bowel being irradiated in pelvic treatments. Bite blocks: a type of immobilisation device used for head and neck treatments. A dental impression is attached rigidly to a base plate. Stereo-tactic frames: used for treatments which require high precision, where standard immobilisation techniques are inadequate. The frame is attached to the patients head during the entire treatment procedure. It can be attached invasively e.g. using screws into the patients skull, or noninvasively e.g. using a dental mould as a mouth grip (Podgorsak 2003, Khan 2007). During the treatment simulation stage, images of the patient in the treatment position, with these devices in place, are taken. Most patients require CT scans to obtain a full 3D description of the patient s anatomy and electron density data for calculation purposes by the TPS. The TPS may assume that everything present in the CT image will be present during the treatment. Any objects in the CT image, such as the CT couch or surface markers that are normally not present during the treatment, will interfere with the dose calculation. These objects need to be identified so that the TPS will ignore them during the dose calculation. Alternatively, some TPSs, such as Eclipse, require a structure to be defined to indicate what should be included in the dose calculation. Page 27 of 169
28 During the treatment planning stage, the beam modality (photon or electron) and energy are chosen. For photon beams, the energy is given in units of megavolts (MV). The photon beam produced is not mono-energetic. For example, a beam designated as 6 MV, is a beam with a heterogeneous photon beam spectrum which has been produced by 6 MeV electrons striking a target within the LINAC. It consists of a spectrum with photon energies ranging from zero to 6 MeV (Van Dyk 1999). The result of the dose calculation is given as a dose distribution which can be overlayed and viewed on the CT images. The TPS calculation output also provides details of the total dose to the prescription point and the number of monitor units required for each treatment field to deliver the dose distribution for the particular set up. Monitor units are the units in which the dose is measured by an ionisation chamber within the LINAC before passing through any beam shaping or modifying devices such as the beam defining collimators. At Royal North Shore Hospital (RNSH), the ionisation chamber within the LINAC is calibrated such that one monitor unit equals one centigray at the depth of dose maximum in a water phantom for a 10 x 10 cm 2 field size, 100 cm source to surface distance (SSD). Fields may be required to pass through an immobilisation device during the patient s treatment and may also pass through large air gaps created by the immobilisation device. The TPS dose calculation algorithm needs to accurately account for the attenuation due to the device and any changes in the dose distribution in order to calculate the dose to within clinical tolerances. Page 28 of 169
29 2.2 Tolerances for the Accuracy of Dose Calculations The accuracy that is achievable throughout the process of radiation therapy depends on the uncertainty in the following areas: Absorbed dose measurement to a reference point in a water phantom, Measurement of relative dose at points other than the reference point, Relative dose calculations (conducted by the TPS during the treatment planning stage), Patient treatment (e.g. due to patient set up reproducibility, patient movement during treatment, organ motion, the LINACs beam monitor stability and beam flatness) (Van Dyk 1999, AAPM Report no , Khan 2007). The ICRU recommends that the absorbed dose to the target volume should be delivered to an accuracy of 5% or better (ICRU Report ). This means that the accuracy for each of the plan and treat steps must be better than 2.5% (Van Dyk 1999). Immobilisation devices assist in maintaining this accuracy throughout the whole planning and treatment process (Van Dyk 1999). Tolerances for the accuracy of dose calculations by a TPS have been published by a variety of authors (Van Dyk et al 1993, Fraas et al 1998, Venselaar et al 2001). All of the points investigated in this study were in high dose, small dose gradient regions. For the simple cases, central axis points were investigated and for the complex cases, off axis points were investigated. Based on the tolerances published by Venselaar et al (2001), tolerances of 2% for the homogenous simple cases, 3% for simple cases with inhomogeneities and 4% for the complex cases are recommended. The documentation for the Eclipse TPS states that the PBC algorithm calculates the dose distribution with the following accuracy: Page 29 of 169
30 Photon fields in typical clinical set up: 2-3% Photon beam reconstruction model: ±1% (rectangular fields), ±2% (irregular fields) Oblique correction within 1-2% (Varian Medical Systems 2003b). Based on the recommendations above and the expected accuracy of the Eclipse PBC algorithm, the lower tolerances of 2% for the simple homogeneous cases and 2.5% for complex cases with inhomogeneities were used throughout this project. 2.3 The Eclipse Treatment Planning System Eclipse is a radiation therapy treatment planning system available through Varian Medical Systems. During this project Version 6.5 of the Eclipse External Beam Planning software was used. Vision is a Varian image and plan management application used in conjunction with Eclipse at RNSH. The information provided in this section is primarily from the documentation provided with the Eclipse and Vision applications. Page 30 of 169
31 2.3.1 The Body Structure The Eclipse TPS requires that a body structure be defined for dose and MU calculation. The body structure represents a 3D volume describing the site of the patient s body in the images. It is composed of stacks of contours in parallel slices of the 2D image view (Varian Medical Systems 2003a). Throughout this thesis, the green shading in the CT images represents the body structure which has been contoured. Figure 2.1 illustrates an example of a body structure which excludes external objects. Figure 2.1 CT scan of anthropomorphic phantom with mask and head extension board with a body structure (green shading) including only the phantom. The body structure identifies for Eclipse the image information which should be included in the dose and MU calculations. The dose algorithm for external photon beams uses the body structure to determine the source to surface distance, depth to the reference point and the effective depth. For these calculations, the algorithm only considers areas that are inside the body structure or within bolus which has been added to the surface of the body structure using software tools in the TPS. The dose distribution is only calculated for areas within the body structure and bolus (Varian Medical Systems 2003c). Page 31 of 169
 (b) Figure 2.")
32 All scanned objects located outside the body structure, such as an immobilisation device or the CT scanner couch do not influence the Eclipse photon dose calculations. Figure 2.2 shows the lack of effect when part of an object is not included in the body structure, compared to when the external object is included in the body structure. (a) (b) Figure 2.2 Effect of part of an object not being included in the body structure. The upper part of the object is not included in the body structure on the left image (a) but is included in right image (b) Incorporating Objects Outside the Body Structure The Vision Calculation Algorithms manual (Varian Medical Systems 2003b) provides instructions for taking into account some objects which are in the beam path which are not included in the body structure. These include wedges, compensators, multi-leaf collimators (MLCs), blocks and block trays. Adjustments are made to the dose calculation for example, by altering the relative dose distribution (e.g. using a dose profile measured beyond a wedge) and/or by altering the MUs to be delivered according to a central axis transmission factor to correct for attenuation of the beam. Page 32 of 169


33 The transmission factor is calculated by dividing the measured dose with the device in the beam path, by the dose measured without the device in the beam path for a standard set up (e.g. 10 x 10 cm 2 field size, 100 cm SSD). An example of a device where a transmission factor can be used is a block tray. Block trays are used to attach beam attenuating blocks to the LINAC to shape the beam. A block tray, with and without a block is shown in Figure 2.3. (a) (b) Figure 2.3 Block tray, with (a) and without (b) a block in place. The transmission factor is only valid for the conditions under which the factor was measured e.g. energy, field size and object location relative to the radiation source (such as distance from source and angle of beam incident on the object). The factor is only measured at one depth and radial line from the target source and is then applied to the entire dose distribution by altering the MUs required for the field. If any changes occur in the physical conditions governing the dose distribution (such as what may occur at the surface of the patient in the build up region) the transmission factor and dose algorithm will not take this into account. Page 33 of 169

 and without (b) the transmission factor applied is shown.")
34 As transmission factors change the MUs but do not change the dose distribution, they cannot be used to account for sections of non-uniform thickness devices. Figure 2.4 illustrates the effect a transmission factor has on a plan. It can be seen that the dose distribution remains the same after applying the transmission factor and that only the MUs have changed. (a) (b) Figure 2.4 An illustration of the effect of applying a transmission factor on the dose distribution and MUs. The dose distribution with (a) and without (b) the transmission factor applied is shown. Apart from when bolus is added during the treatment planning stage, no instructions are provided in the Eclipse manuals regarding corrections to account for beam transmission through any form of object that may be in contact with the patient. The effect on the dose delivered due to the treatment couch or an immobilisation device which is in contact with the patient is of specific concern in this work. If the beam transmission through the device can be approximated as uniform, a transmission factor may be applied in a similar way as when a block tray transmission factor is applied. Page 34 of 169

35 Figure 2.5 shows an example of a mask and head extension board used to immobilise the patient s head during treatment. A transmission factor can be used to account for the effects of the carbon fibre grid section of the board which is between the radiation source and patient. Figure 2.5 An example of a treatment through a head extension board where a transmission factor could be applied. There are occasions when the treatment beam is required to pass through an immobilisation device of non-uniform thickness or density. In this case a blanket transmission factor which is applied for all points within the field cannot be used. Figure 2.6 shows a picture of a post axilla field passing through a non-uniform section of a breast board. It can be seen that the thickness of the board varies across the treatment beam area. Page 35 of 169


36 (a) (b) Figure 2.6 A 3D reconstructed image (a) and beams eye view (b) of a patient on a breast board where the beam passes through varying thickness of a breast board. Eclipse is not able to account for two-dimensional attenuation of non-uniform objects, such as the breast board, in the dose calculation using a transmission factor. When a field is passing through a non-uniform device, one possible solution is to include the immobilisation device in the body structure used for the TPS dose calculation. An example of a body structure which has been extended to include an immobilisation device is shown in Figure 2.7. Figure 2.7 A example of a body structure which has been extended to incorporate a head extension board, head rest and face mask. Page 36 of 169
37 2.3.3 The Eclipse Dose Calculation Algorithm Pencil Beam Convolution Algorithm The version of Eclipse used for this project utilises a PBC algorithm for the photon dose calculation. The ETAR inhomogeneity correction method is used for the dose calculations in this study. This section contains a brief description of the algorithm and ETAR inhomogeneity correction method focusing on the deficiencies which may result in inaccurate dose calculations for the situations investigated in this study. A detailed description of the dose calculation algorithm and ETAR method of inhomogeneity correction is provided in Appendix 7.2. Many different dose calculation algorithms are used in modern TPSs. Historically; two approaches to photon dose calculations have been taken, with the calculations either correction or model based. Correction based methods calculate a dose distribution in water and then apply an inhomogeneity correction factor to account for any change in tissue and electron density. Model based methods rely on the fundamental physics of scattering. The most advanced technique is the Monte Carlo method where the statistical interaction histories of millions of photons as they interact with matter are traced (Van Dyk 1999, IAEA TRS no ). The Eclipse PBC algorithm is a correction based method and computes the calculation in two phases. In the first phase, the dose is calculated in a homogenous water equivalent medium with treatment beam accessories such as MLCs and wedges taken into account. As calculating the dose to the entire volume would be time consuming, the convolution is used to calculate the dose in five planes perpendicular to the beam and the dose for the other points in the volume is interpolated. The second phase applies the patient model (based on the body structure contoured) to account for the actual skin curvature and inhomogeneities (Varian Medical Systems 2003a). Page 37 of 169
38 In the Eclipse PBC algorithm, the convolution given in Equation 2.1 sums a number of pencil beams, each weighted with field intensity to obtain the total dose contribution. D( x, y, z; F) F( x', y' ) Pint ( x' y' z) K( x x', y y', z) dx' dy' Equation 2.1 = Where D(x,y,z;F) is the dose at a point (x,y,z) for a field F, F(x,y ) is the field intensity function, P int (x,y,z) is the intensity profile (normalised fluence of primary photons at depth z) and K(x-x,y-y,z) is the pencil beam kernel for the combination of scattering element (x,y,z) and dose point (x,y,z) (Van Dyk 1999, Varian Medical Systems 2003b). The kernels are assumed to be invariant throughout the irradiated volume, not accounting for changes due to heterogeneous tissue, local changes in primary fluence or changes in the spread of energy due to local scattering. This assumption results in faster calculations at the expense of accuracy (Van Dyk 1999). The dose is then translated to account for any difference in the distance of the field central axis to the surface of the water equivalent material geometry compared to the patient geometry. The patient model is then applied and the absorbed dose calculated using Equation 2.2. D ( x, y, z; F) = D ( z; F) P( x, y, z; F) C C Equation 2.2 a o inh Where D a (z;f) is the depth dose of the irregular field along the effective field axis, P(x,y,z;F) is the off axis ratio, computed by interpolation along the fan lines, C o is Page 38 of 169
39 the correction factor for skin obliquity and C inh is the correction factor for tissue inhomogeneities (Varian Medical Systems 2003b) The Equivalent Tissue Air Ratio Inhomogeneity Correction Method The inhomogeneity correction used throughout this study was the ETAR method, which was first introduced by Sontag and Cunningham in the late 1970s (Sontag and Cunningham 1977, Sontag and Cunningham 1978). As conducting the calculations over the entire irradiated volume resulted in large computer memory requirements and calculation times, an approximation procedure was developed which reduced the summation to be over a single effective slice that produces the same scattering as all the slices taken together. Details of the calculation procedures and assumptions are given in Appendix 7.2. As the ETAR method relies on tissue air ratio (TAR) measurements which are conducted under conditions approximating electronic equilibrium (where the energy carried in and out of the volume by electrons is equal), electron interactions which occur away from the photon interaction site are ignored. It therefore cannot predict situations of electronic disequilibrium such as in the build up region and at points closer to the field edge than the range of secondary electrons (Metcalfe et al 1993). The assumption of electronic equilibrium is appropriate for lower photon energies, such as from cobalt 60 (approximately 1.25 MV). However at the higher photon energies now more commonly used for radiation therapy such as 6 MV, where the electron range can be up to several centimetres, it can lead to significant errors in dose calculation. This is especially noticeable in low density regions where the electron range is increased and large overestimates in dose can arise (Metcalfe et al 1993). Page 39 of 169
40 Electronic equilibrium can only truly occur when there is no attenuation of the primary beam. It can effectively occur when the percentage attenuation occurring over the distance equal to the range of electrons is small (Johns and Cunningham 1983). For simplicity, in the discussions throughout this thesis, electronic equilibrium is assumed to occur for points in the central axis of a 6 MV beam incident on a water equivalent material with a field size of at least 5 x 5 cm 2 in areas beyond the build up region and at least 5 cm from the distal surface of the water equivalent material. The situations investigated in this study involved beams passing through air gaps and low density regions within the immobilisation devices and patient, so errors within and surrounding the air gaps and low density media were expected. The types of errors expected are described in more detail in Section 2.6 where the published studies on dose calculations within and surrounding air cavities and low density inhomogeneities are reviewed. 2.4 Dosimetric Effects of Objects Outside the Patient Objects placed in the beam path between the LINAC radiation source and patient s surface may significantly alter the dose distribution produced. These can be items placed on the LINAC to intentionally modify the beam such as blocks supported by plastic trays, wedges or compensators, or they can be items used for patient set up such as the treatment couch or immobilisation devices, where modification of the dose distribution is not intended. When there are no objects placed in the beam path, the maximum dose received by high energy x-rays, such as 6 MV photons, is not at the surface. This effect is called skin sparing and is due to the electrons which are set in motion having a range of several millimetres. This effect is desirable for radiation treatments Page 40 of 169
41 where radiation dose to the skin is not required or where the skin is a dose limiting structure. Although lower than the maximum, the surface dose is not negligible; most of the surface dose is caused by electrons produced by beam modifying devices within or attached to the LINAC, such as collimators, blocks and block trays. These electrons have a long range in air and the electrons with the lowest energy cause dose to be deposited at the skin surface. Some surface dose is also caused by electrons produced in the air between the LINAC and the patient, electrons backscattered from photon interactions in the patient and from the exit dose from opposing beams (Metcalfe et al 1997). Devices placed against the patient s skin can also increase the skin dose; the majority of studies investigating the dosimetric effects of immobilisation devices have investigated this effect, with only a few investigating transmission effects. Typically only beams incident perpendicular to the surface were investigated. The only study found that investigated incorporating the immobilisation device into the dose calculation was Munjal et al (2006). The following sections review the published literature on the dosimetric effects of objects outside the patient. Methods for accounting for the effects of complex objects outside the patient are also introduced. Page 41 of 169
42 2.4.1 Immobilisation Devices Thermoplastics Most of the studies on immobilisation devices have investigated the effect of thermoplastics, which are used to create face masks or body moulds, on skin dose (Fiorino et al 1992, Fiorino et al 1994, Fontenla et al 1994, Mellenberg 1995, Meara and Langmack 1998, Carl et al 2000, Sharp et al 2005). It has been found that the surface dose increases with increasing thermoplastic thickness and decreasing perforation size (Fiorino et al 1992, Fiorino et al 1994, Fontenla et al 1994, Carl et al 2000); increasing from 15% of the dose maximum to 57% for a 2.0 mm thick solid thermoplastic, 50% for a 2.0 mm thick perforated thermoplastic and 28% when the perforated thermoplastic was stretched to a thickness of 1.3 mm (6 MV, 10 x 10 cm 2 field size, 100 cm SSD) (Carl et al 2000). For measurements conducted using unstretched thermoplastics, it has been noted that while the thickness is typically less for patient set ups, the skin dose value obtained through unmoulded thermoplastic could be considered the maximum skin dose value when the skin is a dose limiting structure (Fiorino et al 1994). The surface dose behind thermoplastics increases with increasing field size; from 52.3% of the dose maximum (5 x 5 cm 2 ) to 59% (15 x 15 cm 2 ) for a 2.0 mm thick perforated thermoplastic (6 MV, 100 cm SSD) (Fiorino et al 1992). The surface dose has also been found to decrease with increasing photon energy over the range from 4 MV to 15 MV (Mellenberg 1995, Meara and Langmack 1998, Carl et al 2000). No significant trend has been found for skin dose behind thermoplastics with changes in SSD (Fiorino et al 1992). Page 42 of 169
43 Transmission measurements have been conducted through a 2 mm thick thermoplastic by Meara and Langmack (1998) with transmissions of 98.6 to 98.8% for 5-8 MV photons. Fiorino et al (1992) investigated combinations of thermoplastic materials with the use of wedges and block trays, finding that the addition of a tray increased the surface dose behind the thermoplastic from 60.1% to 64.3% of the dose maximum (6 MV, 15 x 15 cm 2 field size, 85 cm SSD). The addition of a 30 o wedge decreased the surface dose measured. Considering the multiple variables affecting the skin dose behind thermoplastics, no simple method of applying factors to accurately determine skin dose in a clinical setting could be created. If a TPS could accurately model the dose in the region immediately behind the thermoplastic, skin dose could then be assessed during the planning stage and modifications to the plan or set up be taken prior to starting treatment. Alternatively, to avoid the increase in skin dose, the section of a thermoplastic mould where the beam passes through may be cut out if the immobilisation capability of the mask is not compromised (Fiorino et al 1992, Podgorsak 2003, Khan 2007). Page 43 of 169
44 PMMA Boards PMMA boards, which are often used in conjunction with thermoplastic moulds as a fixation point, have also been investigated (de Mooy 1991, De Ost et al 1997, Meara and Langmack 1998, Munjal et al 2006). For 6 MV beams, the skin dose has been found to increase from 14.8% for an open field to 97.7% when a 1 cm PMMA board is present (Meara and Langmack 1998). For a 12.5 mm PMMA board the depth of dose maximum has been found to shift by 12 mm towards the surface and 96% transmission was measured (De Ost et al 1997). The variation of transmission factor for a 12 mm PMMA board with incident beam angle has also been investigated, with and without an air gap between the PMMA board and the phantom (Munjal et al 2006). When the PMMA board was in contact with the phantom, the transmission through the board was found to vary between 95.2% (0 o beam incidence) and 89.5% (60 o beam incidence) (6 MV, 10 x 10 cm 2 field size). When an ~8 cm air gap was present between the PMMA board and phantom (positioned using foam blocks and a thermoplastic cast), simulating head and neck geometry, the transmission was found to vary between 94.2% (0 o beam incidence) and 92.6% (50 o beam incidence). As most TPSs do not have the ability to account for transmission factors for obliquely incident beams, Munjal et al (2006) also investigated the ability of the PLATO-SUNRISE TPS to model a PMMA board supported approximately 8 cm above the phantom. When the PMMA board was included in the contour drawn, i.e. included in the dose calculation, the TPS calculated the dose to within 1.5% of measured values at the centre of the phantom. When the PMMA board was not included in the calculation, the measured dose was up to 8.1% lower than the calculated dose (6 MV, 10 x 10 cm 2 field size). Page 44 of 169
45 Polystyrene and Polyurethane Foam and Vacuum Bags The effects of polystyrene and polyurethane foam and polystyrene bead vacuum bags have been investigated by Johnson et al 1995, Mellenberg et al 1995, Meara and Langmack 1998 and Carl et al All studies found that the skin dose increased with increasing thickness of the foam or vacuum bag. For example, Carl et al (2000) found that the surface dose behind 1 cm and 4 cm thick sections of a polystyrene bead vacuum cradle for a 6 MV photon beam was 41% and 56% of the dose maximum respectively, compared to 15% for an open beam (10 x 10 cm 2 field size, 100 cm SSD). Mellenberg (1995) found that the increase in skin dose was proportional to the thickness and density of the material in contact with the skin Other Immobilisation Devices Other studies have concentrated on specific immobilisation devices, such as Olch and Lavey (2002) who investigated attenuation through a modified VBH HeadFix Arc system, measuring attenuation of 2-4% through most components, but up to 15% through some solid carbon fibre sections. Vieira et al (2003) investigated transmission through the Sinmed Posifix-4 head support on a carbon fibre grid couch and the Posirest-2 lung board on a composite carbon fibre/foam couch using an electronic portal imaging device. The transmission through most sections of the devices were 95-97%, but transmission of 90% was measured behind the plastic pins used to fix the mask on the head support and arm rests on the lung board (6 MV, patient treatment fields). The worst case measured was for a posterior oblique field through a section of the couch frame and the head support where a transmission of 85% was measured. The arm rests on the Sinmed Posirest-2 lung board are similar to those on the Sinmed Posiboard -2 used throughout this project (illustrated in Figure 3.6 (page 68)). Page 45 of 169
46 For some patients treated at RNSH, a post axilla field would pass through the pins used to attach the arm rests Block Trays Large air gaps are sometimes created by immobilisation devices which support the patient above the treatment couch. This problem is common when using tilted breast boards, head rests or knee supports. For example, when a posterior field passes through the breast board used in this study, the beam may first pass through the treatment couch and/or the base of the breast board, a large air gap and then the tilted back support region of the board before entering the patient. Examples of patient treatments where air gaps are created by immobilisation devices, including the breast board, are illustrated in Figure 4.1 (page 96). No studies were found in the literature that investigated the effect of posterior fields passing through a tilted board or that investigated the accuracy of a TPS to calculate the dose behind large air gaps (greater than 5 cm) such as those created by immobilisation devices. Recent publications on the dosimetric effects of block trays, which are attached to the LINAC head to support field shaping blocks, have been summarised in this section as those investigations are the closest to mimicking the large air gap created by the tilted board which was investigated in this study Surface Dose A number of studies have investigated the increase in surface dose when block trays are used (Rao et al 1973, Mackie and Scrimger 1982, Purdy 1986, Fiorino et al 1992, Fiorino et al 1994, Sharma and Johnson 1994, Mellenberg 1995, Butson et al 1996, Kim et al 1998, Jursinic 1999, van Kleffens et al 2000). Generally the surface dose has been found to increase with increasing field size Page 46 of 169
47 (Rao et al 1973, Purdy 1986, Fiorino et al 1992, Fontenla et al 1994, Mellenberg 1995, Butson et al 1996, Kim et al 1998) and decreasing SSD (Rao et al 1973, Purdy 1986, Fontenla et al 1994, Kim et al 1998). The results from Rao et al (1973), which can be seen in Table 2.1, illustrate these trends. Tray Present SSD (cm) Field Size (cm 2 ) Surface dose (% of dose maximum) No x 10 20% Yes x 10 24% Yes x 20 54% Yes x 10 32% Table 2.1 Surface dose for a 6 MV photon beam when using a block tray (Rao et al 1973). The dose maximum has been found to shift towards the surface when block trays are used, from 11 mm without the tray to 9mm with the tray present (6 MV, 15 x 15 cm 2 field size) (Rao et al 1973). Kim et al (1998) found that the skin dose off axis was similar to that on the central axis, slightly decreasing towards the edge of the field. While electrons produced in the LINAC collimator were absorbed by the tray, additional electrons were produced by the tray. The changes in the build up region have been attributed to electron contamination produced above the block tray being attenuated, extra electron contamination being produced by the tray and the photon spectrum being changed slightly after interaction with the block tray material (Rao et al 1973, Butson et al 1996). The use of a metal filter on the patient side of the tray reduces the increase in surface dose resulting from the presence of the tray (Mackie and Scrimger 1982, Purdy 1986). Page 47 of 169
48 Transmission Various studies have investigated the factors that influence transmission factors for block trays (Sharma and Johnson 1994, Jursinic 1999, van Kleffens et al 2000). The studies found that the transmission through the tray increased with decreasing tray thickness (van Kleffens et al 2000), increasing beam energy (Jursinic et al 1999) and increasing field size (Jursinic 1999, van Kleffens et al 2000). Van Kleffens et al (2000) found that there was no SSD dependence for SSDs equal to or larger than 80 cm, but found that the transmission varied with distance of the tray from the radiation source. Sharma and Johnson (1994) found no dependence on the depth of measurement for tray factors, for depths between the depth of dose maximum and 15 cm. Many of these studies also investigated the effects of wedges (Fiorino et al 1992, Sharma and Johnson 1994, Mellenberg 1995, Kim et al 1998) or lead and gypsum compensators (Mellenberg 1995) Treatment Couches The use of carbon fibre couch inserts is now a well established method of reducing patient set up errors associated with couch sag (McCormack et al 2005). They also have the additional benefit of minimal attenuation and distortion of the surface dose compared to previously used materials such as PMMA or wood (De Ost et al 1997). As it is sometimes unavoidable that a treatment beam passes through the couch, investigations into the dosimetric effects of a variety of treatment couch materials have also been conducted. The carbon fibre materials used to produce modern treatment couches are similar to those used to produce some rigid immobilisation Page 48 of 169
49 devices, such as the head extension, breast board and belly board used in this study. The results from the treatment couch studies can therefore be applied to immobilisation devices Carbon Fibre Composites The main treatment couch material investigated is a carbon fibre/low density material composite, where two thin layers of carbon fibre are on either side of a low density core, such as foam (de Mooy 1991, De Ost et al 1997, Meara and Langmack 1998, Carl et al 2000, Higgins et al 2001, Gillis et al 2005, McCormack et al 2005, Poppe et al 2007). For a perpendicularly incident beam, most studies have reported transmission through a carbon fibre/low density material composite to be between 99 and 100% (de Mooy 1991, De Ost et al 1997, Meara and Langmack 1998). However, the perpendicular transmission has been measured to be as low as 98.5%. For an obliquely incident beam this reduced further to 97.7% and reduced again to 96% when a carbon fibre couch frame was in the beam path (Gillis et al 2005). McCormack et al (2005) measured slightly lower transmissions using a cylindrical phantom, attributing the differences to the reduced scatter component reaching the detector due to the air gap created between the couch and the phantom. Beyond carbon fibre composite materials, the depth of dose maximum has been found to shift by 3-5 mm towards the surface for a 6 MV beam (De Ost et al 1997, Gillis et al 2005). The skin dose from a 6 MV beam has been found to increase from 15% of the dose maximum for an open beam, to 43-51% beyond 1.1 cm thick samples of carbon fibre composite materials and 66% for a 4.1 cm sample (Carl et al 2000). The surface dose has also been found to increase with field size, from 68% for a 10 x 10 cm 2 field to 82% for a 40 x 40 cm 2 field for an 8 MV beam (Higgins et al 2001). Page 49 of 169
50 Solid Carbon Fibre Carl et al (2000) has investigated the skin dose behind 0.5 mm and 0.9 mm thick samples of solid carbon fibre. The skin dose measured for a 6 MV beam was 25% and 31% of the dose maximum respectively compared to 15% for an open field. Munjal et al (2006) measured transmission behind an 8 mm thick sample of solid carbon fibre obtaining 96.3% for perpendicular incidence and as low as 92.0% for oblique incidence using a 6 MV beam Mylar & Carbon Fibre Grid or Tennis String Transmission and skin dose behind Mylar covered carbon fibre grid and tennis string couch tops have also been investigated (Butson et al 2002, Gillis et al 2005, Munjal et al 2006). A carbon fibre grid couch insert with Mylar covering is illustrated in Figure 2.8. A tennis string couch insert with Nylon mesh and a Mylar covering is illustrated in Figure 2.9. Page 50 of 169
.")

51 Figure 2.8 Carbon fibre grid couch insert. ( Figure 2.9 Tennis String couch insert. ( Munjal et al (2006) measured transmission through a carbon fibre grid couch obtaining 98.8% for perpendicular incidence and as low as 97.0% for oblique incidence using a 6 MV beam. The grid used in treatment couches is similar to the carbon fibre grid in the central region of the head extension board used in this study. Page 51 of 169
52 Butson et al (2002) measured peak and average skin dose behind carbon fibre grid and tennis string couches using radiochromic film. For the carbon fibre grid couch, the peak dose behind the couch was 67% and the average dose was 48% compared to 16% for an open field (6 MV, 10 x 10 cm 2 field size). For the tennis string couch, the peak and average doses were 43% and 35% respectively. These doses were found to increase with increasing field size. Gillis et al (2005) measured transmission through a tennis string couch insert to be 99.7% for a 6 MV beam. A tennis string style couch insert was used throughout the investigation into the dose beyond immobilisation devices described in Chapter Accounting for the Dosimetric Effects of Objects Outside the Patient If a beam passes through an immobilisation device or treatment couch which is not accounted for in the TPS, undesired and unpredictable alteration of the beam penetration characteristics may result. This can potentially lead to an increase in skin dose or an under-dosage due to unaccounted attenuation (Gillis et al 2005, Meyer et al 2001). To deal with this problem it is necessary to restrict beam angles, model the couch and/or immobilisation device in the TPS or construct the couch and immobilisation devices from a material which has no clinically relevant effects on beam attenuation. For the first two approaches, the position of the patient relative to the couch and immobilisation device needs to be fixed for each treatment fraction. Page 52 of 169
53 The following sections review the published literature regarding restricting treatment beam angles, modelling objects outside the patient in the TPS and the set up reproducibility achievable with a variety of immobilisation methods Avoiding Beam/Couch Intersection One approach to dealing with the attenuation through a treatment couch is to restrict the gantry angles which can be used. There are only a few TPSs which have the capability to check for a possible collision between the treatment beam and the couch, therefore the restrictions may have to be implemented manually in the treatment planning process. Meyer et al (2001) investigated accommodating couch constraints in IMRT treatments. The investigations were based on three common treatment couch types: the Elekta standard therapy table top (which has a central spine support at one end and two lateral supports at the other), a Varian Exact treatment couch (which has two carbon fibre support rails which can move laterally), and an Elekta C- arm therapy top (which has two rotatable C-arms supports). Seventy coplanar plans with five to nine equally spaced beams were used to evaluate each couch for beam - couch support collision. Initial beam paths intersected with the Elekta standard therapy table supports in 63% of plans and with the Varian Exact treatment couch supports in 34% of plans, resulting in adjustments to the plans being required. All the plans were able to be delivered using the C-arm couch. Gillis et al (2005) also mapped possible gantry table combinations for an Elekta C-arm couch and Sinmed Mastercouch (made of a carbon fibre/low density composite material) noting collision with the patient, collision with the table and beam intersection through various areas of the couch. Page 53 of 169
 investigated incorporating a PMMA board in the dose calculation by a TPS (Section 2.4.1.2, page 44).")
54 Including the physical properties of the treatment couch in the TPS dose calculation would eliminate the problem of unknown attenuation and reduce the need to restrict beam angles Including Objects Outside the Patient in the Dose Calculation Munjal et al (2006) investigated incorporating a PMMA board in the dose calculation by a TPS (Section , page 44). To allow the TPS to do this, the device must be included in the images taken during treatment simulation. If you also want the TPS to model the treatment couch, then the couch on the CT scanner must be made of the same material as the treatment couch (Munjal et al 2006). Alternatively, an overlay for the CT couch made of the same material as the treatment couch can be used. An example of a couch overlay is illustrated in Figure Figure 2.10 Head extension couch overlay ( Another limitation is the bore size of the CT scanner, typically 70 cm, compared with the relatively unobstructed treatment set ups that can be achieved on a LINAC. The maximum field of view achievable by the CT scanner may not be large enough to include the couch top, immobilisation device and the patient s entire external contour. This is particularly a problem for breast treatments on a Page 54 of 169
55 tilted board, where the patient is elevated above the couch and their arms are raised above their head. Large bore scanners do exist but budget constraints for many departments limit their availability (Hendee et al 2005) Reproducibility of Patient Position If the treatment plan requires that the couch supports be in a specific position during treatment and/or that the gantry angles be restricted to avoid interference with the couch supports, the patient must be in the same position relative to the couch during each treatment. This may involve the use of additional fixation devices, such as lock bars, to attach the immobilisation device to the treatment couch in a specific position. The position of the immobilisation device relative to the patient will also need to be fixed during each treatment particularly if the beam is passing through an immobilisation device. To achieve the required patient positioning reproducibility relative to the couch and immobilisation device, additional information regarding the position of the immobilisation device may need to be recorded during the treatment simulation phase. The set up reproducibility should be known prior to conducting patient treatments through an immobilisation device. In 1995, Verhey published a review of the literature summarising the capabilities of several popular immobilisation systems. He estimated the uncertainties to be as shown in Table 2.2. Page 55 of 169
56 Site Technique Treatment to Treatment Simulation to Treatment Alignment Pelvis, Abdomen Alpha Cradle or thermoplastic casts 3-4 mm Laser Not immobilised 6-8 mm 6 mm Laser Breast Alpha Cradle or vacuum bag 3 mm Light Field Thorax Not immobilised 4 mm 6 mm Laser Head, Neck Face mask with neck mm Laser Mechanical 3 mm 2.5 mm Bite block 4 mm 6 mm Laser Intracranial Not immobilised 3 mm Laser Face mask with neck Cranial fixation (stereotactic) Non invasive (stereotactic) mm Laser <1 mm Mechanical mm Mechanical Table 2.2 Immobilisation capabilities for various treatment sites (Verhey 1995). Further studies have been conducted with other immobilisation devices since the review by Verhey (1995). Lirette et al (1995) investigated the treatment set up reproducibility for tangential breast treatments conducted using a flat board with arm support. They found that the treatment to treatment set up reproducibility was approximately 3 mm and the simulation to treatment set up reproducibility was less than 4 mm. Occasionally large deviations of up to 23 mm were found, confirming the need for daily verification procedures. Page 56 of 169
57 Generally patient positioning devices assist with the reproducibility, however the use of a belly board to spare the small bowel in rectal cancer patients has been found to decrease the set up reproducibility when compared to un-immobilised prone patients. The largest displacement found being in the anterior-posterior direction where the mean displacement went from 1.8 mm to 4.5 mm when the immobilisation device was introduced (Allal et al 2002). Verhey (1995) noted that the results summarised were obtained by examining the position of anatomical points on films taken before or during treatment and comparing them to equivalent points on simulator films or digitally reconstructed radiographs. Verhey (1995) also commented that although this reflects the ability of the system to reposition skeletal anatomy the results may not translate to the ability of the system to reposition the target volume. The results of the studies may also not represent the reproducibility of the position of the immobilisation device relative to the patient. This must be known if the immobilisation device is being incorporated into the dose calculation, particularly where a beam is passing through a region of the device where the attenuation is significant. No studies have been found in a literature search describing the set up reproducibility of the immobilisation device relative to the patient. 2.6 Investigations into Effects of Air Cavities and Low Density Inhomogeneities on Dose Calculations Immobilisation devices are often made out of low density materials, with the aim of making them as radiotranslucent as possible. Some immobilisation devices may also result in air gaps being created between where the beam first intersects with the treatment couch or immobilisation device and when the beam enters the patient. Large air gaps may be created when using a tilted board with posterior Page 57 of 169
58 fields. Smaller air gaps may also be created when using head and neck immobilisation devices. Examples of air gaps which are created when using immobilisation devices can be found in Figure 4.1 (page 96). Typically the effects of air gaps and low density inhomogeneities have been investigated with respect to air cavities and low density material within the patient, such as the sinuses, nasal cavities, larynx and lungs. The studies generally compared measured results or Monte Carlo calculations to dose calculations by a variety of algorithms and inhomogeneity correction methods Air Cavities Air cavities within a patient are small compared to the air gaps that can occur when immobilisation devices are used. The size of air gaps investigated in the studies to date reflect this focus: small rectangular (Young and Kornelsen 1983, Beach et al 1987, Wong et al 1992, Wong et al 1996, Kan et al 1998, Ding et al 2004), triangular (Wong et al 1996) and cylindrical (Li et al 2000) cavities or channels. Slab air gaps of up to 5 cm thick have also been investigated (Wong et al 1992, Shahine et al 1999, Li et al 2000, Ding et al 2004). A secondary build up region behind air cavities was observed in all interface region studies which was not accounted for by the ETAR correction method (Wong et al 1992, Wong et al 1996, Shahine et al 1999). The dose reduction beyond the air cavity was found to increase as the air cavity size increased (Young and Kornelsen 1983, Wong et al 1992, Li et al 2000), as the field size decreased and as the x-ray energy increased (Wong et al 1992, Li et al 2000). The results from Wong et al (1992), shown in Table 2.3 and Table 2.4, display these trends. Page 58 of 169
59 Air Cavity Thickness (cm) Secondary Build Up Range (mm) 6 MV 18 MV 5 x 5 cm 2 10 x 10 cm 2 5 x 5 cm 2 10 x 10 cm Table 2.3 Secondary build up range (depth where electronic equilibrium is reestablished) measured using a Markus chamber for 100 cm SSD, 4 cm solid water before air gap (Wong et al 1992). Air Cavity Thickness (cm) Surface Dose Percentage Error 6 MV 18 MV 5 x 5 cm 2 10 x 10 cm 2 5 x 5 cm 2 10 x 10 cm Table 2.4 Percentage errors at the distal surface of a slab air cavity between the experimental data obtained using a Markus chamber and the ETAR calculated values for 100 cm SSD, 4 cm solid water before air gap (Wong et al 1992). Li et al (2000) found that the dose reduction effects increased when the air cavity was situated at a smaller depth in water. Build down effects before the air cavity have also been observed (Ding et al 2004). Page 59 of 169
60 Du Plessis et al (2001) investigated air cavities in a patient model based on CT scans. For the maxillary sinus region, inaccuracies of 20-70% were measured using the ETAR correction compared to Monte Carlo calculations. As mentioned in Section (page 44), Munjal et al (2006) investigated the ability of the PLATO-SUNRISE TPS to calculate the dose at the centre of a phantom where the field passed through a PMMA board, then an ~8 cm air gap before entering the phantom. When the board and air gap were included in the dose calculation, the TPS calculated the dose to within 1.5% for all incident beam angles. The TPS consistently overestimated the dose but no comment was made regarding this systematic error. No investigation into the accuracy of the dose calculation at the air/phantom interface for the set up was conducted. This was the only study found that investigated the dosimetric effects of air gaps created outside the patient s body by an immobilisation device Low Density Inhomogeneities The studies into the effects of low density inhomogeneities mostly focused on dose within the lung or near the lung/tissue interface region beyond the lung (Young and Kornelsen 1983, Mackie et al 1985, Metcalfe et al 1993, Kappas and Rosenwald 1995, du Plessis et al 2001, Carrasco et al 2004, Ding et al 2004). They did not investigate depths of more than a few centimetres beyond the low density inhomogeneity. Dose at a depth beyond a low density inhomogeneity may be required when a beam passes through an immobilisation device which is used for the patient set up. This is not uncommon when using modern conformal and IMRT treatment techniques due to the increased number of gantry angles used. Studies investigating the accuracy of dose calculations in this situation were not found in a literature search. Page 60 of 169
61 Mackie et al (1985), Metcalfe et al (1993), du Plessis et al (2001), Engelsman et al (2001) and Carrasco et al (2004) investigated the ETAR method of inhomogeneity correction which is used in this study. For high energy photon beams (such as 6 MV), calculations using the ETAR method of inhomogeneity correction have been found to overestimate the dose within and near low density media (Young and Kornelsen 1983, Mackie et al 1985, Carrasco et al 2004). The magnitude of the errors was found to increase when smaller field sizes and higher energy photon beams were used (Mackie et al 1985, Metcalfe et al 1993). The results from Metcalfe et al (1993), shown in Table 2.5, illustrate these trends. Percentage Difference between the ETAR Predicted Dose and Measured Dose Energy 6 MV 10 MV 18 MV Field Size (cm 2 ) 5 x 5 10 x 10 5 x 5 10 x 10 5 x 5 10 x 10 Mid Lung Lung/Tissue Interface Table 2.5 Percentage difference between the ETAR predicted dose and the dose measured with a thimble ionisation chamber in a 4 cm solid water / 8 cm solid lung / 4 cm solid water phantom (Metcalfe et al 1993). Lateral scatter and penumbra broadening in low density materials has also been observed, neither of which were accounted for by the ETAR correction method (du Plessis et al 2001, Engelsman et al 2001, Carrasco et al 2004). The difference between the measured and calculated results for both the air gap and low density inhomogeneity studies were attributed to electronic equilibrium not occurring at the point of interest, violating an assumption of the calculation method, that the point where the dose is calculated is located at a position where Page 61 of 169
62 electronic equilibrium exists (Mackie et al 1985, Metcalfe et al 1993, Wong et al 1996). The loss of longitudinal and lateral electronic equilibrium is dependent on energy, radiation field size and the range of charged particles set in motion (increasing with increasing energy of the incident beam and decreasing density of the material) (Shahine et al 1999). When the beam passes through a low density region, e.g. lung or air cavity, the primary transmitted radiation is increased as the lower density material attenuates the beam less. However, there are fewer scattered photons created by the lower density material (reducing dose) and fewer electrons set in motion and the electrons which are set in motion have a greater range (Young and Kornelsen 1983, Shahine et al 1999). These effects result in regions of electronic disequilibrium and also in electrons travelling outside the limits on the photon beam which degrades the beam profile (Young and Kornelsen 1983). For low energies, such as those from cobalt 60 beams, the extent of regions where electronic equilibrium is not achieved is limited so the inaccuracies in the dose calculations are reduced (Young and Kornelsen 1983). Calculations using the ETAR inhomogeneity correction also only account for photon transport so they do not consider the transport of secondary electrons and therefore do not account for the effects observed (Metcalfe et al 1993, Shahine et al 1999, du Plessis et al 2001). Page 62 of 169
63 3 Investigation into the Dose beyond Immobilisation Devices This chapter describes dosimetry investigations of radiation therapy treatments involving photon beams passing through a variety of immobilisation devices for slab and anthropomorphic geometries. This chapter describes in detail the: equipment used; treatment set-ups and imaging during simulation; creation of the treatment plans; radiation dose measured for the treatment plans and; comparison of the measurements to the dose distribution calculated by the Eclipse TPS. The aim of this study was to confirm if Eclipse PBC dose calculation algorithm (with ETAR inhomogeneity correction) can calculate the dose distribution and MUs to within an acceptable clinical tolerance of 2.5%, when the treatment fields pass though a complex and/or low density immobilisation device which is included in the body structure. 3.1 Materials Phantoms The Bailliere s Australian Nurses Dictionary defines a phantom as a device for simulating the in vivo interaction of radiation with tissues (Burr et al 1991). They are used so that an image or dose measurement may be obtained under defined conditions of exposure. For measuring dose distribution data, water phantoms are often used. This is because water closely approximates the radiation absorption and scattering properties of soft tissue. As it is not always possible to Page 63 of 169
64 conduct measurements in a water phantom, solid dry phantoms have been developed as substitutes for water. The aim is to have the same effective atomic number, number of electrons per gram and mass density as water (Khan 2003). Anthropomorphic phantoms are also commonly used for clinical dosimetry. The phantoms are the shape of a human head and torso, incorporate material to simulate muscle, bone and lung tissue and also have air cavities (Khan 2003). The use of anthropomorphic phantoms with thermoluminescent dosimeter chips for TPS validation has been described by Dunscombe et al (1996). The accuracy of the technique per measurement point is estimated to be 3% for dose (with low dose gradient) and 3 mm in positional accuracy (with high dose gradient). Two phantoms were used in this study, a water equivalent slab phantom and an anthropomorphic phantom Slab Phantom Water equivalent RW3 (rigid water) slabs (PTW-Freiburg, Germany) and Certified Therapy Grade (CTG) solid water slabs (Gammex RMI, Middleton, WI, USA) were used to create a homogeneous, cubic object to simulate a simple geometry treatment situation. These phantom materials are designed to simulate a water equivalent medium. The CTG solid water slabs were 30 x 30 cm 2 with varying thickness (1, 2 and 4 cm). The thickness tolerance of the slabs is ± 0.5 mm. One of the slabs contained a cavity shaped to hold a 0.6 cm 3 ionisation chamber in the centre of the slab. A solid water insert designed to fill the cavity was used during the CT scans taken during the planning process. An illustration of some CTG solid water slabs can be found in Figure 3.1. Page 64 of 169

.")
65 Figure 3.1 Certified Therapy Grade Solid Water ( _id=359&oscsid=b7d ea29f2c28797ea701f0441). To supplement the solid water slabs, water equivalent RW3 slabs were used to provide back scatter. The RW3 slabs were 30 x 30 cm 2 and 0.1, 0.2, 0.5, and 1 cm thick. The thickness tolerance of the slabs is ± 0.1 mm. Some water equivalent RW3 slabs are illustrated in Figure 3.2. Figure 3.2 Acrylic and RW3 (Goettingen White Water) Slab Phantoms ( The overall phantom dimensions were 12 x 30 x 30 cm 3, consisting of 7 cm total thickness of solid water slabs placed on top of 5 cm total thickness of RW3 slabs. The slabs were arranged so that centre of the chamber cavity, with insert Page 65 of 169
66 in place, was located at a depth of 5 cm. A schematic diagram of the phantom is shown in Figure cm 7 cm 5 cm 30 cm 5 cm Figure 3.3 A schematic diagram of the slab phantom Anthropomorphic Phantom A human shaped RANDO anthropomorphic phantom (Alderson Labs, Stamford, CT, USA) was used to simulate a more complex treatment situation similar to the treatment of a human. The phantom was configured to be a torso and head of an adult female and was constructed of tissue, lung and bone equivalent materials. The phantom was divided into 2.5 cm thick slices with removable plugs in which thermoluminescent dosimeters could be placed. A RANDO anthropomorphic phantom is illustrated in Figure 3.4. Page 66 of 169

67 Figure 3.4 RANDO anthropomorphic phantom ( Immobilisation Devices The effects of four different immobilisation devices were investigated. They were: a MEDTEC Contoura belly board; a Sinmed Posiboard -2 breast board; a VacFix vacuum bag and; a MEDTEC Type-S head extension. The MEDTEC Contoura belly board is made of hollow core carbon fibre, and comes with three interchangeable padded inserts to customise bowel displacement ( A MEDTEC Contoura belly board is illustrated in Figure 3.5. Page 67 of 169
 is made of a low density foam core covered with a thin layer of carbon fibre. The board can be positioned at eight different angles.")

68 Figure 3.5 MEDTEC Contoura Belly Board ( The Sinmed Posiboard -2 breast board (illustrated in Figure 3.6) is made of a low density foam core covered with a thin layer of carbon fibre. The board can be positioned at eight different angles. The position of the arm supports and bottom stop can also be adjusted ( Figure 3.6 Sinmed Posiboard -2 Breast Board ( The VacFix vacuum bag consists of an airtight plastic bag containing polysterol microspheres. The plastic cover is 0.15 mm thick. During the treatment simulation stage, the patient is set up in the treatment position with the vacuum bag placed around them. The air is evacuated through a valve using a suction pump resulting in a rigid, close fitting cast (Jakobsen et al 1987). Because of the air tight valve, the mould can maintain its shape throughout the course of treatment. At the conclusion of the course of treatment, the valve is opened and the bag can be reused. Vacuum bags can be used over a wide range of Page 68 of 169
. The MEDTEC Type-S head extension (illustrated in Figure 3.8) consists of a head and shoulder base plate which extends off the end of the treatment couch.")
69 treatment areas (Khan 2007, Podgorsak 2003). Various sizes of VacFix vacuum bags are illustrated in Figure 3.7. A large size vacuum bag was used throughout this study. Figure 3.7 VacFix Vacuum Bag ( The MEDTEC Type-S head extension (illustrated in Figure 3.8) consists of a head and shoulder base plate which extends off the end of the treatment couch. The shoulder support and head frame is made of carbon fibre with a low density core. The treatment grid section is made of solid carbon fibre. ( Head extension boards are used in conjunction with a face mask and neck support. Page 69 of 169
. 3.")
70 Figure 3.8 MEDTEC Type-S Head Extension ( Dosimetry Systems Ionisation Chamber To verify the dose within the slab phantom, an ionisation chamber and electrometer, with a calibration traceable back to the Australian primary standard at the Australian Radiation Protection and Nuclear Safety Agency was used. The ionisation chamber was an NE Technology Limited (Berkshire, England), model 2571, Farmer type cylindrical ionisation chamber. The chamber has a graphite wall and a cavity volume of 0.6 cm 3. The chamber was used in conjunction with a Keithley programmable dosimeter (Keithley Instruments Inc, Cleveland Ohio, USA) with the bias voltage set to -300 V. The electrometer readings were converted to absorbed dose using the formula given in Equation 3.1. D w, Q = M Q N D, w, QokQ, Qo Equation 3.1 Page 70 of 169
71 Where M Q is the dosimeter reading which has been corrected to the reference values of influence qualities, other than beam quality, such as temperature and pressure, for which the calibration factor is valid. N D,w,Qo is the calibration factor in terms of absorbed dose to water of the dosimeter and K Q,Qo is the beam quality correction factor (IAEA TRS ). All measurements were repeated until the reading stabilised, using a minimum of three measurements. The readings were corrected for daily LINAC output variations by conducting a constancy measurement under standard conditions of LINAC exposure during each session of experimental measurements. An average of the readings was used to determine M Q. The relative standard uncertainty of D w,q is estimated as 1.5% (IAEA TRS ) Thermoluminescent Dosimeters To verify the dose within the RANDO anthropomorphic phantom, thermoluminescent dosimeters (TLDs) were placed within hollow plugs in the phantom where the treatment fields passed through the phantom. The TLD plug replaced one of the tissue equivalent plugs for the measurement. An explanation of the theory of thermoluminescent dosimetry can be found in Khan (2003). The TLD chips used were Harshaw TLD-100 chips (Bicron, Solon, Ohio, USA). They were made of lithium fluoride doped with magnesium and titanium and had the dimensions of 3.2 x 3.2 x 0.89 mm 3. Four chips were used for each phantom measurement. The chips were aligned to form a rectangle 12.8 x 3.2 mm 2, wrapped in thin plastic film (GLAD WRAP) and placed between two halves of a hollow PMMA plug used for insertion into the phantom. The TLDs and plugs are shown in Figure 3.9. Page 71 of 169

72 Figure 3.9 Top left: Four loose Harshaw TLD-100 chips. Top right: Four Harshaw TLD-100 chips wrapped in thin plastic. Bottom left: two halves of a hollow plug used for containing TLDs in a RANDO anthropomorphic phantom. Bottom right: a tissue equivalent plug used throughout a RANDO anthropomorphic phantom. Prior to each TLD exposure, the chips were annealed to remove any residual TL signal from previous exposures. The annealing process restores the original sensitivity and glow curve characteristics of each chip. The pre-irradiation annealing program consisted of heating the chips at 400 o C, remaining at 400 o C for one hour, then applying a rapid cool to 100 o C. The chips are then kept at 100 o C for two hours and then rapidly cooled to 45 o C. A programmable PTW- TLDO annealing oven was used. The sensitivity of each TLD chip in a batch of 100 was calculated by irradiating the batch of TLDs in a Perspex slab phantom. One slab had a section with shallow indentations drilled into it, to allow the TLDs to be placed in 10 rows of 10 TLDs positioned in the central region of the slab. The chips were irradiated using a 6 MV photon beam at the depth of dose maximum (12 mm in Perspex) with a field size sufficient to irradiate all the chips to the same dose. The sensitivity of each chip was calculated by dividing the average reading obtained for all the chips in the set by the reading obtained for the chip. The sensitivity of each chip in the batch was obtained by averaging the sensitivity obtained from five repeat Page 72 of 169
73 experiments. Only chips which produced reproducible results with a standard deviation of less than 2% were used for TLD measurements in this project. During each experimental TLD exposure, 12 chips from the TLD set being used were allocated to determine a calibration curve to convert the TL reading to dose. Using the Perspex slab phantom, three sets of four TLDS were exposed to a known dose, which encompassed the doses expected to be delivered to the TLDs. Calibration doses of 50, 150 and 250 cgy were delivered. The experimental and calibration TLD chips were read at the same time using a Harshaw 5500 TLD reader controlled with TLD Shell software (S ). The time-temperature settings used during the reading consisted of preheating the chips to 100 o C in 15 seconds, then increasing the temperature at a rate of 15 o C/s until 300 o C was reached. The raw reading data was exported in ASCII file format into Microsoft Excel for analysis. First the raw readings were corrected according to their sensitivity. Then based on the readout from the 12 calibration TLDs, a calibration curve was generated (using a best fit 2 nd order polynomial curve) for a range of exposures from 0 to 250cGy. If the R 2 value for the best fit curve obtained was between and , the calibration curve was then used to calculate the dose delivered to the experimental TLDs. The average dose measured by the four chips used for each phantom measurement was taken as the point dose at the centre of the plug. The accuracy of the use of anthropomorphic phantoms with TLD chips per measurement point is estimated to be 3% for dose (with low dose gradient) and 3 mm in positional accuracy (with high dose gradient) (Dunscombe et al 1996). Page 73 of 169
74 3.2 Methods All experiments simulating radiation therapy treatments with an immobilisation device were conducted in 3 stages: i) simulation; ii) planning; and iii) treatment delivery. Experiments for each phantom were conducted with and without an immobilisation device in place to determine the effect of the device on the accuracy of the treatment plan dose calculation. i) Simulation A CT scan of the phantom with and without each immobilisation device arranged in the treatment set up was obtained using a GE lightspeed CT scanner (General Electric Medical Systems, Milwaukee, Wisconsin, USA). The phantom was aligned with the CT room isocentric lasers, which are maintained to be within 2 mm of the CT isocentre as recommended by the ACPSEM (Millar et al 1997). These lasers identify the centre of the scan and allow the phantom to be set up in the same position during treatment using the treatment room lasers which identify the isocentre of the LINAC. The position of the immobilisation device relative to the phantom was recorded and the position of the lasers was marked on the phantom and immobilisation device. CT marker wires were placed on the phantom during the scan to allow the laser positions to be visualised on the scan. The CT scans were obtained with the standard settings used for a patient treatment with each an immobilisation device. The CT scanner settings consisted of a slice thickness of 2.5 mm, a peak voltage of 120 kv and a current of between 220 and 260 ma, depending on the treatment area. The field of view was extended from the default of 50 cm to the maximum of 65 cm to encompass the entire phantom and immobilisation device. Page 74 of 169
75 ii) Planning The CT scan data was exported into the Eclipse TPS to create plans for each treatment set up. Plans were created for the simulated patient and immobilisation devices for (i) a body structure including the phantom only when no immobilisation device was present, (ii) a body structure including the phantom only when there was an immobilisation device present and (iii) a body structure including the phantom and the immobilisation device. To create the body structure for the phantom only plans, the phantom was contoured using the Search Body software tool in Eclipse. This tool automatically contours the parts of an object with CT numbers within a range specified in the software as typical for human tissue. The Eclipse TPS then processes the contour to fill in gaps within the contour not included in the original search, such as air cavities (Varian Medical Systems 2003d). To create the body structure for the phantom and immobilisation device plans, the phantom was contoured as for the phantom only plan. Then an additional immobilisation device structure was created by drawing a bulk contour around the entire immobilisation device as indicated in the CT scan. This contour included any air gaps created between the immobilisation device and phantom. The immobilisation device structure was then added to the body structure, using a Boolean Operator software tool in Eclipse, to create a new composite body structure which included both the phantom and the immobilisation device. Fields were added to the plans which passed through the immobilisation device in an identical fashion for both plans. All plans created during the investigation into the dose beyond immobilisation devices were planned for a 6 MV photon beam produced by a Varian CLINAC 2100C/D radiotherapy LINAC. The Eclipse dose was calculated using the PBC_75143 algorithm, with a 2.5 mm calculation grid and the ETAR inhomogeneity correction. Page 75 of 169
76 In Eclipse, reference points are used for displaying, defining and prescribing the absorbed dose at specific locations (Eclipse, Version 6.5 Instructions for Use, Treatment Planning). Reference points were created at locations inside the phantom and within the boundaries of the treatment fields. One of the reference points was used as the prescription point whilst the other point(s) were selected at the locations where the dosimeter(s) would be placed for the subsequent measurements taken in the phantom during the treatment stage. iii) Treatment The CT scan phantom set ups were reproduced on the LINAC to simulate a patient treatment with the dosimeter(s) placed in the phantom in the position of the dose reference points in the treatment plan. The phantom was aligned with the LINAC room isocentric lasers, which are maintained to be within 2 mm of the LINAC isocentre as recommended by the ACPSEM (Millar et al 1997). TLDs were placed in the anthropomorphic phantom and an ionisation chamber in the slab phantom. The treatment parameters of the plan were reproduced on the LINAC and the phantom exposed using the MUs calculated by Eclipse. The measurements were then processed to determine the dose at each defined measurement point in the phantom. The result was compared to the Eclipse point dose calculated in the treatment plan Slab Phantom Set Ups Without Immobilisation Device To provide a control measurement for the slab geometry case, plans were created for the slab phantom alone. Three plans were created with one field each. The field sizes used were 5 x 5 cm 2, 10 x 10 cm 2 and 20 x 20 cm 2. The fields were centrally placed and the phantom surface was set to 100 cm SSD. A dose reference point was defined where the centre of the ionisation chamber was Page 76 of 169

77 positioned for the measurement during the treatment stage. Figure 3.10 illustrates a plan created for the slab phantom alone. Figure 3.10 Plan created in Eclipse for the slab phantom alone With Immobilisation Device For the experimental set ups, each of the four immobilisation devices was placed on top of the slab phantom and positioned with a central, but not necessarily uniform, section over the centre of the phantom. Six plans were created for each of the immobilisation devices, three for when the body structure only included the phantom and three for when body structure included both the immobilisation device and the phantom. Each plan used a single centrally located field of either 5 x 5 cm 2, 10 x 10 cm 2 or 20 x 20 cm 2. The phantom surface was set to 100 cm SSD and a dose reference point was defined at the centre of the cavity for the ionisation chamber. Two regions of the head extension were chosen to investigate its beam attenuation properties. The solid shoulder support region and the grid section of the head support. One region of each of the other immobilisation devices was investigated for their attenuating affects. The set up for the shoulder region of the head extension is illustrated in Figure Figure 3.12 illustrates two of the plans created for the shoulder region of the head extension board. Page 77 of 169

78 Figure 3.11 The set up for the shoulder support region of the head extension board on the slab phantom. Page 78 of 169


79 (a) (b) Figure 3.12 Plans created in Eclipse for the shoulder region of the head extension board with only the phantom included in the body structure (a) and with the phantom and the immobilisation device included in the body structure (b) RANDO Phantom Set Ups Without Immobilisation Device To simulate a patient treatment where a field directly enters the patient, three plans were created using the RANDO phantom. Plans were created to simulate a 10 x 10 cm 2 field passing through lung, bone and tissue areas. Page 79 of 169

 (b) Figure 3.13 The plans for the RANDO phantom with fields passing through tissue (a) and bone (b). 3.2.")
80 A dose reference point was selected to correspond with the centre of where the TLD plug was located for measurement during the treatment stage. The location for the TLD measurement was carefully chosen to be within the treatment area where the dose gradient was less than 2.5% across the TLD plug and in lung, behind bone and in tissue respectively. Figure 3.13 shows the plans created for the tissue and bone fields. The blue cross represents the position of the dose reference point for the plan. (a) (b) Figure 3.13 The plans for the RANDO phantom with fields passing through tissue (a) and bone (b) With Immobilisation Device RANDO phantom plans were created with one treatment field passing through each of the belly board and vacuum bag. Three treatment fields were used for each of the breast board and head extension plans. The treatment fields were Page 80 of 169

81 placed to pass through varying amounts of the immobilisation device. During treatment, the fields for the belly board, vacuum bag and breast board also passed through the central region of the treatment couch where the tennis string insert, covered with a Mylar sheet, was placed on the treatment couch. Figure 3.14 shows one CT slice of the plans created for the RANDO phantom on the breast board. (a) (b) Figure 3.14 Fields created for the RANDO phantom on the breast board with only the phantom included in the body structure (a) and with the phantom and the immobilisation device included in the body structure (b). Dose reference points were selected in regions of the phantom where the beam had only passed through the immobilisation device and tissue equivalent sections of the phantom (i.e. not in or beyond lung or bone regions). One TLD Page 81 of 169
82 plug was selected for the belly board and vacuum bag plans, three for the head extension plans and four for the breast board plans. For the head extension and breast board plans, the plugs were selected to be behind different sections of the immobilisation device. 3.3 Results and Discussion Errors and Uncertainties The uncertainty of the experimental measurements using the slab phantom with an ionisation chamber was estimated to have a 95% confidence interval of ±2% using the method described by Gregory et al (2005). The accuracy of the experimental measurements using the anthropomorphic phantom with TLD chips was estimated to be 3% as the TLD chips were positioned in areas of low dose gradient (Dunscombe et al 1996). This value is consistent with the uncertainty calculated using the method described by Gregory et al (2005). Based on the documentation describing the accuracy of the Eclipse TPS PBC algorithm (Varian Medical Systems 2003b), the uncertainty for calculations using the slab phantom with no immobilisation device was taken to be 1% and the uncertainty for calculations for all other set ups was taken to be 2.5% (by averaging the quoted uncertainty of 2-3% for a typical clinical set up). Page 82 of 169
83 3.3.2 Slab Phantom No Immobilisation Device Table 3.1 shows the difference obtained between the measured and calculated dose for the slab phantom when no immobilisation device was present. These results indicate that the measurements agree to within 0.5% of the dose calculated by Eclipse. All of these results are within the 2% tolerance level and the 1% accuracy quoted in the Vision Calculation Algorithms (Varian Medical Systems 2003b) manual for rectangular fields, photon beam reconstruction model (homogeneous water equivalent material, no surface curvature). Field Size (cm 2 ) % Difference 5 x x x Table 3.1 The percentage difference between the measured and calculated dose for the slab phantom, no immobilisation device set up. The uncertainty for the measured dose is estimated to be ±2% and for the calculated dose ±1%. Page 83 of 169
84 With Immobilisation Device Table 3.2 and Table 3.3 show the results for the slab phantom when an immobilisation device was present, with and without the immobilisation device included in the body structure. Immobilisation Device Region Field Size (cm 2 ) % Difference Device Not Contoured % Difference Device Contoured Head Extension Grid 5 x Head Extension Grid 10 x Head Extension Grid 20 x Head Extension Shoulder 5 x Head Extension Shoulder 10 x Head Extension Shoulder 20 x Table 3.2 The percentage difference between the measured and calculated dose for the slab phantom, with immobilisation device set up (Head Extension Board). The uncertainty for the measured dose is estimated to be ±2% and for the calculated dose ±2.5%. Page 84 of 169
85 Immobilisation Device Field Size (cm 2 ) % Difference Device Not Contoured % Difference Device Contoured Belly Board 5 x Belly Board 10 x Belly Board 20 x Breast Board 5 x Breast Board 10 x Breast Board 20 x Vacuum Bag 5 x Vacuum Bag 10 x Vacuum Bag 20 x Table 3.3 The percentage difference between the measured and calculated dose for the slab phantom, with immobilisation device set up (Belly Board, Breast Board and Vacuum Bag). The uncertainty for the measured dose is estimated to be ±2% and for the calculated dose ±2.5%. Device Not Contoured Any difference obtained when the immobilisation device is not included in the body structure is to some extent the result of the attenuation by the device in the beam path. All of the immobilisation devices used were designed so the areas through which fields are expected to pass will be as radiotranslucent as possible (i.e. resulting in minimal attenuation), while maintaining the strength and rigidity required for patient immobilisation. As a result, the majority of the measurements when the immobilisation devices were not contoured were within the 2.5% tolerance level. The main exception to this was for the breast board, where none of the results when the breast board was not included in the body structure were within the tolerance level, the maximum difference being 8.4%. These large Page 85 of 169
86 differences resulted from the field passing through a central region of the breast board, consisting of a solid carbon fibre base support section (~1.0 cm thick) and the tilted back support region made of two thin sheets of carbon fibre (~0.2 cm thick) with a low density core (~1.5 cm thick). Although no standard tangential breast field would pass directly through the central region of the base support, posterior fields, such as those used to treat the axilla region, may pass through the base support either wholly or in part. It is also possible that the breast board may be used for treatments not considered during its design, such as lung or spine treatments. In these cases, the fields may also pass through a central section of the breast board. If a beam did pass through the central section of the breast board, ignoring the dosimetric effects of the device would result in a significant error in the dose calculation. The dose calculation would also result in the absorbed dose to the target volume being not delivered to an accuracy of 5% or better as recommended by the ICRU (ICRU Report ). Applying a blanket transmission factor to correct the dose calculation would only be appropriate if the field passed wholly through the central section of the breast board. However, an error in the dose calculation may still result if the transmission factor was only measured for a limited number of field sizes and shapes and not for the specific shape and size of field used for the patient treatment. The breast board is also designed to allow a flexible set up. The angle of the tilted back support region can be varied relative to the base support and the transmission factor may vary with the change in angle between the base and tilted back support regions. The variety of field shapes and sizes and flexibility in the set up of the breast board may result in the measurement of a large number of transmission factors being required, limitations in use of the breast board Page 86 of 169
87 being applied or the acceptance of the uncertainty in the dose calculation for fields which passed through the base support region of the breast board. If a blanket transmission factor was applied when the field passed only in part through the base support of the breast board the dose calculation would result in the area beyond the back support being overestimated and the area not beyond the back support being underestimated. If the transmission factor was calculated using average transmission between the two sections of the board, due to the high attenuation by the back support region the dose calculation in neither of the areas would be within the desired accuracy for the dose calculation of better than 2.5% (Van Dyk 1999). Applying a transmission factor may also not result in an accurate indication of the skin dose beyond the immobilisation device, which may be of clinical significance in some treatment scenarios. The use of transmission factors to correct the dose calculation is not ideal and can result in inaccuracies in the dose calculation. A method such as incorporating the immobilisation devices used in the dose calculation, which would account for variations in the material and thickness of the immobilisation device and the resultant changes in dose distribution would be preferred. Device Contoured The vacuum bag point was behind a ~3.0 cm thick section of the vacuum bag and the belly board point was behind an ~8.0 cm thick section of the belly board, consisting of a carbon fibre shell filled with a low density core. Based on the results from the studies investigating the effects of low density inhomogeneities, where large thickness of low density material are present, areas of electronic disequilibrium may occur and a reduction of dose immediately beyond the inhomogeneity due to a loss of scatter may result, particularly for smaller field sizes and higher energies (see Section 2.6.2). Mackie et al (1985) noted that the Page 87 of 169
88 measured dose became closer to the calculated dose with increasing depth beyond the low density inhomogeneity, being consistent with the results being within tolerance levels at a depth of 5 cm in the phantom. For all of the primarily low density immobilisation devices (belly board, vacuum bag and head extension (shoulder region)), the percentage difference between the calculated and measured dose increased as the field size decreased. The increase in errors with reducing field size is consistent with the previously published studies investigating the dose behind low density inhomogeneities (Mackie et al 1985, Metcalfe et al 1993). For the breast board, the field passed through a large air gap, ~8.5 cm (between 7 and 11 cm for the 20 x 20 cm 2 field), between the base and shoulder support regions of board. The published studies on air gaps did not investigate the dose behind air gaps as large as this and generally only applied the results obtained to the dose immediately beyond the air gap (see Section 2.6.1). Chapter 4 describes further investigations into the ability of the Eclipse TPS to accurately calculate the dose behind large air gaps. In Chapter 5 a discussion of the results obtained for the breast board in this study considering the results from the air gap investigation is presented. Despite any inaccuracies in the dose calculation by Eclipse beyond low density inhomogeneities and air gaps, including the immobilisation device in the body structure resulted in a significant improvement in the dose calculation accuracy. When the immobilisation devices were included in the body structure, all the results were within the tolerance level of 2.5%. As the Eclipse PBC algorithm when used with the ETAR method of inhomogeneity correction does not account for situations of electronic disequilibrium and changes in scatter conditions due to inhomogeneities, further Page 88 of 169
89 verification studies are required to confirm that the dose near the immobilisation device is calculated accurately RANDO Phantom No Immobilisation Device Table 3.4 shows the difference obtained between the measured and calculated dose for the RANDO phantom when no immobilisation device was present. Field Description % Difference (Dose) 6 MV behind Bone MV in Lung MV in Tissue -1.6 Table 3.4 The percentage difference between the measured and calculated dose for the RANDO phantom, no immobilisation device set up. The uncertainty for the measured dose is estimated to be ±3% and for the calculated dose ±2.5%. All of the results are within the 2.5% accuracy for the plan and treat steps required to fulfil the recommendations of the ICRU (ICRU Report , Van Dyk 1999) and the 2-3% accuracy expected from Eclipse. The results indicate that Eclipse can calculate the dose in a tissue equivalent material to within 1.6%, with an irregular surface and no inhomogeneities. The larger difference obtained for the lung result is consistent with the previously published studies (Mackie et al 1985, Metcalfe et al 1993, du Plessis et al 2001, Engelsman et al 2001 and Carrasco et al 2004), where large errors within and Page 89 of 169
90 beyond low dose inhomogeneities were observed for dose calculation algorithms utilising the ETAR method of inhomogeneity correction With Immobilisation Device Table 3.5 shows the difference obtained between the measured and calculated dose for the RANDO phantom when there was an immobilisation device present. Immobilisation Device Point % Difference Device Not Contoured % Difference Device Contoured Head Extension Head Extension Head Extension Belly Board Breast Board Breast Board Breast Board Breast Board Vacuum Bag Table 3.5 The percentage difference between the measured and calculated dose for the RANDO phantom, with immobilisation device set up. The uncertainty for the measured dose is estimated to be ±3% and for the calculated dose ±2.5%. Page 90 of 169
91 Device Not Contoured When the immobilisation device was not included within the body structure, differences greater than the desired 2.5% were measured. Eclipse overestimates the dose in every case, reflecting the failure to adequately account for the attenuation of the immobilisation devices placed in the beam s path. The largest difference (-7.7%) was obtained for breast board Points 1 and 3. Point 1 was within a laterally located field, where half of the field passed through the solid carbon fibre base of the breast board, a ~6.5 cm air gap and the tilted back support region of the breast board (made of two thin sheets of carbon fibre with a low density core). The other half of the field passed through only the thin grid section of the breast board. Point 3 within a centrally located field where the entire field passed through base and back support sections of the breast board and an ~8.5 cm air gap. As both Points 1 and 3 were behind the base and back support of the breast board, the large dose difference obtained for those points reflects the neglected attenuation due to the immobilisation device. Breast board Point 1 was located within the same field as breast board Point 2, with Point 2 located behind a thin grid section of the breast board. The location of the two points can be seen in Figure 3.14 (page 81). Breast board Point 4 was located within a field that passed through only the thin grid section of the breast board. Point 4 had the lowest difference of the breast board points of -2.1%. The difference obtained for Point 2 was larger (-3.6%) which may have been due to a reduction in scatter reaching the point from the section of the field behind the base and back support, where the primary component of the beam was reduced. For the head extension board, Points 1 and 2 were behind the carbon fibre grid section of the board and also behind the skull bone of the RANDO phantom. Small air gaps, up to a few centimetres thick, were present between the grid section head extension board and head of the RANDO phantom due to a thin plastic head rest supporting the phantom. The field incident on Point 2 Page 91 of 169
92 intersected with the carbon fibre grid and the carbon fibre frame of the head extension board. Head extension board Point 3 was behind the carbon fibre (with a low density core) shoulder support region of the board. When the head extension board was not included in the dose calculation, the difference between the measured and calculated results was up to -3.8% (Point 3). The vacuum bag point was behind ~6 cm of vacuum bag and ~4 cm deep in the phantom. The belly board point was behind ~7 cm of the belly board, in a section consisting of a carbon fibre shell and low density core and ~6 cm deep in the phantom. When the immobilisation devices were not included in the dose calculation the difference between the measured and calculated results was -2.5% and -4.7% for the vacuum bag and belly board respectively. Device Contoured When the breast board was included in the dose calculation, all the results were within the clinical tolerance of 2.5%. Significant improvements in the dose calculation were observed for the points positioned beyond the base support of the breast board (Points 1 and 3) when the device was included in the dose calculation. The largest difference obtained was for Point 3 (-2.5%) which was behind a large air gap and near the surface of the phantom (~3 cm depth), consistent with the results of studies which have found that the ETAR method of inhomogeneity correction overestimates the dose behind air gaps near the air/tissue interface (Wong et al 1992, Wong et al 1996, Shahine et al 1999). These results are discussed further in Chapter 5, where the results obtained for the breast board in this study considering the results from the air gap investigation (Chapter 4) is presented. For the head extension board, when the board was included in the calculation the differences for all the head extension board points were within the clinical Page 92 of 169
93 tolerance of 2.5%. However, Eclipse still overestimated the dose in all cases. These results are consistent with the ETAR method overestimating the dose behind low density inhomogeneities (Mackie et al 1985, Metcalfe et al 1993, du Plessis et al 2001, Engelsman et al 2001, Carrasco et al 2004). When the vacuum bag and belly board were included in the dose calculation, the differences reduced to within the clinical tolerance, with Eclipse overestimating the dose to the belly board point (-2.1%) as expected due to the low density inhomogeneity. Eclipse underestimated the dose to the vacuum bag point (+0.8%), which was not expected based on the results of previous studies. It is possible that this magnitude of difference between the TLD measured dose and the Eclipse point dose was due to uncertainties induced by the volume where the TLDs were placed being in a region where the dose gradient was up to 2.5% and/or the reproducibility of the TLDs being up to 2%. Page 93 of 169
94 3.4 Conclusions While some of the dose calculations for when an immobilisation device was not included in the body structure were within tolerance levels, errors of up to 8.4% in dose calculation were obtained for beams passing through the base support region of the breast board. An error of this magnitude does not fulfil the recommendations of the ICRU for the accuracy required for the plan and treat steps (ICRU Report , Van Dyk 1999). For this case it was concluded that due to the significant attenuation of the beam by the immobilisation device, ignoring the device in the dose calculation is not appropriate. As a field may pass only in part through the attenuating part of the device, it was also concluded that the use of a blanket transmission factor was also not appropriate. When the immobilisation device was included in the body structure all of the results improved to be within the 2.5% tolerance level. Including the immobilisation device in the body structure was found to increase the dose calculation accuracy and fulfil the recommendations of the ICRU for the accuracy required for the plan and treat steps (ICRU Report , Van Dyk 1999). The results were also consistent with the 2-3% accuracy expected from Eclipse (Varian Medical Systems 2003b). Page 94 of 169

95 4 Investigation into the dose behind Air Gaps When some immobilisation devices are used, large air gaps are created either within the immobilisation device or between the treatment couch and/or the immobilisation device and the patient. Figure 4.1 illustrates some examples where a field passes through a large air gap prior to entering the patient when a breast board, head rest and knee rest are used to immobilise the patient during treatment. (a) Page 95 of 169
 A posterior axilla field for a patient on a breast board; (b) a posterior oblique IMRT field to the parotid where the patient is positioned with a face mask on a head rest and PMMA board; and (c)")
96 (b) (c) Figure 4.1 Examples of patient treatments where the field passes through a large air gap prior to entering the patient. (a) A posterior axilla field for a patient on a breast board; (b) a posterior oblique IMRT field to the parotid where the patient is positioned with a face mask on a head rest and PMMA board; and (c) a posterior field to the femur where the patient is positioned using a knee rest. Page 96 of 169
97 Previous studies into the effects of air cavities on radiotherapy dose distributions have focused on small air cavities (up to 5 cm thick) to represent air cavities within a patient s body (Young and Kornelsen 1983, Beach et al 1987, Wong et al 1992, Wong et al 1996, Kan et al 1998, Shahine et al 1999, Li et al 2000, du Plessis et al 2001, Ding et al 2004). These studies investigated the dose at shallow depths behind the air gap up to 2 cm (Li et al 2000, Ding et al 2004) or 4 cm (Wong et al 1992, Wong et al 1996, Shahine et al 1999). Researchers who investigated the ETAR method of inhomogeneity correction found that it can result in an overestimation of dose beyond small air cavities (Wong et al 1992, Wong et al 1996, Shahine et al 1999). This chapter describes the materials, methods and results obtained for the dose delivered beyond various thicknesses of slab air gaps up to 15 cm thick and for varying thickness of water equivalent material before the air gap. The results were compared to Eclipse dose calculations for each set up. The aim of the study was to determine the magnitude of any errors in the Eclipse dose calculation beyond large air gaps. 4.1 Materials Two phantom arrangements were used to investigate the dose beyond air gaps. A water phantom was used to obtain relative depth dose data beyond the air gaps for each set up and a solid water slab phantom was used to measure the absolute dose at a specified depth beyond the air gap for each set up for 100 MUs. The absolute dose measurements were used to normalise the relative data. An illustration of the experimental set ups for the two phantoms can be seen in Figure 4.2. For both phantoms, the thickness of the RW3 water equivalent slabs and the air gap could be varied. Page 97 of 169

98 (a) (b) Figure 4.2 Illustration of the experimental set up for the air gap experiments for the water phantom (a) and the water equivalent slab phantom (b) Water Phantom and Parallel Plate Ionisation Chamber To obtain ionisation data as a function of depth in water behind an air gap, a Type 2001 water tank, manufactured by Wellhöfer Dosimetrie (Scanditronix Wellhöfer, Germany), was used (see Figure 4.3). The outer dimensions of the water tank were 675 x 645 x 560 mm 3 (L x W x H) and held approximately 200 litres of water. It has a motorised carriage that can drive an attached dosimeter to a desired x, y, z position with an accuracy of ±0.5 mm. During measurements, the ionisation chamber is attached to a software controlled CU500E microprocessor control unit which has a built in dual channel electrometer with reversible polarity and auto-ranging. The Wellhöfer OmniPro-Accept (Version Page 98 of 169

99 6.4) software controlled the ionisation dosimeter position and recorded the measurements obtained. Figure 4.3 Wellhöfer blue water phantom ( Wellhöfer.com/fileadmin/pdf/products/Relative_Dosimetry/Blue_Phantom.pdf) To create an air gap above the water surface, two Perspex strips, positioned approximately 25 cm apart, with their ends attached to opposite sides of the water tank, were used to support RW3 water equivalent slabs above the water surface. The water equivalent RW3 slabs are illustrated in Figure 3.2 (page 65). An NACP01 parallel plate ionisation chamber (Scanditronix Wellhöfer, Germany) was used to conduct the experimental depth dose measurements in the Wellhöfer water tank. It has a graphite window 0.5 mm thick, an electrode spacing of 2 mm, a collecting electrode diameter of 10 mm and a guard ring width of 3 mm. It is encased in a PMMA waterproof housing which has a 0.1 mm thick Mylar window in front of the entrance window of the chamber. The NACP01 Page 99 of 169
100 chamber complies with the recommendations for relative dosimetry measurements of photon beams (IAEA TRS ). The effective point of measurement was taken to be on the inner surface of the entrance window (IAEA TRS ) and a correction for this was applied during the set up. Measurements were conducted in the continuous scanning mode with the bias set to -300 V. The scans began at a depth of at least 15 cm in the water phantom and scanned towards the water surface to reduce the influence of meniscus formation when the detector is close to the water surface (IAEA TRS ). While parallel plate ionisation chambers are recommended for depth ionisation curves in high energy photon beams due to (i) their good resolution in the direction parallel to the radiation beam axis and (ii) their well defined effective point of measurement (IAEA TRS , IAEA TRS ), it should be noted that several papers have reported an over response of parallel plate chambers in the build up region (Velkley et al 1975, Nilsson and Montelius 1986, Gerbi and Khan 1990, Rawlinson et al 1992). The magnitude of the over response decreases as the depth approaches the depth of dose maximum (Velkley et al 1975). Velkley et al (1975) proposed a method to correct parallel plate chamber measurements in the build up region. However Nilsson and Montelius (1986) and Gerbi and Khan (1990) found that the technique could lead to significant errors. Rawlinson et al (1992) proposed guidelines for assessing a parallel plate chamber s suitability for build up region measurements in high energy photon beams, based on the wall diameter and electrode spacing of the chamber. Using this method it was estimated that the NACP01 chamber would overestimate the dose at the surface by approximately 3%. But it was noted that this (and all other published correction methods) do not apply under situations of extreme electron contamination (Rawlinson et al 1992). Page 100 of 169
101 As no simple or accurate correction method for dose measurements with parallel plate chambers in the build up region has been developed (IAEA TRS ) and it is expected that there would be significant electron contamination from the material present before the air gap, resulting in the published methods being not applicable, no corrections were applied to the results in the build up region when using the NACP01 chamber throughout this study. The overestimation of dose predicted is not expected to obscure the major features observed in this study. Extrapolation chambers are the preferred device for measuring dose in the build up region (Velkley et al 1975, Gerbi and Khan 1990, IAEA TRS , IAEA TRS ) however one was not available for use in these experiments Water Equivalent Slab Phantom and Cylindrical Ion Chamber The slab phantom was used to obtain an absolute dose measurement for each experimental set up. The slab phantom was the same as was used in the investigation into the dose beyond immobilisation devices. It consisted of CTG solid water slabs (see Figure 3.1 (page 65)) and RW3 water equivalent slabs (see Figure 3.2 (page 65)) stacked to create a phantom with dimensions 12 x 30 x 30 cm 3 as described in Section A schematic diagram of the slab phantom is shown in Figure 3.3 (page 66). The centre of the ionisation chamber cavity was located at a depth of 5 cm. To create an air gap, RW3 water equivalent slabs were supported above the slab phantom using expanded polystyrene foam blocks at the edge of the phantom. The dosimetry system used with the slab phantom was the NE Technology Ltd, model 2571 Farmer type cylindrical ionisation chamber and Keithley electrometer with the bias set to -300 V, as described in Section The Page 101 of 169
102 reference point of the chamber (central axis at the centre of the cavity volume) was set to the measurement depth (IAEA TRS ) Transmission Measurements The NE2571 cylindrical ionisation chamber and Keithley electrometer for the slab phantom measurements were also used to measure transmission through various thicknesses of RW3 slabs. 4.2 Methods Depth Dose beyond Air Gaps Experimental Set Up The experimental set ups investigated were for air gaps of 1, 3, 5, 8, 10, 12.5 and 15 cm thickness before the surface of the lower section of the phantom produced by 0.2, 0.5, 1, 2, 3 and 4 cm thickness of water equivalent material placed above the air gap. Air gaps of up to 15 cm were investigated as the thickness of the air gap between the treatment couch/base of the breast board and the tilted back support region of the breast board are typically cm for breast treatments utilising posterior axilla fields. Air gaps of small thickness were also investigated to identify any trends with increasing air gap thickness and for comparison with previously published studies. Measurements were conducted with up to several centimetres of water equivalent material before the air gap to simulate the various situations which may occur. With an example of an extreme case being where a posterior field through the breast board may pass through a solid or supporting section of the Page 102 of 169
103 treatment couch and the solid base section of the breast board before passing through a large air gap, through the back support of the breast board and then entering the patient. As the width and length dimensions of the air gap created by the breast board are much larger than the typical field sizes used for posterior axilla fields during breast treatments (typical size is an equivalent square of side 7-12 cm), slab air gaps larger than the field size were used throughout these experiments Calculating the Dose using Eclipse (Treatment Planning) Phantom CT sets were created in the Eclipse TPS to simulate each set up. This was done by creating a three dimensional rectangular structure to simulate the water tank and creating slabs at various distances above the surface of the water tank structure. The density of both of the sections of the phantom was set to be the density of water (Hounsfield unit equal to 0). Hounsfield units are based on the attenuation coefficient of the material and are normalised such that the Hounsfield unit for water equals 0 (Khan 2003). A plan was then created for each set up with one 6 MV photon beam produced by a Varian CLINAC 600 radiotherapy LINAC. The field size was 10 x 10 cm 2 defined at the isocentre (100 cm from source) which was set at the surface of the phantom on the distal side of the air gap. The plan was created so that 100 MUs were delivered for the field. The dose calculation parameters in Eclipse were as described in Section 3.2. The Eclipse TPS was used to calculate central axis depth dose data (40 data points per cm) for each plan. The data was then exported to a Microsoft Excel spreadsheet for analysis. Page 103 of 169
104 Experimental Measurements (Treatment Delivery) Depth dose measurements were taken for each of the planned set ups using the Wellhöfer water phantom with the NACP01 parallel plate ionisation chamber. Measurements were obtained to a depth of at least 15 cm beyond the surface of the water phantom. The resultant data were smoothed to remove noise from the readings using the least squares algorithm in the OmniPro-Accept software and then exported into a Microsoft Excel spreadsheet for analysis. The Wellhöfer system measured 50 data points per centimetre. For each set up, the dose for 100 MUs to 5 cm depth beyond the air gap was measured in the slab phantom using the NE2571 cylindrical ionisation chamber. The relative depth dose data was then normalised so the dose at 5 cm depth equalled the measured dose in each case. The measured and Eclipse calculated depth dose data were then compared, with particular attention paid to the depth of dose maximum for each set up Transmission Measurements To determine what proportion of the dose was the result of the primary beam, transmission measurements were obtained through water equivalent RW3 slabs under narrow and broad beam geometry conditions. Narrow beam geometry refers to an experimental set up where the beam is as small as possible but just large enough to cover the detector. The ionisation chamber is placed sufficiently far away from the attenuator to ensure that scattered photons reaching the detector are minimal and the measured beam is comprised only of the remaining primary (i.e. non-scattered) photons. When broad beam geometry is used, primary and scattered photons may reach the Page 104 of 169

105 detector. The difference between narrow and broad beam geometry is illustrated in Figure 4.4. Figure 4.4 Narrow and broad beam geometry (Bushberg et al 2002). The measurements were obtained with the LINAC gantry set to 180 o and the RW3 slabs placed on the collimator housing to attenuate the beam. Using a retort stand on the raised treatment couch, the cylindrical NE2571 ionisation chamber was positioned at 165 cm from the radiation source on the central axis of the beam. A 6 MV 1.5 cm thick Perspex build up cap was placed on the ionisation chamber to ensure complete electronic equilibrium for the measurement. The experimental set up is illustrated in Figure 4.5. For the narrow beam set up, the field size was selected to just cover the ionisation chamber and build up cap (5 x 4 cm 2 field size defined at the isocentre). For the broad beam configuration a 10 x 10 cm 2 field was set at the isocentre. A fixed number of MUs (200) were delivered through varying thickness of RW3 slabs (0-20 cm) and the reading on the Keithley electrometer with the bias voltage set to -300 V recorded. Page 105 of 169

106 Figure 4.5 Experimental set up for the transmission measurements. A transmission factor was determined for each thickness of water equivalent slabs using Equation 4.1. f x, a, b = M M x, a, b 0, a, b Equation 4.1 Where M x,a,b is the measurement of dose obtained with x cm of water equivalent material in the beam path for field size a x b, and M 0,a,b is the measurement obtained for the open set up (i.e. with no attenuating material present). The results were transferred into Microsoft Excel, a graph created and a best fit exponential trend line calculated. Based on the equation obtained for the trend line, the linear attenuation coefficient was found using Equation 4.2. Page 106 of 169
107 μ a, b M ln M = x Equation 4.2 x, a, b 0, a, b Where μ a,b is the linear attenuation coefficient. Equation 4.2 is based on Equation 4.3 (Bushberg et al 2002). N = N o e μx Equation 4.3 Where N o is the number of photons incident on the attenuating material, N is the number of photons transmitted through a thickness of material x without interaction and μ is the linear attenuation coefficient. Equation 4.3 is valid for a mono-energetic beam of photons. Applying the measured results to this equation is based on the assumption that the attenuation coefficient for the RW3 slabs does not change markedly for megavoltage photons with absorber thickness over the range of thickness measured. Only the results for up to 14 cm (approximately the first half value layer) were used to determine the attenuation coefficient to minimise any affect of its value changing with absorber thickness Scatter Analysis The dose due to scatter from the water equivalent material before the air gap to the point of measurement for a given thickness of water equivalent material (x), thickness of air (t) and field size (a x b) at a specified depth (d) beyond the air gap is D x,t,d,a,b,scatter. This was calculated by subtracting the primary dose Page 107 of 169
108 component of the beam from the total measured dose for the range of air gaps set up using Equation 4.4. x, t, d, a, b, scatter x, t, d, a, b μa bx ( D e ), D = D Equation 4.4 0,0, d, a, b Where the measured dose beyond the air gap for the set up is D x,t,d,a,b and the primary dose component remaining after the beam has been attenuated by the RW3 slabs is the product of D 0,0,d,a,b and μa, b e x. Where D 0,0,d,a,b is the measured dose for the open set up (0 cm thickness of water equivalent slabs above a 0 cm thickness air gap) and μ a,b is the attenuation coefficient determined for field size a x b. For the calculation the narrow beam attenuation coefficient determined for the smallest possible field size was used. Page 108 of 169
109 4.3 Results Errors and Uncertainties The uncertainty of the experimental measurements of the dose beyond an air gap using the combination of the results from the slab and water phantoms with an ionisation chamber was estimated to have a 95% confidence interval of ±2% using the method described by Gregory et al (2005). The uncertainty in the calculation of the dose due to scatter from the water equivalent material before the air gap based on the experimental measurements was estimated to be ±2.5%. Based on the documentation describing the accuracy of the Eclipse TPS PBC algorithm (Varian Medical Systems 2003b), the uncertainty in the dose calculations was estimated to be 2.5% (by averaging the quoted uncertainty for a typical clinical set up of 2-3%) Depth Dose Data A representative set of depth dose data (for 0.5, 2.0 and 4.0 cm thickness of water equivalent slabs positioned before 1, 5, 10 and 15 cm air gaps) are shown in Figure 4.6, Figure 4.7 and Figure 4.8. Data to a depth of 5 cm is shown where the 0 depth position is at the surface of the water phantom, on the distal side of the air gap. The measured and Eclipse calculated data are shown on the same graph. For a given thickness of water equivalent material before the air gap, Eclipse calculated the dose behind the air gap to be equivalent for each air gap size. Thus, only one curve is shown for the Eclipse calculated data and is labelled, for example 0.5 W x cm Air (Eclipse) for 0.5 cm of water equivalent material for an air gap of thickness x cm. All of the results are for a 6 MV beam Page 109 of 169
110 with a 10 x 10 cm 2 field set at the surface of the water phantom which was positioned 100 cm from the radiation source. Table 4.1, Table 4.2 and Table 4.3 show the measured dose for the depths of 0, 1, 5, 10, and 15 cm beyond the air gap for 0.5, 2.0 and 4.0 cm of water equivalent material before the air gap respectively. The percentage difference of the measured dose from the Eclipse calculated results is also shown. The measured and Eclipse calculated data to a depth of 5 cm for all combinations of air gap and water equivalent slabs before the air gap thickness is presented in Appendix 7.3. Data was collected to a depth of 15 cm but the data to a reduced depth is shown in the graphs so the significant effects can be observed. Page 110 of 169
111 110 Depth Dose beyond Air Gap 0.5 cm Water Equivalent Slabs before Air Gap Dose (cgy) W xcm Air (Eclipse) 0.5 W 1 Air (Measured) 0.5 W 5 Air (Measured) 0.5 W 10 Air (Measured) 0.5 W 15 Air (Measured) Depth (cm) Figure 4.6 Measured and Eclipse depth dose data beyond various air gaps for 0.5 cm water equivalent material before the air gap. The uncertainty for the measured dose is estimated to be ±2% and for the calculated dose ±2.5%. 0.5 cm Water Equivalent Material before Air Gap Air Gap (cm) Depth (cm) Dose (cgy) % Diff Dose (cgy) % Diff Dose (cgy) % Diff Dose (cgy) % Diff Table 4.1 Measured depth dose data and percentage variation of measured depth dose data from Eclipse calculated results beyond various air gaps for 0.5 cm water equivalent material before the air gap. The uncertainty for the measured dose is estimated to be ±2% and for the calculated dose ±2.5%. Page 111 of 169
112 110 Depth Dose beyond Air Gap 2.0 cm Water Equivalent Slabs before Air Gap Dose (cgy) W xcm Air (Eclipse) 2 W 1 Air (Measured) 2 W 5 Air (Measured) 2 W 10 Air (Measured) 2 W 15 Air (Measured) Depth (cm) Figure 4.7 Measured and Eclipse depth dose data beyond various air gaps for 2.0 cm water equivalent material before the air gap. The uncertainty for the measured dose is estimated to be ±2% and for the calculated dose ±2.5%. 2.0 cm Water Equivalent Material before Air Gap Air Gap (cm) Depth (cm) Dose (cgy) % Diff Dose (cgy) % Diff Dose (cgy) % Diff Dose (cgy) % Diff Table 4.2 Measured depth dose data and percentage variation of measured depth dose data from Eclipse calculated results beyond various air gaps for 2.0 cm water equivalent material before the air gap. The uncertainty for the measured dose is estimated to be ±2% and for the calculated dose ±2.5%. Page 112 of 169
113 110 Depth Dose beyond Air Gap 4.0 cm Water Equivalent Material before Air Gap Dose (cgy) W xcm Air (Eclipse) 4 W 1 Air (Measured) 4 W 5 Air (Measured) 4 W 10 Air (Measured) 4 W 15 Air (Measured) Depth (cm) Figure 4.8 Measured and Eclipse depth dose data beyond various air gaps for 4.0 cm water equivalent material before the air gap. The uncertainty for the measured dose is estimated to be ±2% and for the calculated dose ±2.5%. 4.0 cm Water Equivalent Material before Air Gap Air Gap (cm) Depth (cm) Dose (cgy) % Diff Dose (cgy) % Diff Dose (cgy) % Diff Dose (cgy) % Diff Table 4.3 Measured depth dose data and percentage variation of measured depth dose data from Eclipse calculated results beyond various air gaps for 4.0 cm water equivalent material before the air gap. The uncertainty for the measured dose is estimated to be ±2% and for the calculated dose ±2.5%. Page 113 of 169
114 Depth of Dose Maximum The depth of the dose maximum determined experimentally and calculated by Eclipse for the various set ups are shown in Table 4.4 and Table 4.5. Material before Air Gap (cm) Air Gap (cm) Table 4.4 Depth of dose maximum (cm) determined experimentally. The depth of dose maximum measured for an open field was 1.34 cm. The uncertainty is estimated to be ±0.2 cm. Material before Air Gap (cm) Air Gap (cm) Table 4.5 Depth of dose maximum (cm) calculated by Eclipse. The depth of dose maximum calculated by Eclipse for an open field was 1.32 cm. Page 114 of 169
115 4.3.3 Transmission Results The results for the attenuation measurements through the RW3 water equivalent slabs are shown in Appendix 7.4. A good fit was obtained using an exponential curve (R 2 =0.9998) for both the narrow beam and 10 x 10 cm 2 field size set ups. The attenuation coefficient obtained was similar for both the narrow beam and 10 x 10 cm 2 field size cases, being and respectively. The narrow beam results were used during the scatter analysis in the following section Scatter Analysis The results of the scatter analysis show the dose due to scattered radiation created by the water equivalent material before the air gap reaching beyond the air gap. The results to a depth of 2 cm for 0.5, 2.0 and 4.0 cm material before the air gap for 1, 5, 10 and 15 cm air gaps are shown in Figure 4.9, Figure 4.10 and Figure The results for all the set ups to a depth of 5 cm can be found in Appendix 7.5. Page 115 of 169
116 50 Dose from Scatter created by Water Equivalent Slabs 0.5 cm Water Equivalent Slabs before Air Gap Dose from Scatter (cgy) W 1 Air 0.5 W 5 Air 0.5 W 10 Air 0.5 W 15 Air Depth (cm) Figure 4.9 The total dose due to scatter from the 0.5 cm water equivalent material before the air gap. The uncertainty in the dose calculation is estimated to be ±2.5%. 50 Dose from Scatter created by Water Equivalent Slabs 2.0 cm Water Equivalent Slabs before Air Gap Dose from Scatter (cgy) W 1 Air 2 W 5 Air 2 W 10 Air 2 W 15 Air Depth (cm) Figure 4.10 The total dose due to scatter from the 2.0 cm water equivalent material before the air gap. The uncertainty in the dose calculation is estimated to be ±2.5%. Page 116 of 169
117 50 Dose from Scatter created by Water Equivalent Slabs 4.0 cm Water Equivalent Slabs before Air Gap Dose from Scatter (cgy) W 1 Air 4 W 5 Air 4 W 10 Air 4 W 15 Air Depth (cm) Figure 4.11 The total dose due to scatter from the 4.0 cm water equivalent material before the air gap. The uncertainty in the dose calculation is estimated to be ±2.5%. 4.4 Discussion Surface Dose and Dose in the Build Up Region It can be seen in Figure 4.6, Figure 4.7 and Figure 4.8 that for a given thickness of water equivalent material before the air gap, as the size of the air gap increases, the dose measured beyond the air gap decreases. For 0.5 cm of material before the air gap, where electronic equilibrium is not established in the material before the air gap, Figure 4.6 shows that for all air gaps there is a region of dose build up beyond the air gap. In Figure 4.7 and Figure 4.8, it can also be seen that there is a secondary region of dose build up beyond the air gap for air gaps greater than 1 cm thickness even when electronic equilibrium is established in the material before the air gap. The reduction in dose beyond the air gap is due to a reduction in scattered radiation, created in the material before the air gap, reaching the measurement Page 117 of 169
118 point beyond the air gap. This occurs as some of the scattered radiation produced in the material before the air gap which would have reached the measurement point if no air gap was present, is now scattered away from the measurement point. The amount of scattered radiation that is lost in this manner increases with increasing air gap thickness, as the distance between the source of the scattered radiation and the measurement point increases. This is visible in the results of the scatter analysis shown in Figure 4.9, Figure 4.10 and Figure When the radiation enters the air gap, the amount of scattered radiation produced reduces and the range of the scattered electrons and photons increases. These changes result in the loss of electronic equilibrium (if present). When the beam enters the phantom beyond the air gap, a secondary build up region is required to re-establish electronic equilibrium within the material beyond the air gap. Eclipse does not predict the presence of a secondary build up region as the ETAR inhomogeneity correction method does not account for situations of electronic disequilibrium or changes in electron transport with inhomogeneities. In the 2 cm water equivalent material before a 1 cm air gap set up (Figure 4.7), the dose at the surface is larger than the dose for the 0.5 and 4 cm material before a 1 cm air gap (Figure 4.6 and Figure 4.8). This is due to the SSD of the set up changing with the thickness of water equivalent material and air gap before the water phantom (which was set at 100 cm from the source). Depth dose data is dependent on SSD which results in the higher dose at the surface for the 2 cm material before the air gap set up (Metcalfe et al 1997). In the measured depth dose data presented, the dose near the surface (at depths of cm) appears to increase at the surface compared to a line which would be extrapolated to the surface from depths of ~1.0 cm. This is particularly apparent in the first 0.1 cm of data. This is attributed to the Page 118 of 169
119 overestimation of dose in the build up region by fixed separation parallel plate chambers which was not accounted for in the data (Velkley et al 1975, Nilsson and Montelius 1986, Gerbi and Khan 1990, Rawlinson et al 1992, IAEA TRS ). This effect may also be due to the effective point of measurement for the NACP01 parallel plate ionisation chamber being 0.6mm beyond the surface of the ion chamber, i.e. on the inner surface of the entrance window (IAEA TRS ). When the chamber is positioned at depths less than 0.6mm, part of the chamber is above the water surface. The build up of electron fluence will therefore start above the water surface within the entrance window and result in a higher than expected value at the surface being measured when compared to a surface dose obtained by extrapolation. The thickness of material present in which a build up of electron fluence can occur is constant for depths less than 0.6mm resulting in an approximately constant ionisation reading in this region. It is also possible that this effect may be partially due the presence of a small amount of water remaining on the chamber (due to surface tension of the water) when taking the reading even though the position of the chamber surface was above the water surface. Due to the small nature of these affects, they do not obscure the trends observed in this study. In Figure 4.6, the sharp points visible in the Eclipse depth dose data were attributed to the first stage of the dose calculation process only calculating the dose in five planes perpendicular to the beam and interpolating the results to obtain the dose for the other points. This effect is only noticeable for Eclipse depth dose data where a build up region is predicted as where no build up region is predicted the results are close to being a straight line. A build up region is predicted by Eclipse for set ups where the material before the air gap is less than or equal to 1 cm (see results in Appendix 7.3). The surface dose results obtained in this study are consistent with those obtained by Wong et al (1992), Shahine et al (1999) and Li et al (2000). A comparison of the percentage error in surface dose calculation beyond air gaps Page 119 of 169
120 (using the ETAR inhomogeneity correction) from Wong et al (1992) to the results obtained in this study is shown in Table 4.6. The decrease in surface dose with increasing air gap thickness can be seen in both sets of results, which was not accounted for by the dose calculation algorithms. The experiments by Wong et al (1992) were conducted using a Markus chamber, which, due to its smaller wall diameter, would be expected to exhibit a larger over-response in the build up region when compared to a NACP01 chamber (Rawlinson et al 1992). The largest air gap thickness investigated by Wong et al (1992) was 4 cm resulting in a limited application of the results. The current study has extended the results available to air gaps of up to 15 cm thick resulting in more flexible applications. Percentage Error in Surface Dose Air Gap Thickness (cm) Wong et al (1992) Current Study Table 4.6 Comparison of surface dose results for 4 cm water equivalent material before various air gaps (6 MV, 10 x 10 cm 2 field size, 100 cm SSD). The presence of a secondary build up region behind an air gap is consistent with the results of previous studies investigating the dose behind slab air gaps (Wong et al 1992, Shahine et al 1999, Li et al 2000, Ding et al 2004). The magnitude of the error in the dose calculation at the surface of the phantom beyond the air gap observed in this study is large (up to 35.2%). Errors in the dose calculation of this magnitude are not in accordance with the Page 120 of 169
121 recommendation of the ICRU that the absorbed dose to the target volume should be delivered to an accuracy of 5% or better (ICRU Report ). When the Eclipse dose calculation algorithm is used with the ETAR inhomogeneity correction method, a significantly lower dose than expected may be delivered to a surface beyond a large air gap. While this may be desirable if the target volume is not near the surface beyond the air gap, if the target volume is near the surface, an unacceptable reduction in dose may result Depth of Dose Maximum The depth of the dose maximum determined experimentally and calculated by Eclipse for the various set ups are shown in Table 4.4 and Table 4.5. Two trends can be seen in the measured results shown in Table 4.4: (i) when the thickness of the air gap increases, the depth of dose maximum increases towards that for an open beam (i.e. no attenuating material present); and (ii) when the thickness of material before the air gap increases, the depth of dose maximum moves towards the surface. Based on the scatter analysis (Figure 4.9, Figure 4.10 and Figure 4.11), as the thickness of the air gap increases, scatter created by the material before the air gap reaching the surface of the phantom beyond the air gap decreases. As the amount of scattered radiation reaching the distal side of the air gap decreases, more depth is required to reach electronic equilibrium so the depth of dose maximum is further away from the surface (see Table 4.4). As the air gap thickness increases, the loss of scattered radiation results in relative depth dose data beyond the air gap which is comparable to that for an open beam, with a similar depth of dose maximum, but with the magnitude of the dose measured reduced due to attenuation of the beam. Page 121 of 169
122 For a given air gap, as the thickness of water equivalent material before the air gap increases, the depth of dose maximum moves towards the surface (Table 4.4). The results are consistent with the partial establishment of electronic equilibrium (for the cm cases) and the establishment of electronic equilibrium (for the 2.0+ cm cases) in the material before the air gap and electrons produced depositing dose on the distal side of the air gap. The measured depths of dose maximum from this study are comparable to those obtained by Wong et al (1992). A comparison of the results is shown in Table 4.7. Depth of Dose Maximum (cm) Air Gap Thickness (cm) Wong et al (1992) Current Study Table 4.7 Comparison of surface dose results for 4 cm water equivalent material before various air gaps (6 MV, 10 x 10 cm 2 field size, 100 cm SSD Dose beyond the Depth of Dose Maximum For a larger thickness of material before the air gap (e.g. 2.0 cm and 4.0 cm) as the air gap increases, the reduction in dose behind the air gap continues beyond the re-establishment of electronic equilibrium (see Figure 4.7 and Figure 4.8). This is due to a reduction in scattered radiation reaching the measurement point. This effect increases with increasing air gap thickness as shown in the results of Page 122 of 169
123 the scatter analysis in Figure 4.10 and Figure Eclipse does not account for situations of electron disequilibrium or changes in electron transport with inhomogeneities. There are also limitations in the equivalent tissue air ratio inhomogeneity correction method when accounting for scattered photons. As a result, Eclipse does not model the loss of scatter and hence the depth dose data calculated for all air gaps are similar to the dose for no air gap and the continuing reduction in dose is not predicted. This dose calculation error can result in under-dosing the patient due to Eclipse overestimating the dose. In Figure 4.9, Figure 4.10 and Figure 4.11, it can also be seen that at depths beyond dose maximum, the amount of dose from scattered radiation increases with increasing thickness of the material before the air gap. The failure of the ETAR inhomogeneity correction method to model the reduction of dose with depth after a large gap was noted by Wong et al (1992), attributing the discrepancy to scaling assumptions in the ETAR method. The results were observed for 4 cm water equivalent material before a 4 cm slab air gap measured to a depth of ~3 cm behind the air gap where the ETAR method overestimated the dose by ~2.8% (6 MV, 5 x 5 cm 2 field size). The result measured by Wong et al (1992) is comparable to the current 4 cm water equivalent material before a 5 cm slab air gap where the ETAR method overestimated the dose by 2.7% at a depth of 3 cm (see results in Appendix 7.3). The largest air gap investigated by Wong et al (1992) was 4 cm. The set up was considered an extreme case of an internal body cavity and the results were not investigated further. Page 123 of 169
124 Munjal et al (2006) investigated the ability of the PLATO-SUNRISE TPS to calculate the dose for a field passing through a 12 mm PMMA board then an ~8 cm air gap (perpendicular incidence). The results were compared to the measured dose at the centre of a homogeneous phantom (~9 cm depth for perpendicular incidence). When the TPS included the board and air gap in the dose calculation, the TPS overestimated the dose by up to 1.5% (6 MV, 10 x 10 cm 2 field size). This result is comparable to the result obtained for the 1 cm water equivalent material before a 10 cm air gap and a measurement depth of 10 cm where Eclipse overestimated the dose by 1.8%. Based on these results, the overestimation of the dose by the TPS in the study by Munjal et al (2006) could be accounted for by the presence of the air gap between the PMMA board and the phantom. As this reduction in dose at depth is apparent for 1-2 cm thickness of solid water before the air gap, significant effects on treatment plans could result, for example, when a posterior axilla field passes through the treatment couch and then the ~1.0 cm solid carbon fibre base support of the breast board before passing through a large air gap. Based on a set up with 2 cm water equivalent material before the air gap, a 10 cm air gap and a depth of 10 cm in the patient, Eclipse would overestimate the dose by 2.9% which exceeds the clinical tolerance of 2.5% (see Table 4.2). A significant dose reduction at depths beyond the dose maximum behind the air gap has been observed. The magnitude of the error in the dose calculation at depths beyond the depth of dose maximum were not within the desired accuracy for the planning stage of better than 2.5% (Van Dyk 1999) for a large proportion of the experimental set ups. Generally, if the thickness of water equivalent material before the air gap was larger than 2.0 cm and the air gap larger than 5 cm the error in the dose calculation was not within tolerance levels to a depth of 10 to 15 cm beyond the air gap. Page 124 of 169
125 4.5 Conclusions The study confirmed that the ETAR method of inhomogeneity correction results in significant errors in dose calculation beyond air gaps. The method does not account for the loss of electronic equilibrium which occurs due to the air gap and as a result overestimates the dose beyond it. The results of the air gap investigation agree with the results of previous studies (Wong et al 1992, Shahine et al 1999, Li et al 2000, Ding et al 2004). The current study has extended the data from previous studies for air gaps up to 15 cm thick and to depths of up to 15 cm beyond the air gap. When the Eclipse dose calculation algorithm is used with the ETAR inhomogeneity correction method, a significantly lower dose than expected may be delivered to a surface beyond a large air gap and to target volumes at depths of up to 15 cm beyond a large air gap. The results of the current study may be used to apply a correction factor to the Eclipse calculated dose beyond air gaps. Page 125 of 169
126 5 Discussion of Combined Results and Conclusions 5.1 Summary of Results The results of the investigation into the dosimetric effects of immobilisation devices showed that large errors may occur when the physical characteristics of these devices are not included in the body structure and hence not in the Eclipse dose calculation. The attenuating properties of the immobilisation devices should not be ignored. The largest discrepancy between the Eclipse calculation and the measurements was obtained when a field passed through the solid carbon fibre base, an air gap and then the carbon fibre composite back support region of the breast board. For this case, Eclipse was found to overestimate the dose by up to 8.4% when the breast board was not included in the dose calculation (6 MV, 5 x 5 cm 2 field size, slab phantom). When the immobilisation devices were included in the body structure, all of the measurements were within 2.5% of the Eclipse calculated dose. Thus the results were all within the dose tolerances recommended by the ICRU (ICRU Report ) and other published studies describing the tolerances for the accuracy of dose calculations by a TPS (Van Dyk et al 1993, Fraas et al 1998, Venselaar et al 2001). The results were also consistent with 2-3% accuracy specified by Eclipse for the PBC algorithm (Varian Medical Systems 2003b). The results of the air gap investigation agree with the results of previous studies for small air cavities (Wong et al 1992, Shahine et al 1999, Li et al 2000, Ding et al 2004) where a secondary region of dose build up beyond small air gaps was observed. This secondary dose build up region is not predicted when the Eclipse PBC algorithm with the ETAR method of inhomogeneity correction is used to calculate the dose beyond an air gap for a 6 MV beam. Page 126 of 169
127 It was found that for a given thickness of water equivalent material located before the air gap, that as the size of the air gap increases, the dose measured beyond the air gap decreases (see Figure 4.6, Figure 4.7 and Figure 4.8). The measured depth of the dose maximum beyond the air gap also increases as the size of the air gap increases (see Table 4.4). It was also found that for a given air gap thickness, that as the thickness of water equivalent material before the air gap increases, the depth of dose maximum moves towards the surface (see Table 4.4). Eclipse does not predict these effects and overestimates the dose in the build up region. When there is a large thickness of water equivalent material located before the air gap (e.g. 2.0 cm or 4.0 cm (Figure 4.7 and Figure 4.8)), as the air gap increases, the overestimation of dose by Eclipse continues beyond the build up region. For the 2 cm material located before a 15 cm air gap case, Eclipse over-predicted the dose by 34% at the surface of the water phantom and by 3%, 3% and 2% at depths of 5, 10 and 15 cm respectively (Table 4.2). 5.2 Discussion of Combined Results The results of the air gap investigation can be used to interpret the results of the investigation into the dose behind immobilisation devices when air gaps were present Slab Phantom with Ionisation Chamber The fields through the breast board on the water equivalent slab phantom passed through the carbon fibre/foam composite shoulder support before passing through an ~8.5 cm air gap then the solid carbon fibre base support. Eclipse overestimated the dose by 1.3%, 1.5% and 0.6% for the 5 x 5 cm 2, 10 x 10 cm 2 Page 127 of 169
128 and 20 x 20 cm 2 fields respectively. Based on the results closest to this scenario, of 0.2 cm water equivalent material before the air gap and an 8 cm air gap (see Appendix 7.3), it is expected that Eclipse would overestimate the dose by 0.4% for a 10 x 10 cm 2 field. This magnitude of error would be difficult to detect considering the experimental uncertainty, however, the larger error for the smaller field sizes is consistent with the results of Wong et al (1992) and Li et al (2000), who observed that the dose reduction behind the air cavity increased as the field size reduced RANDO Phantom with TLDs Breast board Point 1 was located ~7.0 cm beyond the surface of the RANDO phantom, within a laterally located field where only half of the field passed through the solid carbon fibre base (~1.0 cm) and the carbon fibre composite back support regions of the breast board. Point 1 was within the part of the field which passed through the base, then a ~6.5 cm air gap, then the back support. For this complex situation, when the breast board was included in the body structure, the measured dose was 0.5% above the Eclipse calculated dose. The air gap set up investigated which is most similar to this situation is the 1 cm water equivalent material before a 5 cm air gap. Based on those results, the measured results for a depth of 7 cm are expected to be ~1.3% below the Eclipse calculated result (see Appendix 7.3 for results). The measured result is consistent with the expected result from Eclipse considering the 2% uncertainty in the TLD measurement. Breast board Point 3 was located ~3.0 cm beyond the surface of the phantom, within a centrally located field where the entire field passed through the base, then an ~8.5 cm air gap, then the back support of the breast board before entering the RANDO phantom. When the breast board was included in the body structure, the result measured with the TLDs was 2.5% below the Eclipse Page 128 of 169
129 calculated result. This is consistent with the results for the 1 cm water equivalent material before the air gap, 8 cm air gap, at 3 cm depth result where the measured result was 2.2% below the Eclipse calculated result (see Appendix 7.3 for results). Despite the inaccuracies in the dose calculation behind air gaps due to the deficiencies in the algorithm, the results obtained when the device and air gap were included in the dose calculation are more accurate than when the device was not included. 5.3 Conclusions The current studies have investigated the ability of the Eclipse TPS (PBC algorithm, ETAR inhomogeneity correction) to calculate the dose beyond complex immobilisation devices and air gaps. With the increased use of conformal and IMRT techniques, treatments with many gantry angle settings are common and it is not unusual for treatment fields to pass through the treatment couch or immobilisation devices used. While immobilisation devices and treatment couches are typically designed to have minimal affect on the radiation beam, it is not always possible to obtain the strength and rigidity required with perfectly radio-translucent materials. Even low density materials may significantly alter the beam properties. Reported effects of treatment couches and immobilisation devices include an increase in surface dose and beam attenuation. Transmission factors can be used to account for attenuation in uniform devices but do not account for the increase in surface dose. To account for attenuation of non-uniform thickness and density devices, the immobilisation devices and treatment couch may be modelled in the TPS. Page 129 of 169
130 It was found that not including objects external to the patient in the dose calculation (such as the treatment couch or immobilisation devices) can result in significant errors (up to 8.4%) in the dose calculation. Typically the errors would result in under-dosing the patient due to the dose calculation not accounting for attenuation by the external object(s). By including the external objects in the dose calculation, the errors can be reduced to within the clinical tolerance of 2.5%. Large air gaps are created by some immobilisation devices which may result in dose calculation errors larger than the clinical tolerance. A reduction in dose beyond the air gap occurs that is particularly significant near air/tissue interfaces. For a large thickness of material before the air gap and large air gaps, the reduction in dose beyond the air cavity can continue to a depth of 15 cm. The reduction in dose beyond the air gap is due to a reduction in scattered radiation reaching the measurement point. Eclipse does not predict this as it does not account for situations of electron disequilibrium or changes in electron transport with inhomogeneities and due to limitations in the equivalent tissue air ratio inhomogeneity correction method when accounting for scattered photons. This dose calculation error can result in under-dosing the patient due to Eclipse overestimating the dose. The current study has extended the range of air gaps investigated from 5 cm to 15 cm. The depth beyond the air gap investigated has also been extended from 4 cm to 15 cm. The broad range of data obtained may be used to apply corrections to the dose calculation by Eclipse when an air gap is present. 5.4 Areas Requiring Further Study If an immobilisation device and/or treatment couch is included in the dose calculation, the reproducibility of the position of the patient relative to the Page 130 of 169
131 immobilisation device and treatment couch needs to be confirmed. Previous studies, such as those reviewed by Verhey (1995) have determined the ability of immobilising systems to reposition skeletal anatomy. Verhey (1995) noted that the results may not translate to the ability of the system to reposition the target volume. The results may also not translate to the ability of the system to reposition the patient relative to the immobilisation device and treatment couch. No studies have been found describing the set up reproducibility of patient position relative to immobilisation devices. To obtain the required reproducibility, additional fixation devices, such as lock bars to secure the immobilisation device to the treatment couch may be required. Additional treatment set up information may also be required to aid the reproducibility, such as the location of anatomical landmarks or set up tattoos on the patient relative to the immobilisation device. This may require a scale to be added to the immobilisation device. Anthropomorphic phantoms only allow detectors to be placed in set positions in each slice. The measured dose distribution data is limited to those points. Areas near the surface or at the interface near an inhomogeneity may not be able to be measured. To determine the accuracy of the Eclipse PBC algorithm to calculate the dose behind immobilisation devices in regions of the patient adjacent to the immobilisation device and other areas of interest, a study based on a patient model (using patient CT scans) comparing the Eclipse results to those obtained using Monte Carlo could be conducted. This type of study would provide further information regarding the dose calculation accuracy for a clinical set up in all areas of the patient and would allow dose volume histograms for areas of interest, such as critical structures and target volumes, to be compared. Monte Carlo calculations could be performed to determine the electron/photon components of the scattered radiation reaching beyond the air gap and to identify the cause of the reduction in dose at large depths beyond the air gap for some of the set ups. Monte Carlo investigations could also be performed with a fixed SSD set up (to the surface of the material before the air gap) to eliminate affects Page 131 of 169
132 of the change in depth dose with changes in SSD. Calculations using the Mayneord F factor (see Equation 7.5 (page151 )) to account for the effective change in SSD when the air gap thickness and thickness of material before the air gap is changed could also be performed but would not account for the change in scatter conditions (Khan 2003). Studies investigating the range of situations encountered in this study are not typically conducted during TPS commissioning. As a result, dose calculation errors may be present which the TPS users are not aware of. Similar studies to those conducted in this project should also be conducted on algorithms which have recently been released to determine the accuracy of the dose calculation when fields pass through immobilisation devices and air gaps. One example of a new algorithm which has not been investigated in this manner is the Eclipse Anisotropic Analytical Algorithm (AAA) which is used in the more recent versions of Eclipse. Page 132 of 169
133 6 References 1. AAPM American Association of Physicists in Medicine. "Tissue inhomogeneity corrections for megavoltage photon beams. Report of Task Group no. 65 of the Radiation Therapy Committee of the American Association of Physicists in Medicine" AAPM report no. 85. Medical Physics Publishing, August Allal A S, Bischof S and Nouet P. Impact of the "belly board" device on treatment reproducibility in preoperative radiotherapy for rectal cancer. Strahlentherapie und Onkologie, 5, , Beach J L, Mendiondo M S and Mendiondo O A. A comparison of aircavity inhomogeneity effects for cobalt-60, 6-, and 10-MV x-ray beams. Med. Phys., 14(1), , Jan/Feb, Burr G, Brooker R, Weller B and Wells R. Bailliere's Australian Nurses' Dictionary. Australian Edition. Harcourt Brace Jovanovich Group (Australia) Pty Ltd Bushberg J T, Seibert J A, Leidholdt E M and Boone J M. "The Essential Physics of Medical Imaging." Second Edition. Lippincott Williams & Wilkins, Butson M J, Cheung T, Ku P K N and Webb B. Variations in skin dose associated with linac bed material at 6MV x-ray energy. Phys. Med. Biol., 47, N25-N30, Butson M J, Mathur J N and Metcalfe P E. Effect of block trays on skin dose in radiotherapy. Aust. Phys. Eng. Sci. Med., 19(4), , Carl J and Vestergaard A. Skin damage probabilities using fixation materials in high-energy photon beams. Radiotherapy & Oncology, 55, , Page 133 of 169
134 9. Carrasco P, Jornet N, Duch M A, Weber L, Ginjaume M, Eudaldo T, Jurado D, Ruiz A and Ribas M. Comparison of dose calculation algorithms in phantoms with lung equivalent heterogeneities under conditions of lateral electronic disequilibrium. Med. Phys., 31(10), , October, de Mooy L G. The use of carbon fibres in radiotherapy. Radiotherapy & Oncology, 22, , De Ost B, Vanregemorter J, Schaeken B and Van den Weyngaert D. The effect of carbon fibre inserts on the build-up and attenuation of high energy photon beams. Radiotherapy & Oncology, 45, , Ding W, Johnston P W, Wong T P Y and Bubb I F. Investigation of photon beam models in heterogeneous media of modern radiotherapy. Aust. Phys. Eng. Sci. Med., 27(2), 39-48, du Plessis F C P, Willemse C A, Lotter M G and Goedhals L. Comparison of the Batho, ETAR and Monte Carlo dose calculation methods in CT based patient models. Med. Phys., 28(4), , April, Dunscombe P, McGhee P and Lederer E. Anthropomorphic phantom measurements for the validation of a treatment planning system. Phys. Med. Biol., 41, , Engelsman M, Damen E M F, Koken P W, van 't Veld A A, van Ingen K M and Mijnheer B J. Impact of simple tissue inhomogeneity correction algorithms on conformal radiotherapy of lung tumours. Radiotherapy & Oncology, 60, , Fiorino C, Cattaneo G M, del Vecchio A, Fusca M, Longobardi B, Signorotto P and Calandrino R. Skin-sparing reduction effects of thermoplastics used for patient immobilisation in head and neck radiotherapy. Radiotherapy & Oncology, 30, , Fiorino C, Cattaneo G M, del Vecchio A, Longobardi B, Signorotto P, Calandrino R, Fossati V and Volterrani F. Skin dose measurements for head and neck radiotherapy. Med. Phys., 19(5), , Sep/Oct, Page 134 of 169
135 18. Fontenla D P, Napoli J J, Hunt M, Fass D, McCormick B and Kutcher G J. Effects of beam modifiers and immobilisation devices on the dose in the build up region. Int. J. Radiat. Oncol. Biol. Phys., 30(1), , Fraass B, Doppke K, Hunt M, Kutcher G, Starkschall G, Stern R and Van Dyke J. American Association of Physicists in Medicine Radiation Therapy Committee Task Group 53: Quality assurance for clinical radiotherapy treatment planning. Med. Phys., 25(10), , October, Gerbi B J and Khan F M. Measurement of dose in the buildup region using fixed-separation plane-parallel ionisation chambers. Med. Phys., 17(1), 17-26, Jan/Feb, Gillis S, Bral S, de Wagter C, Derie C, Paelinck L, van Vaerenbergh K, Coghe M, de Meerleer G and de Neve W. Evaluation of the Sinmed Mastercouch as replacement for a standard couch. Radiotherapy & Oncology, 75, , Gregory K, Bibbo G and Pattison J E. A standard approach to measurement uncertainties for scientists and engineers in medicine. Aust. Phys. Eng. Sci. Med., 28(2), , Hendee W R, Ibbott G S and Hendee E G. "Radiation Therapy Physics". Third Edition. John Wiley & Sons, Inc, Hoboken New Jersey Higgins D M, Whitehurst P and Morgan A M. The effect of carbon fiber couch inserts on surface dose with beam size variation. Med. Dosim., 26(3), , IAEA International Atomic Energy Agency. "The Use of Plane-Parallel Ionisation Chambers in High-Energy Electron and Photon Beams. An International Code of Practice for Dosimetry." Technical Report Series no IAEA, Vienna, IAEA International Atomic Energy Agency. "Absorbed Dose Determination in External Beam Radiotherapy: An International Code of Practice for Dosimetry based on Standards of Absorbed Dose to Water." Technical Report Series no IAEA, Vienna, Page 135 of 169
136 27. IAEA International Atomic Energy Agency. "Commissioning and Quality Assurance of Computerised Planning Systems for Radiation Treatment of Cancer." Technical Report Series no IAEA, Vienna, ICRU International Commission on Radiation Units and Measurements. "Determination of Absorbed Dose in a Patient Irradiated by Beams of X or Gamma Rays in Radiotherapy Procedures." ICRU Report 24. ICRU, September Jakobsen A, Iversen P, Gadeberg C, Lindberg Hansen J and Hjelm- Hansen M. A new system for patient fixation in radiotherapy. Radiotherapy & Oncology, 8, , Johns H E, Cunningham J R. The Physics of Radiology. Fourth Edition. Charles C Thomas Publisher Ltd Johnson M W, Griggs M A and Sharma S C. A comparison of surface doses for two immobilisation systems. Med. Dosim., 20(3), , Jursinic P A. Changes in incident photon fluence of 6 and 18 MV x rays caused by blocks and block trays. Med. Phys., 26(10), , October, Kan W K, Wu P M, Leung H T, Lo T C, Chung C W, Kwong D L W and Sham S T. The effect of the nasopharyngeal air cavity on x-ray interface doses. Phys. Med. Biol., 43, , Kappas C and Rosenwald J-C. Quality control of inhomogeneity correction algorithms used in treatment planning systems. Int. J. Radiat. Oncol. Biol. Phys., 32(3), , Khan F M. "The Physics of Radiation Therapy". Third Edition. Lippincott Williams & Wilkins, Khan F M. "Treatment Planning in Radiation Oncology" Second Edition. Lippincott Williams & Wilkins Kim S, Liu C R, Zhu T C and Palta J R. Photon beam skin dose analyses for different clinical setups. Med. Phys., 25(6), , June, Page 136 of 169
137 38. Li X A, Yu C and Holmes T. A systematic evaluation of air cavity dose perturbation in megavoltage x-ray beams. Med. Phys., 27(5), , May, Lirette A, Pouliot J, Aubin M and Larochelle M. The role of electronic portal imaging in tangential breast irradiation: a prospective study. Radiotherapy & Oncology, 37, , Mackie T R and Scrimger J W. Contamination of a 15-MV photon beam by electrons and scattered photons. Radiology, 144(2), , July, Mackie T R, El-Khatib E, Battista J, Scrimger J, Van Dyk J and Cunningham J R. Lung dose corrections for 6- and 15-MV x-rays. Med. Phys., 12(3), , May/Jun, McCormack S, Diffey J and Morgan A. The effect of gantry angle on megavoltage photon beam attenuation by a carbon fiber couch insert. Med. Phys., 32(2), , February, Meara S J P and Langmack K A. An investigation into the use of carbon fibre for megavoltage radiotherapy applications. Phys. Med. Biol., 43, , Mellenberg D E. Dose behind various immobilization and beam-modifying devices. Int. J. Radiat. Oncol. Biol. Phys., 32(4), , Metcalfe P E, Wong T P Y and Hoban P W. Radiotherapy x-ray beam inhomogeneity corrections: The problem of lateral electronic disequilibrium in lung. Aust. Phys. Eng. Sci. Med., 16(4), , Metcalfe P, Kron T and Hoban P. "The Physics of Radiotherapy X-rays from Linear Accelerators". Medical Physics Publishing, Meyer J, Mills J A, Haas O C L, Burnham K J and Parvin E M. Accommodation of couch constraints for coplanar intensity modulated radiation therapy. Radiotherapy & Oncology, 61, 23-32, Millar M, Cramb J, Das R, Ackerly T, Brown G, Webb D. ACPSEM Position Paper: Recommendations for the safe use of external beams and sealed brachytherapy sources in radiation oncology. Aust. Phys. Eng. Sci. Med., Supplement 20(3), 1-35, Page 137 of 169
138 49. Munjal R K, Negi P S, Babu A G, Sinha S N, Anand A K and Kataria T. Impact of 6 MV photon beam attenuation by carbon fiber couch and immobilisation devices in IMRT planning and dose delivery. J. Med. Phys., 31(2), 67-71, Nilsson B and Montelius A. Fluence perturbation in photon beams under nonequilibrium conditions. Med. Phys., 13(2), , Mar/Apr, Olch A J, and Lavey R S. Reproducibility and treatment planning advantages of a carbon fiber relocatable head fixation system. Radiotherapy & Oncology, 65, , Podgorsak E B (Editor). "Review of Radiation Oncology Physics: A Handbook for Teachers and Students" Educational Report Series. IAEA, Vienna, Poppe B, Chofor N, Ruhmann A, Kunth W, Djouguela A, Kollhoff R and Willborn K C. The effect of a carbon-fiber couch on the depth-dose curves and transmission properties for megavoltage photon beams. Strahlentherapie und Onkologie, 183, 43-48, Purdy J A. Build up/surface dose and exit dose measurements for a 6-MV linear accelerator. Med. Phys., 13(2), , Mar/Apr, Rao P S, Pillai K and Gregg E C. Effect of shadow trays on surface dose and build-up for megavoltage radiation. American Journal of Reontgenology, 117(1), , January, Rawlinson J A, Arlen D and Newcombe D. Design of parallel plate ion chambers for buildup measurements in megavoltage photon beams. Med. Phys., 19(3), , May/Jun, Shahine B H, Al-Ghazi M S A L and El-Khatib E. Experimental evaluation of interface doses in the presence of air cavities compared with treatment planning algorithms. Med. Phys., 26(3), , March, Sharma S C and Johnson M W. Recommendations for measurement of tray and wedge factors for high energy photons. Med. Phys., 21(4), , April, Page 138 of 169
139 59. Sharp L, Lewin F, Johansson H, Payne D, Gerhardsson A and Rutqvist L E. Randomised trial on two types of thermoplastic masks for patient immobilisation during radiation therapy for head-and-neck cancer. Int. J. Radiat. Oncol. Biol. Phys., 61(1), , Sontag M R and Cunningham J R. Corrections to absorbed dose calculations for tissue inhomogeneities. Med. Phys., 4(4), , Sontag M R and Cunningham J R. The equivalent tissue air ratio method for making absorbed dose calculations in a heterogeneous medium. Radiology, 129, , December, Van Dyk J (Editor). "The Modern Technology of Radiation Oncology: A Compendium for Medical Physicists and Radiation Oncologists". Medical Physics Publishing, Van Dyk J, Barnett R B, Cygler J E and Shragge P C. Commissioning and quality assurance of treatment planning computers. Int. J. Radiat. Oncol. Biol. Phys., 26, , van Kleffens H, Venselaar J, Heukelom S, Jager N, Mijnheer B, van der Laarse R, van Gasteren H and Westermann C. Dependence of the tray transmission factor on collimator setting and source-surface distance. Med. Phys., 27(9), , September, Varian Medical Systems. Treatment Planning Eclipse Version 6.5 Instructions for Use, 2003a. 66. Varian Medical Systems. Vision Calculation Algorithms, 2003b. 67. Varian Medical Systems. Vision Eclipse External Beam Planning, 2003c. 68. Varian Medical Systems. Vision Preparing Images for Treatment Planning, 2003d. 69. Velkley D E, Manson D J, Purdy J A and Oliver G D. Build-up region of megavoltage photon radiation sources. Med. Phys., 2(1), 14-19, Jan/Feb, Page 139 of 169
140 70. Venselaar J, Welleweerd H and Mijnheer B. Tolerances for the accuracy of photon beam dose calculations of treatment planning systems. Radiotherapy & Oncology, 60, , Verhey L J. Immobilizing and positioning patients for radiotherapy. Semin. Radiat. Oncol., 5(2), , April, Vieira S C, Kaatee R S J P, Dirkx M L P and Heijmen B J M. Twodimensional measurement of photon beam attenuation by the treatment couch and immobilization devices using an electronic portal imaging device. Med. Phys., 30(11), , November, Wong T P Y, Kan W K and Law M. The effects of air cavities on x-ray dose distribution at 6 and 25 MV. Aust. Phys. Eng. Sci. Med., 19(4), , Wong T P Y, Metcalfe P E, Kron T and Emeleus T G. Radiotherapy x-ray dose distribution beyond air cavities. Aust. Phys. Eng. Sci. Med., 15(3), , Young M E J and Kornelsen R O. Dose corrections for low-density tissue inhomogeneities and air channels for 10-MV x-rays. Med. Phys., 10(4), , Jul/Aug, Page 140 of 169


141 7 Appendices 7.1 Paper presented at the ACPSEM ACT/NSW Branch Research Committee MedPhys06. Institute of Medical Physics, School of Physics, University of Sydney. 1 st December Page 141 of 169

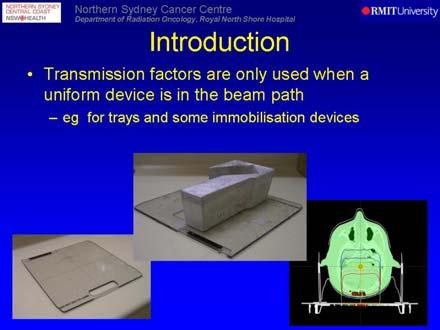
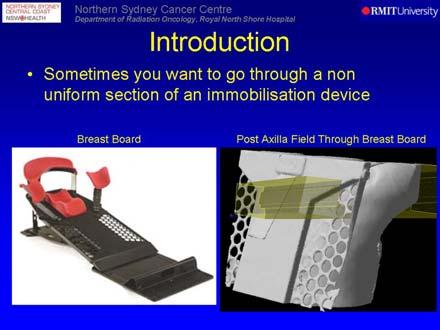
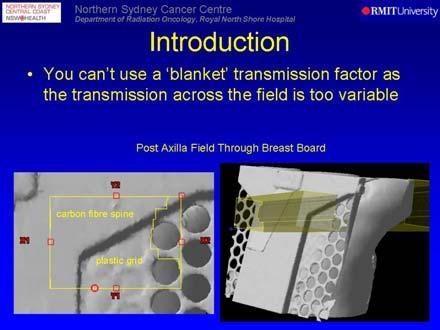
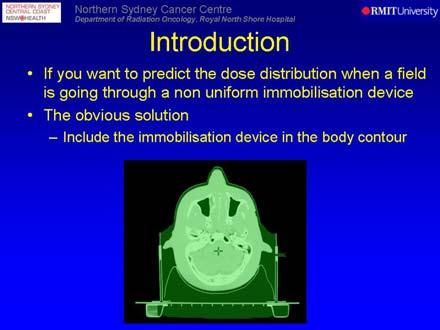
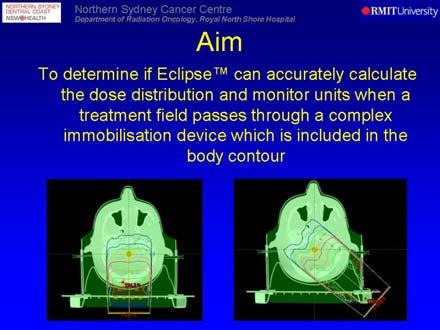
142 Page 142 of 169

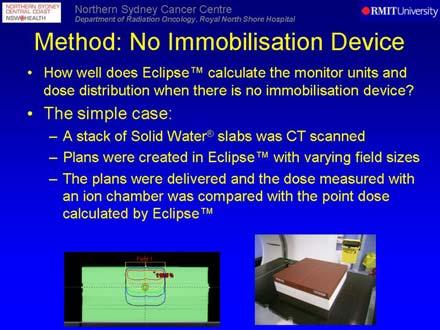
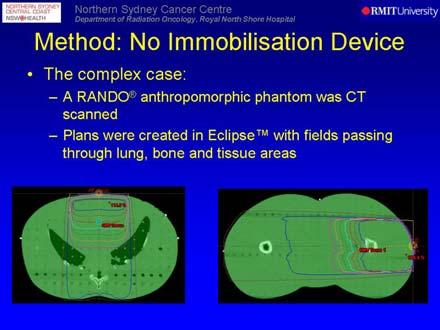
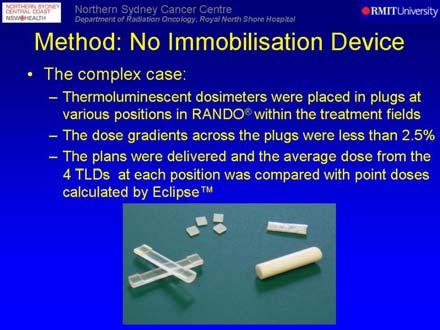
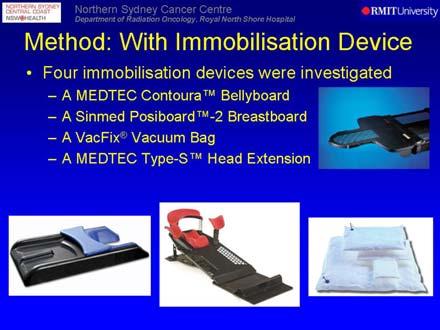
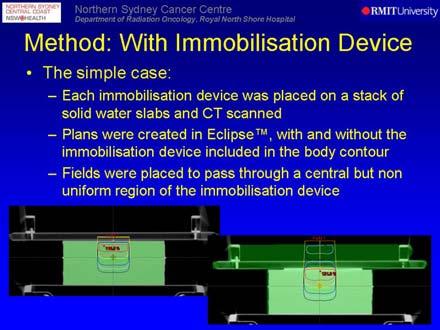
143 Page 143 of 169

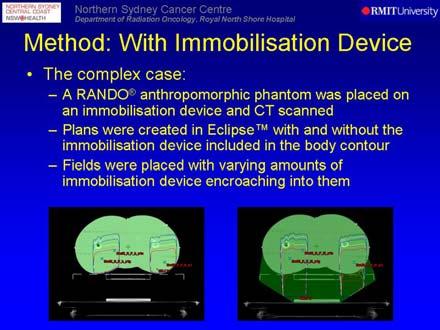
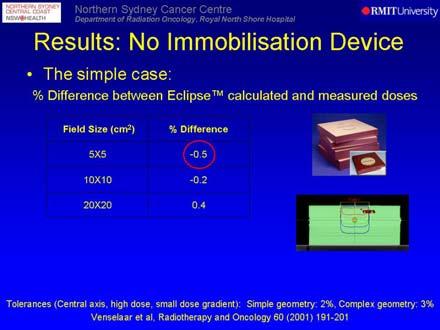
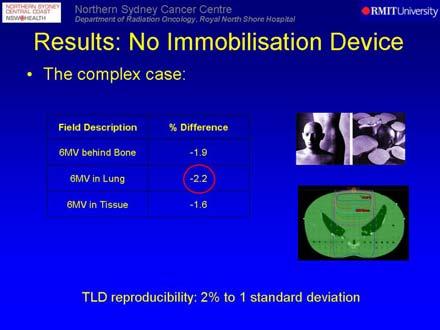
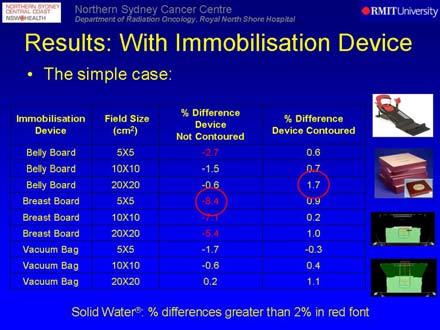
144 Page 144 of 169

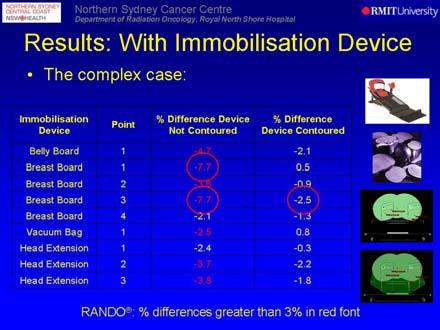
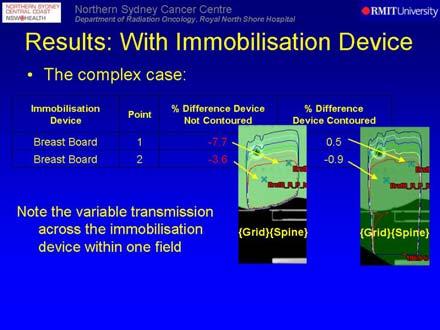
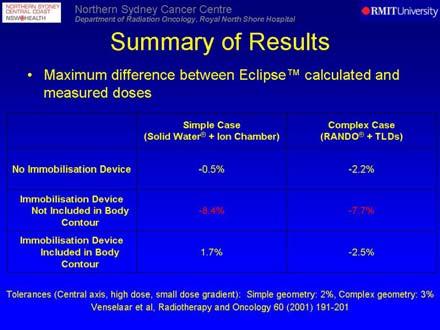
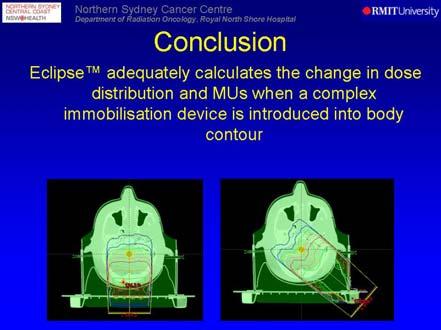
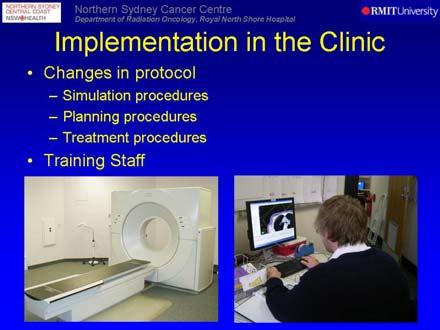
145 Page 145 of 169

146 Page 146 of 169
147 7.2 Eclipse Treatment Planning System Pencil Beam Convolution Dose Calculation Algorithm The Eclipse PBC algorithm for photon dose calculation is a correction based algorithm and is described as having two main phases. The first is called the beam reconstruction model where the dose is reconstructed in a homogenous water equivalent medium (in the phantom geometry used for beam data acquisition) with field add-ons such as blocks, wedges, MLCs and compensators that modify the beam shape or modulate the beam intensity taken into account. As calculating the dose to the entire volume would be very time consuming, the convolution is used to calculate the dose in five planes perpendicular to the beam, and the dose for the other points in the volume is interpolated. The dose is then corrected to account for the distance along the central axis of the field from the focal spot to the patient s skin in the treatment geometry. The second phase applies the patient model (based on the body structure contoured) to the calculation to account for the actual skin curvature and inhomogeneities (Varian Medical Systems 2003a). The convolution which is used to calculate the dose uses pencil beam scatter kernels, a conceptual picture of scatter kernels of beam, slab, pencil and point dimensions can be seen in Figure 7.1. Page 147 of 169

148 Figure 7.1 Scatter kernels of different dimension: (a) beam, (b) slab, (c) pencil and (d) point (Van Dyk 1999). These kernels can be interpreted as iso-contributions from upstream scattering points to a destination point of interest or as the energy spread from a scattering point to downstream voxels (Van Dyk 1999). During the execution of the dose algorithm, the dose at a point is calculated by summing the effects from scattering elements. The mathematical equation for a point kernel is given in Equation 7.1. Page 148 of 169
149 D ( x, y, z) = ( x', y', z' ) K( x', y', z'; x, y, z) dx' dy' dz' Equation 7.1 Φ Where D(x,y,z) is the dose distribution, Φ is the primary source fluence incident upon the surface of the scatter kernel and K is the scatter kernel for the combination of scattering element (x,y,z ) and dose point (x,y,z) (Van Dyk 1999). For a point kernel, the equation is reduced to Equation 7.3 (Van Dyk 1999). D ( x y, z ) ( x', y' ) Φ, = K( x', y'; x, y, z) dx' dy' Equation 7.2 In the approach known as the superposition principle, the kernels are assumed to vary throughout the irradiated volume and in heterogeneous tissue. With this approach local changes in primary fluence and changes in the spread of energy due to local scattering can be accounted for. If the scatter kernels are spatially invariant, such as for a mono-energetic non-divergent source incident on a homogeneous medium, then the dose integrals simplify to convolution integrals with the arguments of K being replaced with relative positions (x-x, y-y, z-z ). The advantage of this is that integrals can be calculated efficiently using fast Fourier transforms. When applied to a poly-energetic divergent beam incident on a heterogenous absorber some approximations are introduced to maintain the speed advantage, but at the expense of accuracy (Van Dyk 1999). The Eclipse PBC algorithm uses the latter method where the scatter kernels are considered to be spatially invariant. The convolution integral used, shown in Equation 7.3, sums a number of pencil beams, each weighted with field intensity to obtain the total dose contribution. Page 149 of 169
150 D( x, y, z; F) F( x', y' ) Pint ( x' y' z) K( x x', y y', z) dx' dy' Equation 7.3 = Where D(x,y,z;F) is the dose at a point (x,y,z) for a field F, F(x,y ) is the field intensity function (which describes the field shape, blocking and any intensity modulation in the field), P int (x,y,z) is the intensity profile (normalised fluence of primary photons at depth z) and K(x-x,y-y,z) is the pencil beam kernel (Varian Medical Systems 2003b). This equation is used to compute the dose on the planes perpendicular to the beam at the standard depths. The dose at points between the standard depths is interpolated along the fanlines of the beam, involving the calculation of: the field intensity function, the position of the effective axis (the fanline crossing the horizontal plane at a depth of 10 cm where the dose reaches its maximum value), the size of the equivalent square field (determined to be the square field whose dose at a depth of 10 cm in the field centre equals the maximum dose at a depth of 10 cm on the effective axis for the irregular field), the depth dose (of the irregular field along the effective field axis, D a (z;f)) and the off axis ratio (P(x,y,z;F), computed by interpolation along the fan lines) (Varian Medical Systems 2003b). The absorbed dose is then calculated in the water equivalent medium using Equation 7.4. D( x, y, z; F) = Da ( z; F) P( x, y, z; F) Equation 7.4 Page 150 of 169
151 The dose is then translated to account for any difference in the distance of the field central axis to the surface of the water equivalent material geometry compared to the patient geometry. This is done by adjusting the equivalent field size where the field central axis intersects with the body structure, adjusting the depth dose values (using the Mayneord F factor and a tissue air ratio (TAR) correction) and applying an inverse square law correction (Varian Medical Systems 2003b). The Mayneord F factor is an approximate method for converting percentage depth dose data from a standard SSD set up to an actual SSD for the patient set up. It is based on the inverse square law, without considering changes in scattering as the SSD is changed (Khan 2003). The formula for the Mayneord F factor given in Equation 7.5. f F = f d + d m m Equation f f d + d Where f 1 is the initial SSD, f 2 is the new SSD, d m is the depth of dose maximum and d is the depth of the point of interest. The TAR is defined as the ratio of the dose (D d ) at a given point in a phantom to the dose in free space (D fs ) at the same point (Khan 2003). An illustration of the set ups used to determine a TAR can be found in Figure 7.2. Page 151 of 169
152 Figure 7.2 An illustration of the set ups used to determine a tissue air ratio (Khan 2003). For a given beam quality, the TAR depends on the depth d and the field size r d at that depth. TARs are independent of the source to surface distance. The formula defining TAR is given in Equation 7.6. TAR ( d, r ) = d D D d fs Equation 7.6 The patient model determines how the skin curvature and tissue inhomogeneities are dealt with when applying the dose distribution which was calculated in the water equivalent material to the patient anatomy. The patient model calculation is completed using Equation 7.7. D ( x, y, z; F) = D ( z; F) P( x, y, z; F) C C Equation 7.7 a o inh Where C o is the correction factor for skin obliquity and C inh is the correction factor for tissue inhomogeneities (Varian Medical Systems 2003b). Page 152 of 169
153 The skin obliquity correction factor accounts for patient skin curvature and is calculated along diverging fanlines between the calculation and focus points using the inverse square law and the TAR/TMR ratio. The TMR is the tissue maximum ratio, which is the ratio of the dose at a given point in a phantom ( D ) to the dose at the same point at a fixed reference depth ( D ), when the reference depth (t 0 ) is the depth of maximum dose (Khan 2003). The formula defining TMR is given in Equation 7.8. to d TMR ( d, r ) = d D D d t o Equation 7.8 An illustration of the set ups used to determine a TMR can be found in Figure 7.3. Figure 7.3 An illustration of the set ups used to determine a tissue maximum ratio (Khan 2003). Page 153 of 169
154 7.2.2 The Equivalent Tissue Air Ratio Inhomogeneity Correction Method The Eclipse External Beam Planning TPS version 6.5 has the capability to conduct inhomogeneity corrections using the generalised Batho power law, the modified Batho power law and the ETAR method (Varian Medical Systems 2003b). The method of inhomogeneity correction used throughout this project was the ETAR method, which was introduced by Sontag and Cunningham in the late 1970s (Sontag and Cunningham 1977, Sontag and Cunningham 1978). A summary of the method is given below. According to the density scaling theorem, the TAR in a field of radius, r, at a depth, d, in a material of uniform density (ρ) relative to water, is equal to TAR(ρd, ρr), i.e. the TAR in a unit density medium for field size ρr and depth ρd. The inhomogeneity correction factor (ICF) for an homogeneous, water like medium with non-unit density is defined in Equation 7.9. TAR ICF = TAR Equation 7.9 ( ρd, ρr) ( d, r) And the inhomogeneity correction factor for heterogeneous geometries is given in Equation TAR ICF = TAR ( d r ) ( d, r) Equation 7.10 ', ~ Where d and ~ r are the effective values of d and r respectively for the radiation value being used. d is derived by averaging CT values along primary photon ray paths and the effective beam radius is given by Equation 7.11 and Equation Page 154 of 169
155 ~ r = r ~ ρ Equation 7.11 ~ ρ = i j k i j k ρ W ijk W ijk ijk Equation 7.12 Where ~ ρ is the average weighted relative electron density, ρ ijk is the relative electron density of a pixel in the CT image and W ijk is a weighting factor proportional to an element s contribution to the scattered radiation arriving at the point of calculation (Varian Medical Systems 2003b). The weighting factors depend on many conditions, such as the surrounding material and location of each point. A different set of weighting factors is required for each point of calculation. The weighting factor is generally largest for voxels closest to the point of calculation. The summation is over the whole of the irradiated volume with the indices i, j and k referring to the X, Y, Z coordinate system (AAPM Report no , Varian Medical Systems 2003b). When this algorithm was developed, summations over the entire irradiated volume were deemed impractical for clinical use due to excessive computer memory requirements and calculation times. This resulted in the development of an approximation procedure which significantly reduces calculation time where the summation over the volume is reduced to a summation over a plane (CT slice), assuming that W k is constant with respect to X and Y and only a function of Z. W k then represents the relative importance of the k th slice contribution to the scatter dose at the point of calculation and W ij represents the relative importance as a function of X and Y positions within the effective scattering slice. The total weighting factor is then approximated by Equation Page 155 of 169
156 W ijk = W k W ij Equation 7.13 The summation equation can then be given by Equation 7.14 and Equation ~ ρ = i i j ~ ρ W j ij W ij ij Equation 7.14 ~ ρ = ij k ~ ρ W k ijk W Equation 7.15 k k Where the calculation of ~ ρ ij results in the reduction of the density data over the volume into an effective slice with respect to photon scattering (AAPM Report no ). This effective slice is assumed to be at a position Z eff away from the plane containing the point of calculation. Z eff represents the mean position from which the scatter originates, assuming that the material between the effective scatter slice and the calculation plane is water. Z eff can be calculated by Equation Z eff = k k Z k W W Equation 7.16 k k Page 156 of 169
. A schematic diagram illustrating the conversion of the CT slices into an effective slice is shown in Figure 7.")
157 Where the summation is over the slices irradiated and Z k is the distance from the plane of calculation to the k th slice. The coalescing CT slices converts a 3D calculation into what is called a 2.5 dimensional calculation (AAPM Report no ). A schematic diagram illustrating the conversion of the CT slices into an effective slice is shown in Figure 7.4. Figure 7.4 A schematic illustration of coalescing six CT slices into an effective CT slice (Sontag and Cunningham 1978). The weighting factors are determined by the difference of two scatter air ratios (SARs) (Varian Medical Systems 2003b). SARs are used when calculating the scattered dose in a medium. It is defined as the ratio of the scattered dose at a given point in the phantom to the dose in free space at the same point. Like TARs, SARs are independent of SSD but depends on beam energy, depth and field size (Khan 2003). As the scattered dose at a point in a phantom is equal to the total dose less the primary dose at the point, they can be calculated using Equation SAR( d, r ) = TAR( d, r ) TAR( d,0) Equation 7.17 d d Page 157 of 169
CHAPTER 4 PRE TREATMENT PATIENT SPECIFIC QUALITY ASSURANCE OF RAPIDARC PLANS
 47 CHAPTER 4 PRE TREATMENT PATIENT SPECIFIC QUALITY ASSURANCE OF RAPIDARC PLANS 4.1 INTRODUCTION Advanced treatment techniques use optimized radiation beam intensities to conform dose distribution to the
Monitor Unit Verification for Small Fields
 Monitor Unit Verification for Small Fields Patrick Higgins, Ph.D University of Minnesota Department of Radiation Oncology October 10, 2013 The Issues: How do we verify the monitor units calculated by the
THE development of more advanced techniques in radiotherapy,
 1 A Geant4-based simulation of an accelerator s head used for Intensity Modulated Radiation Therapy F. Foppiano, B. Mascialino, M.G. Pia, M. Piergentili. Abstract We present a Geant4-based simulation,
Relative Dosimetry. Photons
 Relative Dosimetry Photons What you need to measure! Required Data (Photon) Central Axis Percent Depth Dose Tissue Maximum Ratio Scatter Maximum Ratio Output Factors S c & S cp! S p Beam profiles Wedge
Outline. Chapter 11 Treatment Planning Single Beams. Patient dose calculation. Patient dose calculation. Effect of the curved contour surface
 Chapter 11 reatment Planning Single Beams Radiation Dosimetry I Outline Basic terminology Curved contour surface correction (bolus, compensators, wedges) Oblique beam incidence Correction for tissue inhomogeneities
The Royal Australian and New Zealand College of Radiologists. FRANZCR Examination Part I Radiation Oncology. Radiotherapeutic Physics.
 FRANZCR Examination Part I Radiation Oncology Radiotherapeutic Physics Candidate No.: The Royal Australian and New Zealand College of Radiologists FRANZCR Examination Part I Radiation Oncology Radiotherapeutic
Dosimetric Calculations. Lonny Trestrail
 Dosimetric Calculations Lonny Trestrail 20 October 2008 Objectives Dose Distribution Measurements PDD, OCR TAR, SAR, TPR, TMR, SPR, SMR Arc or Rotational Therapy Isodose Curves Point Dose Calculations
TG-119 IMRT Commissioning Tests Instructions for Planning, Measurement, and Analysis Version 10/21/2009
 TG-119 IMRT Commissioning Tests Instructions for Planning, Measurement, and Analysis Version 10/21/2009 DISCLAIMER: This publication and associated spreadsheets and digital files are based on sources and
Review of fundamental photon dosimetry quantities
 Review of fundamental photon dosimetry quantities Narayan Sahoo Main sources of the materials included in this lecture notes are: (1) Radiation Oncology Physics: A Handbook for Teachers and Students Edited
Commissioning an IMRT System for MLC Delivery. Gary A. Ezzell., Ph.D. Mayo Clinic Scottsdale
 Commissioning an IMRT System for MLC Delivery Gary A. Ezzell., Ph.D. Mayo Clinic Scottsdale Taking the broad view of commissioning Commissioning elements Validating the dosimetry system Commissioning the
Commissioning of a new total body irradiation protocol
 University of Wollongong Research Online University of Wollongong Thesis Collection University of Wollongong Thesis Collections 2012 Commissioning of a new total body irradiation protocol Zoe Baldwin University
Monitor Unit Calculations Part 1. Return to our first patient. Purpose. 62 yr old woman with Stage IIIB (T1N3M0) NSCLC rt lower lobe Dose prescription
 NSCLC rt lower lobe Dose prescription") Monitor Unit Calculations Part 1 George Starkschall, Ph.D. Department of Radiation Physics U.T. M.D. Anderson Cancer Center Return to our first patient 62 yr old woman with Stage IIIB (T1N3M0) NSCLC rt
Monitor Unit Calculations Part 1 George Starkschall, Ph.D. Department of Radiation Physics U.T. M.D. Anderson Cancer Center Return to our first patient 62 yr old woman with Stage IIIB (T1N3M0) NSCLC rt
Absorption measurements for a carbon fiber couch top and its modelling in a treatment planning system
 Absorption measurements for a carbon fiber couch top and its modelling in a treatment planning system G. Kunz, F. Hasenbalg, P. Pemler 1 1 Klinik für Radio-Onkologie und Nuklearmedizin, Stadtspital Triemli
The MC commissioning of CyberKnife with MLC (Tips and Tricks)
") The MC commissioning of CyberKnife with MLC (Tips and Tricks) Alain Guemnie Tafo, PhD UPMC Pinnacle, Harrisburg, PA Institute Gustave Roussy, Villejuif, France Disclaimer & Disclosure The views expressed
The MC commissioning of CyberKnife with MLC (Tips and Tricks) Alain Guemnie Tafo, PhD UPMC Pinnacle, Harrisburg, PA Institute Gustave Roussy, Villejuif, France Disclaimer & Disclosure The views expressed
JOURNAL OF APPLIED CLINICAL MEDICAL PHYSICS, VOLUME 3, NUMBER 4, FALL 2002
 JOURNAL OF APPLIED CLINICAL MEDICAL PHYSICS, VOLUME 3, NUMBER 4, FALL 2002 Comparison of monitor unit calculations performed with a 3D computerized planning system and independent hand calculations: Results
Field size and depth dependence of wedge factor for internal wedge of dual energy linear accelerator
 Journal of BUON 8: 55-59, 2003 2003 Zerbinis Medical Publications. Printed in Greece ORIGINAL ARTICLE Field size and depth dependence of wedge factor for internal wedge of dual energy linear accelerator
13 QUALITY ASSURANCE OF A LINEAR ACCELERATOR 13.1 COLLIMATOR ISOCENTER, JAWS, LIGHT FIELD VS INDICATORS, COLLIMATOR ANGLE INDICATORS.
 13 QUALITY ASSURANCE OF A LINEAR ACCELERATOR 13.1 COLLIMATOR ISOCENTER, JAWS, LIGHT FIELD VS INDICATORS, COLLIMATOR ANGLE INDICATORS. 13.1.1 TRAINING GOAL 13.1.1.1 Among the responsabilities of a medical
ANALYSIS OF OFF-AXIS ENHANCDED DYNAMIC WEDGE DOSIMETRY USING A 2D DIODE ARRAY A CREATIVE PROJECT (3 SEMESTER HOURS) SUBMITTED TO THE GRADUATE SCHOOL
 SUBMITTED TO THE GRADUATE SCHOOL") ANALYSIS OF OFF-AXIS ENHANCDED DYNAMIC WEDGE DOSIMETRY USING A 2D DIODE ARRAY A CREATIVE PROJECT (3 SEMESTER HOURS) SUBMITTED TO THE GRADUATE SCHOOL FOR THE DEGREE MASTER OF ARTS BY CHARLES TRAVIS WEBB
ANALYSIS OF OFF-AXIS ENHANCDED DYNAMIC WEDGE DOSIMETRY USING A 2D DIODE ARRAY A CREATIVE PROJECT (3 SEMESTER HOURS) SUBMITTED TO THE GRADUATE SCHOOL FOR THE DEGREE MASTER OF ARTS BY CHARLES TRAVIS WEBB
SnapShot IMRT with compensators and FFF beams
 SnapShot IMRT with compensators and FFF beams Vladimir Feygelman, PhD (1) Moffitt Cancer Center, Tampa, FL, USA Disclosure VF has a sponsored research agreement with.decimal. A short history of radiotherapy
Constancy checks of well-type ionization chambers with external-beam radiation units
 JOURNAL OF APPLIED CLINICAL MEDICAL PHYSICS, VOLUME 16, NUMBER 6, 2015 Constancy checks of well-type ionization chambers with external-beam radiation units Sara L. Hackett, 1a Benjamin Davis, 2 Andrew
Clinical Implementation of the TG-51 Protocol. David Followill Radiological Physics Center Houston Texas
 Clinical Implementation of the TG-51 Protocol David Followill Radiological Physics Center Houston Texas Current Implementation Status Current Implementation Status 1600 1400 TOTAL 1494 of 1623 ACTIVE INSTITUTIONS
Commissioning and quality assurance of a commercial intensity modulated radiotherapy (IMRT) treatment planning system PrecisePLAN
 treatment planning system PrecisePLAN") 22 Turkish Journal of Cancer Volume 37, No.1, 2007 Commissioning and quality assurance of a commercial intensity modulated radiotherapy (IMRT) treatment planning system PrecisePLAN SATISH PELAGADE 1, KALPANA
22 Turkish Journal of Cancer Volume 37, No.1, 2007 Commissioning and quality assurance of a commercial intensity modulated radiotherapy (IMRT) treatment planning system PrecisePLAN SATISH PELAGADE 1, KALPANA
GEANT4 SIMULATION OF AN ACCELERATOR HEAD FOR INTENSITY MODULATED RADIOTHERAPY
 The Monte Carlo Method: Versatility Unbounded in a Dynamic Computing World Chattanooga, Tennessee, April 17-21, 2005, on CD-ROM, American Nuclear Society, LaGrange Park, IL (2005) GEANT4 SIMULATION OF
Commissioning of Elekta 6MV FFF Versa HD and Pinnacle
 Commissioning of Elekta 6MV FFF Versa HD and Pinnacle Poster No.: R-0044 Congress: Type: Authors: Keywords: DOI: 2014 CSM Scientific Exhibit L. Bendall, I. Patel, N. McGrath, C. Rowbottom; MANCHESTER/
Only 8% to go. TOTAL 1494 of 1623 ACTIVE INSTITUTIONS (92%) May-09. May-04 Nov-04. May-07. Nov-02 May-03. Nov-05. Nov-06. Nov-07 May-08.
 May-09. May-04 Nov-04. May-07. Nov-02 May-03. Nov-05. Nov-06. Nov-07 May-08.") Clinical Implementation of the TG-51 Protocol David Followill Radiological Physics Center Houston Texas 2009 AAPM Summer School Educational Objectives Improve your understanding of how to implement TG-51
Clinical Implementation of the TG-51 Protocol David Followill Radiological Physics Center Houston Texas 2009 AAPM Summer School Educational Objectives Improve your understanding of how to implement TG-51
Math Review. Overview
 Drawn by Steve Yan, CMD Math Review Shirley Ann Pinegar-Johnston MS RT(R)(T)CMD Overview Drawn by Steve Yan, CMD Divergence & Intensity DIVERGENCE X-rays travel in Straight but Divergent lines INTENSITY
Monitor Unit Calculations Part 2. Calculation of machine setting. Collimator setting
 Monitor Unit Calculations Part 2 George Starkschall, Ph.D. Department of Radiation Physics U.T. M.D. Anderson Cancer Center Calculation of machine setting reference dose machine setting =, reference dose
Proton Therapy QA Tools
 Proton Therapy QA Tools A complete range of tools for absolute dosimetry, machine QA and patient plan verification Introduction During the past years more and more heavy particle therapy centers, especially
Abstract: Introduction:
 Are photon and electron beam calibrations more consistent with TG-51 than with TG-21? Ramesh C. Tailor, William F. Hanson, Nathan Wells, and Geoffrey S. Ibbott. U.T. MD Anderson Cancer Center, Houston
Comparison of ionization chambers of various volumes for IMRT absolute dose verification
 Comparison of ionization chambers of various volumes for IMRT absolute dose verification Leonid B. Leybovich, a) Anil Sethi, and Nesrin Dogan Department of Radiation Oncology, Loyola University Medical
A beam-matching concept for medical linear accelerators
 Acta Oncologica, 2009; 48: 192200 ORIGINAL ARTICLE A beam-matching concept for medical linear accelerators DAVID SJÖSTRÖM, ULF BJELKENGREN, WIVIANN OTTOSSON & CLAUS F. BEHRENS Copenhagen University Hospital,
CLINICAL IMPLEMENTATION OF RAPIDARC Treatment Planning Strategies to Improve Dose Distributions
 CLINICAL IMPLEMENTATION OF RAPIDARC Treatment Planning Strategies to Improve Dose Distributions Rebecca M. Howell, Ph.D., D.A.B.R, The University of Texas at M.D. Anderson Cancer Center Overview 2 Commissioning
IMRT in clinical practice at the UMC-Utrecht. Utrecht
 3 IMRT in clinical practice at the UMC-Utrecht Utrecht Clinical use of IMRT Improvement of local control without increased incidence of normal tissue complications + Dose escalation in the prostate Step-and
Basics of Proton Therapy. Proton Treatment Planning and Beam Optimization
 Basics of Proton Therapy Proton Treatment Planning and Beam Optimization SAM Educational Session, WE D BRB 2 Mark Pankuch, PhD Northwestern Medicine Chicago Proton Center Today s objectives Review the
Exradin Ion Chambers. What attributes make Exradin the smart choice? EXRADIN Ion Chambers
 EXRADIN Ion Chambers Exradin Ion Chambers Exradin (EXacting RADiation INstrumentation) Ion Chambers have been built for over 33 years, are recognized by top research institutes and standards laboratories,
Experimental verification of a Monte Carlo-based MLC simulation model for IMRT dose calculations in heterogeneous media
 Experimental verification of a Monte Carlo-based MLC simulation model for IMRT dose calculations in heterogeneous media N Tyagi 1, B H Curran, P L Roberson, J M Moran, E Acosta and B A Fraass Department
Investigation of Buildup Dose for Therapeutic Intensity Modulated Photon Beams in Radiation Therapy
 University of South Florida Scholar Commons Graduate Theses and Dissertations Graduate School 7-14-2010 Investigation of Buildup Dose for Therapeutic Intensity Modulated Photon Beams in Radiation Therapy
Scientific Journal of Nuclear Medicine & Radiation Therapy
 Scientific Journal of Nuclear Medicine & Radiation Therapy Research Article Radiotherapy Dose Calculation Program, for Monitoring and Commissioning Treatment Planning Systems - Ioannis Vamvakas*, Stella
Clinical Implementation of Volumetric Modulated Arc Therapy
 Clinical Implementation of Volumetric Modulated Arc Therapy UT M.D. Anderson Cancer Center Ramaswamy Sadagopan, Rebecca M. Howell, Weiliang Du and Peter Balter Definition 2 Intensity Modulated Arc therapy
Zoubir Ouhib Lynn Cancer Institute
 Zoubir Ouhib Lynn Cancer Institute April 2015 Speaker for ELEKTA Brachytherapy using miniature X-ray sources Energy
Validation of Treatment Planning Dose Calculations: Experience Working with Medical Physics Practice Guideline 5.a.
 International Journal of Medical Physics, Clinical Engineering and Radiation Oncology, 2017, 6, 57-72 http://www.scirp.org/journal/ijmpcero ISSN Online: 2168-5444 ISSN Print: 2168-5436 Validation of Treatment
Introduction. Introduction. The CyberKnife SRS/SBRT System. Introduction. Contour Structures. CyberKnife Components
 Introduction The CyberKnife SRS/SBRT System James M. Hevezi,, Ph.D., FACR CyberKnife Unit San Antonio, Texas CyberKnife Components Treatment Delivery (G3 Platform San Antonio) Robot (modified German auto
A dose delivery verification method for conventional and intensitymodulated radiation therapy using measured field fluence distributions
 A dose delivery verification method for conventional and intensitymodulated radiation therapy using measured field fluence distributions Wendel Dean Renner a) Math Resolutions, LLC, 5975 Gales Lane, Columbia,
Surface buildup dose dependence on photon field delivery technique for IMRT
 Surface buildup dose dependence on photon field delivery technique for IMRT Shigeru Yokoyama, Peter L. Roberson, Dale W. Litzenberg, Jean M. Moran, and Benedick A. Fraass Department of Radiation Oncology,
TG-61 deals with: This part of the refresher course: Phantoms. Chambers. Practical Implementation of TG-61:
 Practical Implementation of TG-61: II. Guidelines for clinical implementation of TG-61 J.P. Seuntjens Medical Physics Unit McGill University, Montreal General Hospital Montréal, Canada jseuntjens@medphys.mcgill.ca
High Speed Direct SAD Radiosurgery Beam Scanner
 Open Access Original Article DOI: 10.7759/cureus.20 High Speed Direct SAD Radiosurgery Beam Scanner Walter Nikesch 1, James M. Hevezi 2, Irene Monterroso 3, Daniel Navarro 4, James G. Schwade 5 1. CyberKnife
TG-51: Experience from 150 institutions, common errors, and helpful hints
 TG-51: Experience from 150 institutions, common errors, and helpful hints Ramesh C. Tailor, Ph. D., William F. Hanson, Ph.D., and Geoffrey S. Ibbott, Ph.D. Department of Radiation Physics, University of
TG219: IT'S USE, STRENGTHS AND WEAKNESSES
 1 CONFLICT OF INTEREST TG219: IT'S USE, STRENGTHS AND WEAKNESSES SOTIRI STATHAKIS, PHD, DABR None ROSTER STATEMENT OF THE PROBLEM Timothy C. Zhu, University of Pennsylvania, Philadelphia, PA (Co- Chair)
Trial calibrations of therapy level electron beam ionisation chambers in terms of absorbed dose to water
 Trial calibrations of therapy level electron beam ionisation chambers in terms of absorbed dose to water M R McEwen, A J Williams and A R DuSautoy Centre for Ionising Radiation Metrology National Physical
Chapter I Standard application in photon dosimetry José Guilherme Pereira Peixoto Maria da Penha Potiens
 Chapter I Standard application in photon dosimetry José Guilherme Pereira Peixoto Maria da Penha Potiens The characteristic ionizing radiation response is defined by the relationship between the stimulus
Radiotherapy physics & Equipments
 Radiotherapy physics & Equipments RAD 481 Lecture s Title: Beam Modification devices in Radiotherapy Dr. Mohammed Emam Vision :IMC aspires to be a leader in applied medical sciences, health care education
How to Design Medical Accelerator Systems for Reliability: IBA PT System
 How to Design Medical Accelerator Systems for Reliability: IBA PT System Yves Jongen Founder & Chief Research Officer Ion Beam Applications s.a. Belgium 1 Outline A short introduction of a proton therapy
Clinical Implementation of the IPEM 2003 Code of Practice for Electron Dosimetry
 Clinical Implementation of the IPEM 2003 Code of Practice for Electron Dosimetry Tom Jordan Royal Surrey County Hospital IPEM Electron Dosimetry Working Party: + DI Thwaites, AR DuSautoy, MR McEwen, AE
The dose distribution of medium energy electron boosts to the laryngectomy stoma
 JOURNAL OF APPLIED CLINICAL MEDICAL PHYSICS, VOLUME 2, NUMBER 1, WINTER 2001 The dose distribution of medium energy electron boosts to the laryngectomy stoma Ellen D. Yorke* Memorial Sloan-Kettering Cancer
Patient Positioning Products
 Patient Positioning Products A Higher Standard for Radiation Therapy www.klaritymedical.com www.klaritymedical.com KLARITY is fast becoming the world s premier provider of masks and thermoplastic devices
Badan Jadrowych Nuclear Research Institute. Report INR No. 739/XIX/D CERN LIBRARIES, GENEVA CM-P Differential Recombination Chamber
 Badan Jadrowych Nuclear Research Institute Report INR No. 739/XIX/D CERN LIBRARIES, GENEVA CM-P00100517 Differential Recombination Chamber by M. Zel'chinskij K. Zharnovetskij Warsaw, June 1966 Translated
Commissioning and periodic tests of the Esteya electronic brachytherapy system
 Review paper Educational Activity Commissioning and periodic tests of the Esteya electronic brachytherapy system Cristian Candela-Juan, PhD 1, Yury Niatsetski, MSc 2, Zoubir Ouhib, PhD 3, Facundo Ballester,
CHAPTER-2. Wedge filters are the most important beam modifiers used in
 CHAPTER-2 2. WEDGE FLTERS 2.1. NTRODUCTON Wedge filters are the most important beam modifiers used in radiotherapy which are placed in the path of photon beams to modify their isodose diistributions. The
VariSource High Dose Rate Afterloader Procedures. For Performing Breast Brachytherapy with. The SAVI TM Applicator
 VariSource High Dose Rate Afterloader Procedures For Performing Breast Brachytherapy with The SAVI TM Applicator Contents I. CT Evaluation (~1 week prior to insertion) II. SAVI Applicator Implantation
Practical Course in Reference Dosimetry, National Physical Laboratory February 2014 MV Photon Dosimetry in the Clinic Page 1 of 11
 MV Photon Dosimetry in the Clinic This document discusses both the scientific methods and the system of work required to calibrate a field instrument expanding upon the practical details of both.. Introduction
1. Question Answer cgy / MU cgy / MU 2. Question Answer
 GS020113: Introduction to Medical Physics III: Therapy s to home work problem set assigned on 3/22/11 1. Question A patient is set up at 100 cm SSD on a 6 MVX machine. The dose rate at 10 cm in phantom
Original Article. Effective Point of Measurement in Cylindrical Ion Chamber for Megavoltage Photon Beams
 Iranian Journal of Medical Physics Vol. 10, No. 3, Summer 2013, 147-155 Received: April 22, 2013; Accepted: July 21, 2013 Original Article Effective Point of Measurement in Cylindrical Ion Chamber for
Iranian Journal of Medical Physics
 Iranian Journal of Medical Physics ijmp.mums.ac.ir Verification of Monitor Unit Calculations for Eclipse Treatment Planning System by in-house Developed Spreadsheet Athiyaman Mayivaganan 1*, Hemalatha
AAPM s TG-51 protocol for clinical reference dosimetry of high-energy photon and electron beams
 AAPM s TG-51 protocol for clinical reference dosimetry of high-energy photon and electron beams Peter R. Almond Brown Cancer Center, Louisville, Kentucky 40202 Peter J. Biggs Department of Radiation Oncology,
WEDGE FILTERS FOR MEGAVOLTAGE ROENTGEN RAY BEAMS
 Acta Radiologica Oncology 23 (1984) Fusc. 6 FROM THE RADIATION THERAPY DEPARTMENT, ANTON1 VAN LEEUWENHOEK HOSPITAL, THE NETHERLANDS CANCER INSTITUTE, AMSTERDAM, THE PHILIPS MEDICAL SYSTEMS DIVISION, BEST,
Implementation of respiratory-gated VMAT on a Versa HD linear accelerator
 Received: 21 November 2016 Revised: 7 April 2017 Accepted: 5 June 2017 DOI: 10.1002/acm2.12160 RADIATION ONCOLOGY PHYSICS Implementation of respiratory-gated VMAT on a Versa HD linear accelerator Jeffrey
3D Treatment Planning and verification with hand calculations
 3D Treatment Planning and verification with hand calculations Randy Holt, PhD, CEO Pacific Crest Medical Physics, Inc Chico, CA Dosimetric Calculations Calibration and Measurement Conditions Patient Conditions
Electronic Oncology Systems the Management and the Safety Measures. Hansen Chen, Director, TDSI
 Electronic Oncology Systems the Management and the Safety Measures Hansen Chen, Director, TDSI Radiation Oncology Department People Place Equipments Procedures Patients Hansen Chen 2 Radiation Oncology
kvue IGRT Couch top One couch top, multiple treatment solutions For Varian, Elekta, Siemens, Proton and more The Best of Both Worlds
 TM kvue IGRT Couch top One couch top, multiple treatment solutions For Varian, Elekta, Siemens, Proton and more kvue The Best of Both Worlds kvue IGRT COUCH TOP One couch top, multiple treatment solutions
INTERCOMPARISON OF IONIZATION CHAMBER CALIBRATION FACTORS IN THE IAEA/WHO NETWORK OF SSDLS
 A9744593 INTERCOMPARISON OF IONIZATION CHAMBER CALIBRATION FACTORS IN THE IAEA/WHO NETWORK OF SSLS Ladislav Czap, Georg Matscheko and Pedro Andreo osimetry and Medical Radiation Physics Section, ivision
Failure Mode and Effect Analysis (FMEA) for a DMLC Tracking System
 for a DMLC Tracking System") Failure Mode and Effect Analysis (FMEA) for a DMLC Tracking System Amit Sawant 1, Sonja Dieterich 1, Michelle Svatos 2 and Paul Keall 1 1 Stanford University, Stanford, CA 2 Varian Medical Systems, Palo
Failure Mode and Effect Analysis (FMEA) for a DMLC Tracking System Amit Sawant 1, Sonja Dieterich 1, Michelle Svatos 2 and Paul Keall 1 1 Stanford University, Stanford, CA 2 Varian Medical Systems, Palo
Disclosures. What Is So Hard? End of ITV: Gating is the Best ITV Killer 8/3/2016. Daniel A. Low, Ph.D. UCLA. Varian Grant Siemens Grant Accuray Grant
 Real Timefullness 8/3/2016 End of ITV: Gating is the Best ITV Killer Daniel A. Low, Ph.D. UCLA Varian Grant Siemens Grant Accuray Grant Disclosures What Is So Hard? Light Ultrasound MRI X Ray Planar X
Treatment Planning Techniques for Larger Body Habitus Patients for Breast/Chestwall and Regional Lymph Nodal Irradiation
 Treatment Planning Techniques for Larger Body Habitus Patients for Breast/Chestwall and Regional Lymph Nodal Irradiation By Ruth Ann M. Good, CMD. R.T. (R)(T) Virginia Commonwealth University, Richmond,
Radiotherapy Treatment Planning and Delivery
 Radiotherapy Treatment Planning and Delivery SCOPE 1: Study of Chemoradiotherapy in Oesophageal Cancer Plus or Minus Erbitux A randomised phase II/III multi-centre clinical trial of definitive chemo-radiation,
TEST REPORT BEAMSCAN WITH HALCYON
 TEST REPORT BEAMSCAN WITH HALCYON UZ Leuven, November 20 th, 2017 + = Ideal BEAMSCAN tank dimensions to fit perfectly into the Halcyon bore Fast tank positioning using the Halcyon lasers, no electronics
Planning Assignment (3 field rectum)
") Megan Sullivan Clinical Lab Rectum April 25, 2016 Planning Assignment (3 field rectum) Use a CT dataset of the pelvis. Create a CTV by contouring the rectum (start at the anus and stop at the turn where
Megan Sullivan Clinical Lab Rectum April 25, 2016 Planning Assignment (3 field rectum) Use a CT dataset of the pelvis. Create a CTV by contouring the rectum (start at the anus and stop at the turn where
COMPASS. Dr. Lutz Müller. AK IMRT Bamberg April D IMRT Verification in Patient Anatomy
 COMPASS 3D IMRT Verification in Patient Anatomy AK IMRT Bamberg April 2010 Dr. Lutz Müller Patient-specific Verification? CT Treatment unit Gantry =0 Treatmt unit Patient couch X-ray beam Patient couch
Commissioning and quality assurance for the treatment delivery components of the AccuBoost system
 JOURNAL OF APPLIED CLINICAL MEDICAL PHYSICS, VOLUME 16, NUMBER 2, 2015 Commissioning and quality assurance for the treatment delivery components of the AccuBoost system Ileana Iftimia, 1,2a Mike Talmadge,
Evaluation of six TPS algorithms in computing entrance and exit doses
 JOURNAL OF APPLIED CLINICAL MEDICAL PHYSICS, VOLUME 15, NUMBER 3, 2014 Evaluation of six TPS algorithms in computing entrance and exit doses Yun I. Tan, 1,2a Mohamed Metwaly, 3 Martin Glegg, 3 Shaun P.
General Accreditation Guidance. User checks and maintenance of laboratory balances
 General Accreditation Guidance User checks and maintenance of laboratory balances January 2018 Copyright National Association of Testing Authorities, Australia 2010 All intellectual property rights in
User Manual. RW3 Slab Phantom T29672 and T
 User Manual RW3 Slab Phantom Contents Operating Manual Technical Manual Service Manual D188.131.00/07 en 2015-07 Hn General Information General Information The product bears the CE-mark "CE" in accordance
4D Target definition for SBRT : how to deal with moving targets, a practical approach
 4D Target definition for SBRT : how to deal with moving targets, a practical approach Dr. Alina Mihai, MD MSc Beacon Hospital, Dublin, Ireland From 3D to 4D Target Definitions (ICRU50/62) 3D CT 4D CT ICRU
Drilling Efficiency Utilizing Coriolis Flow Technology
 Session 12: Drilling Efficiency Utilizing Coriolis Flow Technology Clement Cabanayan Emerson Process Management Abstract Continuous, accurate and reliable measurement of drilling fluid volumes and densities
Treatment plan complexity metrics for predicting IMRT pretreatment. assurance results. Scott Crowe, QUT
 Treatment plan complexity metrics for predicting IMRT pretreatment quality assurance results Scott Crowe, QUT Pre-treatment QA Verification of fluence delivery to ensure that dose can be delivered accurately
RESPIRATORY MOTION IN RADIATION THERAPY
 RESPIRATORY MOTION IN RADIATION THERAPY Significant effect on targets in the chest and upper abdominal cavities Can cause difficulty in reproducing radiation planning protocols in radiation treatment sessions
Autodesk Moldflow Communicator Process settings
 Autodesk Moldflow Communicator 212 Process settings Revision 1, 3 March 211. Contents Chapter 1 Process settings....................................... 1 Profiles.................................................
A simple theoretical verification of monitor unit calculation for intensity modulated beams using dynamic mini-multileaf collimation
 Radiotherapy and Oncology 71 (2004) 235 241 Technical Note A simple theoretical verification of monitor unit calculation for intensity modulated beams using dynamic mini-multileaf collimation Nadine Linthout*,
IPEM Working Party: D IThwaites(Chair), A R DuSautoy, T Jordan, MRMcEwen, A Nisbet, A E Nahum and W G Pitchford
, A R DuSautoy, T Jordan, MRMcEwen, A Nisbet, A E Nahum and W G Pitchford") INSTITUTE OF PHYSICSPUBLISHING Phys. Med. Biol. 48 (2003) 2929 2970 PHYSICS INMEDICINE AND BIOLOGY PII: S0031-9155(03)65222-X The IPEM code of practice for electron dosimetry for radiotherapy beams of
INSTITUTE OF PHYSICSPUBLISHING Phys. Med. Biol. 48 (2003) 2929 2970 PHYSICS INMEDICINE AND BIOLOGY PII: S0031-9155(03)65222-X The IPEM code of practice for electron dosimetry for radiotherapy beams of
Physics and Quality Assurance
 Disclosure Physics and Quality Assurance Consultancy agreements with Nucletron, Hologic Mahta M. McKee, MS, DABR Department of Radiation Oncology Wake Forest University Health Sciences Agenda Current Treatment
CHAPTER IV FINITE ELEMENT ANALYSIS OF THE KNEE JOINT WITHOUT A MEDICAL IMPLANT
 39 CHAPTER IV FINITE ELEMENT ANALYSIS OF THE KNEE JOINT WITHOUT A MEDICAL IMPLANT 4.1 Modeling in Biomechanics The human body, apart of all its other functions is a mechanical mechanism and a structure,
EXPERIMENTAL RESULTS OF GUIDED WAVE TRAVEL TIME TOMOGRAPHY
 18 th World Conference on Non destructive Testing, 16-20 April 2012, Durban, South Africa EXPERIMENTAL RESULTS OF GUIDED WAVE TRAVEL TIME TOMOGRAPHY Arno VOLKER 1 and Hendrik VOS 1 TNO, Stieltjesweg 1,
IAEA-TECDOC-1455 Implementation of the International Code of Practice on Dosimetry in Radiotherapy (TRS 398): Review of testing results
: Review of testing results") IAEA-TECDOC-1455 Implementation of the International Code of Practice on Dosimetry in Radiotherapy (TRS 398): Revie of testing results Final report of the Coordinated Research Projects on Implementation
IAEA-TECDOC-1455 Implementation of the International Code of Practice on Dosimetry in Radiotherapy (TRS 398): Revie of testing results Final report of the Coordinated Research Projects on Implementation
1. BEAM MODIFIERS IN RADIOTHERAPY
 CHAPTER-1 1. BEAM MODIFIERS IN RADIOTHERAPY INTRODUCTION In radiotherapy, tumours under varying body contour are very often encountered. In such cases, due to the irregular body surface, the dose distribution
Maintenance and general care of secondary standard and field instruments
 Maintenance and general care of secondary standard and field instruments This is without doubt the most important lecture that you will be given during this course. That rather rash statement is based
Analysis of Shear Lag in Steel Angle Connectors
 University of New Hampshire University of New Hampshire Scholars' Repository Honors Theses and Capstones Student Scholarship Spring 2013 Analysis of Shear Lag in Steel Angle Connectors Benjamin Sawyer
Introduction. Materials and Methods
 STANDARD WEDGE AND TRAY TRANSMISSION VALUES FOR VARIAN, SEIMENS, ELEKTA/PHILIPS ACCELERATORS; A QUALITY ASSURANCE TOOL David S. Followill, Nadia Hernandez, and William F. Hanson Introduction The Radiological
Larry A. DeWerd, Ph.D., FAAPM UW ADCL & Dept. of Medical Physics University of Wisconsin
 Larry A. DeWerd, Ph.D., FAAPM UW ADCL & Dept. of Medical Physics University of Wisconsin NCCAAPM Meeting Oct 11,2013 Larry DeWerd has a partial interest in Standard Imaging Talks from people who have been
OUTPUT at dmax in tissue 8x8 20x20 At 100cm SSD At 100cm SAD
 RAPHEX 2001 T1. All of the following are true regarding Percentage Depth Dose (PDD) except: A. Increases with increasing energy. B. Depends on field size. C. Is the dose at depth expressed as a % of the
Modeling of Estimated Respiratory Waveform
 Modeling of Estimated Respiratory Waveform ALEKSEI E. ZHDANOV, LEONID G. DOROSINSKY Institute of Radioelectronics and Information Technology - RTF Ural Federal University named after the first President
Modeling of Hydraulic Hose Paths
 Mechanical Engineering Conference Presentations, Papers, and Proceedings Mechanical Engineering 9-2002 Modeling of Hydraulic Hose Paths Kurt A. Chipperfield Iowa State University Judy M. Vance Iowa State