Commissioning of a new total body irradiation protocol
|
|
|
- Rodney Benson
- 6 years ago
- Views:
Transcription
1 University of Wollongong Research Online University of Wollongong Thesis Collection University of Wollongong Thesis Collections 2012 Commissioning of a new total body irradiation protocol Zoe Baldwin University of Wollongong Recommended Citation Baldwin, Zoe, Commissioning of a new total body irradiation protocol, Master of Science - Research thesis, Faculty of Engineering, University of Wollongong, Research Online is the open access institutional repository for the University of Wollongong. For further information contact the UOW Library: research-pubs@uow.edu.au
2
3 COMMISSIONING OF A NEW TOTAL BODY IRRADIATION PROTOCOL by Zoë Baldwin A thesis submitted in fulfilment of the requirements for the Master of Science Research degree University of Wollongong Faculty of Engineering 2012
4 ABSTRACT COMMISSIONING OF A NEW TOTAL BODY IRRADIATION TREATMENT PROTOCOL by Zoë Baldwin Centre for Medical Radiation Physics The current planning process for adult Total Body Irradiation (TBI) using the PLATO 2D treatment planning system (TPS) at the Royal Brisbane and Women s Hospital is cumbersome; it does not adequately simulate the treatment technique and a basic manual calculation is used to account for the effects of heterogeneities. A new treatment delivery technique is proposed; this thesis addresses the commissioning of this new regimen, including the acquisition of dosimetric data under treatment conditions to quantify the accuracy achievable by performing dose calculations using Oncentra MasterPlan TPS for this new treatment technique. Two treatment planning calculation algorithms (a pencil beam and a collapsed cone) and a total of five separate beam models (four of which were formulated specifically for TBI) were examined. Comparisons were made between calculated and measured data, which include percentage depth dose (PDD) values, profiles, an output factor, doses within homogeneous waterequivalent phantoms and doses within anthropomorphic phantoms.
5 TABLE OF CONTENTS Introduction Total Body Irradiation (TBI) Treatment planning Calculation algorithms Pencil Beam (PB) Collapsed Cone (CC) Dosimetric verification with phantoms Considerations in the design of a TBI programme Complications and Organs At Risk (OAR) Compensation Technique and patient set-up Patient set-up Complex patient set-up Beam energy Dose build-up Treatment Planning System (TPS) data Commissioning of TBI TPS Calculations...23 Confirmation of beam remodelling and data requirments PHASE I Initial investigation Patient positioning Dosimetric verification Small cubic phantom PDD acquisition PDD for MLC-delineated Collimator 45 beam PDD comparison for MLC-delineated Collimator 45 beam PDD acquisition for Collimator 0, 40 cm x 25 cm field PDD comparison for Collimator 0, 40 cm x 25 cm field Absence of build-up screen Bolus density settings Acquisition of beam profile free in air Comparison of in air-profiles Cable signal Simple solid water phantom Simple solid water phantom comparison Thorax phantom data acquisition Thorax phantom comparison Anthropomorphic phantom data acquisition Anthropomorphic phantom comparison Outcomes Nucletron data submission...55 Data model validation PHASE II...57 ii
6 3 Dosimetric verification Output Factor PDD Model Model Model Model Profiles Model Model Model Model Simple phantom comparison Measurement consistency investigation Thorax Phantom Comparison Anthropomorphic Phantom TLD variation investigation TLD calibration at ESSD...81 Discussion and Conclusion Project Overview Discussion PDDs Beam profiles measured in air Output factor Thorax phantom Simple phantom Anthropomorphic phantom General Discussion Conclusion and Future Work...90 Appendix Appendices Phase 1 Pencil Beam TLD Results Phase 1 Collapsed Cone TLD Results Anthropomorphic phantom TLD comparison Anthropomorphic phantom TLD (results corrected for revised TLD calibrated in large phantom) comparison...97 References...99 iii
7 ACKNOWLEDGMENTS I would like to acknowledge my supervisors, Prof Anatoly Rozenfeld, Mr Robert Fitchew, Dr Philip Back and Mr Darren Cassidy, for their generous support and guidance, without which this project would not have been possible. I would like to thank the radiation oncology physics team and the total body irradiation radiation therapist working group at RBWH CCS (past and present) for their assistance and patience during the completion of this project. I would like to thank my parents for always supporting me in every aspect of my life. Finally I would like to thank my partner, for his dedicated patience, understanding and un-wavering support. iv
8 ABBREVIATIONS AAPM American Association of Physicists in Medicine ABUR After Build-Up Region ACPSEM Australasian College of Physical Scientists and Engineers in Medicine BMT Bone Marrow Transplant BUS Build Up Screen CAX Central Axis (of beam) CCS Cancer Care Services CCE Collapsed Cone Enhanced (calculation algorithm) CT Computed Tomography DVH Dose Volume Histogram ESSD Extended Source to Surface Distance IBUR In Build-Up Region ICRU International Commission on Radiation Units and Measurements IMRT Intensity Modulated Radiation Therapy MU Monitor Units OAR Organ At Risk OMP Oncentra MasterPlan PBE Pencil Beam Enhanced (calculation algorithm) PDD Percentage Depth Dose PTV Planning Target Volume v
9 RBWH Royal Brisbane and Women s Hospital RT Radiation Therapy SSD Source to Surface Distance SCD Source to Chamber Distance TBI Total Body Irradiation TLD Thermoluminescent Dosimeter TPS Treatment Planning System u A Type A standard uncertainty vi
10 LIST OF FIGURES Figure 1: An image of a digitised axial CT slice from the Plato 2D TPS, in which the lungs and spine have been outlined, however the true relative electron density (or physical density) from the CT data are not used in the Plato 2D dose calculation; default nominal values are used instead...3 Figure 2: The simulation position for the current treatment planning protocol, which will be used as the simulation and treatment position for the proposed new treatment technique...4 Figure 3: Lateral view of the current treatment set-up at the RBWH. The yellow lines indicate the 6 slice positions for the current treatment technique...4 Figure 4: An axial view of a treatment plan as displayed in Plato 2D. Note the bulk density corrections have been applied...11 Figure 5: A jig used to hold the lead sheets employed in head shielding in TBI...12 Figure 6: A simulation film taken of a patient for the lung compensator design; this image is compared with a film taken at each treatment fraction for confirmation of treatment position...13 Figure 7: Chest plane from TBI plan, indicating the position of the bolus and its use in the treatment plan at RBWH...14 Figure 8: Bolus used in a TBI treatment for both contour compensation and as a patient positioning aid...14 Figure 9: Lateral view of the current semi-reclining treatment position...16 Figure 10: The proposed new supine treatment position...18 Figure 11: Demonstration of how the new technique can be utilised to treat tall adult patients (pictured is a 194 cm patient ), the treatment field is indicated by the white line and the dimensions of the BUS indicated by the green line...19 Figure 12: The simple small cubic solid water phantom consisting of Gammex RMI 457 solid water slabs...27 Figure 13: Dose plotted as a function of depth (corrected for effective point of measurement) in a 20 cm cubic solid water phantom, with and without the BUS...29 Figure 14: The PTW MP3 water tank used in the acquisition of the PDD data...30 Figure 15: The phantom arrangement used to acquire the build-up region measurements for the PDD...31 Figure 16: The PDDs acquired at the patient plane in a large water tank at 380 cm SSD using the field delineated by the MLCs with a collimator angle of 45º. The plot labelled CAX was acquired 7 cm directly below the beam central axis (CAX); the other plot was acquired 43 cm away from the CAX plot in the gun-target direction...32 vii
11 Figure 17: Treatment plan configuration for the case of the PDD taken 7 cm directly below the beam axis in a 40 cm x 25 cm field...33 Figure 18: Treatment plan configuration for the case of the PDD taken 7 cm below the beam axis and 43 cm towards the target in a 40 cm x 25 cm field...33 Figure 19: The PDDs acquired at the patient plane in a large water tank at 380 cm SSD using the field delineated by the jaws only with a collimator angle of 0º. The plot labelled CAX was acquired 7 cm directly below the beam central axis (CAX); the other plot was acquired 43 cm away from the CAX plot in the gun-target direction...34 Figure 20: The comparison of the PDDs measured 7 cm below the central axis and calculated by the treatment planning system in the absence of the BUS using both the pencil beam and collapsed cone algorithms, normalised to 10 cm depth...35 Figure 21: The comparison of the PDDs measured 43 cm away from the central axis and calculated by the treatment planning system in the absence of the BUS using both the pencil beam and collapsed cone algorithms, normalised to 10 cm depth...36 Figure 22: The comparison of the PDDs measured on the central axis and those produced by the treatment planning system using the collapsed cone algorithm, normalised to a depth of 10 cm, with three different density values applied...38 Figure 23: The comparison of the PDDs measured on the central axis and those produced by the treatment planning system using the pencil beam algorithm, normalised to a depth of 10 cm, with three different density values applied...38 Figure 24: The y-axis profile obtained in air with a build-up cap with 50% of the central dose occurring at ±80 cm...40 Figure 25: The y-axis profile normalised at the central axis position, calculated by the Collapsed Cone and Pencil Beam algorithms as compared with that measured...41 Figure 26: The simple solid water phantom replicated in the TPS for the 14 cm separation arrangement...44 Figure 27: Transverse view of the thorax phantom as set-up on the treatment bed. The mid-plane of the phantom is positioned 400 cm from the source (as indicated by the laser). The chamber is in the chamber cavity in the lung on the beam entrance side...46 Figure 28: A beam s eye view of the thorax phantom behind the BUS on the treatment couch...46 Figure 29: The treatment plan produced by OMP from a CT scan of the thorax phantom...47 Figure 30: The anthropomorphic phantom arrangement used in this investigation on the treatment bed. Lasers are used to align the phantom in the same manner as for a patient undergoing treatment...49 viii
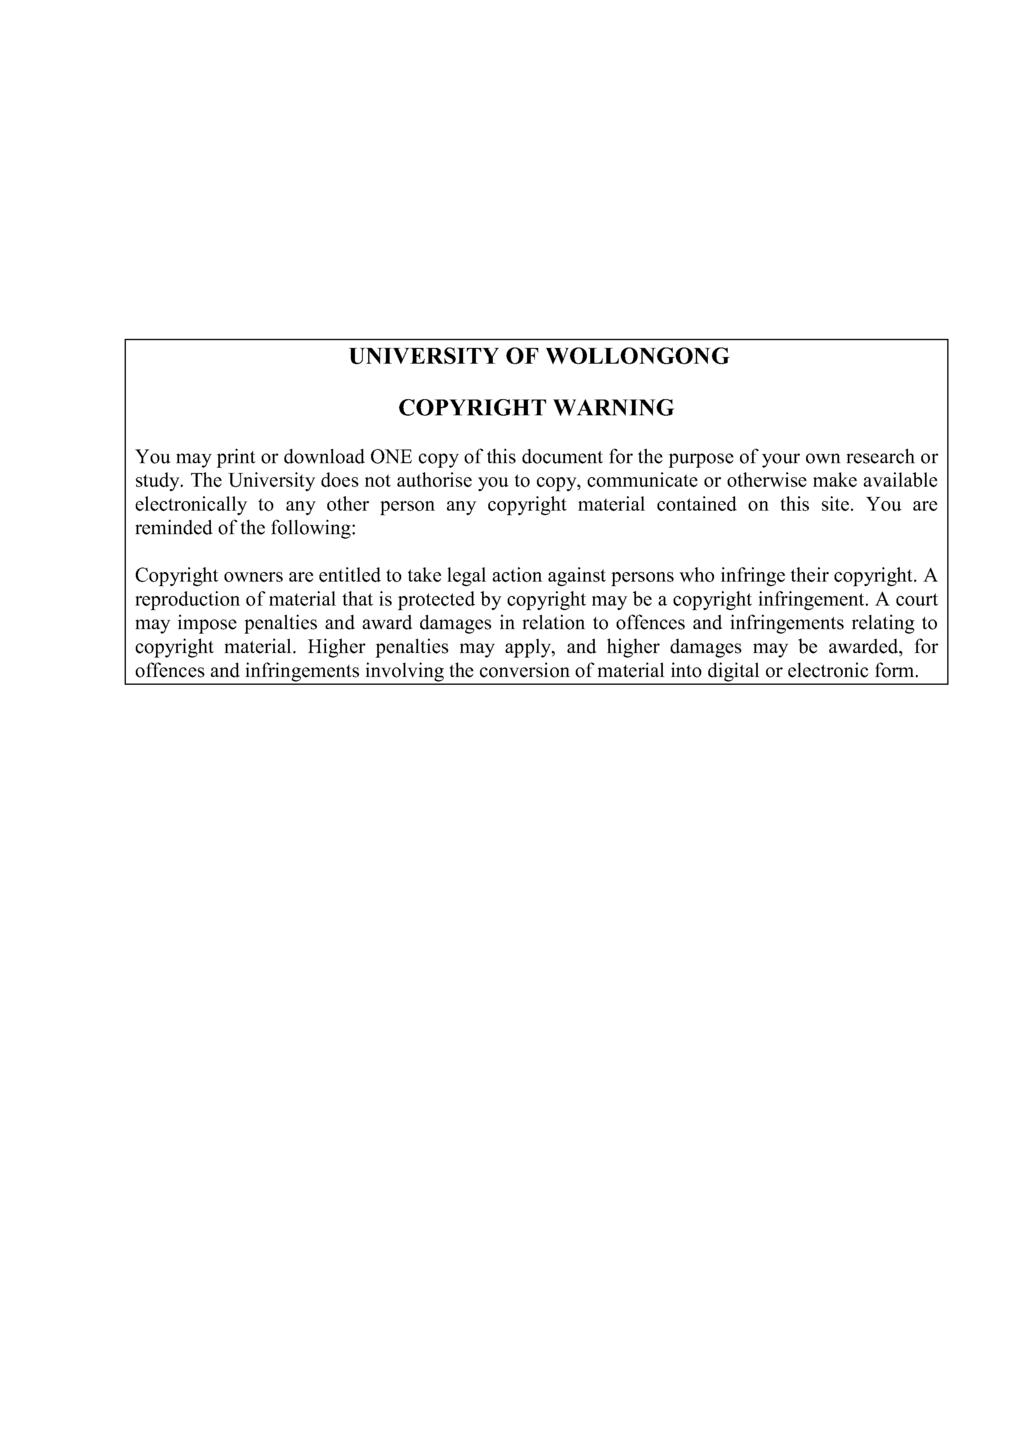
12 Figures 31. a), b) c): Photos taken of a subset of the sections within the anthropomorphic phantom in which TLDs were placed to acquire dosimetric data...50 Figure : CT slices of the anthropomorphic phantom, showing the individual TLD positions within the phantom. The beam direction as it appears in the above figures is from the right. The percentage difference between doses at the TLD positions calculated by the collapsed cone and pencil beam algorithms and the corresponding measured doses are shown in blue and red respectively...54 Figure 33: The water phantom used to acquire the output factor. Solid water, Perspex and plastic water are used to provide lateral scatter...56 Figure 34: PDD as calculated at 7 cm below the CAX by the pencil beam algorithm for each treatment beam model for a 40 cm x 25 cm field normalised to the maximum dose, in a large volume water phantom...60 Figure 35: PDD as calculated at 7 cm below the CAX by the collapsed cone algorithm for each treatment beam model for a 40 cm x 25 cm field normalised to the maximum dose, in a large volume water phantom...60 Figure 36: PDD as calculated at 7 cm below and 43 cm lateral to the CAX by the pencil beam algorithm for each treatment beam model for a 40 cm x 25 cm field normalised to the maximum dose...61 Figure 37: PDD as calculated at 7 cm below and 43 cm lateral to the CAX by the collapsed cone algorithm for each treatment beam model for a 40 cm x 25 cm field normalised to the maximum dose...62 Figure 38: Treatment beam model PDD as calculated by the pencil beam algorithm for a 10 cm x 10 cm field normalised at dmax rather than the 40 cm x 25 cm field, showing better agreement with the measured PDD for the 40 cm x 25 cm field for models 2 and Figure 39: Treatment beam model PDD as calculated by the collapsed cone algorithm for a 10 cm x 10 cm field normalised at dmax rather than the 40 cm x 25 cm field, showing better agreement with the measured PDD for the 40 cm x 25 m field for models 2 and Figure 40: Profiles as calculated at 7 cm below the CAX by the pencil beam algorithm for each treatment beam model for a 40 cm x 25 cm field normalised to the central position...69 Figure 41: Profiles as calculated at 7 cm below the CAX by the collapsed cone algorithm for each treatment beam model for a 40 cm x 25 cm field normalised to the central position...70 Figure 42: PDD as calculated by the pencil beam algorithm for each treatment beam model for a 40 cm x 25 cm field normalised to the depth of 10 cm...77 Figure 43: PDD as calculated by the collapsed cone algorithm for each treatment beam model for a 40 cm x 25 cm field normalised to the depth of 10 cm...78 Figure 44: The graph displaying the average, minimum and maximum percentage deviations of the TPS calculated doses from the TLD doses for Pencil Beam calculations...79 ix
13 Figure 45: The graph displaying the average percentage deviations of the TPS calculated doses from the TLD doses for Collapsed Cone calculations...80 Figure 46: The anthropomorphic/ solid water phantom arrangement used in the TLD accuracy and linearity investigation...81 Figures : CT slices of the anthropomorphic phantom, showing the individual TLD positions within the phantom. The percentage differences from the TLD of doses calculated by collapsed cone and pencil beam algorithms are shown in blue and red respectively for model 0. The TLDs were calibrated in a large phantom at ESSD...84 Figure 48: The graph displaying the average, minimum and maximum percentage deviations of the TPS calculated doses from the recalibrated TLD doses for PBE calculations...85 Figure 49: The graph displaying the average, minimum and maximum percentage deviations of the TPS calculated doses from the recalibrated TLD doses for CCE calculations...85 x
14 LIST OF TABLES Table 1: The gamma analysis results comparing the measured PDD and the Pencil Beam algorithm PDD with 10 % or 2 % and 1 mm distance to agreement. Regions of interest include the In Build-Up Region (IBUR), After Build-Up Region (ABUR) (range from dmax to 300 mm) and the user defined region (range 1 mm to 500 mm)...35 Table 2: The gamma analysis results comparing the measured PDD and the Collapsed Cone algorithm PDD with 10 % or 2 % and 1 mm distance to agreement. Regions of interest include the In Build-Up Region (IBUR), After Build-Up Region (ABUR) (range from dmax to 300 mm) and the user defined region (range 1 mm to 500 mm)...36 Table 3: The gamma analysis results comparing the 43 cm off axis measured PDD and Pencil Beam algorithm PDD with 10 % or 2 % and 1 mm distance to agreement. Regions of interest include the In Build-Up Region (IBUR), After Build-Up Region (ABUR) (range from dmax to 300 mm) and the user defined region (range 1 mm to 500 mm)...37 Table 4: The gamma analysis results comparing the 43 cm off axis measured PDD and the Collapsed Cone algorithm PDD with 10 % or 2 % and 1 mm distance to agreement. Regions of interest include the In Buildup Region (IBUR), After Build-Up Region (ABUR) (range from dmax to 300 mm) and the user defined region (range 1 mm to 500 mm)...37 Table 5: The results of gamma analysis performed to compare the Pencil Beam calculation of the profile and the measured data...41 Table 6: The results of gamma analysis performed to compare the Collapsed Cone calculation of the profile and the measured data...42 Table 7: The doses as measured by converting the charge collected in the simple solid water phantom to dose, where the standard uncertainty (u A ) is derived according to TRS398[72] as the standard deviation of the mean...43 Table 8: The comparison of doses calculated by OMP using the Model 0 data with the doses measured by the Farmer chamber in the simple phantom. The tabulated values are the percentages by which the calculated dose exceeds the measured dose...44 Table 9: The doses to water in cgy derived from the charge collected from the chamber in the central tissue plug, the spinal bone plug and the central lung plug on the entrance side of the beam. Each measurement was corrected for extra signal from cable irradiation...47 Table 10: The percentage difference between doses measured by the ionisation chamber in the tissue, lung and bone cavities and those calculated by the treatment planning system for 500 MU. A negative difference indicates a lower calculated dose than the measured dose...48 xi
15 Table 11: The average doses measured by the TLDs at each point of interest in the anthropomorphic phantom, including the mean average dose and the mean standard deviation of doses measured...51 Table 12: The dose at the reference point in cgy/mu calculated by the treatment planning system for each beam model and calculation algorithm for a 40 cm x 25 cm field defined at the linac isocentre...58 Table 13: The dose at the calibration point in cgy/mu calculated by the treatment planning system for each beam model and calculation algorithm for a 10 cm x 10 cm field defined at the linac isocentre. The measured calibration value was cgy/mu for a 40 cm x 25 cm field...58 Table 14: Percentage difference between dose at the calculation point in cgy/mu calculated by the treatment planning system for each beam model and calculation algorithm and the measured value of cgy/mu at the calibration point. A negative difference indicates a lower calculated dose than the measured dose...59 Table 15: The gamma analysis results comparing the measured PDD below the central axis and the PBE Model 1 PDD with 10% or 2% and 1 mm distance to agreement. Regions of interest include the In Build- Up Region (IBUR), After Build-Up Region (ABUR) (range from dmax to 300 mm) and the user defined region (range 1 mm to 500 mm)...62 Table 16: The gamma analysis results comparing the measured PDD below the central axis and the CCE Model 1 PDD with 10% or 2% and 1 mm distance to agreement, regions of interest include the In Build-Up Region (IBUR), After Build-Up Region (ABUR) (range from dmax to 300 mm) and the user defined region (range 1 mm to 500 mm)...63 Table 17: The gamma analysis results comparing the measured PDD 43 cm off axis and the PBE Model 1 PDD with 10% or 2% and 1 mm distance to agreement. Regions of interest include the In Build-Up Region (IBUR), After Build-Up Region (ABUR) (range from dmax to 300 mm) and the user defined region (range 1 mm to 500 mm)...63 Table 18: The gamma analysis results comparing the measured PDD 43 cm off axis and the CCE Model 1 PDD with 10% or 2% and 1 mm distance to agreement. Regions of interest include the In Build-Up Region (IBUR), After Build-Up Region (ABUR) (range from dmax to 300 mm) and the user defined region (range 1 mm to 500 mm)...63 Table 19: The gamma analysis results comparing the measured PDD below the central axis and the PBE Model 2 PDD with 10% or 2% and 1 mm distance to agreement. Regions of interest include the In Build- Up Region (IBUR), After Build-Up Region (ABUR) (range from dmax to 300 mm) and the user defined region (range 1 mm to 500 mm)...64 Table 20: The gamma analysis results comparing the measured PDD below the central axis and the CCE Model 2 PDD with 10% or 2% and 1 mm distance to agreement. Regions of interest include the In Build- xii
16 Up Region (IBUR), After Build-Up Region (ABUR) (range from dmax to 300 mm) and the user defined region (range 1 mm to 500 mm)...64 Table 21: The gamma analysis results comparing the measured PDD 43 cm off axis and the PBE Model 2 PDD with 10% or 2% and 1 mm distance to agreement. Regions of interest include the In Build-Up Region (IBUR), After Build-Up Region (ABUR) (range from dmax to 300 mm) and the user defined region (range 1 mm to 500 mm)...64 Table 22: The gamma analysis results comparing the measured PDD 43 cm off axis and the CCE Model 2 PDD with 10% or 2% and 1 mm distance to agreement. Regions of interest include the In Build-Up Region (IBUR), After Build-Up Region (ABUR) (range from dmax to 300 mm) and the user defined region (range 1 mm to 500 mm)...65 Table 23: The gamma analysis results comparing the measured PDD below the central axis and the PBE Model 3 PDD with 10% or 2% and 1 mm distance to agreement. Regions of interest include the In Build- Up Region (IBUR), After Build-Up Region (ABUR) (range from dmax to 300 mm) and the user defined region (range 1 mm to 500 mm)...65 Table 24: The gamma analysis results comparing the measured PDD below the central axis and the CCE Model 3 PDD with 10% or 2% and 1 mm distance to agreement. Regions of interest include the In Build- Up Region (IBUR), After Build-Up Region (ABUR) (range from dmax to 300 mm) and the user defined region (range 1 mm to 500 mm)...66 Table 25: The gamma analysis results comparing the measured PDD 43 cm off axis and the PBE Model 3 PDD with 10% or 2% and 1 mm distance to agreement. Regions of interest include the In Build-Up Region (IBUR), After Build-Up Region (ABUR) (range from dmax to 300 mm) and the user defined region (range 1 mm to 500 mm)...66 Table 26: The gamma analysis results comparing the measured PDD 43 cm off axis and the CCE Model 3 PDD with 10% or 2% and 1 mm distance to agreement. Regions of interest include the In Build-Up Region (IBUR), After Build-Up Region (ABUR) (range from dmax to 300 mm) and the user defined region (range 1 mm to 500 mm)...66 Table 27: The gamma analysis results comparing the measured PDD below the central axis and the PBE Model 4 PDD with 10% or 2% and 1 mm distance to agreement. Regions of interest include the In Build- Up Region (IBUR), After Build-Up Region (ABUR) (range from dmax to 300 mm) and the user defined region (range 1 mm to 500 mm)...67 Table 28: The gamma analysis results comparing the measured PDD 43 cm off axis and the PBE Model 4 PDD with 10% or 2% and 1 mm distance to agreement. Regions of interest include the In Build-Up Region (IBUR), After Build-Up Region (ABUR) (range from dmax to 300 mm) and the user defined region (range 1 mm to 500 mm)...67 xiii
17 Table 29: The results of gamma analysis performed to compare the Pencil Beam calculation of the profile and the measured data for Model Table 30: The results of gamma analysis performed to compare the Collapsed Cone calculation of the profile and the measured data for Model Table 31: The results of gamma analysis performed to compare the Pencil Beam calculation of the profile and the measured data for Model Table 32: The results of gamma analysis performed to compare the Collapsed Cone calculation of the profile and the measured data for Model Table 33: The results of gamma analysis performed to compare the Pencil Beam calculation of the profile and the measured data for Model Table 34: The results of gamma analysis performed to compare the Collapsed Cone calculation of the profile and the measured data for Model Table 35: The results of gamma analysis performed to compare the Pencil Beam calculation of the profile and the measured data for Model Table 36: The percentage differences between the doses measured in the simple solid water phantom and those calculated using the PBE and CCE algorithms for all beam models investigated for the same phantom geometry and number of MU in OMP. The positive differences indicate higher calculated doses than the measured doses...73 Table 37: The percentage difference between doses measured by the ionisation chamber in the tissue, lung and bone and those calculated by the TPS for 500 MU, where the chamber cavity has been replicated in the TPS as being filled with water. The ionisation chamber readings have been corrected for cable signal. A negative difference indicates lower calculated dose than the measured dose...76 Table 38: The results of the comparison of TLD dose measurements in the anthropomorphic/ solid water phantom with doses measured by the ionisation chamber...82 Table 39: The doses in cgy measured with TLDs within the anthropomorphic phantom and comparison with the existing beam model (model 0) doses calculated by the Pencil Beam algorithm in OMP. The % diff TLD is the percentage by which the calculated dose exceeds the measured dose...93 Table 40: The doses in cgy measured with TLDs within the anthropomorphic phantom and comparison with the existing beam model (model 0) doses calculated by the Collapsed Cone algorithm in OMP. The % diff TLD is the percentage by which the calculated dose exceeds the measured dose...94 Table 41: The doses calculated using the PBE algorithm for each beam model, at each TLD position, and a comparison with the doses measured by the TLDs. For each model, the first column shows the calculated dose in cgy for 1000 MU, and the second column shows the percentage deviation of that dose from the TLD-measured dose at that point for the same number of MU...95 Table 42: The doses calculated using the CCE algorithm for each beam model, at each TLD position and a comparison with the doses xiv
18 measured by the TLDs. For each model, the first column shows the calculated dose in cgy for 1000 MU, and the second column shows the percentage deviation of that dose from the TLD-measured dose at that point for the same number of MU...96 Table 43: The doses calculated using the pencil beam algorithm for all models and the percentage differences between the measured and calculated values. For each model, the first column shows the calculated dose in cgy for 1000 MU, and the second column shows the percentage deviation of that dose from the revised TLD-measured dose at that point for the same number of MU...97 Table 44: The doses calculated using the Collapsed Cone algorithm for all models and the percentage differences between the measured and calculated values. For each model, the first column shows the calculated dose in cgy for 1000 MU, and the second column shows the percentage deviation of that dose from the revised TLD-measured dose at that point for the same number of MU...98 xv
19 C hapter 1 INTRODUCTION 1.1 Total Body Irradiation (TBI) Total Body Irradiation is a treatment technique that involves the irradiation of the whole body. Several disorders where the entire body requires treatment have been proven to respond to TBI, including lymphomas[1-3], leukemias[4-6] and aplastic anaemia[7]. In situations where an allogeneic bone marrow transplant (BMT) or stem cell transplant is prescribed it is common for such patients to undergo TBI in combination with chemical therapy as part of a pre-transplant cytoreductive conditioning process[8, 9]. TBI yields two beneficial outcomes in this process: firstly in the destruction of cancerous cells (also an outcome of the chemotherapy) and secondly in the suppression of the immune system to combat any rejection of transplanted bone marrow[10]. Although this preparatory regimen for BMT has evolved from TBI alone, the combination with chemical therapy agents has proven much more effective. Advantages of TBI are that no organ is unintentionally spared and there are no sanctuary sites, as the dose is homogeneous throughout and independent of blood supply[11]. The radiation dose is not affected by any detoxification or excretion and if desired the dose distribution may be adjusted through the use of partial compensators for the radiosensitive normal tissues, and boosts may be prescribed for the radio-resistant regions. As in all forms of patient therapy, in TBI it is desirable to achieve the maximum possible therapeutic ratio[12] providing greater disease control and minimal normal tissue toxicity. The radiation induced toxicity of normal tissue is a major limiting factor in the effectiveness of total body irradiation. Clift et al[5] demonstrated the fine line between an improvement in tumour control/ immuno-suppression and the transplant-related complications for different irradiation regimens. A lower relapse rate for one regimen translates to an improved long term survival, but with an increased risk of early mortality resulting from increased acute toxicity.
20 1.2 Treatment planning The use of Computed Tomography (CT)-based treatment planning systems in conventional external beam radiation therapy is well established[13-16]. The tomographic data provides the necessary information for the treatment planning system to determine the patient s external contour, to calculate the transmission and absorption of the radiation in external beams, and hence to display the distribution of absorbed dose within the patient. The CT data set which provides details of external contour, geometry of the internal organs and their composition, constitutes a suitable base from which to calculate the effect of tissue heterogeneities. Conventional external beam radiotherapy is conducted at a nominal isocentric distance of 100 cm (often referred to as 100 cm Source-Axis- Distance); treatment techniques are described as extended SSD when the source to surface distance (SSD) is greater than 100 cm. CT-based TBI treatment planning is less common. Because of the complex nature of an extended SSD total body irradiation, Hui [17] investigated the accuracy of a CT-based treatment planning system (Pinnacle ), finding that the use of CT data provides the necessary anatomical and density information that ultimately results in a more accurate dose calculation for TBI. This is especially important for the lung dose (an organ at risk), where compensation is required to achieve the desired uniformity, and the CT data can assist in compensator design. A Dose Volume Histogram (DVH) generated using the CT data can provide homogeneity indexes for organs at risk (OAR) as well as the Planning Target Volume (PTV). Plato 2D (Nucletron, Veenendaal, The Netherlands) - the treatment planning system currently used for planning TBI treatments at the Royal Brisbane and Women s Hospital (RBWH)- utilises 6 slices of CT data for the purpose of determining the location of the kidneys and lungs (organs at risk) (see figure 3). The lung is outlined and a bulk density correction (of 0.33 for adults and 0.41 for children) is applied. All other anatomical structures are assigned a relative density of 1 (water). The external patient contours obtained from the CT slices are used to account for the contour variation of the patient (see figure 1). The technique is time consuming and does not reflect the dose to all 2
 from the CT")
21 pertinent organs, nor the treatment position as the patient is simulated in a more supine position (see figure 2) than the semi-reclining position used for treatment. Figure 1: An image of a digitised axial CT slice from the Plato 2D TPS, in which the lungs and spine have been outlined, however the true relative electron density (or physical density) from the CT data are not used in the Plato 2D dose calculation; default nominal values are used instead. The Plato 2D software is no longer supported by the manufacturer and therefore the use of a new treatment planning system was proposed as the basis of a new TBI protocol. Oncentra MasterPlan (OMP) (Nucletron, Veenendaal, The Netherlands) is also a CTbased planning system that utilises helical CT data and is currently used for treatment planning of all other three-dimensional conformal radiotherapy (3D-CRT) treatments at the RBWH. In OMP, a 3D density matrix derived from pixel CT number values from CT images or from user-specified density values assigned to regions of interest is generated, and this is used by one of two well established[13, 18-22] calculation algorithms to calculate doses to the patient,. 3


22 Figure 2: The simulation position for the current treatment planning protocol, which will be used as the simulation and treatment position for the proposed new treatment technique. Figure 3: Lateral view of the current treatment set-up at the RBWH. The yellow lines indicate the 6 slice positions for the current treatment technique. The prescribed doses range from 5 to 14 Gy delivered in up to 8 fractions, generally twice daily. At RBWH doses for both paediatric and adult TBI are prescribed at the midpoint 4
23 behind the umbilicus. Dose limits for the critical organs are often included in the prescription. 1.3 Calculation algorithms Each commercial treatment planning system provides a selection of photon beam treatment planning algorithms. Two algorithms available in Oncentra Masterplan for photon beam treatment planning are Pencil Beam and Collapsed Cone. The same EGS4 Monte Carlo code proposed by Mackie et al [23] is used as the basis of the point dose kernel for both algorithms. This point kernel is later used to obtain a pencil kernel (for the pencil beam algorithm) through discrete integrations over the depth of calculations. The accuracy and limitations of both calculation models have been investigated[19, 20, 22, 24-32]. Oncentra Masterplan - unlike other commercially available treatment planning systems - does not allow the user (physicist) to tweak the Monte Carlo generated energy spectrum derived from the measured data. Instead this tweaking or beam characterisation is conducted by the manufacturer off-site, based on the measured data supplied by the user. The dose calculation engine in OMP calculates the dose per incident energy fluence, based on energy deposition kernels and combines this with calculated incident energy fluence for the specified beam. The energy deposition kernel describes the dose response to an incident radiation beam in water. For dose calculations the beams are treated separately and the energy fluence exiting the treatment machine per beam is calculated as an initial step of the dose calculation. The transport and dose deposition of the secondary particles is taken into account by way of a pencil kernel for the pencil beam algorithm or a point kernel for the collapsed cone algorithm Pencil Beam (PB) This algorithm as implemented in OMP was originally proposed by Ahnesjö[32] and utilises a particular technique to calculate the transport of photons and electrons and deposition of dose. As the name suggests it is based on a pencil beam. For volumetric integrations, the pencil beam is parameterised every 2.5 mm along the propagation direction to a maximum of mm. The actual beam is divided into a discrete grid of 5
24 infinitesimally narrow beams (pencils) which originate at the beam s virtual source. Equivalent path length corrections are applied to manage any regions of heterogeneity for the primary dose contribution; however this does not take account of lateral transport of secondary particles in heterogeneous media. A 1-dimensional convolution is applied along fan lines with an exponential function to manage the scattered radiation[32-34]. The dose at any point of interest is the result of the summation of the dose contributions from each pencil beam. Heterogeneity corrections are performed by simply scaling the dose spread function using the physical density in the path to save calculation time rather than including density scaling for lateral heterogeneities. A decrease in the calculation accuracy in regions where lateral electronic equilibrium is not present (where lung and air regions are present) is the result of this simplification of the lateral transport of secondary particles in the dose calculation. The penumbral widening observed in regions of low density (such as lung) is not well predicted when using the pencil beam algorithm (the implementation of which in OMP is known as Pencil Beam Enhanced PBE) Collapsed Cone (CC) Collapsed cone algorithms are gaining in popularity; as they provide a superior dose calculation for regions where lateral charged particle equilibrium does not hold, such as in lung and where the beam overshoots the patient s body. The collapsed cone convolution algorithm implemented in Oncentra Masterplan was first proposed by Ahnesjö[35]. It involves apportioning all the energy released into coaxial cones of equal solid angles about the point of interaction. The direct energy fluence and the head scatter energy fluence are portioned into point kernels which describe the primary and scattered absorbed doses. The dose at each point is obtained from interpolation in the 3D calculation grid. For heterogeneities the radiological path length (as calculated from the density matrix) along each cone axis replaces the geometrical path length. A limitation of the implementation of the collapsed cone algorithm (known as Collapse Cone Enhance CCE) in OMP is in the voxelisation of the calculation. In the case of the pencil beam algorithm the voxel calculation size is determined by the user, however in the interest of calculation efficiency the collapsed cone algorithm employs a finite number of voxels and as a result where the volume is large (such as in the case of full body CT) the voxel size may be too large to produce a dose distribution with high spatial resolution. This would limit the extent to 6
25 which small variations in the patient density or external contour would be handled by the TPS calculation. A too coarse voxel size would be one that gives rise to significant errors in reconstructing the positions of or dose distributions within OARs or targets. For TBI voxel sizes of 5 mm or less should be satisfactory given the size of the OARs and the PTV (the whole body). 1.4 Dosimetric verification with phantoms The dose distribution of a clinical treatment may be inferred from measurements made in a phantom. The term phantom refers to a material that is used to simulate the scattering and absorption of radiation in tissue. Phantoms commonly consist of water, which has similar absorption properties to muscle and soft tissue, however solid substances, such as Plastic Water [36] have been manufactured to also replicate the same properties. Measurements of dose are made with dosimeters, the most commonly used type of which in radiotherapy physics is the ionisation chamber, with various designs available[37-39]. A common type of ionisation chamber (or ion chamber) consists of a conductive wall surrounding a cylindrical gas-filled cavity within which is a centrally placed collecting electrode. When a voltage is applied between this electrode and the wall, ions created in the active volume by incident ionising radiation are attracted to the electrode and the collected charge recorded by an electrometer. The primary measurement quantity is mass ionisation (C/kg), the ionisation Q (C) per unit mass m (kg) of gas in the chamber, which is related to dose (J/kg) to the gas in the chamber D gas by the mean energy required to produce one ion pair W (J). W/e (J/C) is then the mean energy expended per unit charge produced, where e is the electronic charge (C), leading to the following equation: D Gas = Q m W e The gas is most commonly air; more dense gases are sometimes used to increase sensitivity by increasing the ionisation density within the volume[38]. One primary requirement under which most radiotherapy dosimetry measurements are made is that in a phantom the chamber is assumed to be small enough so as not to significantly perturb the radiation field within the phantom. In such situations the charge produced and collected 7
26 in the chamber volume is proportional to the dose delivered (at the same point in the absence of the chamber itself) to the phantom medium, from which the energetic electrons producing the gas ionisation come in a megavoltage beam. Thus the dose to the surrounding medium is given by the Bragg-Gray equation[39]: D Med = DGasSMed, Gas Where S med,gas is the ratio of the mean mass stopping power of the energetic electrons in the phantom medium and in the gas. For indirectly ionising radiation such as high energy photons the contribution of any primary radiation to the ionisation events in the chamber may be ignored. Since the theory assumes that all the measured ionisation is produced by energetic electrons liberated by the photons in the surrounding phantom material, the wall and other solid material of the chamber need to be similar to the phantom material and the wall of chamber needs to be sufficiently thin, to ensure that almost all of the electrons producing the charge measured have effectively been generated in the phantom. Deviations from strict Bragg-Gray cavity conditions are dealt with by the use of perturbation factors. In practice ion chambers are calibrated to provide chamber specific conversion coefficients which enable a direct conversion from measured charge to dose to water. Thermoluminescent Dosimeters (TLDs) have been used for in-vivo dosimetry[12, 14, 40]. TLDs provide a means of acquiring quick in-vivo measurements for radiotherapy and are commonly used to verify the dose delivered to the eye when treating the head. Many radiotherapy centres utilise TLDs for in-vivo measurement of superficial doses in total body irradiation cases. There is a variety of TLDs available today, the most common compositions being lithium fluoride, lithium borate and calcium fluoride, of which lithium fluoride is the most widely used[41]. The most commonly used TLD in a radiotherapy department is the Harshaw Chemical Company LiF TLD-100 made in the form of a small disk. A TLD s dose response may be described as the thermoluminescent output per unit of absorbed dose in the phosphor and under certain conditions the dose response curve of the LiF (TLD- 100) is linear up to 10 3 cgy and supralinear beyond this point[12]. The TLDs can be calibrated so that their response is related to absorbed dose to water under 8
27 reference conditions (i.e. calibrated against an ion chamber). Metcalfe[12] outlines a cheap and easy method for packaging TLD chips for clinical in-vivo measurements. Each centre usually develops its own procedures for acquiring and processing TLD measurements (which may include pre-irradiation annealing, post-irradiation annealing and a particular heating program during the readout process). If these procedures are adhered to correctly, they lead to accurate and consistent dose measurements and an uncertainty equal to 1 standard deviation of the mean value. The Australasian College of Physical Scientists and Engineers in Medicine (ACPSEM)[15] recommends a calibration of the TLDs to be undertaken with every measurement and a linearity check to be completed following the initial use of each mode used or after a malfunction or repair of the TLD equipment. Ionisation chambers and TLDs were used extensively in the work presented in this thesis. 1.5 Considerations in the design of a TBI programme Historically TBI has been given as a single fraction, however the radiation induced side effects can be better managed under a fractionated regimen, based on radiobiological principles of preferential normal tissue repair[12]. Fractionation allows the prescription of a higher total dose and improvement in the long term survival. Research by Deeg[42], Cosset[43] and Cosset[44] has shown fractionated TBI can produce a better therapeutic ratio than a non-fractionated scheme. According to Cox[45] the most common regimens are 12 Gy given in six fractions over 6 days or twice a day over three days. The aim of TBI is the ablation of bone marrow and the destruction of circulating leukemic cells; since these are widely distributed throughout the body, the target for TBI treatments is the entire body. The achievement of uniform dose throughout the patient in TBI is a challenge; an overdose to any critical organs will increase the toxicity while an underdose to the target will increase the risk of relapse. A region of low density results in higher dose within and beyond the low density region, as a result of the reduced attenuation of the beam as it travels through the low density medium. The works of Keane et al[46] and Van Dyk et al[47] have shown that a change of 5% in the dose to lung could result in a 20% change in the incidence of pneumonitis, a complication potentially fatal for a whole lung irradiation. 9
28 Khan[36] discusses the clinical achievement of a high dose uniformity in TBI, accepting dose uniformity along the body axis of ±10%, with extremities and certain non-critical structures receiving higher doses, in agreement with AAPM report 17[8]. As survival rates have increased for patients treated with total body irradiation, the investigation of long term side effects and the quality of life has become more significant clinically. In TBI, treatment parameters prescribed such as the total dose, the fractionation regimen[43, 44] and dose rate[48], are influenced by the possible toxicity to sensitive organs and normal tissues such as lungs and kidneys. Consequently the accuracy attainable in TBI treatment planning and dose delivery is a factor limiting the application of certain techniques. The International Commission on Radiation Units and Measurements (ICRU)[49, 50], recommends that the overall accuracy in the dose delivery of external beam radiation therapy be ±5% and that the dose range within the target volume not exceed -5% to +7% of the reference dose. However the American Association of Physicists in Medicine (AAPM) Task Group 29[8] suggests that a 5% accuracy could be unachievable in TBI, but if the prescribed dose falls far below the onset of normal tissue toxicity levels then a 5% accuracy may be relaxed. 1.6 Complications and Organs At Risk (OAR) In radiation therapy, to achieve the desired result, the destruction of cancerous cells needs to occur without excessive destruction of normal tissues. Certain organs and tissues are more radiosensitive than others and become a limitation when treating patients with radiation therapy. It is important to limit the radiation dose to such organs so as to avoid undesirable outcomes such as pulmonary toxicity. In TBI the entire body is irradiated and as a result a number of critical structures can be considered organs at risk. Limitations to the effectiveness of TBI in the conditioning process exist, the most notable limitation being the normal tissue tolerance of certain organs, such as the lungs, kidneys and eyes[8, 13, 14, 18]. Each of these is associated with a higher tissue complication factor which results in a greater likelihood of cumulative toxicity than other organs with lower complication factors[14]. In the prescribing and planning of TBI, it is important to develop the appropriate procedures to protect these 10
29 organs at risk. The most concerning OAR is the lung, the associated complications for which are one of the major causes of mortality following total body irradiation[18]. Figure 4: An axial view of a treatment plan as displayed in Plato 2D. Note the bulk density corrections have been applied. 1.7 Compensation Compensation is used for tissue density heterogeneities, surface irregularities and overall separation variations. Because the large variations in body thickness and the presence of tissue heterogeneities in TBI would lead to considerable non-uniformity of the dose along the body, bolus and/or compensators are usually used to provide a much more uniform dose distribution throughout the body. Bolus material is often placed around the patient for support as well as contour compensation. In regions where the patient thickness is significantly reduced, tissue equivalent bolus may be added to achieve the required thickness. To account for variations in patient shape either tissue-equivalent bolus or tissue compensators should be employed. Although using the AP/PA treatment technique would reduce the amount of 11

30 the required lung tissue compensation, positioning of the arms to shadow the lungs in the bilateral treatment technique partially compensates for lack of tissue homogeneity, reducing the additional shielding and bolus needed for compensation[17, 51]. Bolus materials generally employed in clinical use are pliable, soft tissue equivalent and nontoxic. The equivalence refers to the volumetric electron density. A number of materials have been used[8, 52]; bolus material if placed under the legs in TBI can provide both added scatter and support during the treatment. Figure 5: A jig used to hold the lead sheets employed in head shielding in TBI. High density material such as lead is also utilised in the reduction of the intensity of incident radiation to regions of OAR (see figure 5). For the regions of low electron density such as the lung (a highly radiosensitive organ) the dose absorbed in the absence of compensation would be higher than the intended dose, due to the lower attenuation of the beam in the lung. Additional compensation to protect the lungs leads to an underdose of the bone marrow in the sternum. At RBWH a megavoltage photon isocentric boost is prescribed and delivered to the sternum at conventional SSD to address this issue. 12
 to reduce the dose to the head and lungs, positioned on a")

 with a measured relative electron density of 0.96 (compared to water).")
31 Figure 6: A simulation film taken of a patient for the lung compensator design; this image is compared with a film taken at each treatment fraction for confirmation of treatment position. The current technique at the RBWH uses lead sheets (the thickness of which is manually calculated based on measured transmission factors) to reduce the dose to the head and lungs, positioned on a build-up screen (BUS) with their exact placement determined and verified by film prior to each treatment. In addition bolus positioned adjacent to the regions of the abdomen under the arms is used to provide additional attenuation to reduce the dose to both the lungs and kidneys whilst also maintaining a relatively uniform external surface. Although the bolus materials have densities a little different from water, a bulk density of 1 g/cm 2 is used when outlining the bolus material. The majority of bolus material at used in TBI at RBWH is beeswax (see figure 8) with a measured relative electron density of 0.96 (compared to water). Thicknesses of this bolus used (up to 12 cm) are therefore unlikely to differ from water in their attenuation by more than the attenuation produced by 0.5 cm of water. This equates to ~1.3% dose error beyond the wax depth. For the current technique this could be an issue, however for the proposed technique the patient will be CT scanned with the bolus material in place and therefore taken into account in the TPS calculations. 13

32 bolus Figure 7: Chest plane from TBI plan, indicating the position of the bolus and its use in the treatment plan at RBWH. Figure 8: Bolus used in a TBI treatment for both contour compensation and as a patient positioning aid. 1.8 Technique and patient set-up There are a number of published techniques[9, 53-59] for the delivery of total body irradiation. Each technique attempts to achieve uniform dose throughout the body while not exceeding the tolerance dose to any OAR[14]. These techniques vary in the number and type of the radiation sources used. Where most techniques use beams provided by linear accelerators, use beams coming from multiple sources from several directions[36, 54]. A common and rather simple technique involves patients treated with opposing 14
33 fields at a fixed extended source to patient midline distance[36, 60], thereby employing large, uniform photon beams to ensure the entire body receives a uniform dose. Although it is possible to use multiple adjacent fields delivered at standard treatment distances (100 cm SAD) to achieve total body irradiation, the use of such a technique would result in complicated patient treatment set-ups and field junctions which introduce non-uniformity and uncertainty in the dose distribution[36]. A further problem in using this technique for TBI is that while the aim is to deliver radiation to the entire body, cells circulating through the body may receive a reduced dose as a result of delivering smaller fields separately. Thus an extended SSD treatment using opposed fields, which can easily be implemented, is usually preferred if the treatment room is sufficiently large. To achieve a field size large enough to encompass an adult human, the geometric divergence of the beam from the source is utilised, which results in a required source to patient mid-sagittal distance of 3 to 5 meters. Current conventional linear accelerators are often used in large bunkers and as a result can apply a broad lateral horizontal beam (with a gantry angle of 90º or 270º), with the maximum field size typically 40 cm x 40 cm (as defined at 100 cm from the x-ray source), which diverges to 160 cm x 160 cm at 400 cm from the source. The patient is set up at this distance with their mid-sagittal plane perpendicular to the beam axis. The correct location of the mid-sagittal plane (patient midline) is indicated by a ceiling-mounted laser. A collimator angle of 45º may be used to take advantage of the longest available field dimension, which is 200 cm along the diagonal at 400 cm from the source (the linac s primary collimator limits the maximum field diameter to 50 cm at 100 cm form the source). The opposing lateral field is achieved by rotating the patient couch through 180º about a vertical axis. The technique currently employed at RBWH utilises a conventional linear accelerator (Elekta Precise ) delivering opposed lateral beams of 10 MV, with a BUS to avoid skin sparing. 15

34 Figure 9: Lateral view of the current semi-reclining treatment position. Another advantage of performing the TBI treatment at an extended SSD is the consequent reduction in dose rate to the patient which should be below 10 cgy/min to prevent any dose rate related toxicity[48, 61]. This reduction occurs as a result of the inverse square law. However if the dose rate is still not sufficiently low at the position of the patient, a further reduction is required (achieved by decreasing the pulse repetition rate of the linear accelerator). With the application of a decreased dose rate, an increase in the treatment time results and the use of immobilisation devices may be necessary for certain treatment protocols Patient set-up In the case of extended SSD single source treatments, patients may be treated lying supine with lateral beams; or standing[9, 62] or seated or lying on their side treated with an anterior and a posterior beam[57]; in all instances it is necessary to rotate the patient in order to obtain dose uniformity via an effective parallel opposed pair of beams. In the cases where the maximum achievable field size is not sufficiently large, the patient s legs may be bent to reduce the overall length of the patient. Some techniques achieve this by treating the patient seated in a custom chair; however such a treatment position may 16
35 not be replicated in the CT simulation, which can result in a reduction in the calculation accuracy of the treatment planning process. In departments that have a sufficiently large bunker it is common for patients to be treated lying supine on a bed. This has the advantage of the patient being imaged for treatment planning and treated in the same position. If the treatment requires the patient to have bent legs, with the use of a wide bore CT the patient may still be imaged and treated in the same position, maintaining the same pelvic tilt and anatomical geometry, potentially producing more accurate dose estimates. The Anterior-Posterior/ Posterior-Anterior (AP/ PA) technique requires appropriate lung blocking to reduce the dose to the lung, concurrently allowing sufficient chest wall dose coverage. Boost fields to regions of unacceptably low dose are often employed at the RBWH as a part of the treatment process. In an opposed lateral supine treatment, the patient s arms are used as partial lung compensators. However with the AP/ PA technique, if the patient is supported in an upright position, the overall separation of the effective fields on the patient surface is decreased and less variable, which is advantageous for dose uniformity, particularly for lower beam energies such as 60 Co. For reproducibility of set-up the supine position is superior[55]. However in using a supine position in conjunction with a lateral beam (as is most commonly found) the dose to the head would generally be too high, as a result of the greatly reduced lateral separation. To reduce this high dose to the clinical volume a compensation filter (or shield) is normally applied. After consideration of the issues discussed above, the technique involving treatment of supine patients with lateral beams, at a distance from the x-ray source to the patient s midsagittal plane of 400 cm, was proposed for the new TBI protocol at RBWH. However for patients with a sufficiently large separation, consideration may be given to treating such patients using an anterior-posterior technique to yield the required dose uniformity. In order to maintain patients in such positions patient immobilisation and support systems as complex as those used in the current treatment technique will be required. 17

36 The proposed technique (see figure 10) will enable the treatment of tall patients by treating with the collimator rotated to 45º (see figure 11). In order to minimise dosimetry complications resulting from scattered radiation from the direct irradiation of the steel frame of the BUS and metal frame of the treatment bed, MLCs will be used to collimate the treatment field to reduce the effect of this. Figure 10: The proposed new supine treatment position. 18

37 Figure 11: Demonstration of how the new technique can be utilised to treat tall adult patients (pictured is a 194 cm patient ), the treatment field is indicated by the white line and the dimensions of the BUS indicated by the green line Complex patient set-up Certain institutions have adopted more complex set-ups to address some of the issues associated with TBI, to improve patient comfort and treatment reproducibility. Papiez[63] utilised an extended SSD with the patient on the floor. The technique comprised 4 fields in Anterior-Posterior (AP) and Posterior-Anterior (PA) treatments with the overlapped regions modulated by multileaf collimators (MLCs). Similarly to cater for a small bunker design, La Macchia[64], utilised an in-house designed floor couch and segmented MLC fields, producing fields that were adjusted to deliver the prescribed dose to the midline. An early technique utilised on 60 Co units was the translation of the couch during treatment, where the patient was moved continuously through the treatment beam[59, 65]. 19
38 Harden[66] describes a standing technique used at Addenbrooke s Hospital, in which patients are treated on a non-dedicated offset (relative to the centre of the bunker) machine with anterior and posterior fields using large horizontal fields with customised lung compensators. 1.9 Beam energy Historically TBI was initially delivered with cobalt-60 low energy megavoltage (1.25 MeV) beams[8] with protocol dose rates around 5 to 10 cgy/min. However 60 Co machines have largely been superseded by linear accelerators and total body irradiation techniques have been adopted for linear accelerator beams *. For lateral treatment techniques the photon beam energy required is dependent upon the thickness of the patient and the dose homogeneity specification. The variation in thickness of the patient along their sagittal axis will affect the homogeneity of dose distribution; in addition the patient thickness along the central ray of the beam will also impact upon the overall homogeneity. For the parallel lateral opposed pair technique, as the patient thickness increases (or the beam energy decreases) the central axis maximum dose near the surface increases relative to the midpoint dose, an effect referred to by Khan[36] as the tissue lateral effect. In general for the sparing of subcutaneous tissues for overall thickness exceeding 20 cm, Khan s analysis indicates that 10 MV or higher energy beams should be used. The Task Group 29 of the AAPM[8] investigated the ratio of the peak dose to the midline dose on the central ray versus the patient thickness, for 6- and 25-MV beams; concluding that the greater the energy, the lower the dose variation throughout the patient, the greater the treatment distance the lower the dose variation; the greater the patient s diameter the greater the dose variation. For a lateral opposed beam set-up where the patients thicknesses range from approximately 38 cm to 50 cm only 25-MV x-rays at a distance of 300 cm could result in a dose uniformity within 15% for the largest patients. * in Australia there are no Cobalt- 60 units suitable for TBI 20
39 In summary 10 MV or higher energies are preferred, producing a more uniform dose distribution for large separations in the case of the parallel lateral opposed pair technique. They do however require a spoiler or bolus to increase the skin dose as discussed below. The RBWH currently uses 10-MV beams and intends to continue the use of 10 MV (the highest energy available on its current linacs) for future TBI treatments with the proposed new protocol Dose build-up It is well known that due to an initial electron fluence build-up with depth, the maximum dose on the central axis of a megavoltage beam occurs not at the surface but at a certain depth below it, with a progressive increase in dose from the surface to the depth of dose maximum. The surface dose is typically about 20% of the maximum dose. Although this skin sparing effect depends on a number of factors including SSD, field size and configuration of any blocking tray present, in general the effect becomes more pronounced as the photon energy increases. For use of higher energy x-rays, consideration must be given to the effects of any low dose in the build-up region. Because most TBI protocols do not require skin sparing, a beam spoiler is introduced to bring the surface dose to at least 90% of the maximum dose; most of the electron fluence build-up then takes place in the beam spoiler (or build-up screen), a sheet of low atomic number material placed between the patient and the linac[8]. The thickness and location of this BUS will be dependent upon the desired clinical dose criteria. In general the screen is placed as close to the patient as possible, in order to achieve the greatest increase in the skin dose over the whole surface of the patient facing the beam. Sanchez- Nieto et al[67] state that a 1 cm thick Perspex TM sheet for a 10-MV photon beam will increase the skin dose up to 97% of the maximum dose. A Perspex BUS of this thickness is currently in use for TBI treatments at RBWH, and it is proposed to continue using it in the new protocol Treatment Planning System (TPS) data Treatment planning systems are used to calculate the dose to the patient, and need to do this accurately if the desired outcome is to be achieved. They require data collected under 21
40 specified conditions to perform these calculations, and this data is normally collected during the commissioning of the treatment unit and the TPS. Whether this data is adequate for accurate calculations at an extended treatment distance is a matter of conjecture. The change in percentage depth dose (PDD) with increasing SSD is a consequence of the inverse square law and the Mayneord Factor can be used to estimate this change[36]. However if this method is solely relied on for the dose calculations for patient dosimetry it can lead to errors of up to 6% and therefore measurements of the PDD under treatment conditions are recommended[36]. It should be noted for extended SSD TBI, Houdek et al[68] compared the accuracy of dose calculations using beam data measured at the extended SSD to that using data recalculated (from 100 cm SSD measured data) for a 10- MV beam. Their limited investigation yielded comparable results for the two methods which can be explained by considering the scattering conditions surrounding the patient and water tank. A primary motivation or rationale for the investigation presented in this thesis is the potential to improve upon the accuracy with which the current treatment planning system calculates the dose distribution in TBI of a patient during treatment. Phantom Scatter Factors (S P ) can be applied to correct for the variation in the amount and distribution of scatter resulting from a change in phantom size[36]. These factors quantify the change in dose at a fixed point as the volume of phantom irradiated with a fixed collimator opening is varied. These factors used in dose calculation are normally interpolated from data acquired at 100 cm SSD, from measurements acquired using a phantom whose dimensions exceed the field size; however for TBI this is not easily achievable and the TBI field is usually larger than the phantom area presented to the beam. This difference in geometry would be expected to impact any Tissue Maximum Ratios (TMRs) and field output factors for the TBI calculations, however Curran et al[69] show that for TMRs measured in three different phantom sizes at 100 cm SAD and 400 cm SAD there was at most a change of 1.5% in TMRs. 22
41 Collimator Scatter Factors (S C ) are used to correct for the variation in the amount of scatter in the beam incident on the phantom resulting from change in field size from the calibration reference field[36]. Such factors are used in dose calculations and may be derived empirically from interpolation of data acquired at 100 cm SSD. The variation between S C measured at extended distance and 100 cm SSD should be limited[69] (for field sizes larger than 25 cm x 25 cm of the order 0.3%[69]), however the S C measurement at ESSD is potentially complicated by backscatter from adjacent surfaces and objects not present in 100 cm SSD fields. This investigation aims to assess the suitability of utilising the data available in the OMP measured at SSD 100 cm for accurate dose calculations for 400 cm source to mid-line distance. In any case, measurements are needed at the extended distance to confirm the TPS calculation accuracy under the treatment conditions Commissioning of TBI TPS Calculations Following the selection of a treatment technique, the commissioning work begins. According to Van Dyk[14] the beam data collected for conventional radiotherapy has little application in the TBI setting; a separate set of dosimetric data is required for TBI geometry. For a better prediction of dose by the treatment planning system, absolute beam output calibration, percentage depth doses and beam profiles should be acquired, at the extended SSD. There are a number of dosimetric problems to consider in the commissioning of a TBI protocol, specific to large field dosimetry which do not arise in conventional radiotherapy. These issues are associated with the phantoms and ionisation chambers used in the acquisition of the dosimetric data. Dosimetric inaccuracies can arise from the irradiation of the ionisation chamber cable as a result of the relatively large radiation fields and chamber leakage currents become more significant at the low dose rates typical of TBI. Charge collection efficiency of the ionisation chamber will be greater at the low dose rate and perturbation corrections used in dose calculations can depend on the source-chamber distance (SCD)[14]. 23
42 The selection of the phantom sizes for which this data is acquired is often considered to be critical however for large distances Podgorsak[70] found that for output factors the size of the phantom made a limited difference, although for the depth dose distribution there was a significant variation in percentage doses at depths of 15 cm or greater. This effect decreases slightly as the beam energy increases, attributed to the increase in the more forward directed scattering of photons and a reduction in the amount of scatter produced for higher energies. 24
43 C hapter 2 CONFIRMATION OF BEAM REMODELLING AND DATA REQUIRMENTS PHASE I 2 Initial investigation 2.1 Patient positioning The current treatment position involves the patient in a semi-reclining position proposed by Khan[36] with knees elevated to reduce the overall length of the patient in the beam s eye view. The new position proposed in this thesis is designed to be more comfortable for the patients during the lengthy treatment. A survey of a number of RBWH TBI patients indicated a strong preference for the supine position for comfort, confirming one of the critical benefits of the change in the treatment protocol. The overall height of the patient is an obvious limiting factor with regard to treatment position. Although supine may be more comfortable, it makes it more difficult to fit a very tall patient within the treatment field. In the event that a patient does not fit within the size of the field, they will be treated with their knees bent. This position will be maintained during both simulation and treatment. A low density patient support device (a pillow) can be used to assist the patient in maintaining the desired position during the scan and long treatment time, which will ultimately assist in the reproducibility of the treatment setup. Because of the air gap between the BUS and the patient surface, the beam and the screen need to extend some distance beyond the head and feet of the patient to produce adequate build-up of electron fluence in these regions. Although 40 cm x 40 cm is the largest field possible, the MLC system is used to reduce the size of the field at the extended SSD to approximately the same dimensions as the BUS. The collimator angle is set to 45º to take advantage of the maximum horizontal field dimension of 50 cm (at 100 cm SSD) along a diagonal. The high density frame of the BUS 25
44 is kept outside the field, as OMP does not allow the simulation of materials with a density exceeding 2.8 g/cm Dosimetric verification The first step in assessing the ability of a planning system to accurately model the complexities of a treatment plan is to assess its ability to accurately model a simple case. Dosimetric verification of a planning system can be achieved in many ways, the simplest of which is the point measurement within a simple homogeneous phantom. Ionisation chambers are used to collect charge deposited at a particular depth and the charge collected can be converted to absorbed dose in a specified medium at that depth. The charge collected is corrected for the influence quantities temperature and pressure, polarity and recombination. An assessment was made to ascertain the need to modify the parameters of the beam model, most notably the energy fluence kernels in OMP, to better predict the doses at the extended distance: this was done by comparing a series of results produced by OMP to experimental data, using the beam model already used clinically for conventional (non-tbi) treatments in the TPS. This model will be referred to as Model 0 in this thesis. Analysis performed using the Gamma Index as discussed by Low[71] is commonly employed as a measure of the relevant difference between two dose profiles. For regions of low dose gradients the difference between profiles is best assessed as the dose value difference, in contrast to regions of high dose gradients (such as penumbra) where the difference is best assessed by the distance-to-agreement for a particular dose value. As a measurement of agreement, at each point along a profile the gamma index is given as a combination of the dose and positional differences. When the gamma value exceeds 1 the deviation between the two profiles is no longer within the tolerance limit set. The Gamma analysis software employed in this thesis was developed in-house (using Matlab, Mathworks, Natick, Ma, USA) based on the Low[71] evaluation method. For the chambers used, the recombination effects are small (of the order of 1% of the charge collected) at standard treatment distances and dose rates. The predominant recombination effect component is approximately proportional to the dose (to the air in 26
 TBI treatment distance, the recombination effects are negligible as the dose per pulse is lower by more than an order of magnitude due to the inverse square law.")
45 the chamber) per pulse of radiation. At the extended (~400 cm) TBI treatment distance, the recombination effects are negligible as the dose per pulse is lower by more than an order of magnitude due to the inverse square law. The distance from the source to the back wall is 495 cm. 2.3 Small cubic phantom A small 20 cm cubic solid water phantom consisting of Gammex RMI 457 (Gammex RMI, Madison, WI) slabs was used for a preliminary set of measurements due to the geometrical simplicity and ease of set-up it provided. It was placed in the centre of the 40 x 40 cm MLC modified field at cm SSD (400 cm to the centre of the phantom, congruent with the clinical set-up). The phantom comprised slabs of solid water, and a Farmer Type 2571 (Nuclear Enterprises, Reading, England) ion chamber (used because of its compatibility with the phantom see Figure 12) connected to a PTW Unidos Webline (PTW-Frieburg, Frieburg, Germany) electrometer was placed with its axis at 1 cm depth in the solid water. The slices were re-arranged to allow the placement of the chamber at other depths while keeping the SSD constant. Figure 12: The simple small cubic solid water phantom consisting of Gammex RMI 457 solid water slabs. To check the effect of the BUS (to be used during treatment), the charge was collected for a series of depths with and without the BUS in the beam. The distance from the source to the BUS is maintained at 380 cm. 27
46 The charge was converted to dose to water by applying a calibration factor. This factor with units of cgy/nc was determined by acquiring the charge collected for a known dose in the solid water phantom at dmax for a 10 cm x 10 cm field, at 100 cm SSD. This process assumes that the spectrum of the large beam at the extended SSD is sufficiently similar to that of the reference beam at 100 cm SSD that the mass stopping power ratio of water or solid water to air is essentially the same for both measurements. The justification for this assumption is as follows: (i) The effect of the differential attenuation of the beam spectral components, by the additional 3 m of air is approximately equivalent to that of 3 mm of water, which would be negligible. (ii) The large area beam would have slightly lower average energy than the 10 cm x 10 cm reference beam due to the increased proportion of collimator scatter, but the effect of this would be no greater than for conventional treatments at ~ 1 m SSD, where it is considered sufficiently small that no correction is made for it in ion chamber dosimetry. (iii) The build-up with depth of phantom scatter (Compton-scattered photons which have lower average energy than the primary photons) reduces the average energy of a beam, and this reduction will increase as the phantom becomes larger and generates more scatter. However the small cubic phantom described in this section is of a size where again no correction is made in conventional ion chamber dosimetry. (iv) The stopping power ratio of water to air varies slowly with the variation in average energy in a 10-MV beam, so even a significant change in average photon energy may produce an insignificant change in the response of the chamber. The graphs in appendix 3 of the IAEA TRS-398[72] show that a 10% change in the beam quality specifies TPR 20,10, centred on the value 0.7 (the approximate value for a 10-MV beam), produces only a 1.5% change in S w,air which is the predominant factor affecting chamber response. The results of these dose measurements within the solid water phantom are indicated in figure 13. For all graphs presented in this thesis the error bars are insignificantly greater than the thickness of the lines and are omitted for clarity. 28
47 10 MV, SSD, 400 MU Varying depth in solid water at centre of 40 cm x 40 cm MLC modified field Dose (cgy) No screen With screen Depth in solid water Figure 13: Dose plotted as a function of depth (corrected for effective point of measurement) in a 20 cm cubic solid water phantom, with and without the BUS. The results shown in figure 13 confirm the suitability of the BUS for increasing the entrance dose and demonstrate that for a small volume phantom an average reduction in local dose of 2.8% beyond the depth of maximum dose can be expected due to this BUS. This is equivalent to shifting the PDD by ~ 1 cm towards the source for points beyond the build-up region. In a full patient-sized phantom the entrance dose would be a little larger than in this small phantom due to increased backscatter. The build-up effect of the screen in the same sized large field would be the same with a large phantom, so these preliminary measurements indicated that the screen performed as anticipated and was likely to be satisfactory. This was verified by later measurements in the build-up region of a large phantom with the screen present - see section PDD acquisition In order to acquire the pertinent data to generate a PDD, two phantom systems had to be employed, one a large volume MP3 (PTW-Frieburg, Frieburg, Germany) computer controlled water phantom system shown in figure 14 for the majority of the 29
 Plastic Water for build up and Gammex RMI 457 solid water for backscatter) was used to acquire data for depths less than 52 mm.")
48 measurements and the other a composite phantom consisting of Plastic Water and solid water shown in figure 15 (CIRS (Computerized Imaging Reference Systems Inc., Norfolk, VA, USA) Plastic Water for build up and Gammex RMI 457 solid water for backscatter) was used to acquire data for depths less than 52 mm. The second phantom was required because of the physical limitations of the first phantom, for which the minimum depth of measurement in a lateral beam was equivalent to 52 mm of water. The attenuation coefficient of the Plastic Water when compared with real water in a 10-MV beam was measured as and applied in the calculation of water-equivalent depths in this phantom. Figure 14: The PTW MP3 water tank used in the acquisition of the PDD data. The PDD data was acquired in both phantoms (regions of overlap between the two were used to confirm no variation in response as a function of scatter and relative transmission) using the same parallel-plate ionisation chamber PPC 40 (IBA Dosimetry, Schwarzenbruck, Germany) so as to exclude any individual chamber response variations. The effective measuring point of the ionisation chamber (1 mm below the front surface of the chamber) was used for the PDD measurements. 30
 was maintained in this PDD acquisition and the effect of varying this distance was not investigated.")
49 Figure 15: The phantom arrangement used to acquire the build-up region measurements for the PDD. The distance between the BUS and the phantom surface (17.8 cm) was maintained in this PDD acquisition and the effect of varying this distance was not investigated. The entrance dose which can be a significant parameter in TBI treatment techniques would only decrease quite slowly by increasing this distance because of the very large field size. Additionally in the treatment technique proposed the patient will be positioned on the bed as close as practicable to the proximal edge of the bed and hence to the screen which abuts the bed and will be less than the distance of 17.8 cm to the phantom. ICRU [50] recommends that the dose within the target volume (in TBI this includes the skin) should not vary more than +7% and -5% of the prescribed dose, so an acceptable value for the entrance dose is considered to be at least 95% of the target dose. The entrance dose measured in this phantom is greater than 96% PDD for MLC-delineated Collimator 45 beam Two separate PDDs were acquired, both at the extended SSD, one 7 cm below the central axis of the beam and a second displaced from the first 43 cm parallel to the gun-target direction (towards the target). A PDD is recommended by Andreo et al[73] as a part of the commissioning process to verify the correct modelling of the energy spectra in a treatment planning system. 31
50 PDD LA3, 400 MU, 7 cm below of CAX, 380 cm source-tank distance, 17.8 cm screen-tank separation Percentage Dose 110% 100% 90% 80% 70% 60% 50% 40% 30% 20% 10% 0% Depth (mm) CAX 43 cm off axis Figure 16: The PDDs acquired at the patient plane in a large water tank at 380 cm SSD using the field delineated by the MLCs with a collimator angle of 45º. The plot labelled CAX was acquired 7 cm directly below the beam central axis (CAX); the other plot was acquired 43 cm away from the CAX plot in the guntarget direction. As expected the beam is slightly less penetrating off axis as shown in figure 16. This results from the lower initial energy and reduced beam hardening of the radiation further off axis, (the latter due to reduction in the thickness of the flattening filter the off-axis photons pass through), the obliquity of off-axis rays in the phantom and the decrease with distance from the axis of the rate of build up of scatter with depth PDD comparison for MLC-delineated Collimator 45 beam In order to replicate the treatment geometry accurately an investigation was conducted to assess the possibility of including the BUS as a region of interest to improve calculation accuracy. An artificial CT image series was created to be sufficiently large to enable the replication of the water tank within the image series in OMP. The BUS which has a physical density of 1.19 g/cm 3 had to be replicated in the CT data set as a bolus structure (or region of interest). Calculations were attempted however the treatment planning system was found to be incapable of performing a calculation for a beam where the field size is set at 40 cm x 40 cm when the collimator is rotated away from 0º. This limitation of the planning system 32


51 was confirmed via correspondence with the manufacturer. Consequently any further investigation of the large MLC-delineated collimator 45º beam was abandoned. Instead a simple second treatment field was investigated, where the collimator is not rotated and the field size is set to 40 cm x 25 cm. Figure 17: Treatment plan configuration for the case of the PDD taken 7 cm directly below the beam axis in a 40 cm x 25 cm field. Figure 18: Treatment plan configuration for the case of the PDD taken 7 cm below the beam axis and 43 cm towards the target in a 40 cm x 25 cm field. 33
52 2.4.3 PDD acquisition for Collimator 0, 40 cm x 25 cm field Two separate PDDs were acquired at the extended SSD (380 cm to the tank) with the 40 cm x 25 cm field, the first 7 cm below the central axis and a second 43 cm from the first at the same height. PDD LA3, 400 MU, 7 cm below of CAX, 380 cm source-tank distance, 17.8 cm screen-tank separation Percentage Dose 110% 100% 90% 80% 70% 60% 50% 40% 30% 20% 10% 0% Depth (mm) CAX 43 cm off axis Figure 19: The PDDs acquired at the patient plane in a large water tank at 380 cm SSD using the field delineated by the jaws only with a collimator angle of 0º. The plot labelled CAX was acquired 7 cm directly below the beam central axis (CAX); the other plot was acquired 43 cm away from the CAX plot in the guntarget direction. The ratio of doses between the two curves (PDD on CAX and PDD 43 cm off CAX) with the MLC delineated field and the jaw defined field differ by only 0.4 %. The relationship between the CAX and 43 cm off axis PDD curves for the 40 cm x 25 cm field is similar to that observed for the field delineated by the MLC system with the collimator rotated to 45º. 34
53 2.4.4 PDD comparison for Collimator 0, 40 cm x 25 cm field Absence of build-up screen PDD Comparision, 400 MU, 7 cm below axis, 380 cm source-tank distance, 17.8 cm screen-tank separation 140% 120% 100% Percentage Dose 80% 60% 40% 20% 0% Depth (cm) Measured PBE no build-up screen CCE no build-up screen Figure 20: The comparison of the PDDs measured 7 cm below the central axis and calculated by the treatment planning system in the absence of the BUS using both the pencil beam and collapsed cone algorithms, normalised to 10 cm depth. IBUR ABUR User defined Dist tol (mm) Dose tol (%) G_max G_mean Pass rate (%) Table 1: The gamma analysis results comparing the measured PDD and the Pencil Beam algorithm PDD with 10 % or 2 % and 1 mm distance to agreement. Regions of interest include the In Build-Up Region (IBUR), After Build-Up Region (ABUR)(range from dmax to 300 mm) and the user defined region (range 1 mm to 500 mm). The maximum gamma value (G_max) represents the worst agreement between the data sets within the regions compared; the mean gamma value (G_mean) represents the mean gamma value within the region compared. A value greater than 1 represents a failure to fall within the limits set. The Pencil Beam model has an unacceptably low pass rate (~53%) and will not be used for clinical use. 35
54 IBUR ABUR User defined Dist tol (mm) Dose tol (%) G_max G_mean Pass rate (%) Table 2: The gamma analysis results comparing the measured PDD and the Collapsed Cone algorithm PDD with 10 % or 2 % and 1 mm distance to agreement. Regions of interest include the In Build-Up Region (IBUR), After Build-Up Region (ABUR)(range from dmax to 300 mm) and the user defined region (range 1 mm to 500 mm). Although an improvement from the Pencil Beam model, the Collapsed Cone model too has an unacceptably low pass rate (~28%) and will not be used for clinical use PDD Comparision, 400 MU, 43 cm off axis, 380 cm source-tank distance, 17.8 cm screen-tank separation 140% 120% 100% Percentage Dose 80% 60% 40% 20% 0% Depth (cm) Measured PBE no build-up screen CCE no build-up screen Figure 21: The comparison of the PDDs measured 43 cm away from the central axis and calculated by the treatment planning system in the absence of the BUS using both the pencil beam and collapsed cone algorithms, normalised to 10 cm depth. 36
55 IBUR ABUR User defined Dist tol (mm) Dose tol (%) G_max G_mean Pass rate (%) Table 3: The gamma analysis results comparing the 43 cm off axis measured PDD and Pencil Beam algorithm PDD with 10 % or 2 % and 1 mm distance to agreement. Regions of interest include the In Build- Up Region (IBUR), After Build-Up Region (ABUR)(range from dmax to 300 mm) and the user defined region (range 1 mm to 500 mm). IBUR ABUR User defined Dist tol (mm) Dose tol (%) G_max G_mean Pass rate (%) Table 4: The gamma analysis results comparing the 43 cm off axis measured PDD and the Collapsed Cone algorithm PDD with 10 % or 2 % and 1 mm distance to agreement. Regions of interest include the In Buildup Region (IBUR), After Build-Up Region (ABUR) (range from dmax to 300 mm) and the user defined region (range 1 mm to 500 mm). From the above comparisons it is apparent that the data in the TPS based on data collected at 100 cm SSD will be insufficient to accurately predict the doses at the ESSD by using either PBE or CCE Bolus density settings It was hypothesised that the OMP, operating on a model derived from measurements made on the 10-MV Elekta (Elekta, Stockholm, Sweden) Precise beam at conventional treatment distances, would be sufficiently accurate for TBI provided a structure replicating the BUS is included in the calculation. This structure was included in the TPS plan as a 1 cm thick bolus region of interest (ROI). Although the physical density of this screen was known, an investigation was conducted in order to assess if this structure could be 37
56 tweaked to force the simulated beam PDD to match the measured data. This was performed by altering the density of the screen. Percentage Depth Dose 7 cm below CAX, Measured data and Collpased Cone data comparision 140% 120% Percentage Dose 100% 80% 60% 40% Measured Bolus 1 g/cm3 Bolus 1.2 g/cm3 Bolus 1.5 g/cm3 20% 0% Depth (cm) Figure 22: The comparison of the PDDs measured on the central axis and those produced by the treatment planning system using the collapsed cone algorithm, normalised to a depth of 10 cm, with three different density values applied. Percentage Depth Dose 7 cm below CAX, Measured data and Pencil Beam data comparision 140% 120% Percentage Dose 100% 80% 60% 40% Measured Bolus 1 g/cm3 Bolus 1.2 g/cm3 Bolus 1.5 g/cm3 20% 0% Depth (cm) Figure 23: The comparison of the PDDs measured on the central axis and those produced by the treatment planning system using the pencil beam algorithm, normalised to a depth of 10 cm, with three different density values applied 38
57 From the results presented in figures 22 and 23 above the maximum deviation appears to be ~6 % of d Max. at 35 cm depth where the PDD is ~ 40%. This would correspond to ~ *100% which is equal to ~ 4% deviation for a bilateral treatment, which could be considered clinically acceptable in TBI. Although the inclusion of the ROI replicating the BUS in treatment plans significantly improved agreement with measured data, it was deemed too time consuming and in certain clinical cases would prove to be unachievable, as OMP restricts the calculation of dose to within the CT data set; any structure outside of the CT data is ignored. For the case of large patients the inclusion of such a ROI would not be possible. The aim of this project is to enable accurate calculations for all TBI patients at RBWH, not just a subset. For both of the investigations described in this section, the current 10-MV model does not predict the dose variation with depth correctly within the tolerance values set for each investigation respectively, leading to the conclusion that an attempt to refine the method of dose calculation is warranted. It is expected that generally the dose calculation should be accurate to within ± 5 % of the measured data. 2.5 Acquisition of beam profile free in air In order to investigate the overall limitation of the TPS in the cross beam direction at a depth beyond the build-up an in-air profile was measured. A Farmer type ion chamber fitted with a small Perspex build-up cap (5 cm in diameter) to produce charged particle equilibrium was clamped to a retort stand. Charge measurements were acquired at the height of the treatment beam isocentre, at various points across the 40 cm x 25 cm field. 39
58 10 MV, 400 cm SCD, 40 cm x 25 cm field, Y- Profile 8 Charge collected (nc) as a function of MU Position on Y axis, at height of the beam axis Figure 24: The y-axis profile obtained in air with a build-up cap with 50% of the central dose occurring at ±80 cm. The above investigation was conducted to check the symmetry and flatness in air at the extended distance. The resultant y-axis profile was also expected to be useful in interpreting the measured and TPS calculated doses at off-axis points covering the length of the patient. In the x-axis direction only a very limited range of the beam area will be used, covering the anterior-posterior dimension of the patient, therefore this data was not collected separately. 2.6 Comparison of in air-profiles The phantom geometry (the build-up cap) was replicated in the treatment planning system; the profiles produced by each calculation algorithm were extracted. 40
59 Profile Collapsed Cone, Longitudinal profile 400 cm Source to chamber distance, 40 x 25 cm field 115% 105% 95% Percentage dose 85% 75% 65% 55% 45% 35% 25% Position (cm) Measured CCE Model 0 PBE Model 0 Figure 25: The y-axis profile normalised at the central axis position, calculated by the Collapsed Cone and Pencil Beam algorithms as compared with that measured. Gamma analysis was performed to quantify the differences between the profiles calculated by the TPS and the measured profile: Inner Penumbra Penumbra Left Right Dist tol (mm) Dose tol (%) G_max G_mean Pass rate (%) Gamma norm type Locally Central axis Central axis Table 5: The results of gamma analysis performed to compare the Pencil Beam calculation of the profile and the measured data. 41
60 Inner Penumbra Penumbra Left Right Dist tol (mm) Dose tol (%) G_max G_mean Pass rate (%) Gamma norm type Locally Central axis Central axis Table 6: The results of gamma analysis performed to compare the Collapsed Cone calculation of the profile and the measured data The above comparison favours the collapsed cone calculation, however the beam profile is not considered a major factor in selecting a suitable calculation beam model. The differences are only significant near the edges of the field where the beam will in most clinical cases overshoot the patient. 2.7 Cable signal The inclusion of the ionisation chamber cable in the path of the beam can result in a spurious component of the measurement which is known as cable signal. To quantify this signal, the chamber was irradiated under reference conditions (100 cm SSD for a 10 cm x 10 cm field) with a standard length of cable within the path of the beam and the charge recorded; this was repeated this time including an equivalent length of cable as would be in the path of the beam for the measurements made at 400 cm SCD. The percentage variation in signal was recorded as 0.8% for the approximate length of cable that would be present in the treatment beam for the Farmer chamber in the simple solid water phantom described in section 2.8. The cable effect constitutes a reduction of signal 0.8% for the Farmer chamber and an increase in signal of 7% for the Pinpoint chamber (used in following chapters). 2.8 Simple solid water phantom A small solid water phantom similar to the phantom shown in figure 12 was also used in the investigation of the variation of the midline dose as a function of separation (thickness in the beam direction). This was performed to assess the system s ability to correctly predict the dose at the prescription point for a variety of separations. The phantom was 42
61 placed on the treatment bed at constant 400 cm source to chamber distance, with the chamber reference point on the beam axis, and doses were measured at this point, while the phantom thickness surrounding the chamber was increased. The ion chamber readings were converted to dose for 400 MU delivered. This process assumes that the chamber perturbation factors in solid water do not differ significantly from those in water; which are accounted for by the k Q factors in the calibration chain. u A Depth (cm) Dose (cgy) Stdev Table 7: The doses as measured by converting the charge collected in the simple solid water phantom to dose, where the standard uncertainty (u A) is derived according to TRS398[72] as the standard deviation of the mean. The dose on the phantom side opposite to the beam incident surface (also known as the exit dose) was looked at as part of a comprehensive dosimetry investigation (section 2.12). 2.9 Simple solid water phantom comparison The simple solid water phantom geometry was replicated in the TPS, by creating an empty image CT series and recreating the phantom as a region of interest with a defined density of 1 g/cm 3. The dose was calculated using both pencil beam (PBE) and collapsed cone (CCE) calculation algorithms at the midpoint for 400 MU. This plan does not include the BUS; as discussed previously the inclusion of this screen in the plan is not clinically achievable. For more details see TRS-398[73] 43

62 Figure 26: The simple solid water phantom replicated in the TPS for the 14 cm separation arrangement. The doses calculated by the TPS are compared with the doses measured in the solid water phantom and the differences are found in table 8. PBE CCE PBE CCE Depth Model 0 Model 0 Model % 4.8% 2.5% % 5.2% 2.4% % 5.8% 2.9% % 5.3% 3.8% % 6.6% 1.9% Table 8: The comparison of doses calculated by OMP using the Model 0 data with the doses measured by the Farmer chamber in the simple phantom. The tabulated values are the percentages by which the calculated dose exceeds the measured dose. From the above data although the percentage depth dose for this beam model is not considered clinically acceptable for dose calculations, when calculating the dose for this phantom the collapsed cone algorithm is sufficiently accurate; 2.8% of these differences can be attributed to the absence of the screen in the calculations. 44
63 2.10 Thorax phantom data acquisition A thorax phantom (Computerized Imaging Reference Systems Inc., Norfolk, VA, USA) was used to verify the dose (to water) in tissue equivalent, bone equivalent and lung equivalent materials, using a small volume ion chamber. This chamber was used because the phantom chamber cavity had been milled for this particular chamber; a chamber with a larger volume would have been preferred to improve the signal to noise ratio and reduce the effect of the cable signal. The thorax phantom was arranged on the treatment bed as pictured in Figures 27 and 28, with the mid-sagittal plane of the phantom positioned 400 cm from the source (30 cm from the surface of the BUS to the mid-sagittal plane) and the highest point on the anterior surface of the phantom several centimetres below the beam central axis. The distance from the wall to the closest side of the phantom was ~ 82 cm. The 40 cm x 25 cm beam was used to deliver 500 MU. The ion chamber was placed in cavities milled within plugs which fit in the phantom at key points (as shown in figure 27). These plugs are made from substances that replicate the physical properties of lung, bone and soft tissue. Plugs for this phantom that do not contain chamber cavities are used where the chamber is not required and are also employed in the simulation process, that is, when a CT is obtained of the phantom the chamber is not present and so does not perturb the subsequent dose calculation. PTW Pinpoint (PTW-Frieburg, Germany) chamber, nominal sensitive volume of cm 2 45


64 Figure 27: Transverse view of the thorax phantom as set-up on the treatment bed. The mid-plane of the phantom is positioned 400 cm from the source (as indicated by the laser). The chamber is in the chamber cavity in the lung on the beam entrance side. Figure 28: A beam s eye view of the thorax phantom behind the BUS on the treatment couch. 46

65 Central tissue Lung entrance side Central bone Average Stdev u A Table 9: The doses to water in cgy derived from the charge collected from the chamber in the central tissue plug, the spinal bone plug and the central lung plug on the entrance side of the beam. Each measurement was corrected for extra signal from cable irradiation. The ion chamber readings were converted from charge collected, to dose to water using a conversion factor with units of cgy/nc obtained by acquiring the charge collected under reference conditions for a known delivered dose. In all cases the values measured were corrected for extra cable signal Thorax phantom comparison The phantom was scanned, a plan was created replicating the experimental conditions (without the BUS in place) and the doses were calculated using OMP to the regions where the ion chambers were placed using 500 MU. Figure 29: The treatment plan produced by OMP from a CT scan of the thorax phantom. A comparison of the ionisation chamber measured doses with those calculated by the treatment planning system for both the Pencil Beam and Collapsed Cone algorithms was 47
66 carried out, the results of which are presented in the table 10. It should be noted that doses quoted in table 10 are those obtained for dose to water within these bone, tissue and lung substances. In order to calculate the doses to these materials directly a ratio of the mass energy absorption coefficients for each material to water would need to be applied, however the exact composition of this phantom was unknown and applying these factors would introduce further uncertainty. Consequently, in the TPS the density of the chamber volume (including the wall) was set to 1 g/cm 2 (water). PBE CCE Lung Bone Tissue Lung Bone Tissue -2.9% -9.1% -10.5% -5.7% -3.2% -4.3% Table 10: The percentage difference between doses measured by the ionisation chamber in the tissue, lung and bone cavities and those calculated by the treatment planning system for 500 MU. A negative difference indicates a lower calculated dose than the measured dose. From the tabulated dose deviations in table 10, the ratio of doses calculated within bone to those within tissue are slightly higher when calculated by PBE than by CCE. This indicates a difference in the energy kernel for the heterogeneity correction. The overall magnitude of the deviations between the measured and calculated doses for both PBE and CCE is not consistent with the previous investigation(s) presented in section 2.9; the deviation is a calculated dose that is much lower than the measured dose Anthropomorphic phantom data acquisition For a more complex investigation a RANDO (Alderson Research Laboratories Inc., Stanford, CT, USA) anthropomorphic phantom is used, which includes materials that simulate muscle, bone and lung and has the contours of an adult male from the head to the upper thighs. TLDs can be used to verify the accuracy of the TPS in calculating dose in the presence of heterogeneities and contour variations. TLD-100 chips (Harshaw Chemical Co., Solon, Ohio, USA) were used as a convenient dosimeter to be placed within the anthropomorphic phantom. This phantom was purchased in the 1970s and contains real human bone, (which however is quite porous from osteoporosis). 48

67 TLDs were placed at several key positions such as the organs at risk (two at each point to improve the statistical uncertainty) within the anthropomorphic phantom shown in figure 30. Any gaps around the TLDs were filled with tissue-equivalent bolus. Figures 31.a, 31.b and 31.c show a few of the sections in which TLDs were placed. The phantom was placed on the treatment bed and aligned so that the mid-sagittal plane was 400 cm from the source (and 30 cm from the BUS surface), and irradiated by a single 40 cm x 25 cm beam (incident on the right side of the phantom) for 1000 MU. This procedure was repeated once to improve measurement statistics (for a total of 4 TLD readings at each point of interest). A single-sided irradiation was used rather than a bilateral delivery as this was considered a more sensitive way to evaluate the calculation model and algorithms. Figure 30: The anthropomorphic phantom arrangement used in this investigation on the treatment bed. Lasers are used to align the phantom in the same manner as for a patient undergoing treatment. 49
, b) c): Photos taken of a subset of the sections within the anthropomorphic phantom in which TLDs were")

 is quantified by the standard uncertainty (u A")
68 a) b) c) Figures 31. a), b) c): Photos taken of a subset of the sections within the anthropomorphic phantom in which TLDs were placed to acquire dosimetric data. The TLD measurements were converted to dose by applying a calibration factor acquired under reference conditions and are tabulated in table 11. The TLD measurement uncertainty at each point (type A[72]) is quantified by the standard uncertainty (u A ). Which is the standard deviation of the mean value of the four dose measurements at the point.. These values, together with the average measured dose taken over all points and the average value of u A, are shown in table
69 Dose Point Dose (cgy) Stdev (u A) average Table 11: The average doses measured by the TLDs at each point of interest in the anthropomorphic phantom, including the mean average dose and the mean standard deviation of doses measured. 51
70 2.13 Anthropomorphic phantom comparison The anthropomorphic phantom was scanned at 2 mm slices and the CT images (2 mm thick) were imported into the planning system and the doses calculated for a plan arrangement of a single beam directed at the phantom with a mid-sagittal distance of 400 cm from the source, using the 40 cm x 25 cm field size and 1000 MU. This investigation tests the overall uncertainty in the simulation, treatment planning and dose calculation process. The reproducibility of set-up may be estimated from examination of the two sets of TLD data acquired from the anthropomorphic phantom. The IAEA[73] recommend a final method of verification of the overall dose calculation accuracy of a TPS, in which an anthropomorphic phantom is simulated, doses calculated and doses measured under treatment conditions. For each point replicating the TLD an equivalent small volume structure was substituted in the TPS with a density of 1 g/cm 3, so that the TPS calculates the dose to water, which is the quantity the TLDs are calibrated to indicate. The calibration of the TLDs is performed at the isocentre by delivering a known dose under reference conditions to a subset of a batch at the same time of the phantom irradiation. Individual scaling factors are applied to each TLD to convert the thermoluminescence recorded in readout to dose. The results of comparison of the dose calculations with the dose measurements are tabulated in tables 39 and 40 in the appendix. The following series of images are taken from the CT slices of the anthropomorphic phantom and display percentage dose differences between the doses calculated by each OMP algorithm (pencil beam represented in red and collapsed cone in blue) and the corresponding measured doses. 52
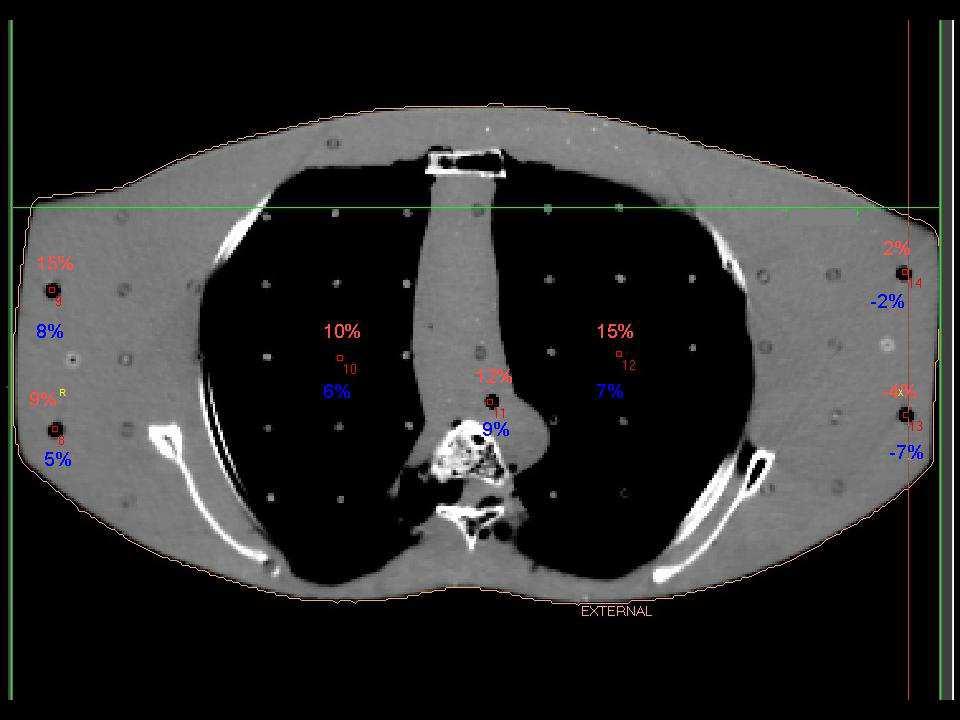
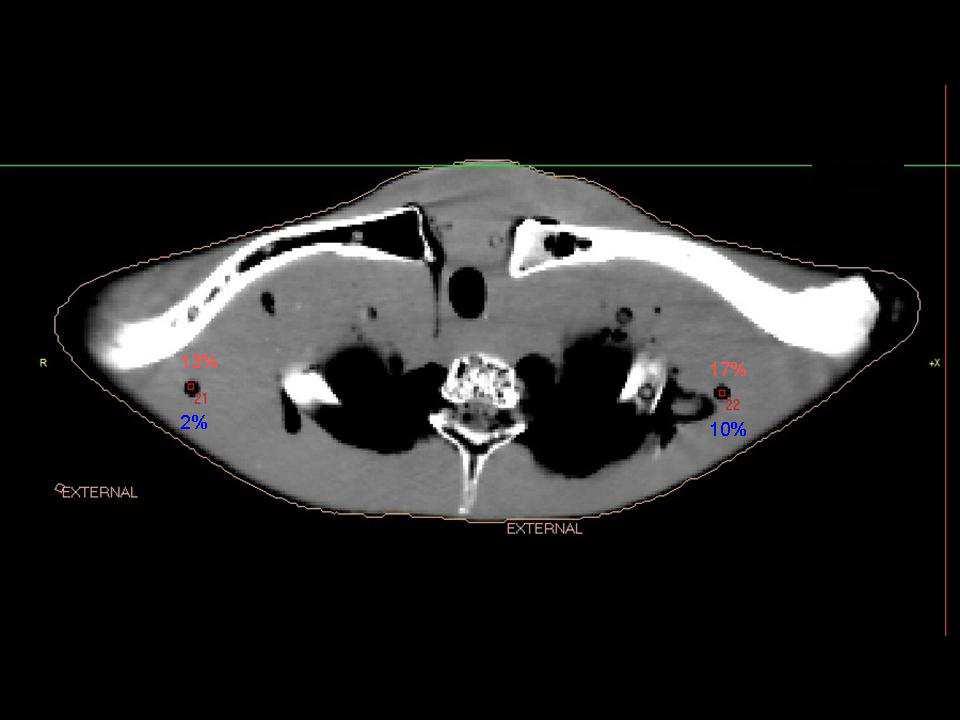
71 53
72 Figure : CT slices of the anthropomorphic phantom, showing the individual TLD positions within the phantom. The beam direction as it appears in the above figures is from the right. The percentage difference between doses at the TLD positions calculated by the collapsed cone and pencil beam algorithms and the corresponding measured doses are shown in blue and red respectively. The results of the average of the TLD measurements at each position obtained in the anthropomorphic phantom for a single beam irradiation, show that if the conventional 10-MV model (aka model 0), calculated using the Pencil Beam algorithm, were to be used clinically, an underestimate of the dose of up to 13% and an overestimate of up to 15% would occur. In the case of the Collapsed Cone algorithm an underestimate of up to 12% and overestimate of up to 9% would occur. For all points the doses calculated by the Collapsed Cone are lower than those calculated by the Pencil Beam algorithm. The average deviation of the calculated doses from the measured doses was 7% for PBE and % for CCE. The exit doses for both models are noted as having superior agreement with measured data when the beam does not pass through regions of heterogeneity, consistent with percentage differences observed in the PDD comparison (section 2.4.4). 54
73 In both cases the discrepancies were deemed too great for clinical implementation of TBI treatments. Although a single beam configuration (single beam irradiation) is investigated in the above comparisons, the effect of rotating the phantom and performing a second irradiation would increase the measurement set-up error. Using an opposing beam configuration would reduce the discrepancies within the build-up region Outcomes Investigations were conducted into the dose calculation accuracy of both algorithms of the current treatment planning model in regions of heterogeneities, and as a function of separation and as a function of depth in a homogeneous phantom. From these comparisons it was concluded that the current treatment planning model as it stands does not yield sufficiently accurate calculations of dose for the clinical implementation of extended SSD treatments in OMP at RBWH. It was conjectured that with better characterisation of the beam, improved agreement with measured data could be achieved by the TPS, particularly if the effect of the BUS could be incorporated in the beam model, which would have the added advantage of simplifying and increasing the scope of treatment planning. To enable them to improve the beam model for TBI calculations, the manufacturer (Nucletron ) requested certain data which included a PDD of the treatment field to be used at the extended SSD and an absolute dose acquired under the same treatment conditions Nucletron data submission The central axis PDD acquired as described in section 2.4.3, was submitted. For the output factor, the same beam set-up as that used to acquire the PDD data (40 cm x 25 cm at isocentre, 10 MV) was directed at a smaller volume water phantom. However, this phantom was centred on the central axis of the beam. A NE 2571 Farmer ionisation chamber was placed on the beam axis with its reference point at a depth of 10 cm in the phantom. The charge collected for 400 MU delivered was converted to absorbed dose, according to the IAEA TRS-398 dosimetry protocol formalism. 55

74 The phantom dimensions for the output measurements were approximately 60 cm x 30 cm normal to the beam direction x 40 cm in the beam direction. The phantom is shown in figure 33. The phantom size was different from that of the large automated water phantom used to obtain the PDD data. Figure 33: The water phantom used to acquire the output factor. Solid water, Perspex and plastic water are used to provide lateral scatter. The phantom was placed upon the intended treatment bed, which consists of an ordinary hospital bed and a thick hospital mattress. The metal frame of the bed was not encompassed within the light projected field size, so as to minimise any effects the metal could have on the treatment and modelling within the planning system. The resultant output factor was measured to be (± ) cgy/mu. A detailed report accompanying the requested data was sent to the manufacturer. On multiple occasions 56
75 C hapter 3 DATA MODEL VALIDATION PHASE II 3 Dosimetric verification In Phase II of this project beam data were sent to the manufacturer (Nucletron) for source characterisation and the resultant beam model ** was installed in the TPS at RBWH for evaluation. Each model was to include the presence of the BUS. As detailed below it was found necessary to seek refinements to this source model and as a consequence four successive iterations of beam model were sent from the manufacturer for evaluation over a period of 18 months, with each new beam model produced in response to shortcomings identified in the previous one and reported to the manufacturer. Each of these beam models allows selection of a pencil beam enhanced (PBE) and a collapsed cone enhanced (CCE) dose calculation algorithm. The dosimetric evaluation consists of evaluating the following parameters: absolute dose output factor, the percentage depth dose at the treatment distance and heterogeneity corrections under treatment conditions. These parameters were investigated and the limitations of each beam model identified, using the methods outlined in this chapter. The final model did not enable the calculation of dose using the collapsed cone convolution algorithm; this deficiency precluded investigation of that component and it has been acknowledged by the manufacturer as a known oversight. 3.1 Output Factor Each treatment planning model includes a normalisation point, often referred to as the calibration point at which an absolute output factor or calibration factor is assigned. As stated in the previous chapter a calibration factor ( cgy/mu) was supplied to the manufacturer as a part of the beam modelling process and is critical in assessing the accuracy of the treatment planning system s ability to calculate dose accurately. A plan was generated in OMP that replicated the phantom and beam geometry and physical set-up ** Sent in the form of binary and database files 57
76 under which the calibration factor sent to the manufacturer was acquired (but ignoring the presence of the BUS) and for each model the cgy/mu values calculated at the reference point were extracted from the plan and recorded. The results are tabulated in the table 12. Model 0 Model 1 Model 2 Model 3 Model 4 PBE CCE Table 12: The dose at the reference point in cgy/mu calculated by the treatment planning system for each beam model and calculation algorithm for a 40 cm x 25 cm field defined at the linac isocentre. The original model (model 0) is seen to calculate a lower dose per monitor unit at the calibration point than the other models. This occurs mainly because the model 0 calculation uses an output factor based on reference data acquired at 100 cm SSD rather than the dose per MU factor supplied to the manufacturer for the re-characterisation and does not account for the presence of the screen (as discussed in section 2.3). A consistent discrepancy between the calculated dose per MU and the measured calibration value ( cgy/mu) was noted for the re-characterised models and eventually after consultation with the manufacturer it was discovered that during the data modelling process the calibration factor supplied to the manufacturer was assigned to a 10 cm x 10 cm field (defined at 100 cm SSD) projected at a water phantom at 380 cm SSD, rather than the 40 cm x 25 cm field that was used in the acquisition of the factor. This was confirmed by repeating the above calculation using a 10 cm x 10 cm field in the treatment planning system, the results of which are shown in table 13, where it is seen that the discrepancy has been considerably reduced. For comparison, the discrepancies as a percentage of the calibration value are tabulated in table 14. Model 1 Model 2 Model 3 Model 4 PBE CCE Table 13: The dose at the calibration point in cgy/mu calculated by the treatment planning system for each beam model and calculation algorithm for a 10 cm x 10 cm field defined at the linac isocentre. The measured calibration value was cgy/mu for a 40 cm x 25 cm field. 58
77 A consistent shift of approximately 2.8% should therefore be expected for all other TPS calculations when comparing absolute doses as a result of this incorrect normalisation of output, which is attributed to the change in collimator scatter (collimator scatter factor at ESSD). 10 cm x 10 cm field 40 cm x 25 cm field Model 1 Model 2 Model 3 Model 4 Model 1 Model 2 Model 3 Model 4 PBE -0.5% -0.5% -0.5% -0.8% 2.7% 2.7% 2.7% 2.7% CCE -0.6% -0.6% -0.6% 2.8% 2.8% 3.0% Table 14: Percentage difference between dose at the calculation point in cgy/mu calculated by the treatment planning system for each beam model and calculation algorithm and the measured value of cgy/mu at the calibration point. A negative difference indicates a lower calculated dose than the measured dose. 3.2 PDD The percentage depth dose calculated by each treatment planning model was compared with the PDD measured. When each model was sent to RBWH for evaluation it was investigated for dosimetric variations from measurements in the same fashion as described in chapter 2 of this thesis, using the model to calculate doses for the same replicated phantom geometries as those presented in chapter 2. Note that the replicated phantom geometries to which the models were applied did not include the BUS, although it was present for the experimental measurements. This was done intentionally because the screen cannot form part of the CT images from which the patient geometry is derived and it is not practical to mimic the screen as a bolus. 59
78 Percentage Depth Dose Comparision 7 cm below the Central Axis, Pencil Beam 40 cm x 25 cm 380 cm SSD Percentage Dose 110% 100% 90% 80% 70% 60% 50% 40% 30% 20% 10% 0% Depth (cm) Model 0 Model 1 Model 2 Model 3 Model 4 Measured Figure 34: PDD as calculated at 7 cm below the CAX by the pencil beam algorithm for each treatment beam model for a 40 cm x 25 cm field normalised to the maximum dose, in a large volume water phantom. Note in the above graph in figure 34 the sudden dose drop after cm depth for the model 0 data. This is attributed to a limitation of the TPS data resulting from the modelling process carried out by the manufacturer (standard practice excludes data outside of cm depth). The later models do not show this behaviour due to the additional characterisation conducted by the manufacturer. Percentage Depth Dose Comparision 7 cm below the Central Axis, Collapsed Cone 40 cm x 25 cm 380 cm SSD 110% 100% 90% Percentage Dose 80% 70% 60% 50% 40% 30% 20% 10% 0% Depth (cm) Model 0 Model 1 Model 2 Model 3 Model 4 Measured Figure 35: PDD as calculated at 7 cm below the CAX by the collapsed cone algorithm for each treatment beam model for a 40 cm x 25 cm field normalised to the maximum dose, in a large volume water phantom. 60
79 The dose distribution shown in the build-up region for models 2 and 3 as calculated by the collapsed cone algorithm is not likely to be a true representation of the dose deposition within this region. It is conjectured that the manufacturer has introduced low energy photons or electrons into the beam model in an attempt to better calculate the dose within the build-up region. Percentage Depth Dose Comparision 43 cm Off Central Axis, Pencil Beam 40 cm x 25 cm 380 cm SSD 110% 100% 90% 80% Percentage Dose 70% 60% 50% 40% 30% 20% 10% 0% Depth (cm) Measured Model 1 Model 2 Model 3 Model 4 Figure 36: PDD as calculated at 7 cm below and 43 cm lateral to the CAX by the pencil beam algorithm for each treatment beam model for a 40 cm x 25 cm field normalised to the maximum dose As no detail of the modelling process conducted is provided by the manufacturer 61
80 Percentage Depth Dose Comparision 43 cm Off Central Axis, Collapsed Cone 40 cm x 25 cm 380 cm SSD Percentage Dose 110% 100% 90% 80% 70% 60% 50% 40% 30% 20% 10% 0% Depth (cm) Measured Model 1 Model 2 Model 3 Figure 37: PDD as calculated at 7 cm below and 43 cm lateral to the CAX by the collapsed cone algorithm for each treatment beam model for a 40 cm x 25 cm field normalised to the maximum dose The results of gamma analysis and conclusions drawn for each model Model 1 IBUR ABUR User defined Dist tol (mm) Dose tol (%) G_max G_mean Pass rate (%) Table 15: The gamma analysis results comparing the measured PDD below the central axis and the PBE Model 1 PDD with 10% or 2% and 1 mm distance to agreement. Regions of interest include the In Build- Up Region (IBUR), After Build-Up Region (ABUR)(range from dmax to 300 mm) and the user defined region (range 1 mm to 500 mm). 62
81 IBUR ABUR User defined Dist tol (mm) Dose tol (%) G_max G_mean Pass rate (%) Table 16: The gamma analysis results comparing the measured PDD below the central axis and the CCE Model 1 PDD with 10% or 2% and 1 mm distance to agreement, regions of interest include the In Build-Up Region (IBUR), After Build-Up Region (ABUR)(range from dmax to 300 mm) and the user defined region (range 1 mm to 500 mm) IBUR ABUR User defined Dist tol (mm) Dose tol (%) G_max G_mean Pass rate (%) Table 17: The gamma analysis results comparing the measured PDD 43 cm off axis and the PBE Model 1 PDD with 10% or 2% and 1 mm distance to agreement. Regions of interest include the In Build-Up Region (IBUR), After Build-Up Region (ABUR)(range from dmax to 300 mm) and the user defined region (range 1 mm to 500 mm) IBUR ABUR User defined Dist tol (mm) Dose tol (%) G_max G_mean Pass rate (%) Table 18: The gamma analysis results comparing the measured PDD 43 cm off axis and the CCE Model 1 PDD with 10% or 2% and 1 mm distance to agreement. Regions of interest include the In Build-Up Region (IBUR), After Build-Up Region (ABUR)(range from dmax to 300 mm) and the user defined region (range 1 mm to 500 mm) 63
82 From the above comparison it was clear that the BUS had not been included in the model. As a result the first model sent for evaluation (aka Model 1) was considered not appropriate to be used clinically Model 2 IBUR ABUR User defined Dist tol (mm) Dose tol (%) G_max G_mean Pass rate (%) Table 19: The gamma analysis results comparing the measured PDD below the central axis and the PBE Model 2 PDD with 10% or 2% and 1 mm distance to agreement. Regions of interest include the In Build- Up Region (IBUR), After Build-Up Region (ABUR)(range from dmax to 300 mm) and the user defined region (range 1 mm to 500 mm). IBUR ABUR User defined Dist tol (mm) Dose tol (%) G_max G_mean Pass rate (%) Table 20: The gamma analysis results comparing the measured PDD below the central axis and the CCE Model 2 PDD with 10% or 2% and 1 mm distance to agreement. Regions of interest include the In Build- Up Region (IBUR), After Build-Up Region (ABUR)(range from dmax to 300 mm) and the user defined region (range 1 mm to 500 mm). IBUR ABUR User defined Dist tol (mm) Dose tol (%) G_max G_mean Pass rate (%) Table 21: The gamma analysis results comparing the measured PDD 43 cm off axis and the PBE Model 2 PDD with 10% or 2% and 1 mm distance to agreement. Regions of interest include the In Build-Up Region 64
83 (IBUR), After Build-Up Region (ABUR) (range from dmax to 300 mm) and the user defined region (range 1 mm to 500 mm) IBUR ABUR User defined Dist tol (mm) Dose tol (%) G_max G_mean Pass rate (%) Table 22: The gamma analysis results comparing the measured PDD 43 cm off axis and the CCE Model 2 PDD with 10% or 2% and 1 mm distance to agreement. Regions of interest include the In Build-Up Region (IBUR), After Build-Up Region (ABUR)(range from dmax to 300 mm) and the user defined region (range 1 mm to 500 mm) From the above comparison although the new model (aka Model 2) was an improvement on the previous one, with the d max depth now coincident, there were obvious dosimetric differences in the regions immediately following the build-up region which increased as a function of depth from 20 cm. The CCE model was unsatisfactory because of the anomalous dose distributions calculated by it in the build-up region. Thus upon evaluation this data could not be used clinically and needed to be remodelled Model 3 IBUR ABUR User defined Dist tol (mm) Dose tol (%) G_max G_mean Pass rate (%) Table 23: The gamma analysis results comparing the measured PDD below the central axis and the PBE Model 3 PDD with 10% or 2% and 1 mm distance to agreement. Regions of interest include the In Build- Up Region (IBUR), After Build-Up Region (ABUR)(range from dmax to 300 mm) and the user defined region (range 1 mm to 500 mm). 65
84 IBUR ABUR User defined Dist tol (mm) Dose tol (%) G_max G_mean Pass rate (%) Table 24: The gamma analysis results comparing the measured PDD below the central axis and the CCE Model 3 PDD with 10% or 2% and 1 mm distance to agreement. Regions of interest include the In Build- Up Region (IBUR), After Build-Up Region (ABUR)(range from dmax to 300 mm) and the user defined region (range 1 mm to 500 mm). IBUR ABUR User defined Dist tol (mm) Dose tol (%) G_max G_mean Pass rate (%) Table 25: The gamma analysis results comparing the measured PDD 43 cm off axis and the PBE Model 3 PDD with 10% or 2% and 1 mm distance to agreement. Regions of interest include the In Build-Up Region (IBUR), After Build-Up Region (ABUR)(range from dmax to 300 mm) and the user defined region (range 1 mm to 500 mm) IBUR ABUR User defined Dist tol (mm) Dose tol (%) G_max G_mean Pass rate (%) Table 26: The gamma analysis results comparing the measured PDD 43 cm off axis and the CCE Model 3 PDD with 10% or 2% and 1 mm distance to agreement. Regions of interest include the In Build-Up Region (IBUR), After Build-Up Region (ABUR)(range from dmax to 300 mm) and the user defined region (range 1 mm to 500 mm) The visual comparison of PDDs for model 2 and model 3 revealed very similar curves, leading to the conclusion that very minimal changes had been made by the manufacturer 66
85 to the energy fluence component in the characterisation process between these two models, in which case both were insufficient to provide a viable clinical planning model Model 4 IBUR ABUR User defined Dist tol (mm) Dose tol (%) G_max G_mean Pass rate (%) Table 27: The gamma analysis results comparing the measured PDD below the central axis and the PBE Model 4 PDD with 10% or 2% and 1 mm distance to agreement. Regions of interest include the In Build- Up Region (IBUR), After Build-Up Region (ABUR)(range from dmax to 300 mm) and the user defined region (range 1 mm to 500 mm). IBUR ABUR User defined Dist tol (mm) Dose tol (%) G_max G_mean Pass rate (%) Table 28: The gamma analysis results comparing the measured PDD 43 cm off axis and the PBE Model 4 PDD with 10% or 2% and 1 mm distance to agreement. Regions of interest include the In Build-Up Region (IBUR), After Build-Up Region (ABUR)(range from dmax to 300 mm) and the user defined region (range 1 mm to 500 mm) The build-up dose region was identified as having the poorest agreement; however given that the majority of the dose errors occur in the calculation of dose in the lung much deeper than 7 mm this was considered of limited clinical significance. In consultation with the manufacturer it was determined that TPS energy characterisation is conducted and validated by them for a 10 cm x 10 cm field. The data submitted for recharacterisation was for a much larger (40 cm x 25 cm) field. This field size difference results in an incorrect modelling of the beam dose variation with depth which was not detected in the assessments made by the manufacturer and cannot be rectified by the user 67
86 once completed. If the user replicates a 10 cm x 10 cm field in OMP (conditions not reflecting the experimental set-up), this results in a clinically acceptable agreement between the measured (for the 40 cm x 25 cm field) and calculated (for the 10 cm x 10 cm field) PDDs for models 2 and 3 as shown in figures 38 and 39. This observation was relayed to the manufacturer and additional modelling was conducted to better replicate the experimental set-up for model 4. Percentage Depth Dose Comparision 7 cm below Central Axis, Pencil Beam, 10 cm x 10 cm 380 cm SSD, 40 cm x 25 cm 110% 100% 90% 80% Percentage Dose 70% 60% 50% 40% 30% 20% 10% 0% Depth (cm) Measured Model 1 Model 2 Model 3 Model 4 Figure 38: Treatment beam model PDD as calculated by the pencil beam algorithm for a 10 cm x 10 cm field normalised at dmax rather than the 40 cm x 25 cm field, showing better agreement with the measured PDD for the 40 cm x 25 cm field for models 2 and 3. 68
87 Percentage Depth Dose Comparision 7 cm below Central Axis, Collpased Cone, 10 cm x 10 cm 380 cm SSD, 40 cm x 25 cm Percentage Dose 110% 100% 90% 80% 70% 60% 50% 40% 30% 20% 10% 0% Depth (cm) Measured Model 1 Model 2 Model 3 Figure 39: Treatment beam model PDD as calculated by the collapsed cone algorithm for a 10 cm x 10 cm field normalised at dmax rather than the 40 cm x 25 cm field, showing better agreement with the measured PDD for the 40 cm x 25 m field for models 2 and Profiles The phantom geometry was replicated in the treatment planning system; the profiles produced by each calculation algorithm were extracted and compared with the measured data. Profile Pencil Beam, Longitudinal profile, 400 cm Source to chamber distance, 40 x 25 cm field 115% 105% 95% 85% Percentage dose 75% 65% 55% Measured Model 1 Model 2 Model 3 Model 4 45% 35% 25% Position (cm) Figure 40: Profiles as calculated at 7 cm below the CAX by the pencil beam algorithm for each treatment beam model for a 40 cm x 25 cm field normalised to the central position 69
88 Profile Collapsed Cone, Longitudinal profile, 400 cm Source to chamber distance, 40 x 25 cm field 115% 105% 95% Percentage dose 85% 75% 65% 55% Measured Model 1 Model 2 Model 3 45% 35% 25% Position (cm) Figure 41: Profiles as calculated at 7 cm below the CAX by the collapsed cone algorithm for each treatment beam model for a 40 cm x 25 cm field normalised to the central position. It is observed in comparing the two figures 40 and 41 above, that in general the collapsed cone algorithm yields profiles that better represent the measured data. The results of gamma analysis of these beam profiles are tabulated in tables Model 1 Inner Penumbra Penumbra Left Right Dist tol (mm) Dose tol (%) G_max G_mean Pass rate (%) Gamma norm type Locally Central axis Central axis Table 29: The results of gamma analysis performed to compare the Pencil Beam calculation of the profile and the measured data for Model 1. 70
89 Inner Penumbra Penumbra Left Right Dist tol (mm) Dose tol (%) G_max G_mean Pass rate (%) Gamma norm type Locally Central axis Central axis Table 30: The results of gamma analysis performed to compare the Collapsed Cone calculation of the profile and the measured data for Model Model 2 Inner Penumbra Penumbra Left Right Dist tol (mm) Dose tol (%) G_max G_mean Pass rate (%) Gamma norm type Locally Central axis Central axis Table 31: The results of gamma analysis performed to compare the Pencil Beam calculation of the profile and the measured data for Model 2. Inner Penumbra Penumbra Left Right Dist tol (mm) Dose tol (%) G_max G_mean Pass rate (%) Gamma norm type Locally Central axis Central axis Table 32: The results of gamma analysis performed to compare the Collapsed Cone calculation of the profile and the measured data for Model 2. 71
90 3.3.3 Model 3 Inner Penumbra Penumbra Left Right Dist tol (mm) Dose tol (%) G_max G_mean Pass rate (%) Gamma norm type Locally Central axis Central axis Table 33: The results of gamma analysis performed to compare the Pencil Beam calculation of the profile and the measured data for Model 3. Inner Penumbra Penumbra Left Right Dist tol (mm) Dose tol (%) G_max G_mean Pass rate (%) Gamma norm type Locally Central axis Central axis Table 34: The results of gamma analysis performed to compare the Collapsed Cone calculation of the profile and the measured data for Model Model 4 Inner Penumbra Penumbra Left Right Dist tol (mm) Dose tol (%) G_max G_mean Pass rate (%) Gamma norm type Locally Central axis Central axis Table 35: The results of gamma analysis performed to compare the Pencil Beam calculation of the profile and the measured data for Model 4. 72
91 In general, the inner region of the profile produced by each beam model yielded acceptable agreement for the collapsed cone calculations. The regions colloquially known as the horns in each profile demonstrate poorest agreement with the measured data. This region will vary greatly with small changes in the beam spectra. Consequently the final model yields the best agreement with the measured profile data, because the energy of model 4 best represents that of the measured beam, as evidenced by the superior agreement of the PDD produced (discussed in section 3.2.4). As discussed in section 2.6 the significance of the profile calculation error is limited, since the beam will in most clinical cases overshoot the patient at the location of the horns. 3.4 Simple phantom comparison As described in section 2.8 of this thesis, a Farmer chamber was placed at the mid-point of a solid water phantom, the thickness of which was then varied and doses recorded for a delivered 400 MU for each thickness. The simple solid water phantom geometries were replicated in the TPS and dose calculations performed by both pencil beam (PBE) and collapsed cone (CCE) algorithms for all beam models. The doses calculated at each chamber depth by the TPS for 400 MU were compared with the measured doses and the percentage differences are tabulated. PBE CCE Depth Model 0 Model 1 Model 2 Model 3 Model 4 Model 0 Model 1 Model 2 Model % 14.7% 14.7% 14.7% 16.4% 4.8% 14.1% 14.1% 14.2% % 16.2% 16.2% 16.2% 13.9% 5.2% 14.7% 14.7% 14.7% % 16.4% 16.4% 16.4% 13.2% 5.8% 15.4% 15.4% 15.3% % 16.7% 16.7% 16.7% 11.5% 5.3% 15.0% 15.0% 14.8% % 16.1% 16.1% 16.1% 9.3% 6.6% 16.3% 16.3% 15.9% Table 36: The percentage differences between the doses measured in the simple solid water phantom and those calculated using the PBE and CCE algorithms for all beam models investigated for the same phantom geometry and number of MU in OMP. The positive differences indicate higher calculated doses than the measured doses. For the PBE models, the model 0 discrepancy does vary slightly with thickness with an average deviation from measured doses of 8.4 %. Models 1 3 show identical discrepancies the average of which is 16 %, with the pattern of variation with depth the 73
92 same as for model 0. Model 4 shows the largest variation in calculation discrepancy, with the measured values, ranging from 9.3 % to 16.4 %. In comparing the ratio of the doses calculated by each re-characterised model to the original model, very limited change in this ratio is observed for all separations considered. It is inferred from this internal consistency that there is no significant change in the convolution kernel between re-characterised models 1-3. Models 1 and 2 procedure the same deviation from the measured data and for accurate dose calculations in this case a scaling (or output) factor can be applied to yield reasonably accurate dose calculations since the variations are also fairly independent of depth. 3.5 Measurement consistency investigation The deviation of the TPS calculated dose from measured data in the case of the absolute output factor comparison in section 3.1 was observed to be small when compared with the deviation observed in section 3.4 for the small simple solid water phantom. A comparison of the two data sets was made to try to determine the cause of this inconsistency. In order to see whether the two sets of measured data appeared to be consistent with each other an attempt was made to derive the expected measured value in the small simple phantom from the measured dose value in the large absolute dosimetry phantom by applying reasonable corrections based on the inverse square law and the effects of phantom size on phantom scatter. From the measured data from section 2.8 an interpolated measured dose at 10 cm depth in the simple phantom is found to be 21.9 cgy for 400 MU. An expected measured dose in the simple phantom can be calculated from the dose measured in the absolute phantom case, assuming that the change in the scattering volume has limited effect and the inverse square law applies. Dose from the water phantom for 400 MU was cgy. This measurement was acquired at a SCD of 390 cm so to convert this dose to an equivalent dose for the measurement at 400 cm SCD the inverse square law is applied: 74
93 * = cgy The expected change in measured dose due to the phantom scatter can be accounted for by comparing the PDDs at 10 cm depth for the areas presented to the beam by the two phantoms, using standard tables of PDDs (acquired at 100 cm SSD) as a function of field size. For the absolute dose phantom the area presented to the beam was 1800 cm 2. The PDD at 10 cm for the 10 MV beam is 72.6 % for this area. For the simple phantom the area presented to the beam was 400 cm 2. The tabulated PDD at 10 cm for the 10 MV beam is 75.2 %. This leads to an expected increase in dose of ~ 3.5% due to the increased phantom scatter in the larger phantom. The change in the backscatter would also contribute, but this is much less than the calculated 3.5% change which is predominantly due to forward scatter. Applying this correction the expected dose is: *0.965 = cgy Therefore the expected dose can be directly compared with the interpolated measured dose = The difference between the two doses, one directly measured and the other inferred from absolute dose (output factor) measurements is 11.6%. Taking into account the known error in the normalisation of the absolute output factor for models 1 to 4 (which is of the order of 2.9%), the observed discrepancy between TPS calculated dose and measured dose of ~ 14% for the simple phantom is consistent with this difference. It was concluded that there may an error in the output factor supplied to the manufacturer and 75
94 incorporated in models 1 4, but to confirm this, the measurements from which the output factor was derived will need to be repeated. 3.6 Thorax Phantom Comparison As described in section 2.10, dose measurements in the lung cavity closest to the beam, the central soft tissue cavity and the spinal bone cavity were acquired for 500 MU. The thorax phantom CT data set used in section 2.11 was again employed to compare dose calculations performed by both pencil beam (PBE) and collapsed cone (CCE) algorithms for all beam models to the measured data. The dose for comparison with the TPS calculated dose is dose to water within these bone, tissue and lung regions. The Pinpoint chamber used has a very low collecting volume and hence the effect of cable signal becomes significant for the length of cable irradiated, increasing the uncertainty in the readings (and thus the doses) in the thorax phantom case. The extra cable signal was measured for the Pinpoint chamber; yielding 7.1% extra signal induced for the approximate length of cable present in the experimental set-up. PBE Region Model 0 Model 1 Model 2 Model 3 Model 4 Lung -2.9% 3.8% 3.8% 3.8% 4.1% Bone -9.1% -2.9% -2.9% -2.9% -7.0% Tissue -10.5% -4.3% -4.3% -4.3% -8.6% CCE Region Model 0 Model 1 Model 2 Model 3 Lung -5.7% 2.8% 2.8% 2.9% Bone -3.2% 5.6% 5.6% 5.5% Tissue -4.3% 4.5% 4.5% 4.5% Table 37: The percentage difference between doses measured by the ionisation chamber in the tissue, lung and bone and those calculated by the TPS for 500 MU, where the chamber cavity has been replicated in the TPS as being filled with water. The ionisation chamber readings have been corrected for cable signal. A negative difference indicates lower calculated dose than the measured dose. In spite of the variation in the dose with depth (when normalised to a depth of dmax) between models 1, 2 and 3, observed in section 3.2, there is very limited variation in the calculated doses between the first three models within the thorax phantom, for the PBE and CCE algorithms individually. 76
95 This internal consistency implies that there is little difference in the convolution kernels employed in the three models, and may be enhanced by the fact that the models are all designed to deliver a particular dose per MU at 10 cm depth in water, which is approximately the water equivalent depth of the thorax phantom measurements. The similarity between models for PDDs normalised at 10 cm depth in water is shown in the figures 42 and 43. Percentage Depth Dose Comparision 7 cm below the Central Axis, Pencil Beam 40 cm x 25 cm 380 cm SSD 140% 120% Percentage Dose 100% 80% 60% 40% Model 0 Model 1 Model 2 Model 3 Model 4 Measured 20% 0% Depth (cm) Figure 42: PDD as calculated by the pencil beam algorithm for each treatment beam model for a 40 cm x 25 cm field normalised to the depth of 10 cm. 77
96 Percentage Depth Dose Comparision 7 cm below Central Axis, Collapsed Cone 40 cm x 25 cm 380 cm SSD Percentage Dose 150% 140% 130% 120% 110% 100% 90% 80% 70% 60% 50% 40% 30% 20% 10% 0% Depth (cm) Model 0 Model 1 Model 2 Model 3 Measured Figure 43: PDD as calculated by the collapsed cone algorithm for each treatment beam model for a 40 cm x 25 cm field normalised to the depth of 10 cm. 3.7 Anthropomorphic Phantom This investigation compares the doses calculated by both algorithms of each beam model at selected points in the anthropomorphic phantom with the doses measured previously with TLD at those same points as described in sections 2.12 and This was done to evaluate the performance of the algorithms in calculating dose in the presence of heterogeneities in a phantom system more closely representing a patient than the simple water phantom or thorax phantom. The results of this comparison are included in tables 41 and 42 in the appendix. 78
97 Anthropomorphic Phantom PBE dose calcuation variation 30.0% 25.0% Percentage difference from measurements 20.0% 15.0% 10.0% 5.0% 0.0% -5.0% -10.0% Model 0 Model 1 Model 2 Model 3 Model 4 Average max min -15.0% -20.0% Version of beam model Figure 44: The graph displaying the average, minimum and maximum percentage deviations of the TPS calculated doses from the TLD doses for Pencil Beam calculations. The graph shown in figure 44 demonstrates the degree of overall agreement between the PBE model calculations and the TLD measurements. The spread between the maximum and minimum deviations is least for models 2 and 3, which show identical values for all three parameters plot. This is consistent with the similarities in the PDDs noted in section 3.2 for these models. 79
98 Anthropomorphic phantom CCE dose calcualtion variation 25.0% 20.0% Percentage difference from measurements 15.0% 10.0% 5.0% 0.0% -5.0% -10.0% Model 0 Model 1 Model 2 Model 3 average min max -15.0% Version of beam model Figure 45: The graph displaying the average percentage deviations of the TPS calculated doses from the TLD doses for Collapsed Cone calculations. The graph shown in figure 45 demonstrates the degree of overall agreement between the CCE model calculations and the TLD measurements. The average TPS calculated dose deviation from the measured TLD dose is higher by ~ 10% for each of the recharacterised models, differing only slightly from the corresponding average for the PBE models. Although this can partly be attributed to the incorrect handling of the calibration factor conditions within the TPS as discussed in section 3.1 of this thesis, a large residual deviation remains, which is consistent with the postulated error in the output factor mentioned previously TLD variation investigation An anomalous result was observed in the TLD measurements in the anthropomorphic phantom, viz. that the TPS calculated doses were higher than the corresponding TLDmeasured doses by up to 20%. The discrepancies are much greater than the uncertainty associated with the TLD measurements (discussed in chapter 1). The magnitude of the type A uncertainty associated with the TLD measurements can be ascertained from the 80

99 standard deviation of the mean of the 4 TLD measurements at each location in the phantom. To investigate this anomaly it was decided to compare doses measured using TLDs with those measured using an ion chamber at the same point in a composite anthropomorphic/ solid water phantom at the ESSD (see table 38). This procedure provides an alternative calibration of the TLDs at the ESSD to their standard calibration at 100 cm SSD. Several slices of the anthropomorphic phantom were replaced by the solid water slabs (as shown in figure 46). Figure 46: The anthropomorphic/ solid water phantom arrangement used in the TLD accuracy and linearity investigation TLD calibration at ESSD An ion chamber was placed in the mid-sagittal plane at the central axis within the phantom shown in figure 46, at a SCD of 400 cm. Charge was collected and converted to dose for four different MU values. The ion chamber was replaced with TLDs which irradiated using 100, 250, 500 and 1000 MU. The doses in cgy obtained for both types of Nuclear Enterprises(Nuclear Enterprises, Reading, England) 2571 Farmer type chamber 81
100 dosimeter are found in table 38. The TLD doses are derived using their standard calibration at 100 cm SSD. MU Chamber doses Stdev Chamber Chamber (u A ) TLD doses TLD stdev TLD (u A ) Chamber / TLD % % % % Table 38: The results of the comparison of TLD dose measurements in the anthropomorphic/ solid water phantom with doses measured by the ionisation chamber. These results appear to demonstrate an under-response of the TLDs when used for dose measurements in a large volume at ESSD, which leads to an average 5 % deviation from ionisation chamber measured dose. The reasons for this 5% discrepancy are unknown, and require further investigation. However the TLDs were assigned new calibration factors based on the ESSD re-calibration, and the anthropomorphic phantom results were revised and are tabulated in tables 43 and 44 in the appendix. Although this correction improves the overall agreement (the differences between the minimum and maximum in addition to the general average agreement) of the TPS dose calculations with the TLD results, differences still remain for all versions of the beam model. The largest variation between the TPS-calculated doses and measurements occurs within the build-up region. The percentage deviations of the TPS calculated doses for model 0 from the revised TLD doses taken from tables 43 and 44 are shown in relation to the locations in the phantom where they appear in figures
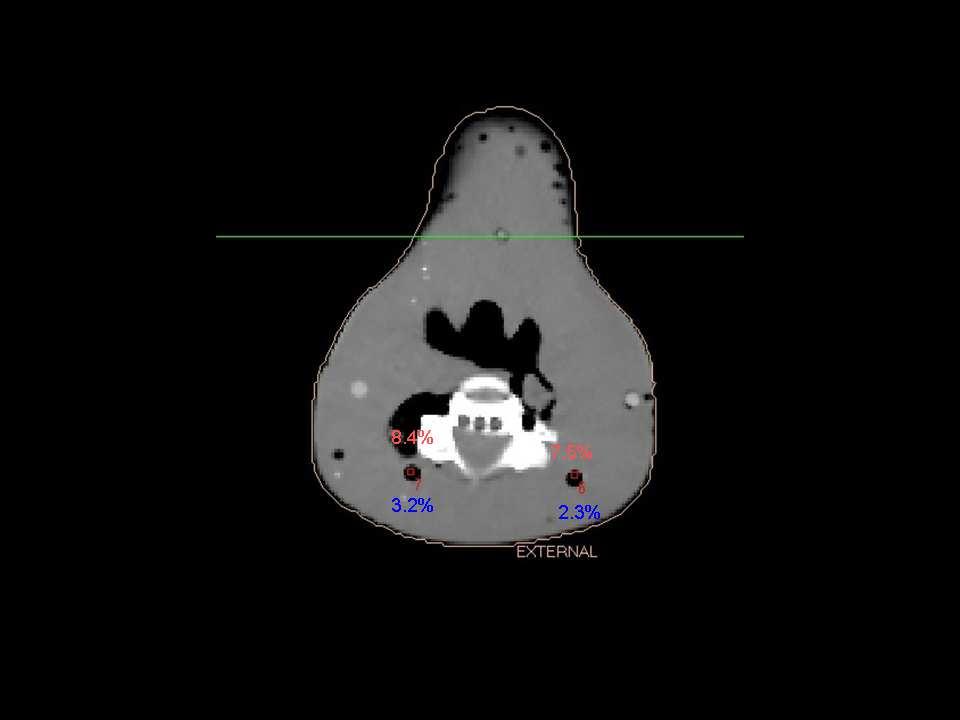
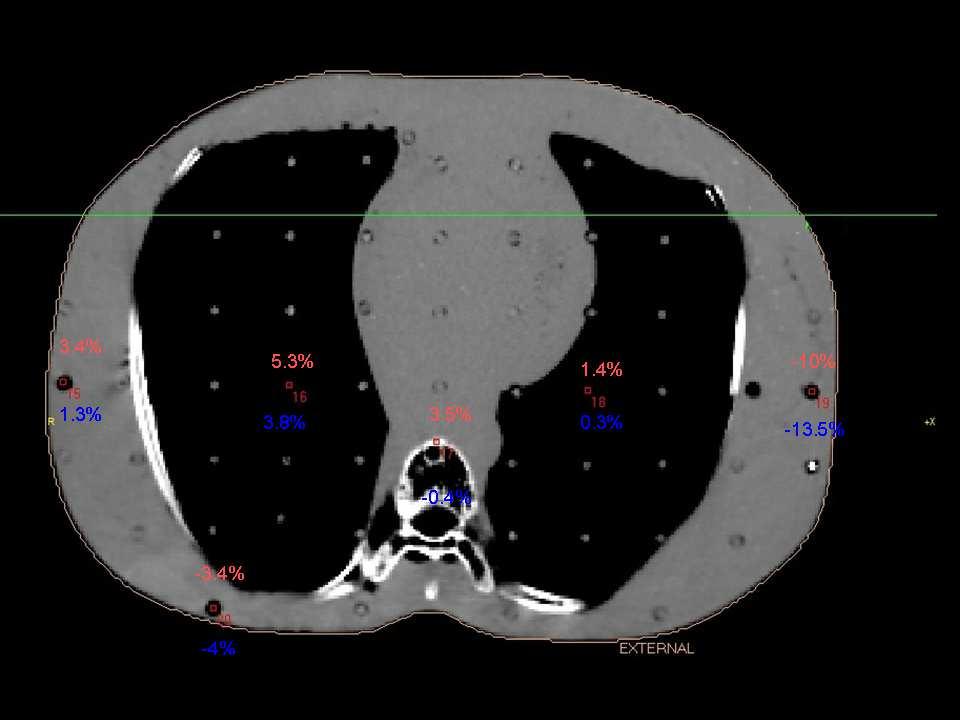
101 83


102 Figures : CT slices of the anthropomorphic phantom, showing the individual TLD positions within the phantom. The percentage differences from the TLD of doses calculated by collapsed cone and pencil beam algorithms are shown in blue and red respectively for model 0. The TLDs were calibrated in a large phantom at ESSD. 84
CHAPTER 4 PRE TREATMENT PATIENT SPECIFIC QUALITY ASSURANCE OF RAPIDARC PLANS
 47 CHAPTER 4 PRE TREATMENT PATIENT SPECIFIC QUALITY ASSURANCE OF RAPIDARC PLANS 4.1 INTRODUCTION Advanced treatment techniques use optimized radiation beam intensities to conform dose distribution to the
Outline. Chapter 11 Treatment Planning Single Beams. Patient dose calculation. Patient dose calculation. Effect of the curved contour surface
 Chapter 11 reatment Planning Single Beams Radiation Dosimetry I Outline Basic terminology Curved contour surface correction (bolus, compensators, wedges) Oblique beam incidence Correction for tissue inhomogeneities
Relative Dosimetry. Photons
 Relative Dosimetry Photons What you need to measure! Required Data (Photon) Central Axis Percent Depth Dose Tissue Maximum Ratio Scatter Maximum Ratio Output Factors S c & S cp! S p Beam profiles Wedge
The Royal Australian and New Zealand College of Radiologists. FRANZCR Examination Part I Radiation Oncology. Radiotherapeutic Physics.
 FRANZCR Examination Part I Radiation Oncology Radiotherapeutic Physics Candidate No.: The Royal Australian and New Zealand College of Radiologists FRANZCR Examination Part I Radiation Oncology Radiotherapeutic
Review of fundamental photon dosimetry quantities
 Review of fundamental photon dosimetry quantities Narayan Sahoo Main sources of the materials included in this lecture notes are: (1) Radiation Oncology Physics: A Handbook for Teachers and Students Edited
TG-119 IMRT Commissioning Tests Instructions for Planning, Measurement, and Analysis Version 10/21/2009
 TG-119 IMRT Commissioning Tests Instructions for Planning, Measurement, and Analysis Version 10/21/2009 DISCLAIMER: This publication and associated spreadsheets and digital files are based on sources and
THE development of more advanced techniques in radiotherapy,
 1 A Geant4-based simulation of an accelerator s head used for Intensity Modulated Radiation Therapy F. Foppiano, B. Mascialino, M.G. Pia, M. Piergentili. Abstract We present a Geant4-based simulation,
Dosimetric Calculations. Lonny Trestrail
 Dosimetric Calculations Lonny Trestrail 20 October 2008 Objectives Dose Distribution Measurements PDD, OCR TAR, SAR, TPR, TMR, SPR, SMR Arc or Rotational Therapy Isodose Curves Point Dose Calculations
The Effect of Immobilisation Devices on Radiotherapy Dose Distributions. Alison Gray August 2007
 The Effect of Immobilisation Devices on Radiotherapy Dose Distributions A thesis submitted in fulfilment of the requirements for the Degree of Master of Applied Science (Medical and Health Physics) By
Monitor Unit Calculations Part 1. Return to our first patient. Purpose. 62 yr old woman with Stage IIIB (T1N3M0) NSCLC rt lower lobe Dose prescription
 NSCLC rt lower lobe Dose prescription") Monitor Unit Calculations Part 1 George Starkschall, Ph.D. Department of Radiation Physics U.T. M.D. Anderson Cancer Center Return to our first patient 62 yr old woman with Stage IIIB (T1N3M0) NSCLC rt
Monitor Unit Calculations Part 1 George Starkschall, Ph.D. Department of Radiation Physics U.T. M.D. Anderson Cancer Center Return to our first patient 62 yr old woman with Stage IIIB (T1N3M0) NSCLC rt
Commissioning of Elekta 6MV FFF Versa HD and Pinnacle
 Commissioning of Elekta 6MV FFF Versa HD and Pinnacle Poster No.: R-0044 Congress: Type: Authors: Keywords: DOI: 2014 CSM Scientific Exhibit L. Bendall, I. Patel, N. McGrath, C. Rowbottom; MANCHESTER/
Commissioning an IMRT System for MLC Delivery. Gary A. Ezzell., Ph.D. Mayo Clinic Scottsdale
 Commissioning an IMRT System for MLC Delivery Gary A. Ezzell., Ph.D. Mayo Clinic Scottsdale Taking the broad view of commissioning Commissioning elements Validating the dosimetry system Commissioning the
SnapShot IMRT with compensators and FFF beams
 SnapShot IMRT with compensators and FFF beams Vladimir Feygelman, PhD (1) Moffitt Cancer Center, Tampa, FL, USA Disclosure VF has a sponsored research agreement with.decimal. A short history of radiotherapy
13 QUALITY ASSURANCE OF A LINEAR ACCELERATOR 13.1 COLLIMATOR ISOCENTER, JAWS, LIGHT FIELD VS INDICATORS, COLLIMATOR ANGLE INDICATORS.
 13 QUALITY ASSURANCE OF A LINEAR ACCELERATOR 13.1 COLLIMATOR ISOCENTER, JAWS, LIGHT FIELD VS INDICATORS, COLLIMATOR ANGLE INDICATORS. 13.1.1 TRAINING GOAL 13.1.1.1 Among the responsabilities of a medical
Monitor Unit Verification for Small Fields
 Monitor Unit Verification for Small Fields Patrick Higgins, Ph.D University of Minnesota Department of Radiation Oncology October 10, 2013 The Issues: How do we verify the monitor units calculated by the
Absorption measurements for a carbon fiber couch top and its modelling in a treatment planning system
 Absorption measurements for a carbon fiber couch top and its modelling in a treatment planning system G. Kunz, F. Hasenbalg, P. Pemler 1 1 Klinik für Radio-Onkologie und Nuklearmedizin, Stadtspital Triemli
Field size and depth dependence of wedge factor for internal wedge of dual energy linear accelerator
 Journal of BUON 8: 55-59, 2003 2003 Zerbinis Medical Publications. Printed in Greece ORIGINAL ARTICLE Field size and depth dependence of wedge factor for internal wedge of dual energy linear accelerator
The MC commissioning of CyberKnife with MLC (Tips and Tricks)
") The MC commissioning of CyberKnife with MLC (Tips and Tricks) Alain Guemnie Tafo, PhD UPMC Pinnacle, Harrisburg, PA Institute Gustave Roussy, Villejuif, France Disclaimer & Disclosure The views expressed
The MC commissioning of CyberKnife with MLC (Tips and Tricks) Alain Guemnie Tafo, PhD UPMC Pinnacle, Harrisburg, PA Institute Gustave Roussy, Villejuif, France Disclaimer & Disclosure The views expressed
IMRT in clinical practice at the UMC-Utrecht. Utrecht
 3 IMRT in clinical practice at the UMC-Utrecht Utrecht Clinical use of IMRT Improvement of local control without increased incidence of normal tissue complications + Dose escalation in the prostate Step-and
JOURNAL OF APPLIED CLINICAL MEDICAL PHYSICS, VOLUME 3, NUMBER 4, FALL 2002
 JOURNAL OF APPLIED CLINICAL MEDICAL PHYSICS, VOLUME 3, NUMBER 4, FALL 2002 Comparison of monitor unit calculations performed with a 3D computerized planning system and independent hand calculations: Results
Commissioning and quality assurance of a commercial intensity modulated radiotherapy (IMRT) treatment planning system PrecisePLAN
 treatment planning system PrecisePLAN") 22 Turkish Journal of Cancer Volume 37, No.1, 2007 Commissioning and quality assurance of a commercial intensity modulated radiotherapy (IMRT) treatment planning system PrecisePLAN SATISH PELAGADE 1, KALPANA
22 Turkish Journal of Cancer Volume 37, No.1, 2007 Commissioning and quality assurance of a commercial intensity modulated radiotherapy (IMRT) treatment planning system PrecisePLAN SATISH PELAGADE 1, KALPANA
CLINICAL IMPLEMENTATION OF RAPIDARC Treatment Planning Strategies to Improve Dose Distributions
 CLINICAL IMPLEMENTATION OF RAPIDARC Treatment Planning Strategies to Improve Dose Distributions Rebecca M. Howell, Ph.D., D.A.B.R, The University of Texas at M.D. Anderson Cancer Center Overview 2 Commissioning
Clinical Implementation of the IPEM 2003 Code of Practice for Electron Dosimetry
 Clinical Implementation of the IPEM 2003 Code of Practice for Electron Dosimetry Tom Jordan Royal Surrey County Hospital IPEM Electron Dosimetry Working Party: + DI Thwaites, AR DuSautoy, MR McEwen, AE
ANALYSIS OF OFF-AXIS ENHANCDED DYNAMIC WEDGE DOSIMETRY USING A 2D DIODE ARRAY A CREATIVE PROJECT (3 SEMESTER HOURS) SUBMITTED TO THE GRADUATE SCHOOL
 SUBMITTED TO THE GRADUATE SCHOOL") ANALYSIS OF OFF-AXIS ENHANCDED DYNAMIC WEDGE DOSIMETRY USING A 2D DIODE ARRAY A CREATIVE PROJECT (3 SEMESTER HOURS) SUBMITTED TO THE GRADUATE SCHOOL FOR THE DEGREE MASTER OF ARTS BY CHARLES TRAVIS WEBB
ANALYSIS OF OFF-AXIS ENHANCDED DYNAMIC WEDGE DOSIMETRY USING A 2D DIODE ARRAY A CREATIVE PROJECT (3 SEMESTER HOURS) SUBMITTED TO THE GRADUATE SCHOOL FOR THE DEGREE MASTER OF ARTS BY CHARLES TRAVIS WEBB
GEANT4 SIMULATION OF AN ACCELERATOR HEAD FOR INTENSITY MODULATED RADIOTHERAPY
 The Monte Carlo Method: Versatility Unbounded in a Dynamic Computing World Chattanooga, Tennessee, April 17-21, 2005, on CD-ROM, American Nuclear Society, LaGrange Park, IL (2005) GEANT4 SIMULATION OF
Basics of Proton Therapy. Proton Treatment Planning and Beam Optimization
 Basics of Proton Therapy Proton Treatment Planning and Beam Optimization SAM Educational Session, WE D BRB 2 Mark Pankuch, PhD Northwestern Medicine Chicago Proton Center Today s objectives Review the
Constancy checks of well-type ionization chambers with external-beam radiation units
 JOURNAL OF APPLIED CLINICAL MEDICAL PHYSICS, VOLUME 16, NUMBER 6, 2015 Constancy checks of well-type ionization chambers with external-beam radiation units Sara L. Hackett, 1a Benjamin Davis, 2 Andrew
TG-61 deals with: This part of the refresher course: Phantoms. Chambers. Practical Implementation of TG-61:
 Practical Implementation of TG-61: II. Guidelines for clinical implementation of TG-61 J.P. Seuntjens Medical Physics Unit McGill University, Montreal General Hospital Montréal, Canada jseuntjens@medphys.mcgill.ca
Zoubir Ouhib Lynn Cancer Institute
 Zoubir Ouhib Lynn Cancer Institute April 2015 Speaker for ELEKTA Brachytherapy using miniature X-ray sources Energy
Clinical Implementation of the TG-51 Protocol. David Followill Radiological Physics Center Houston Texas
 Clinical Implementation of the TG-51 Protocol David Followill Radiological Physics Center Houston Texas Current Implementation Status Current Implementation Status 1600 1400 TOTAL 1494 of 1623 ACTIVE INSTITUTIONS
Only 8% to go. TOTAL 1494 of 1623 ACTIVE INSTITUTIONS (92%) May-09. May-04 Nov-04. May-07. Nov-02 May-03. Nov-05. Nov-06. Nov-07 May-08.
 May-09. May-04 Nov-04. May-07. Nov-02 May-03. Nov-05. Nov-06. Nov-07 May-08.") Clinical Implementation of the TG-51 Protocol David Followill Radiological Physics Center Houston Texas 2009 AAPM Summer School Educational Objectives Improve your understanding of how to implement TG-51
Clinical Implementation of the TG-51 Protocol David Followill Radiological Physics Center Houston Texas 2009 AAPM Summer School Educational Objectives Improve your understanding of how to implement TG-51
Proton Therapy QA Tools
 Proton Therapy QA Tools A complete range of tools for absolute dosimetry, machine QA and patient plan verification Introduction During the past years more and more heavy particle therapy centers, especially
Validation of Treatment Planning Dose Calculations: Experience Working with Medical Physics Practice Guideline 5.a.
 International Journal of Medical Physics, Clinical Engineering and Radiation Oncology, 2017, 6, 57-72 http://www.scirp.org/journal/ijmpcero ISSN Online: 2168-5444 ISSN Print: 2168-5436 Validation of Treatment
Math Review. Overview
 Drawn by Steve Yan, CMD Math Review Shirley Ann Pinegar-Johnston MS RT(R)(T)CMD Overview Drawn by Steve Yan, CMD Divergence & Intensity DIVERGENCE X-rays travel in Straight but Divergent lines INTENSITY
Practical Course in Reference Dosimetry, National Physical Laboratory February 2014 MV Photon Dosimetry in the Clinic Page 1 of 11
 MV Photon Dosimetry in the Clinic This document discusses both the scientific methods and the system of work required to calibrate a field instrument expanding upon the practical details of both.. Introduction
A beam-matching concept for medical linear accelerators
 Acta Oncologica, 2009; 48: 192200 ORIGINAL ARTICLE A beam-matching concept for medical linear accelerators DAVID SJÖSTRÖM, ULF BJELKENGREN, WIVIANN OTTOSSON & CLAUS F. BEHRENS Copenhagen University Hospital,
Guideline for RMO Key comparison for Air kerma rate in 60 Co gamma radiation
 Guideline for RMO Key comparison for Air kerma rate in 60 Co gamma radiation This intercomparison will be carried out under the lead of KRISS with the cooperation of ARPANSA. This comparison has been approved
1. Question Answer cgy / MU cgy / MU 2. Question Answer
 GS020113: Introduction to Medical Physics III: Therapy s to home work problem set assigned on 3/22/11 1. Question A patient is set up at 100 cm SSD on a 6 MVX machine. The dose rate at 10 cm in phantom
Clinical Implementation of Volumetric Modulated Arc Therapy
 Clinical Implementation of Volumetric Modulated Arc Therapy UT M.D. Anderson Cancer Center Ramaswamy Sadagopan, Rebecca M. Howell, Weiliang Du and Peter Balter Definition 2 Intensity Modulated Arc therapy
Comparison of ionization chambers of various volumes for IMRT absolute dose verification
 Comparison of ionization chambers of various volumes for IMRT absolute dose verification Leonid B. Leybovich, a) Anil Sethi, and Nesrin Dogan Department of Radiation Oncology, Loyola University Medical
Investigation of Buildup Dose for Therapeutic Intensity Modulated Photon Beams in Radiation Therapy
 University of South Florida Scholar Commons Graduate Theses and Dissertations Graduate School 7-14-2010 Investigation of Buildup Dose for Therapeutic Intensity Modulated Photon Beams in Radiation Therapy
Scientific Journal of Nuclear Medicine & Radiation Therapy
 Scientific Journal of Nuclear Medicine & Radiation Therapy Research Article Radiotherapy Dose Calculation Program, for Monitoring and Commissioning Treatment Planning Systems - Ioannis Vamvakas*, Stella
Chapter I Standard application in photon dosimetry José Guilherme Pereira Peixoto Maria da Penha Potiens
 Chapter I Standard application in photon dosimetry José Guilherme Pereira Peixoto Maria da Penha Potiens The characteristic ionizing radiation response is defined by the relationship between the stimulus
A dose delivery verification method for conventional and intensitymodulated radiation therapy using measured field fluence distributions
 A dose delivery verification method for conventional and intensitymodulated radiation therapy using measured field fluence distributions Wendel Dean Renner a) Math Resolutions, LLC, 5975 Gales Lane, Columbia,
Monitor Unit Calculations Part 2. Calculation of machine setting. Collimator setting
 Monitor Unit Calculations Part 2 George Starkschall, Ph.D. Department of Radiation Physics U.T. M.D. Anderson Cancer Center Calculation of machine setting reference dose machine setting =, reference dose
Exradin Ion Chambers. What attributes make Exradin the smart choice? EXRADIN Ion Chambers
 EXRADIN Ion Chambers Exradin Ion Chambers Exradin (EXacting RADiation INstrumentation) Ion Chambers have been built for over 33 years, are recognized by top research institutes and standards laboratories,
VariSource High Dose Rate Afterloader Procedures. For Performing Breast Brachytherapy with. The SAVI TM Applicator
 VariSource High Dose Rate Afterloader Procedures For Performing Breast Brachytherapy with The SAVI TM Applicator Contents I. CT Evaluation (~1 week prior to insertion) II. SAVI Applicator Implantation
Abstract: Introduction:
 Are photon and electron beam calibrations more consistent with TG-51 than with TG-21? Ramesh C. Tailor, William F. Hanson, Nathan Wells, and Geoffrey S. Ibbott. U.T. MD Anderson Cancer Center, Houston
AAPM s TG-51 protocol for clinical reference dosimetry of high-energy photon and electron beams
 AAPM s TG-51 protocol for clinical reference dosimetry of high-energy photon and electron beams Peter R. Almond Brown Cancer Center, Louisville, Kentucky 40202 Peter J. Biggs Department of Radiation Oncology,
Commissioning and periodic tests of the Esteya electronic brachytherapy system
 Review paper Educational Activity Commissioning and periodic tests of the Esteya electronic brachytherapy system Cristian Candela-Juan, PhD 1, Yury Niatsetski, MSc 2, Zoubir Ouhib, PhD 3, Facundo Ballester,
Planning Assignment (3 field rectum)
") Megan Sullivan Clinical Lab Rectum April 25, 2016 Planning Assignment (3 field rectum) Use a CT dataset of the pelvis. Create a CTV by contouring the rectum (start at the anus and stop at the turn where
Megan Sullivan Clinical Lab Rectum April 25, 2016 Planning Assignment (3 field rectum) Use a CT dataset of the pelvis. Create a CTV by contouring the rectum (start at the anus and stop at the turn where
COMPASS. Dr. Lutz Müller. AK IMRT Bamberg April D IMRT Verification in Patient Anatomy
 COMPASS 3D IMRT Verification in Patient Anatomy AK IMRT Bamberg April 2010 Dr. Lutz Müller Patient-specific Verification? CT Treatment unit Gantry =0 Treatmt unit Patient couch X-ray beam Patient couch
Trial calibrations of therapy level electron beam ionisation chambers in terms of absorbed dose to water
 Trial calibrations of therapy level electron beam ionisation chambers in terms of absorbed dose to water M R McEwen, A J Williams and A R DuSautoy Centre for Ionising Radiation Metrology National Physical
Experimental verification of a Monte Carlo-based MLC simulation model for IMRT dose calculations in heterogeneous media
 Experimental verification of a Monte Carlo-based MLC simulation model for IMRT dose calculations in heterogeneous media N Tyagi 1, B H Curran, P L Roberson, J M Moran, E Acosta and B A Fraass Department
The dose distribution of medium energy electron boosts to the laryngectomy stoma
 JOURNAL OF APPLIED CLINICAL MEDICAL PHYSICS, VOLUME 2, NUMBER 1, WINTER 2001 The dose distribution of medium energy electron boosts to the laryngectomy stoma Ellen D. Yorke* Memorial Sloan-Kettering Cancer
High Speed Direct SAD Radiosurgery Beam Scanner
 Open Access Original Article DOI: 10.7759/cureus.20 High Speed Direct SAD Radiosurgery Beam Scanner Walter Nikesch 1, James M. Hevezi 2, Irene Monterroso 3, Daniel Navarro 4, James G. Schwade 5 1. CyberKnife
TG219: IT'S USE, STRENGTHS AND WEAKNESSES
 1 CONFLICT OF INTEREST TG219: IT'S USE, STRENGTHS AND WEAKNESSES SOTIRI STATHAKIS, PHD, DABR None ROSTER STATEMENT OF THE PROBLEM Timothy C. Zhu, University of Pennsylvania, Philadelphia, PA (Co- Chair)
3D Treatment Planning and verification with hand calculations
 3D Treatment Planning and verification with hand calculations Randy Holt, PhD, CEO Pacific Crest Medical Physics, Inc Chico, CA Dosimetric Calculations Calibration and Measurement Conditions Patient Conditions
Electronic Oncology Systems the Management and the Safety Measures. Hansen Chen, Director, TDSI
 Electronic Oncology Systems the Management and the Safety Measures Hansen Chen, Director, TDSI Radiation Oncology Department People Place Equipments Procedures Patients Hansen Chen 2 Radiation Oncology
Radiotherapy physics & Equipments
 Radiotherapy physics & Equipments RAD 481 Lecture s Title: Beam Modification devices in Radiotherapy Dr. Mohammed Emam Vision :IMC aspires to be a leader in applied medical sciences, health care education
Failure Mode and Effect Analysis (FMEA) for a DMLC Tracking System
 for a DMLC Tracking System") Failure Mode and Effect Analysis (FMEA) for a DMLC Tracking System Amit Sawant 1, Sonja Dieterich 1, Michelle Svatos 2 and Paul Keall 1 1 Stanford University, Stanford, CA 2 Varian Medical Systems, Palo
Failure Mode and Effect Analysis (FMEA) for a DMLC Tracking System Amit Sawant 1, Sonja Dieterich 1, Michelle Svatos 2 and Paul Keall 1 1 Stanford University, Stanford, CA 2 Varian Medical Systems, Palo
General Accreditation Guidance. User checks and maintenance of laboratory balances
 General Accreditation Guidance User checks and maintenance of laboratory balances January 2018 Copyright National Association of Testing Authorities, Australia 2010 All intellectual property rights in
How to Design Medical Accelerator Systems for Reliability: IBA PT System
 How to Design Medical Accelerator Systems for Reliability: IBA PT System Yves Jongen Founder & Chief Research Officer Ion Beam Applications s.a. Belgium 1 Outline A short introduction of a proton therapy
Ultrasound Dose Calculations
 Ultrasound Dose Calculations One of the advantages of ultrasound therapy remains the reasonably broad range of trials from which effective treatment doses can be established. In principle, there is no
LOW PRESSURE EFFUSION OF GASES adapted by Luke Hanley and Mike Trenary
 ADH 1/7/014 LOW PRESSURE EFFUSION OF GASES adapted by Luke Hanley and Mike Trenary This experiment will introduce you to the kinetic properties of low-pressure gases. You will make observations on the
Implementation of respiratory-gated VMAT on a Versa HD linear accelerator
 Received: 21 November 2016 Revised: 7 April 2017 Accepted: 5 June 2017 DOI: 10.1002/acm2.12160 RADIATION ONCOLOGY PHYSICS Implementation of respiratory-gated VMAT on a Versa HD linear accelerator Jeffrey
Original Article. Effective Point of Measurement in Cylindrical Ion Chamber for Megavoltage Photon Beams
 Iranian Journal of Medical Physics Vol. 10, No. 3, Summer 2013, 147-155 Received: April 22, 2013; Accepted: July 21, 2013 Original Article Effective Point of Measurement in Cylindrical Ion Chamber for
Radiotherapy Treatment Planning and Delivery
 Radiotherapy Treatment Planning and Delivery SCOPE 1: Study of Chemoradiotherapy in Oesophageal Cancer Plus or Minus Erbitux A randomised phase II/III multi-centre clinical trial of definitive chemo-radiation,
TG-51: Experience from 150 institutions, common errors, and helpful hints
 TG-51: Experience from 150 institutions, common errors, and helpful hints Ramesh C. Tailor, Ph. D., William F. Hanson, Ph.D., and Geoffrey S. Ibbott, Ph.D. Department of Radiation Physics, University of
EXPERIMENTAL RESULTS OF GUIDED WAVE TRAVEL TIME TOMOGRAPHY
 18 th World Conference on Non destructive Testing, 16-20 April 2012, Durban, South Africa EXPERIMENTAL RESULTS OF GUIDED WAVE TRAVEL TIME TOMOGRAPHY Arno VOLKER 1 and Hendrik VOS 1 TNO, Stieltjesweg 1,
Kill-painting of hypoxic tumors in charged particle therapy
 Supplementary Information: Kill-painting of hypoxic tumors in charged particle therapy Walter Tinganelli 1,2,, Marco Durante 1,3 *, Ryoichi Hirayama 2, Michael Krämer 1, Andreas Maier 1, Wilma Kraft-Weyrather
LOW PRESSURE EFFUSION OF GASES revised by Igor Bolotin 03/05/12
 LOW PRESSURE EFFUSION OF GASES revised by Igor Bolotin 03/05/ This experiment will introduce you to the kinetic properties of low-pressure gases. You will make observations on the rates with which selected
INTERCOMPARISON OF IONIZATION CHAMBER CALIBRATION FACTORS IN THE IAEA/WHO NETWORK OF SSDLS
 A9744593 INTERCOMPARISON OF IONIZATION CHAMBER CALIBRATION FACTORS IN THE IAEA/WHO NETWORK OF SSLS Ladislav Czap, Georg Matscheko and Pedro Andreo osimetry and Medical Radiation Physics Section, ivision
Larry A. DeWerd, Ph.D., FAAPM UW ADCL & Dept. of Medical Physics University of Wisconsin
 Larry A. DeWerd, Ph.D., FAAPM UW ADCL & Dept. of Medical Physics University of Wisconsin NCCAAPM Meeting Oct 11,2013 Larry DeWerd has a partial interest in Standard Imaging Talks from people who have been
A simple theoretical verification of monitor unit calculation for intensity modulated beams using dynamic mini-multileaf collimation
 Radiotherapy and Oncology 71 (2004) 235 241 Technical Note A simple theoretical verification of monitor unit calculation for intensity modulated beams using dynamic mini-multileaf collimation Nadine Linthout*,
Treatment plan complexity metrics for predicting IMRT pretreatment. assurance results. Scott Crowe, QUT
 Treatment plan complexity metrics for predicting IMRT pretreatment quality assurance results Scott Crowe, QUT Pre-treatment QA Verification of fluence delivery to ensure that dose can be delivered accurately
23 RD INTERNATIONAL SYMPOSIUM ON BALLISTICS TARRAGONA, SPAIN APRIL 2007
 23 RD INTERNATIONAL SYMPOSIUM ON BALLISTICS TARRAGONA, SPAIN 16-20 APRIL 2007 AN INVESTIGATION INTO THE INTERRELATION BETWEEN THE INTERNAL AND EXTERNAL BALLISTICS OF FIRING A TP-T TANK AMMUNITION M. H.
USER MANUAL PROGRAM VERSION 1.0.1
 R WWW..COM REF 92730-92731 USER MANUAL PROGRAM VERSION 1.0.1 STANDARD IMAGING, INC. 7601 Murphy Drive Middleton, WI 53562-2532 Dec / 2004 2004 Standard Imaging, Inc. DOC #80464-01 TEL 800.261.4446 TEL
Introduction. Introduction. The CyberKnife SRS/SBRT System. Introduction. Contour Structures. CyberKnife Components
 Introduction The CyberKnife SRS/SBRT System James M. Hevezi,, Ph.D., FACR CyberKnife Unit San Antonio, Texas CyberKnife Components Treatment Delivery (G3 Platform San Antonio) Robot (modified German auto
4D Target definition for SBRT : how to deal with moving targets, a practical approach
 4D Target definition for SBRT : how to deal with moving targets, a practical approach Dr. Alina Mihai, MD MSc Beacon Hospital, Dublin, Ireland From 3D to 4D Target Definitions (ICRU50/62) 3D CT 4D CT ICRU
Badan Jadrowych Nuclear Research Institute. Report INR No. 739/XIX/D CERN LIBRARIES, GENEVA CM-P Differential Recombination Chamber
 Badan Jadrowych Nuclear Research Institute Report INR No. 739/XIX/D CERN LIBRARIES, GENEVA CM-P00100517 Differential Recombination Chamber by M. Zel'chinskij K. Zharnovetskij Warsaw, June 1966 Translated
CORESTA RECOMMENDED METHOD N 6
 CORESTA RECOMMENDED METHOD N 6 DETERMINATION OF VENTILATION DEFINITIONS AND MEASUREMENT PRINCIPLES (2015 Revision September 2016) 1. SCOPE This CORESTA Recommended Method specifies a method for the determination
Iranian Journal of Medical Physics
 Iranian Journal of Medical Physics ijmp.mums.ac.ir Verification of Monitor Unit Calculations for Eclipse Treatment Planning System by in-house Developed Spreadsheet Athiyaman Mayivaganan 1*, Hemalatha
Lab # 03: Visualization of Shock Waves by using Schlieren Technique
 AerE545 Lab # 03: Visualization of Shock Waves by using Schlieren Technique Objectives: 1. To get hands-on experiences about Schlieren technique for flow visualization. 2. To learn how to do the optics
Surface buildup dose dependence on photon field delivery technique for IMRT
 Surface buildup dose dependence on photon field delivery technique for IMRT Shigeru Yokoyama, Peter L. Roberson, Dale W. Litzenberg, Jean M. Moran, and Benedick A. Fraass Department of Radiation Oncology,
A clinical comparison and analysis between conventional MLC based and solid compensator based IMRT treatment techniques
 The University of Toledo The University of Toledo Digital Repository Theses and Dissertations 2009 A clinical comparison and analysis between conventional MLC based and solid compensator based IMRT treatment
TEST REPORT BEAMSCAN WITH HALCYON
 TEST REPORT BEAMSCAN WITH HALCYON UZ Leuven, November 20 th, 2017 + = Ideal BEAMSCAN tank dimensions to fit perfectly into the Halcyon bore Fast tank positioning using the Halcyon lasers, no electronics
Commissioning and quality assurance for the treatment delivery components of the AccuBoost system
 JOURNAL OF APPLIED CLINICAL MEDICAL PHYSICS, VOLUME 16, NUMBER 2, 2015 Commissioning and quality assurance for the treatment delivery components of the AccuBoost system Ileana Iftimia, 1,2a Mike Talmadge,
Drilling Efficiency Utilizing Coriolis Flow Technology
 Session 12: Drilling Efficiency Utilizing Coriolis Flow Technology Clement Cabanayan Emerson Process Management Abstract Continuous, accurate and reliable measurement of drilling fluid volumes and densities
CHAPTER-2. Wedge filters are the most important beam modifiers used in
 CHAPTER-2 2. WEDGE FLTERS 2.1. NTRODUCTON Wedge filters are the most important beam modifiers used in radiotherapy which are placed in the path of photon beams to modify their isodose diistributions. The
Maintenance and general care of secondary standard and field instruments
 Maintenance and general care of secondary standard and field instruments This is without doubt the most important lecture that you will be given during this course. That rather rash statement is based
Varian HDR surface applicators commissioning and clinical implementation
 JOURNAL OF APPLIED CLINICAL MEDICAL PHYSICS, VOLUME 17, NUMBER 2, 2016 Varian HDR surface applicators commissioning and clinical implementation Ileana Iftimia, 1,2,a Andrea B. McKee, 1,2 and Per H. Halvorsen
COMPUTATIONAL FLOW MODEL OF WESTFALL'S LEADING TAB FLOW CONDITIONER AGM-09-R-08 Rev. B. By Kimbal A. Hall, PE
 COMPUTATIONAL FLOW MODEL OF WESTFALL'S LEADING TAB FLOW CONDITIONER AGM-09-R-08 Rev. B By Kimbal A. Hall, PE Submitted to: WESTFALL MANUFACTURING COMPANY September 2009 ALDEN RESEARCH LABORATORY, INC.
At each type of conflict location, the risk is affected by certain parameters:
 TN001 April 2016 The separated cycleway options tool (SCOT) was developed to partially address some of the gaps identified in Stage 1 of the Cycling Network Guidance project relating to separated cycleways.
Hardware Triaxial and Consolidation Testing Systems Pressure Measurement and Control
 25 GDS Helpsheet Hardware Triaxial and Consolidation Testing Systems Pressure Measurement and Control World Leaders in Computer Controlled Testing Systems for Geotechnical Engineers and Geologists 1. Digital
WEDGE FILTERS FOR MEGAVOLTAGE ROENTGEN RAY BEAMS
 Acta Radiologica Oncology 23 (1984) Fusc. 6 FROM THE RADIATION THERAPY DEPARTMENT, ANTON1 VAN LEEUWENHOEK HOSPITAL, THE NETHERLANDS CANCER INSTITUTE, AMSTERDAM, THE PHILIPS MEDICAL SYSTEMS DIVISION, BEST,
OUTPUT at dmax in tissue 8x8 20x20 At 100cm SSD At 100cm SAD
 RAPHEX 2001 T1. All of the following are true regarding Percentage Depth Dose (PDD) except: A. Increases with increasing energy. B. Depends on field size. C. Is the dose at depth expressed as a % of the
Autodesk Moldflow Communicator Process settings
 Autodesk Moldflow Communicator 212 Process settings Revision 1, 3 March 211. Contents Chapter 1 Process settings....................................... 1 Profiles.................................................
arxiv: v1 [physics.ins-det] 16 Aug 2014
![arxiv: v1 [physics.ins-det] 16 Aug 2014](/thumbs/90/101993511.jpg "arxiv: v1 [physics.ins-det] 16 Aug 2014") Preprint typeset in JINST style - HYPER VERSION RPC Gap Production and Performance for CMS RE4 Upgrade arxiv:1408.3720v1 [physics.ins-det] 16 Aug 2014 Sung Keun Park, Min Ho Kang and Kyong Sei Lee Korea
Preprint typeset in JINST style - HYPER VERSION RPC Gap Production and Performance for CMS RE4 Upgrade arxiv:1408.3720v1 [physics.ins-det] 16 Aug 2014 Sung Keun Park, Min Ho Kang and Kyong Sei Lee Korea
Dynamic wedges dosimetry and quality control
 Original Paper Received: 2005.06.07 Accepted: 2006.02.28 Published: 2006.04.28 Authors Contribution: A Study Design B Data Collection C Statistical Analysis D Data Interpretation E Manuscript Preparation