Pedestrian and Bicycle Safety Study
|
|
|
- Winfred Pitts
- 5 years ago
- Views:
Transcription


1 Palm Beach MPO Pedestrian and Bicycle Safety Study
2 Palm Beach Metropolitan Planning Organization presents Pedestrian and Bicycle Safety Study Prepared by: Kimley-Horn and Associates, Inc. The preparation of this report has been financed in part by the U.S. Department of Transportation (USDOT), through the Federal Highway Administration (FHWA) and/or the Federal Transit Administration (FTA), the State Planning and Research Program (Section 55 of Title 3, U.S. Code) and Palm Beach County, Florida. ãkimley-horn and Associates, Inc. February The contents of this report do not necessarily reflect the official views or policy of the U.S. Department of Transportation.
3 Executive Summary Pedestrian and bicyclist crashes and the resulting deaths and injuries are a serious problem on our nation s roadways, and Palm Beach County is no exception. Over 5% of all traffic related fatalities in Florida and Palm Beach County involved a motor vehicle hitting a pedestrian or pedalcyclist (1). Source: National Highway Traffic Safety Administration (NHTSA) The Palm Beach MPO conducted the Pedestrian and Bicycle Safety Study to formally analyze five years of pedestrian and bicyclist crash data in Palm Beach County and develop evidencebased recommendations for safety countermeasures, educational strategies, and performance targets. Crash data from 1 to 14 were obtained and analyzed from the Florida Department of Transportation s (FDOT) Unified Basemap Repository (UBR). A total of 1,743 traffic collisions with pedestrians and 1,534 traffic collisions with bicyclists were recorded from the timeframe studied. Hospital data from the Florida Department of Health s (FDOH) Florida Injury Surveillance Data System provided unique insights into injuries that are not recorded in the traffic collision data, particularly juvenile bicyclist crashes Year Pedestrian Bicyclist Source: 1-14 FDOT UBR Data Pedestrian and Bicyclist Crashes (1) Pedalcyclist and bicyclist are generally interchangeable terms for this purpose, a person on a vehicle powered solely by pedals. 3
4 Crash density and hot spot analysis maps were prepared based on the FDOT UBR data. Ten clusters of hot spots and 1 high crash corridors were identified. The following tables show recommended countermeasures based on the crash data. Additional studies including pedestrian road safety audits may be needed to further the implementation strategy. Quantifiable safety targets and performance measures are valuable because tracking progress will determine if the initiatives are meeting the targets. The Palm Beach MPO will monitor the Bicycle and Pedestrian Safety Performance Measures and Targets with the ultimate goal of zero incidents and will work with partner agencies to achieve the Safety Initiatives. Top 1 Hot Spot Potential Countermeasures Map ID Location Potential Countermeasures ROW Ownership S1 Palmetto Park Road at Federal Highway Median Crossings S Atlantic Avenue at NE 5 Avenue/Old Dixie Highway Bus Stop Treatments S3 Boynton Beach Boulevard at Seacrest Boulevard Lane Eliminations/Narrowing S4 Lake Worth Road at Congress Avenue Crossing Islands City of Boca Raton FDOT City of Delray Beach FDOT County FDOT County FDOT S5 Lake Worth Road at Davis Road Bus Stop Treatments Speed Monitoring Devices Village of Palm Springs County FDOT S6 Lake Worth Road at Jog Road Bus Stop Treatments County FDOT S7 Military Trail at Forest Hill Boulevard Leading Pedestrian Interval FDOT Bus Stop Treatments S8 Dr Martin Luther King Jr Boulevard at SW 5 Street Raised Pedestrian Crossings Lane Eliminations/Narrowing Pedestrian Hybrid Beacons City of Belle Glade Accessible Pedestrian Signals S9 Okeechobee Boulevard at Military Trail Leading Pedestrian Interval Lighting and Illumination FDOT S1 45 Street at Australian Avenue Accessible Pedestrian Signals Flashing Yellow Arrow County 4


5 Top 1 High Crash Corridor Potential Countermeasures Map ID Location Potential Countermeasures ROW Ownership C1 Federal Highway from Camino Real to Glades Road Exclusive Pedestrian Phasing Speed Monitoring Devices FDOT Advanced Stop Lines/Bike Boxes C Ocean Boulevard from Linton Boulevard to Thomas Street Leading Pedestrian Interval Speed Monitoring Devices FDOT Advanced Stop Lines/Bike Boxes Shared Lane Markings C3 Atlantic Avenue from Military Trail to Ocean Boulevard Median Crossings Exclusive Pedestrian Phasing Leading Pedestrian Interval Lighting and Illumination City of Delray Beach FDOT C4 Lantana Road from Jog Road to Military Trail Bus Stop Treatments County Leading Pedestrian Interval C5 Lake Worth Road from Jog Road to Lakeside Drive Flashing Yellow Arrow Prohibited Right Turn on Red Lighting and Illumination FDOT C6 Military Trail from Melaleuca Lane to Community Drive Flashing Yellow Arrow Lighting and Illumination County FDOT Bus Stop Treatments C7 Okeechobee Road from Drexel Road to Congress Avenue Accessible Pedestrian Signals Lighting and Illumination FDOT C8 US 1 from Okeechobee Boulevard to 49 Street Prohibited Right Turn on Red Lighting and Illumination City of West Palm Beach FDOT C9 Northlake Boulevard from Military Trail to Alt A1A Lighting and Illumination County C1 Indiantown Road from Central Boulevard to Alt A1A Crossing Islands Rectangular Rapid Flashing Beacons FDOT Potential Countermeasure: Median Crossings Potential Countermeasure: Lighting & Illumination Potential Countermeasure: K-1 Pedestrian and Bicycle Education 5
6 LYONS RD JOG RD C1 LAKE SHORE DR The Glades MUCK CITY RD OKEECHOBEE RD HATTON HWY CONNERS HWY HOOKER HIGHWAY GATOR BLVD US 7/SR 5 BACOM POINT RD S8 CR 87A BELLE GLADE RD TABIT RD MUCK CITY RD 5 1 Miles DUDA RD CR 88 CONNERS HWY HOOKER HIGHWAY GATOR BLVD BROWNS FARM RD CR 88 LION COUNTRY SAFARI MARTIN COUNTY SEM PRATT WHITNEY RD INDIANTOWN RD AERO CLUB DR TEMPLE BLVD ORANGE BLVD Palm Beach MPO Pedestrian and Bicycle Safety Study Top 1 Hot Spots & Top 1 High Crash Corridors TIP Projects FY 17-1 I COCONUT BLVD 1 AVE N SR 7 EXTENSION SOUTHERN BLVD PIERSON RD SR-7 JUPITER FARMS RD LAKE WORTH RD BEELINE HWY PGA BLVD NORTHLAKE BLVD OKEECHOBEE BLVD FOREST HILL BLVD PINEHURST DR ISLAND WAY JOG RD PIONEER RD S6 C7 HAVERHILL RD C1 CENTRAL BLVD HOOD RD C6 MILITARY TRAIL S9 S7 PURDY LN TEQUESTA DR TONEY PENNA DR KIRK RD ALT A1A GARDEN RD 45 ST MELALEUCA LN C9 PROSPERITY FARMS RD S5 S4 ELLISON WILSON RD S1 OCEAN DR FEDERAL HWY/US1/SR5 OLD DIXIE HWY 36 ST 5 ST C8 BELVEDERE RD SUMMIT BLVD DIXIE HWY C5 6 AVE S FLAGLER DR FLAGLER DR OCEAN BLVD OCEAN BLVD S COUNTY RD US 7/SR 5 BROWNS FARM RD Note: Pedestrian crashes, typically more prevalent than bicycle crashes, are shown in the map. The complimentary bicyclist crash density map is included within the study in Figure 51. Legend Hot Spots High Crash Corridors Pedestrian Crash Density Low Crashes Low-Medium Crashes Medium Crashes Medium-High Crashes High Crashes LOXAHATCHEE RD BROWARD COUNTY CAIN BLVD PONDEROSA DR SR 7/US 441 LYONS RD FLORIDA'S TURNPIKE ATLANTIC AVE GLADES RD YAMATO RD C4 BOYNTON BCH BLVD HAGEN RANCH RD HAGEN RANCH RD PALMETTO PARK RD MILITARY TR CONGRESS AVE SW 18 ST LANTANA RD HYPOLUXO RD LAKE IDA RD CLINT MOORE RD CAMINO REAL MINER RD NW AVE C3 S1 INTERSTATE 95 GATEWAY BLVD LINTON BLVD FAU BLVD AIRPORT RD SW 18 ST DIXIE HWY FEDERAL HWY S3 S C OCEAN BLVD BROADWAY 6
7 Pedestrian and Bicycle Safety Performance Measures and Targets Objective Reduce the number of. Current Value (14) (1) 5 Target Vision () Pedestrian Injuries Pedestrian Fatalities 3 15 Bicyclist Injuries Bicyclist Fatalities 9 4 Pedestrian and Bicyclists Injuries and Fatalities that occurred within the hot spots and high crash corridors Juvenile (Age -18) Bicycle and Pedestrian Crashes 8 41 Reduce pedestrian and bicyclist crashes that occur under dark conditions and between 1pm and 6am 57 (3) 8 (1) The current value (14) are obtained from FDOT UBR data. () Palm Beach MPO strives towards Vision Zero; where no pedestrians and bicyclists are injured or killed. (3) Accounts for the number of crashes occur under dark conditions where street lights are both present and not present. Safety Initiatives Initiative Lead Agency Partners Goal Provide complete streets/safety education workshops Conduct road safety audits (RSAs) for hot spots & corridors identified in this plan Conduct crosswalk safety campaigns in hot spots in this plan Educate children on pedestrian and bicycle safety skills Educate adults on bicycle safety skills Implement bike light safety campaigns to educate and distribute bike lights to cyclists in each hot spot and corridor identified in this plan Palm Beach MPO Palm Beach MPO Local Law Enforcement Palm Beach County School District League of American Bicyclists Local Law Enforcement and FDOT Local Municipalities, Palm Beach County Engineering, FDOT, FHWA, and FAU Center for Urban & Environmental Solutions (CUES) FDOT, Local Municipalities, and Palm Beach County Engineering FDOT Community Traffic Safety Team (CTST) and Alert Today Alive Tomorrow, Local Municipalities, Palm Beach County Engineering, FDOT, FHWA, South Florida Regional Transportation Authority (SFRTA), and Palm Tran FDOT Safe Routes to School, SafeKids, WalkSafe, BikeSafe, Palm Beach YMCAs, and FAU CUES Adult Education Organizations, FDOT, Palm Beach MPO, Local Municipalities, and AARP Local Municipalities FDOT CTST and Alert Today Alive Tomorrow, and League of American Cyclists At least 1 Workshop annually At least 1 RSA annually At least 1 Campaign annually All K-1 Schools Implement Curriculum annually At least 1 Training annually At least 1 Campaign annually 7
8 Table of Contents Chapter 1. Introduction...11 Chapter. Literature Review...1 Chapter 3. Data Collection and Analysis...13 Chapter 4. Recommendations...61 List of Figures Figure 1. Strava Data Pedestrians...14 Figure. Strava Data Cyclists...15 Figure 3. Pedestrian Fatalities by Year...16 Figure 4. Pedestrian Injuries by Year...16 Figure 5. Pedalcyclist Fatalities by Year...17 Figure 6. Pedalcyclist Injuries by Year...17 Figure 7. Pedestrian Fatalities by Age...18 Figure 8. Pedestrian Injuries by Age...18 Figure 9. Pedalcyclist Fatalities by Age...19 Figure 1. Pedalcyclist Injuries by Age...19 Figure 11. Percentage of Fatalities Involving a Motor Vehicle... Figure Pedestrian and Pedalcyclist Fatalities...1 Figure 13. Pedestrian Fatalities by Lighting Condition... Figure 14. Percentage Pedestrian Fatalities by Time of Day...3 Figure 15. Percentage Pedalcyclist Fatalities by Time of Day...4 Figure 16. Pedestrian Fatalities in Traffic Crashes by Age...5 Figure 17. Pedestrian Injuries in Traffic Crashes by Age...5 Figure 18. Pedalcyclist Fatalities by Age...6 Figure 19. Pedalcyclist Injuries by Age...6 Figure. Pedestrian Crashes by Weather Condition...7 Figure 1. Pedestrian Crashes with Alcohol/Drugs Involved...8 Figure. Bicyclist Crashes by Weather Condition...8 Figure 3. Bicyclist Crashes with Alcohol/Drugs Involved...9 Figure 4. Pedestrian and Bicyclist Crashes...3 8
9 Figure 5. Pedestrian Crashes by Time of Day...31 Figure 6. Pedestrian Crashes by Month...3 Figure 7. Pedestrian Crashes by Day of Week...3 Figure 8. Pedestrian Crashes by Road Surface Condition...33 Figure 9. Pedestrian Crashes by Weather Condition...33 Figure 3. Pedestrian Crashes by Alcohol/Drugs Involvement...34 Figure 31. Pedestrian Injury Severity...35 Figure 3. Pedestrian Crashes by Lighting Condition...35 Figure 33. Pedestrian Crashes by Age...36 Figure 34. Pedestrian Crashes by Gender...37 Figure 35. Bicyclist Crashes by Time of Day...38 Figure 36. Bicyclist Crashes by Month...38 Figure 37. Bicyclist Crashes by Day of Week...39 Figure 38. Bicyclist Crashes by Road Surface Condition...39 Figure 39. Bicyclist Crashes by Weather Condition...4 Figure 4. Bicyclist Crashes Alcohol/Drugs Involvement...41 Figure 41. Bicyclist Injury Severity...4 Figure 4. Bicyclist Crashes by Lighting Condition...4 Figure 43. Bicyclist Crashes by Bike Lane Position...43 Figure 44. Bicyclist Crashes by Age...44 Figure 45. Bicyclist Crashes by Gender...44 Figure Pedestrian Crash Density...48 Figure Pedestrian Crash Density (Alcohol/Drug Related)...49 Figure Pedestrian Crash Density (Juvenile Related Under Age 18)...5 Figure Pedestrian Crash Density (Elderly Related-Over Age 65)...51 Figure Pedestrian Crash Density (Nighttime Related-Between -6)...5 Figure Bicyclist Crash Density...53 Figure Bicyclist Crash Density (Alcohol/Drug Related)...54 Figure Bicyclist Crash Density (Juvenile Related Under Age 18)...55 Figure Bicyclist Crash Density (Elderly Related-Over Age 65)...56 Figure Bicyclist Crash Density (Nighttime Related-Between -6)...57 Figure 56. Top 1 Hot Spots and Top 1 High Crash Corridors...6 9
10 List of Tables Table 1. Data Sources...13 Table. Pedestrian Fatalities in the United States, Florida, and Palm Beach County...3 Table 3. Pedalcyclist Fatalities in the United States, Florida, and Palm Beach County...3 Table 4. Top 1 Hot Spots...58 Table 5. Top 1 High Crash Corridors...59 Table 6. Pedestrian and Bicycle Safety Performance Measures and Targets...9 Table 7. Safety Initiatives...91 List of Appendices Appendix A: Literature Review Appendix B: Crash Data Maps Appendix C: Transportation Improvement Program (TIP) Projects FY 17-1 Appendix D: Individual Spots/Corridors Appendix E: Lighting and Illumination Appendix F: Palm Beach MPO Initiatives 1
11 Chapter 1. Introduction Pedestrian and bicyclist crashes and the resulting deaths and injuries are a serious problem on our nation s roadways, and Palm Beach County is no exception. In 13, 4,735 pedestrians were killed in traffic crashes in the United States, representing fourteen percent (14%) of all roadwayrelated fatalities (NHTSA, 13). Seventy-three percent (73%) of pedestrian fatalities occur in urban areas. As well in 13, 743 pedalcyclists (1) were killed in traffic crashes, representing.3 percent (.3%) of all roadway-related fatalities (NHTSA, 13). Sixty-eight percent (68%) of all pedalcyclist fatalities occur in urban areas. Transportation for America s Dangerous by Design, cites that most pedestrian and bicyclist crashes occur in areas with insufficient infrastructure such as the lack of nighttime roadway lighting, sidewalks, and signals/signs. Wider roads (arterials) have also been regarded as a factor for crashes since, without countermeasures such as a refuge island, the crossing distance becomes large for the pedestrian and bicyclist to navigate. The absence of sufficient infrastructure is exacerbated when roadways are designed primarily for high speed traffic because the survivability of a crash is significantly reduced. The implementation of countermeasures will reduce current risk faced by pedestrians and bicyclists. Examples of countermeasures include crossing islands, bus stop treatments, and advanced stop lines/bike boxes. When installed in high pedestrian/bicyclist traffic areas, these countermeasures have been shown to reduce the risk of crashes and fatalities. How to Use this Document The Palm Beach MPO Pedestrian and Bicycle Safety Study provides information to transportation professionals and community stakeholders intended to result in positive outcomes for nonmotorized safety. Transportation agencies and local government staff can use the document to understand typical crash patterns, identify whether an upcoming project may be within a high crash area, select optimal safety countermeasures, work toward the common goal of implementing countermeasures, and working toward achieving safety targets. (1) Pedalcyclist and bicyclist are generally interchangeable terms for this purpose, a person on a vehicle powered solely by pedals. Pedestrians are a part of every roadway environment, and attention should be paid to their presence in rural areas as well as urban areas pedestrians are the lifeblood of our urban areas, especially in the downtown and other retail areas. (AASHTO, 1) 11


12 Chapter. Literature Review An examination of previous work regarding bicyclist and pedestrian safety was conducted as a base for the literature research of this Pedestrian and Bicycle Safety Study. National and state literature was reviewed to identify countermeasures that could be reasonably implemented. Listed below are the documents reviewed. Appendix A summarizes the key points from the literature review and the positive impacts on pedestrian and bicyclist safety from the national and state work. Countermeasures That Work: A Highway Safety Countermeasure Guide for State Highway Safety Offices, Eighth Edition, NHTSA, 15 FHWA Concludes Pedestrian Countermeasure Study in Three Cities. Tamara Redmon. ITE Journal, Volume 81, Number 8. August 11 Dangerous By Design, Smart Growth America, 14 Effects of Shared Lane Markings on Bicyclist and Motorist Behavior, Federal Highway Administration, 4 PEDSAFE: Pedestrian Safety Guide and Countermeasure Selection System, 4 BIKESAFE: Bicycle Countermeasure Selection System, 6 Pedestrian Safety Engineering and ITS-Based Countermeasures Program for Reducing Pedestrian Fatalities, Injury Conflicts, and Other Surrogate Measures Final System Impact Report, Federal Highway Administration, 9 Pedestrian Countermeasure Policy Best Practice Report, Federal Highway Administration Best Practices in State Bicycle and Pedestrian Planning. Florida Planning and Development Lab, Florida State University, Department of Urban and Regional Planning, 5 Florida Pedestrian and Bicycle Strategic Safety Plan. The Center for Urban Transportation Research, University of South Florida, 13 Florida Strategic Highway Safety Plan, Florida Department of Transportation, 1 1
13 Chapter 3. Data Collection and Analysis Data collection and analysis activities were conducted for the purposes of identifying crash trends for pedestrians and bicyclists. The data types analyzed along with their respective sources are listed in Table 1. Crash density and hot spot analysis maps were done through the use of Geographic Information System (GIS) based on Florida Department of Transportation (FDOT) Unified Basemap Repository (UBR) data. Crash density maps illustrate the geographic dispersion and clustering of crashes. Hot spot analysis maps identified ten (1) clusters of hot spots and ten (1) high crash corridors for pedestrian and bicyclist crashes. It is important to be aware that each data source is limited in some way. The Florida Department of Health s (FDOH) Florida Injury Surveillance Data System data primarily comes from death certificates, hospital discharge data, and emergency department discharge data. Florida Department of Highway Safety and Motor Vehicles (DHSMV) Traffic Crash Facts Annual Report sources their data from crash reports submitted by Florida officers. The FDOT UBR is based on DHSMV data. Using only a few sources to obtain information can lead to incomplete data and therefore a potentially misleading conclusion. It is important to note, data from FDOT UBR, as opposed to FDOH, DHSMV, and National Highway Traffic Safety Administration (NHTSA), refers to pedalcyclists as bicyclists (no difference in definition for purposes of this Study); therefore, bicyclist will be used when presenting FDOT UBR data. Table 1. Data Sources Source FDOH DHSMV NHTSA Palm Beach County crash system data FDOT UBR Data Type Health-related data Crash-related data Strava User Data A review of data available through Strava.com was also conducted as a tool to study bicycle trip patterns. Strava is a smartphone-based application that uses GPS location to track data about runs, walks, or bike rides taken by its members. The data available through Strava provides an overview of popular routes for pedestrians and cyclists. Smartphone-based applications such as 13

14 Strava are largely used by runners and experienced on-road bicyclists who use their bike for recreational activity. The userbase is a small sample of all runners, walkers, or cyclists. Data Retrieved: June 16 Low High Pedestrian Route Usage Figure 1. Strava Data Pedestrians Figure 1 displays pedestrian route usage data from Strava. Thick red and thinner blue routes signify high and low usage rates, respectively. A close look at the west side of Palm Beach County reveals residential areas as high route usage zones. In particular, the Cities of Wellington, Boca Raton, and West Palm Beach have high concentrations of route usage. The barrier island of Palm Beach County also has a high concentration of pedestrian route usage. Aside from the attraction of the beach, there are lively areas situated along the coast that lend themselves to pedestrian traffic. Delray Beach, Boynton Beach, and Lake Worth also have popular downtown areas in the eastern core. 14

15 Data Retrieved: June 16 Low High Bicyclist Route Usage Figure. Strava Data Cyclists Figure is another representation of data from Strava users but this time from bicyclists. Both maps are very similar, with high route usage concentrated in residential areas and along the coast. The Cities of Wellington, Boca Raton, and West Palm Beach continue to be areas of high route usage. The northern communities of Palm Beach Gardens and Jupiter also have some of the highest concentrations of route usage by bicyclists. Health-Related Data Analysis Palm Beach County data for pedalcyclist and pedestrian related fatalities, hospitalizations, and emergency department admissions were retrieved from the FDOH. The FDOH specifically categorizes these events as either involving a motor vehicle or not. Figure 3 and Figure 4 display the yearly total of pedestrian fatalities and injuries from 1 to 14. By far, most of the pedestrian fatalities and injuries involved a motor vehicle. The data suggests an increasing trend of pedestrian fatalities involving motor vehicles. In addition, pedestrian injuries involving motor vehicles shows a slight increase trend. In the five (5) years of data collected, 1 had the most 15
16 non-motor vehicle related pedestrian fatalities and the least non-motor vehicle related pedestrian injuries. 5 Pedestrian Fatalities by Year 4 Count Year Pedestrian/Motor Vehicle Traffic Pedestrian/Non-Motor Vehicle Traffic Source: FDOH Injury Surveillance Data System Figure 3. Pedestrian Fatalities by Year Count Pedestrian Injuries by Year Year Pedestrian/Motor Vehicle Traffic Pedestrian/Non-Motor Vehicle Traffic Source: FDOH Injury Surveillance Data System Figure 4. Pedestrian Injuries by Year Figure 5 and Figure 6 shows the yearly pedalcyclist fatalities and injuries from 1 to 14. The majority of pedalcyclist fatalities involved a motor vehicle. In 14, there were no pedalcyclist 16
17 fatalities in non-motor vehicle crashes. In contrast, most of the pedalcyclist injuries did not involve a motor vehicle. Count Pedalcyclist Fatalities by Year Year Pedalcyclist/Motor Vehicle Traffic Pedalcyclist/Non-Motor Vehicle Traffic Source: FDOH Injury Surveillance Data System Figure 5. Pedalcyclist Fatalities by Year, Pedalcyclist Injuries by Year 1,5 Count 1, Year Pedalcyclist/Motor Vehicle Traffic Pedalcyclist/Non-Motor Vehicle Traffic Source: FDOH Injury Surveillance Data System Figure 6. Pedalcyclist Injuries by Year Figure 7 and Figure 8 show total pedestrian fatalities and injuries by age from 1 to 14. Pedestrian fatalities and injuries were most common in ages Pedestrians aged experienced the second most fatalities. 17

18 Count Pedestrian Fatalities by Age < Age Pedestrian/Motor Vehicle Traffic Pedestrian/Not Motor Vehicle Traffic Source: FDOH Injury Surveillance Data System Figure 7. Pedestrian Fatalities by Age 5 Pedestrian Injuries by Age 4 Count 3 1 < Age Pedestrian/Motor Vehicle Traffic Pedestrian/Not Motor Vehicle Traffic Source: FDOH Injury Surveillance Data System Figure 8. Pedestrian Injuries by Age Figure 9 shows most pedalcyclist deaths involving a motor vehicle occurred in ages The spread of fatalities amongst ages were even with no age group being overrepresented. Figure 1 shows pedalcyclist injuries not involving a motor vehicle; young pedalcyclists under the age of 15 (particularly ages 5-14) were overrepresented along with the middle age group (particularly ages 44-54). An interesting result from studying FDOH data are that most pedalcyclist injuries did not involve a motor vehicle, especially for schoolchildren ages


19 1 Pedalcyclist Fatalities by Age 8 Count 6 4 < Age Pedalcyclist/Motor Vehicle Traffic Pedalcyclist/Not Motor Vehicle Traffic Source: FDOH Injury Surveillance Data System Figure 9. Pedalcyclist Fatalities by Age, Pedalcyclist Injuries by Age 1,5 Count 1, 5 < Age Pedalcyclist/Motor Vehicle Traffic Pedalcyclist/Not Motor Vehicle Traffic Source: FDOH Injury Surveillance Data System Figure 1. Pedalcyclist Injuries by Age Department of Highway Safety and Motor Vehicles (DHSMV) The following is a compilation of county and state data from the DHSMV. The most current data available from the DHSMV is from the year of 14. In 14, Palm Beach County was ranked as one of the top five (5) counties out of 67 counties in Florida with the highest PBC Rankings State wide #3 in Pedestrian Crashes and Injuries #4 in Pedestrian Fatalities #4 in Pedalcyclist Crashes and Injuries #5 in Pedalcyclist Fatalities Source: 14 DHSMV Crash Facts 19
20 pedestrian and pedalcyclist crashes, injuries and fatalities. Also, over twenty-five percent (5%) of all traffic related fatalities in Florida involved a motor vehicle hitting a pedestrian or pedalcyclist as shown in Figure 11. In addition, less than fifty percent (5%) of all traffic related fatalities in Florida involved another motor vehicle. Percentage of Fatalities Involving a Motor Vehicle Other 18% Pedestrian % Tree 7% Rollover 5% Pedalcyclist 5% MV In Transport 43% Source: 14 DHSMV Crash Facts Figure 11. Percentage of Fatalities Involving a Motor Vehicle
21 National Highway Traffic Safety Administration (NHTSA) The following analysis is made from national and state data taken from NHTSA s 13 Traffic Safety Facts. NHTSA concluded that 5.5 percent (5.5%) of total traffic related fatalities in Florida were pedalcyclist fatalities, the highest in the nation and more than double the nation s average of.3 percent (.3%). However, this statistic slightly decreased the next year to 5.1 percent (5.1%), as reported by the DHSMV s 14 Crash Facts. NHTSA also reported that twenty-five percent (5%) of the pedestrian deaths were during crashes that involved hit and run drivers. Figure 1 depicts the total pedestrian and pedalcyclist fatalities in traffic crashes from 4 to 13 in United States. The number of pedestrian and pedalcylist fatalities were relatively the same trend and both decreased in the year 9. Number of Fatalities Pedestrian and Pedalcyclist Fatalities 5, 4,5 4, 3,5 3,,5, 1,5 1, Year Pedestrian Fatalities Pedalcyclist Fatalities Source: 13 NHTSA Pedestrian Traffic Safety Facts Figure Pedestrian and Pedalcyclist Fatalities Figure 13 displays data from NHTSA on pedestrian fatalities by lighting conditions. It is noted that the majority of fatalities occurred during dark lighting conditions. 1
22 Percentage of Pedestrian Fatalities by Lighting Condition Dawn % Dusk % Daylight 5% Dark 71% Source: 13 NHTSA Pedestrian Traffic Safety Facts Figure 13. Pedestrian Fatalities by Lighting Condition Table and Table 3 compares Palm Beach pedestrian and pedalcyclist fatalities with statewide and national information. As of 14, Florida and Palm Beach County have nearly double the national average ratio for pedalcyclist fatalities to total traffic fatalities. Also, when compared to the national average, Florida and Palm Beach County have experienced a higher percentage of pedestrian deaths relative to total traffic fatalities. However, Palm Beach County, has fewer pedestrian and pedalcyclist fatalities per million persons than the state of Florida as a whole, but this figure is still higher than the national average.
23 Table. Pedestrian Fatalities in the United States, Florida, and Palm Beach County Pedestrian Fatalities (1) Source: 13 NHTSA Traffic Safety Facts (US table data) () Source: 14 DHSMV Crash Facts (PBC, Florida facts) Pedestrians Percentage of Total Fatalities Fatalities per Million Persons United States (1) 4, Florida () Palm Beach () Table 3. Pedalcyclist Fatalities in the United States, Florida, and Palm Beach County Pedalcyclist Fatalities (1) Source: 13 NHTSA Traffic Safety Facts (US table data) () Source: 14 DHSMV Crash Facts (PBC, Florida facts) Pedalcyclists Percentage of Total Fatalities Fatalities per Million Persons United States (1) Florida () Palm Beach () Figure 14 displays the total percentage of pedestrian fatalities in traffic crashes by time of day. About forty-eight percent (48%) of pedestrian fatalities occurred during 6 pm 11:59 pm which is consistent with Figure 13, majority of pedestrian fatalities occurred during dark lighting conditions. Percentage Pedestrian Fatalities by Time of Day 1: am - :59 am 3: am - 5:59 am 3% 1% 6: am - 8:59 am 1% 9: am - 11:59 am 1: pm - :59 pm 9% 3: pm - 5:59 pm 6: pm - 8:59 pm 9: pm - 11:59 pm 5% 1% 6% 5% Source: 13 NHTSA Traffic Safety Facts Figure 14. Percentage Pedestrian Fatalities by Time of Day 3
24 Figure 15 shows the time of day pedalcyclist fatalities occurred. About twenty-two percent (%) occurred during 6 pm 8:59 pm. Pedestrian fatalities during the same timeframe is similar at twenty-five percent (5%). However, only thirty-nine percent (39%) of pedalcyclist fatalities occurred during 6 pm 11:59 pm. Percentage Pedalcyclist Fatalities by Time of Day 1: am - :59 am 3: am - 5:59 am 6: am - 8:59 am 17% 5% 5% 11% 9: am - 11:59 am 1: pm - :59 pm % 11% 3: pm - 5:59 pm 6: pm - 8:59 pm 9: pm - 11:59 pm 17% 11% Source: 13 NHTSA Traffic Safety Facts Figure 15. Percentage Pedalcyclist Fatalities by Time of Day Figure 16 and Figure 17 display the nationwide total of pedestrian fatalities and injuries by age, respectively. The majority of pedestrian fatalities are from ages 45-59, which is consistent with Figure 7 (1-14 PBC Pedestrian Fatalities by Age). However, ages 15-9 experienced the most injuries, which is consistent with Figure 8 (1-14 PBC Pedestrian Injuries by Age). 4
25 Age Source: 13 NHTSA Pedestrian Traffic Safety Facts Count Pedestrian Fatality in Traffic Crashes by Age Figure 16. Pedestrian Fatalities in Traffic Crashes by Age 1, 9, 8, 7, 6, 5, 4, 3,, 1, Age Source: 13 NHTSA Pedestrian Traffic Safety Facts Figure 17. Pedestrian Injuries in Traffic Crashes by Age Count Pedestrians Injured in Traffic Crashes by Age Figure 18 and Figure 19 displays the nationwide total of pedalcyclist fatalities and injuries by age, respectively. The majority of pedalcyclist fatalities are from ages 45-59, which is consistent with Figure 16 (Pedestrian Fatalities in Traffic Crashes by Age). Majority of pedacylists injuries are from ages 15-9, which is similar as Figure 17 (Pedestrian Injuries in Traffic Crashes by Age). 5
26 1 Pedalcyclist Fatalities by Age 1 8 Count Age Source: 13 NHTSA Traffic Safety Facts Figure 18. Pedalcyclist Fatalities by Age Count 1, 9, 8, 7, 6, 5, 4, 3,, 1, Pedalcyclist Injured by Age Age Source: 13 NHTSA Traffic Safety Facts Figure 19. Pedalcyclist Injuries by Age Palm Beach County Crash System Data Palm Beach County pedestrian and bicyclist crash data was obtained from the Palm Beach County Traffic Division s (PBCTD) traffic crash database. The data spans over five (5) years from 1 to 14. During this time frame, the PBCTD reported,591 pedestrian crashes and 1,714 bicyclist crashes. 6
27 Figure illustrates the pedestrian crashes by weather condition. The majority of the accidents happened during clear weather. The reason for this could be that people are usually less willing to walk during cloudy and rainy weather.,5 Pedestrian Crashes by Weather Condition, 1,5 1, 5 - Clear Cloudy Rain All Other Weather Condition Source: 1-14 PBCTD Crash System Data Figure. Pedestrian Crashes by Weather Condition Figure 1 shows the percentage of pedestrian crashes in which alcohol or drugs were involved. Police officers did not report alcohol or drugs involvement in about eighty-eight percent (88%) of these accidents. Testing subjects involved in these accidents for alcohol or drugs, is usually only done when the officer suspects such involvement. As a result, little beneficial data can be extracted from this chart since it involves the bias of the officer in deciding whether or not to administer an alcohol/drug test. 7
28 Pedestrian Crashes with Alcohol/Drugs Involved 7% 5% Unknown No Yes 88% Source: 1-14 PBCTD Crash System Data Figure 1. Pedestrian Crashes with Alcohol/Drugs Involved Figure illustrates bicyclist crashes by weather condition. Following a pattern identical to pedestrian crashes, the majority of bicyclist crashes happened during clear weather with cloudy and rainy weather following behind respectively. 1,4 Bicyclist Crashes by Weather Condition 1, 1, Clear Cloudy Rain Other Weather Condition Source: 1-14 PBCTD Crash System Data Figure. Bicyclist Crashes by Weather Condition 8
 of the crashes involving bicyclists had information about alcohol/drug involvement. Of the twenty percent (%), three percent (3%) had alcohol/drug involvement.")
29 In stark contrast to pedestrian data, a larger percentage of individuals involved in bicyclist crashes were tested for the presence of alcohol or drugs as shown in Figure 3. About twenty percent (%) of the crashes involving bicyclists had information about alcohol/drug involvement. Of the twenty percent (%), three percent (3%) had alcohol/drug involvement. When comparing percentages, pedestrian crashes were involved with more alcohol/drug involvement than bicyclist crashes. Bicyclist Crashes with Alcohol/Drugs Involved 17% Unknown 3% No Yes 8% Source: 1-14 PBCTD Crash System Data Figure 3. Bicyclist Crashes with Alcohol/Drugs Involved 9
30 Crash Data Statistics Palm Beach County pedestrian and bicyclist crash data as reported to the DHSMV were obtained from FDOT UBR. The latest five (5) years of verified crash data was from January 1 to December 14 at the time of analysis. Pedestrian crashes increased from 1 to 13 with a slight decrease in 14 and bicyclist crashes increased from 1 to 1 and decreased from 1 to 14 as shown in Figure 4. A total of 1,743 traffic collisions with pedestrians were recorded from 1 to 14 and a total of 1,534 traffic collisions with bicyclists were recorded from 1 to 14. In comparison with statistics collected from the Palm Beach County Crash System Data, from 1 to 14, Palm Beach County had,591 traffic collisions with pedestrians (about 49% more than FDOT UBR reported data) and 1,714 traffic collisions with bicyclists (1% more than FDOT UBR data). For the purposes of this report, bicyclist is the same as pedalcyclist. 4 Pedestrians and Bicyclist Crashes Year Pedestrian Bicyclist Source: 1-14 FDOT UBR Data Figure 4. Pedestrian and Bicyclist Crashes 3
31 Pedestrian Crash Data Figure 5, Figure 6, and Figure 7 depicts pedestrian crashes in Palm Beach County from 1 to 14 by time of day, month, and day of the week. Figure 5 reveals a bimodal distribution with peaks at 11 and 16 hours (military time). The bimodal characteristic suggests there are two periods during the day that see the most collisions between motor vehicles and pedestrians. Roughly, these periods range from 7 1 hours and 15 1 hours. Count Pedestrian Crashes by Time of Day Hours (Military Time) Source: 1-14 FDOT UBR Data Figure 5. Pedestrian Crashes by Time of Day Figure 6 graphically relates pedestrian crashes by month. This dataset has a symmetrical distribution between the first half of the year and the second. It should be noted; January and December have the highest instances of pedestrian crashes and June and July have the fewest. The reason behind this could be that in Florida the weather is hottest during the summer months and people might be more willing to go outside and walk during the winter months. 31
32 5 Pedestrian Crashes by Month Count Jan Feb March April May June July Aug Sept Oct Nov Dec Month Source: 1-14 FDOT UBR Data Figure 6. Pedestrian Crashes by Month Figure 7 takes a look at pedestrian crashes by the day. Sunday has the least amount of pedestrian crashes; however, the rest of the days are comparable in crashes. 35 Pedestrian Crashes by Day of Week 3 5 Count Mon Tues Wed Thurs Fri Sat Sun Day Source: 1-14 FDOT UBR Data Figure 7. Pedestrian Crashes by Day of Week Figure 8 compares pedestrian crashes to road surface condition. More than ninety percent (9%) of the crashes involved dry road surface conditions. 3
33 Pedestrian Crashes by Road Surface Condition Count 1,6 1,4 1, 1, Dry Wet All Other Road Surface Condition Source: 1-14 FDOT UBR Data Figure 8. Pedestrian Crashes by Road Surface Condition Figure 9 shows pedestrian crashes by weather condition. Figure 8 and Figure 9 shows the majority of pedestrian crashes occurred while the weather was dry and clear. This may be because pedestrians are less likely to walk outside during unfavorable weather conditions. 1,4 Pedestrian Crashes by Weather Condition 1, 1, Count Clear Cloudy Rain All Other Weather Condition Source: 1-14 FDOT UBR Data Figure 9. Pedestrian Crashes by Weather Condition 33
34 Alcohol and drugs involvement in traffic crashes is important to know. Without this information, it would be difficult to understand the factors causing these accidents. Figure 3 shows a total of thirteen percent (13%) of pedestrian crashes involved alcohol and/or drugs. Pedestrian Crashes by Alcohol/Drugs Involvement None % Alcohol Involved 1% Drugs Involved 1% 87% Alcohol and Drugs Involved Source: 1-14 FDOT UBR Data Figure 3. Pedestrian Crashes by Alcohol/Drugs Involvement Injury severity is another factor that gives insight to the overall characteristics of pedestrian crashes. A large number of fatalities may indicate a lack of proper infrastructure for pedestrians. Figure 31 shows seventy-three percent (73%) of pedestrians involved in traffic accidents either did not have injuries or sustained minor injuries, the worst being lacerations and bruises. 34
35 Pedestrian Injury Severity No Injury 7% Possible Injury 6% Non-Incapacitating Injury 7% Incapacitating Injury Fatality (within 3 days) % 4% Source: 1-14 FDOT UBR Data Figure 31. Pedestrian Injury Severity Figure 3 indicates that the majority of pedestrian crashes occurred in daylight. Dawn and dusk period had the least amount of crashes. The unknown category could mean the lighting condition was never recorded in the accident report. Pedestrian Crashes by Lighting Condition Count 1,1 1, Daylight Dusk Dawn Dark (Street Light) Dark (No Street Light) Unknown Lighting Condition Source: 1-14 FDOT UBR Data Figure 3. Pedestrian Crashes by Lighting Condition 35
36 Figure 33 displays pedestrian crashes by age. From this data, it is observed that there are two age ranges that experienced the most crashes, and The distribution of this graph confirms the data presented in Figure 16 (FDOT UBR Data-Pedestrian Fatalities) and Figure 17 (FDOT UBR Data-Pedestrian Injuries); all share peaks at the age ranges of and Pedestrians Crashes by Age Count Age Source: 1-14 FDOT UBR Data Figure 33. Pedestrian Crashes by Age Figure 34 shows the relationship between pedestrian crashes by gender. Over forty-night percent (49%) of the crashes did not have gender data recorded. But of the recorded data, more than fifty percent (5%) were male. Males are more likely in engaging in risky behaviors than females and are overrepresented in pedestrian deaths in most countries. 36
37 Pedestrians Crashes by Gender Female 16% Male 35% Not Coded 49% Source: 1-14 FDOT UBR Data Figure 34. Pedestrian Crashes by Gender Bicyclist Crash Data Figure 35, Figure 36, and Figure 37 illustrates bicyclist crashes in Palm Beach County from 1 to 14 by time of day, month, and day of the week. Similarly, to Figure 5 (FDOT UBR Data- Pedestrian Crashes by Time of Day), bicyclists have two periods during the day were the most accidents occur, 7 11 hours and hours (military time). The time periods seem to suggest a correlation between the occurrence of bicyclist crashes and the typical rush hours of traffic. 37
38 Count Bicyclist Crashes by Time of Day Hours (Military Time) Source: 1-14 FDOT UBR Data Figure 35. Bicyclist Crashes by Time of Day Figure 36 illustrates bicyclist crashes by month. The distribution of crashes over the months are even. The month of July experienced the least number of crashes while December saw the most. As in Figure 6 (Pedestrian Crashes by Month), this data coincides with pedestrian crashes which also occurred in low numbers during the summer but higher numbers during the winter. Bicyclist Crashes by Month Count Jan Feb March April May June July Aug. Sept. Oct. Nov. Dec. Month Source: 1-14 FDOT UBR Data Figure 36. Bicyclist Crashes by Month 38
39 Figure 37 displays bicyclist crashes by the day of the week. This information follows a positively skewed normal distribution with the bulk of the crashes occurring between Tuesday and Thursday. As with pedestrian crashes, Figure 7 (Pedestrian Crashes by Day of Week), Sunday had the least amount of bicyclist crashes. 3 5 Bicyclist Crashes by Day of Week Count Mon. Tues. Wed. Thurs. Fri. Sat. Sun. Day Source: 1-14 FDOT UBR Data Figure 37. Bicyclist Crashes by Day of Week Figure 38 displays the bicyclist crashes based on road surface condition. More than seventy-five percent (75%) of the accidents occurred during dry weather. 1,4 1, 1, Bicyclist Crashes by Road Surface Condition Count Dry Wet All Other Road Surface Condition Source: 1-14 FDOT UBR Data Figure 38. Bicyclist Crashes by Road Surface Condition 39
40 Figure 39 compares bicyclist crashes to the weather condition at the time of the accident. The majority of the accidents occurred during clear weather. Similarly, to pedestrian crashes in Figure 8 (Pedestrian Crashes by Road Condition) and Figure 9 (Pedestrian Crashes by Weather Condition), wet road conditions, or rainy weather equated to the least amount of crashes. Bicyclist Crashes by Weather Condition Count 1,1 1, Clear Cloudy Rain All Other Weather Condition Source: 1-14 FDOT UBR Data Figure 39. Bicyclist Crashes by Weather Condition Figure 4 shows only six percent (6%) of the bicyclist crashes involved alcohol and/or drugs. This is in stark contrast to pedestrians, Figure 3 (Pedestrian Crashes by Alcohol/Drugs Involvement), who had over double the amount of alcohol and/or drugs involved. 4
41 Bicycle Crashes Alcohol/Drugs Involvement None 1% Alcohol Involved Drugs Involved 1% 4% 94% Alcohol and Drugs Involved Source: 1-14 FDOT UBR Data Figure 4. Bicyclist Crashes Alcohol/Drugs Involvement Figure 41 shows that eighty-eight percent (88%) of bicyclists involved in traffic crashes had either no injury or minor injuries such as lacerations and/or bruises. This data is very similar to Figure 31 (Pedestrian Injury Severity), which had the percentage of no injury/minor injuries at seventythree percent (73%). 41
42 Bicyclist Injury Severity No Injury Possible Injury % 1% 33% Non-Incapacitating Injury 1% Incapacitating Injury Fatality (within 3 days) 43% Source: 1-14 FDOT UBR Data Figure 41. Bicyclist Injury Severity The spread of bicyclist crashes over different lighting conditions is identical to pedestrian crashes seen in Figure 3 (Pedestrian Crashes by Lighting Condition). Crashes most frequently occurred during daylight lighting conditions, as seen in Figure 4. The second most frequent occurrence of crashes occurred during dark lighting conditions with street lights. Bicyclist Crashes by Lighting Condition Count 1,1 1, Daylight Dusk Dawn Dark (Street Light) Lighting Condition Dark (No Street Light) Unknown Source: 1-14 FDOT UBR Data Figure 4. Bicyclist Crashes by Lighting Condition 4
43 Knowing whether or not bicyclists are being hit by motor vehicles in the bike lane or not is pertinent information when developing a safety plan. At the very least, the information indicates when a bike lane is present and in use, the amount of crashes are substantially less than if there was not one or the bicyclist was not using it. Figure 43 shows that the majority of pedalcyclist crashes occurred when the bicycle was not in a bike lane. This information, however, does not clarify if there was a bike lane available for the bicyclist or not. 1,4 1, 1, Bicyclist Crashes by Bike Lane Position Count Collision with Bicycle Not in Bike Lane Collision with Bicycle in Bike Lane Bike Lane Position Source: 1-14 FDOT UBR Data Figure 43. Bicyclist Crashes by Bike Lane Position Bicyclists between ages 15-9 and ages 4-59 have experienced the most traffic crashes as seen in Figure 44. This data closely matches the age distribution in Figure 33 (Pedestrian Crashes by Age). 43
44 Bicyclists Crashes by Age Count Age Source: 1-14 FDOT UBR Data Figure 44. Bicyclist Crashes by Age In regards to bicyclist gender, Figure 43 shows sixty-one percent (61%) of the crashes did not record this data. However, of the thirty-nine percent (39%) of recorded data, thirty-one percent (31%) were male. As with pedestrians in Figure 34 (Pedestrian Crashes by Gender), the male bicyclists were involved in more crashes that females. Bicyclists by Gender Female 8% Not Coded 61% Male 31% Source: 1-14 FDOT UBR Data Figure 45. Bicyclist Crashes by Gender 44
45 Palm Beach County High Crash Clusters High crash clusters were identified based on GIS crash data mapping. The locations of crashes and fatalities were mapped for pedestrian and bicycle crashes within Palm Beach County from 1 through 14. The density of crashes and fatalities were also mapped to depict the spread of pedestrian or bicycle-related crashes. Hot spot analysis maps identified ten (1) clusters of hot spots and ten (1) high crash corridors for pedestrian and bicyclist crashes. Density maps are a simple and effective way to show density differences in geographic distributions. For this Study, crash density is the number of crashers per square mile and the maps provided are a graphical representation of crash data through the use of colors that indicate the crashes. The Study used the Jenks Natural Breaks classification system, which is a data classification method designed to break points by picking the breaks that best group similar values and maximize the differences between classes. This data classification method defines the low, low-medium, medium, medium-high, and high ranges for the individual map series. In addition to the density maps for all pedestrian and bicycle crashes, the density of several specific crash types were also mapped. Crashes Figure 46 and Figure 51 are heat maps that show the frequency of pedestrian and bicyclist crashes for a given location in Palm Beach County. The major clusters of pedestrian related crashes are around the Cities of West Palm Beach, Lake Worth, and Delray Beach. More specifically, corridors from Melaleuca Lane to Okeechobee Boulevard and from Linton Boulevard to Atlantic Avenue have experience a high concentration of crashes. The Cities of Lake Worth and Delray Beach also experienced the most bicycle crashes albeit in a more confined zone. The City of Lake Worth has a cluster depicting high crash volume between the corridor of Melaleuca Lane and 1 th Ave North as shown in Figure 5. In the City of Delray Beach, the high volume of bicyclist crashes occurred at the Linton Boulevard and Lake Ida Road corridor. Alcohol/Drug-Use Alcohol/drug related crashes involving pedestrians and bicyclist were also mapped to detect problematic areas. Figure 47 shows the Cities of West Palm Beach and Lake Worth as having the highest pedestrian crash densities in the county. Figure 5 shows Lake Worth as the only city with a high density of alcohol/drug involved bicyclist crashes. 45
46 Age Group Two age groups, juveniles (18 and under) and elderly (65 and older), were analyzed to give further insight into pedestrian and bicyclist crashes. o Juvenile (ages 18 and under) The City of Lake Worth has the largest cluster of juveniles involved in pedestrian crashes, as seen in Figure 48. A small spot in the cities of West Palm Beach and Delray Beach also indicate the presence of high crash density. For bicyclist crashes, Figure 53 shows that the cities of Lake Worth and West Palm Beach have the highest volume crashes. Appendix B includes juvenile heat maps overlaying school bus stops in Palm Beach County and there are 1,8 school bus stops. o Elderly (ages 65 and older) Figure 49 shows that the City of Delray Beach has the largest cluster of elderly people involved in pedestrian crashes. Also, the City of Boca Raton has a small cluster of high volume pedestrian crashes involving elderly people. Figure 54 shows multiple small clusters spread out in the City of Delray Beach depicting high volume zones of bicyclist crashes involving elderly people. The Cities of Lake Worth and West Palm Beach also have some hotspots showing high crash density of bicyclists. Nighttime Figure 5 and Figure 55 illustrate the densities of nighttime crashes from 6 hours within Palm Beach County for pedestrians and bicyclists, respectively. The Cities of West Palm Beach, Lake Worth, and Delray Beach have high densities of nighttime pedestrian crashes. More specifically, the corridor between Okeechobee Boulevard and Belvedere Road in the City of West Palm, Forest Hill Boulevard to Melaleuca Lane in the City of Lake Worth, and Atlantic Avenue to Linton Boulevard in the City of Delray Beach. For bicyclists, the only city with high densities of crashes at night is Lake Worth. The concentration of this hotspot is between the Forest Hill Boulevard and Melaleuca Lane corridor. 46
47 Appendix B includes additional crash data maps overlay on functional classification, land use, transit data, existing greenway and bicycle facilities, schools, and Hispanic/Latino and African American population density. Majority of the pedestrian and bicyclist crashes occurred on Urban Principal Arterials - Other. Other Principal Arterial roadways include driveways to specific parcels and at-grade intersections with other roadways. Urban arterials characteristics are listed below. Serve major activity centers, highest traffic volume corridors, and longest trip demands Carry high proportion of total urban travel on minimum of mileage Interconnect and provide continuity for major rural corridors to accommodate trips entering and leaving urban area and movements through the urban area Serve demand for intra-area travel between the central business district and outlying residential areas From the land use map, majority of the pedestrian and bicyclist crashes occurred in recreational and residential areas. There were very few crashes that occurred in agriculture and retail/office areas. The transit map shows many crashes at the high ridership stops but does not mean that there is a direct correlation between the Palm Tran stops and crashes. The existing greenway and bicycle facilities map and bicyclist crashes does not show a direct correlation. Presence of existing facilities does not determine less crashes occurred. Demographics are used to identify population segments by specific characteristics. In Palm Beach County, 18.8 percent (18.8%) are African-Americans and twenty percent (%) are Hispanic or Latino. In the City of West Palm Beach around Okeechobee Boulevard and Military Trail includes a high population of African-Americans. Also in the City of West Palm Beach around Okeechobee Boulevard and Military Trail includes a high population of Hispanic or Latino. As well as the City of Palm Springs on Forest Hill Boulevard, City of Lake Clarke Shores, Incorporated Areas, and City of Boca Raton. Appendix C includes the Transportation Improvement Program (TIP) FY 17 1 overlaying the hot spots and high crash corridors. Appendix D includes the individual ten (1) clusters of hot spots and ten (1) high crash corridors for pedestrian and bicyclist crashes. 47

48 LYONS RD JOG RD EL CLAIR RANCH RD SIMS RD NW 16 ST LYONS RD Palm Beach MPO Pedestrian and Bicycle Safety Study Figure Pedestrian Crash Density LAKE SHORE DR The Glades MUCK CITY RD OKEECHOBEE RD HATTON HWY CONNERS HWY HOOKER HIGHWAY GATOR BLVD US 7/SR 5 BACOM POINT RD CR 87A BELLE GLADE RD TABIT RD BROWNS FARM RD MUCK CITY RD 5 1 Miles DUDA RD CR 88 CONNERS HWY HOOKER HIGHWAY GATOR BLVD BROWNS FARM RD CR 88 LION COUNTRY SAFARI MARTIN COUNTY SEM PRATT WHITNEY RD INDIANTOWN RD AERO CLUB DR TEMPLE BLVD ORANGE BLVD COCONUT BLVD 1 AVE N SR 7 EXTENSION SOUTHERN BLVD PIERSON RD SR-7 JUPITER FARMS RD BEELINE HWY LYONS RD FLORIDA'S TURNPIKE PGA BLVD NORTHLAKE BLVD OKEECHOBEE BLVD ISLAND WAY PIONEER RD PINEHURST DR HAGEN RANCH RD JOG RD HOOD RD HAVERHILL RD CENTRAL BLVD MILITARY TRAIL LANTANA RD ALT A1A 45 ST SUMMIT BLVD TEQUESTA DR CENTER ST TONEY PENNA DR FOREST HILL BLVD PURDY LN KIRK RD CONGRESS AVE 1 AVE N LAKE WORTH RD MELALEUCA LN HYPOLUXO RD PROSPERITY FARMS RD AUSTRALIAN AVE BELVEDERE RD MINER RD ELLISON WILSON RD 6 AVE S INTERSTATE 95 PARKER AVE N A ST GATEWAY BLVD OCEAN DR FEDERAL HWY/US1/SR5 OLD DIXIE HWY 36 ST 5 ST 15 ST DIXIE HWY BROADWAY FEDERAL HWY I FLAGLER DR FLAGLER DR OCEAN BLVD OCEAN BLVD S COUNTY RD BOYNTON BCH BLVD SR 7/US 441 HAGEN RANCH RD WOOLBRIGHT RD GOLF RD LAKE IDA RD NE 6 AVE SEACREST BLVD ATLANTIC AVE SW 1 ST LINTON BLVD Legend US 7/SR 5 Low Crashes Low-Medium Crashes Medium Crashes Medium-High Crashes High Crashes LOXAHATCHEE RD BROWARD COUNTY CAIN BLVD PONDEROSA DR GLADES RD CLINT MOORE RD YAMATO RD SW 18 ST MILITARY TR FAU BLVD AIRPORT RD NW AVE PALMETTO PARK RD W CAMINO REAL SW 18 ST DIXIE HWY NE 5 AVE OCEAN BLVD 48
49 LYONS RD JOG RD EL CLAIR RANCH RD SIMS RD NW 16 ST LYONS RD LAKE SHORE DR The Glades MUCK CITY RD OKEECHOBEE RD HATTON HWY CONNERS HWY HOOKER HIGHWAY GATOR BLVD US 7/SR 5 BACOM POINT RD CR 87A BELLE GLADE RD TABIT RD BROWNS FARM RD MUCK CITY RD 5 1 Miles DUDA RD CR 88 CONNERS HWY HOOKER HIGHWAY GATOR BLVD BROWNS FARM RD CR 88 LION COUNTRY SAFARI MARTIN COUNTY SEM PRATT WHITNEY RD INDIANTOWN RD AERO CLUB DR TEMPLE BLVD ORANGE BLVD Palm Beach MPO Pedestrian and Bicycle Safety Study Figure Pedestrian Crash Density Alcohol/Drug Related I COCONUT BLVD 1 AVE N SR 7 EXTENSION SOUTHERN BLVD PIERSON RD SR-7 JUPITER FARMS RD BEELINE HWY FLORIDA'S TURNPIKE PGA BLVD NORTHLAKE BLVD OKEECHOBEE BLVD LYONS RD ISLAND WAY PIONEER RD PINEHURST DR HAGEN RANCH RD JOG RD HOOD RD HAVERHILL RD CENTRAL BLVD MILITARY TRAIL LANTANA RD ALT A1A 45 ST SUMMIT BLVD TEQUESTA DR CENTER ST TONEY PENNA DR FOREST HILL BLVD PURDY LN KIRK RD CONGRESS AVE 1 AVE N LAKE WORTH RD MELALEUCA LN HYPOLUXO RD PROSPERITY FARMS RD AUSTRALIAN AVE BELVEDERE RD MINER RD ELLISON WILSON RD 6 AVE S INTERSTATE 95 PARKER AVE N A ST GATEWAY BLVD OCEAN DR FEDERAL HWY/US1/SR5 OLD DIXIE HWY 36 ST 5 ST 15 ST DIXIE HWY BROADWAY FEDERAL HWY FLAGLER DR FLAGLER DR OCEAN BLVD OCEAN BLVD S COUNTY RD BOYNTON BCH BLVD SR 7/US 441 HAGEN RANCH RD WOOLBRIGHT RD GOLF RD LAKE IDA RD NE 6 AVE SEACREST BLVD ATLANTIC AVE SW 1 ST LINTON BLVD Legend US 7/SR 5 Low Crashes Low-Medium Crashes Medium Crashes Medium-High Crashes High Crashes LOXAHATCHEE RD BROWARD COUNTY CAIN BLVD PONDEROSA DR GLADES RD CLINT MOORE RD YAMATO RD SW 18 ST MILITARY TR FAU BLVD AIRPORT RD NW AVE PALMETTO PARK RD W CAMINO REAL SW 18 ST DIXIE HWY NE 5 AVE OCEAN BLVD 49
50 LYONSRD JOG RD ELCLAIRRANCHRD SIMSRD NW 16ST LYONSRD LAKESHOREDR The Glades MUCKCITYRD OKEECHOBEERD HATTONHWY CONNERSHWY HOOKERHIGHWAY GATORBLVD US7/SR5 BACOM POINTRD CR87A BELLEGLADERD TABITRD BROWNSFARM RD MUCKCITYRD 5 1 Miles DUDARD CR88 CONNERSHWY HOOKERHIGHWAY GATORBLVD BROWNSFARM RD CR88 LIONCOUNTRYSAFARI MARTIN COUNTY SEM PRATTWHITNEYRD INDIANTOWNRD AERO CLUBDR TEMPLEBLVD ORANGEBLVD Palm Beach MPO Pedestrian and Bicycle Safety Study Figure Pedestrian Crash Density JuvenileRelated Under Age18 I COCONUTBLVD 1AVEN SR7EX TENSION SR-7 SOUTHERNBLVD PIERSONRD JUPITERFARMSRD BEELINEHWY FLORIDA'STURNPIKE PGABLVD NORTHLAKEBLVD OKEECHOBEEBLVD LYONSRD ISLANDWAY PIONEERRD PINEHURSTDR HAGEN RANCHRD JOG RD HOODRD HAVERHILLRD CENTRALBLVD MILITARYTRAIL LANTANARD ALTA1A 45ST SUMMITBLVD TEQ UESTADR CENTERST TONEYPENNADR BELVEDERERD FORESTHILLBLVD PURDYLN KIRKRD CONGRESSAVE 1AVEN LAKEWORTHRD MELALEUCALN HYPOLUX O RD PROSPERITYFARMSRD AUSTRALIANAVE MINERRD ELLISONWILSONRD INTERSTATE95 PARKERAVE NAST OCEAN DR FEDERALHWY/US1/SR5 OLDDIX IEHWY 36ST DIX IEHWY 6AVES GATEWAYBLVD 5ST 15ST BROADWAY FEDERALHWY FLAGLERDR FLAGLERDR OCEAN BLVD OCEAN BLVD SCOUNTYRD HAGEN RANCHRD BOYNTONBCHBLVD WOOLBRIGHTRD GOLFRD LAKEIDARD NE6AVE SEACRESTBLVD Legend US7/SR5 Low Crash es Low -Medium Crash es Medium Crash es Medium -High Crash es High Crash es LOX AHATCHEERD BROWARD COUNTY CAINBLVD PONDEROSADR SR7/US441 ATLANTICAVE GLADESRD CLINTMOORERD YAMATO RD SW 18ST MILITARYTR LINTONBLVD FAUBLVD AIRPORTRD NW AVE PALMETTO PARKRD W CAMINO REAL SW 18ST SW 1ST DIX IEHWY NE5AVE OCEAN BLVD 5
51 LYONS RD JOG RD EL CLAIR RANCH RD SIMS RD NW 16 ST LYONS RD LAKE SHORE DR The Glades MUCK CITY RD OKEECHOBEE RD HATTON HWY CONNERS HWY HOOKER HIGHWAY GATOR BLVD US 7/SR 5 BACOM POINT RD CR 87A BELLE GLADE RD TABIT RD BROWNS FARM RD MUCK CITY RD 5 1 Miles DUDA RD CR 88 CONNERS HWY HOOKER HIGHWAY GATOR BLVD BROWNS FARM RD CR 88 LION COUNTRY SAFARI MARTIN COUNTY SEM PRATT WHITNEY RD INDIANTOWN RD AERO CLUB DR TEMPLE BLVD ORANGE BLVD Palm Beach MPO Pedestrian and Bicycle Safety Study Figure Pedestrian Crash Density Elderly Related-Over Age 65 I COCONUT BLVD 1 AVE N SR 7 EXTENSION SOUTHERN BLVD PIERSON RD SR-7 JUPITER FARMS RD BEELINE HWY FLORIDA'S TURNPIKE PGA BLVD NORTHLAKE BLVD OKEECHOBEE BLVD LYONS RD ISLAND WAY PIONEER RD PINEHURST DR HAGEN RANCH RD JOG RD HOOD RD HAVERHILL RD CENTRAL BLVD MILITARY TRAIL LANTANA RD ALT A1A 45 ST SUMMIT BLVD TEQUESTA DR CENTER ST TONEY PENNA DR FOREST HILL BLVD PURDY LN KIRK RD CONGRESS AVE 1 AVE N LAKE WORTH RD MELALEUCA LN HYPOLUXO RD PROSPERITY FARMS RD AUSTRALIAN AVE BELVEDERE RD MINER RD ELLISON WILSON RD 6 AVE S INTERSTATE 95 PARKER AVE N A ST GATEWAY BLVD OCEAN DR FEDERAL HWY/US1/SR5 OLD DIXIE HWY 36 ST 5 ST 15 ST DIXIE HWY BROADWAY FEDERAL HWY FLAGLER DR FLAGLER DR OCEAN BLVD OCEAN BLVD S COUNTY RD BOYNTON BCH BLVD SR 7/US 441 HAGEN RANCH RD WOOLBRIGHT RD GOLF RD LAKE IDA RD NE 6 AVE SEACREST BLVD ATLANTIC AVE SW 1 ST LINTON BLVD Legend US 7/SR 5 Low Crashes Low-Medium Crashes Medium Crashes Medium-High Crashes High Crashes LOXAHATCHEE RD BROWARD COUNTY CAIN BLVD PONDEROSA DR GLADES RD CLINT MOORE RD YAMATO RD SW 18 ST MILITARY TR FAU BLVD AIRPORT RD NW AVE PALMETTO PARK RD W CAMINO REAL SW 18 ST DIXIE HWY NE 5 AVE OCEAN BLVD 51
52 LYONS RD JOG RD EL CLAIR RANCH RD SIMS RD NW 16 ST LYONS RD LAKE SHORE DR The Glades MUCK CITY RD OKEECHOBEE RD HATTON HWY CONNERS HWY HOOKER HIGHWAY GATOR BLVD US 7/SR 5 BACOM POINT RD CR 87A BELLE GLADE RD TABIT RD BROWNS FARM RD MUCK CITY RD 5 1 Miles DUDA RD CR 88 CONNERS HWY HOOKER HIGHWAY GATOR BLVD BROWNS FARM RD CR 88 LION COUNTRY SAFARI MARTIN COUNTY SEM PRATT WHITNEY RD INDIANTOWN RD AERO CLUB DR TEMPLE BLVD ORANGE BLVD Palm Beach MPO Pedestrian and Bicycle Safety Study Figure Pedestrian Crash Density Nighttime Related-Between -6 I COCONUT BLVD 1 AVE N SR 7 EXTENSION SOUTHERN BLVD PIERSON RD SR-7 JUPITER FARMS RD BEELINE HWY FLORIDA'S TURNPIKE PGA BLVD NORTHLAKE BLVD OKEECHOBEE BLVD LYONS RD ISLAND WAY PIONEER RD PINEHURST DR HAGEN RANCH RD JOG RD HOOD RD HAVERHILL RD CENTRAL BLVD MILITARY TRAIL LANTANA RD ALT A1A 45 ST SUMMIT BLVD TEQUESTA DR CENTER ST TONEY PENNA DR FOREST HILL BLVD PURDY LN KIRK RD CONGRESS AVE 1 AVE N LAKE WORTH RD MELALEUCA LN HYPOLUXO RD PROSPERITY FARMS RD AUSTRALIAN AVE BELVEDERE RD MINER RD ELLISON WILSON RD 6 AVE S INTERSTATE 95 PARKER AVE N A ST GATEWAY BLVD OCEAN DR FEDERAL HWY/US1/SR5 OLD DIXIE HWY 36 ST 5 ST 15 ST DIXIE HWY BROADWAY FEDERAL HWY FLAGLER DR FLAGLER DR OCEAN BLVD OCEAN BLVD S COUNTY RD BOYNTON BCH BLVD SR 7/US 441 HAGEN RANCH RD WOOLBRIGHT RD GOLF RD LAKE IDA RD NE 6 AVE SEACREST BLVD ATLANTIC AVE SW 1 ST LINTON BLVD Legend US 7/SR 5 Low Crashes Low-Medium Crashes Medium Crashes Medium-High Crashes High Crashes LOXAHATCHEE RD BROWARD COUNTY CAIN BLVD PONDEROSA DR GLADES RD CLINT MOORE RD YAMATO RD SW 18 ST MILITARY TR FAU BLVD AIRPORT RD NW AVE PALMETTO PARK RD W CAMINO REAL SW 18 ST DIXIE HWY NE 5 AVE OCEAN BLVD 5
53 LYONS RD JOG RD EL CLAIR RANCH RD SIMS RD NW 16 ST LYONS RD Palm Beach MPO Pedestrian and Bicycle Safety Study Figure Bicyclist Crash Density LAKE SHORE DR The Glades MUCK CITY RD OKEECHOBEE RD HATTON HWY CONNERS HWY HOOKER HIGHWAY GATOR BLVD US 7/SR 5 BACOM POINT RD CR 87A BELLE GLADE RD TABIT RD BROWNS FARM RD MUCK CITY RD 5 1 Miles DUDA RD CR 88 CONNERS HWY HOOKER HIGHWAY GATOR BLVD BROWNS FARM RD CR 88 LION COUNTRY SAFARI MARTIN COUNTY SEM PRATT WHITNEY RD INDIANTOWN RD AERO CLUB DR TEMPLE BLVD ORANGE BLVD COCONUT BLVD 1 AVE N SR 7 EXTENSION SOUTHERN BLVD PIERSON RD SR-7 JUPITER FARMS RD BEELINE HWY LYONS RD FLORIDA'S TURNPIKE PGA BLVD NORTHLAKE BLVD OKEECHOBEE BLVD ISLAND WAY PIONEER RD PINEHURST DR HAGEN RANCH RD JOG RD HOOD RD HAVERHILL RD CENTRAL BLVD MILITARY TRAIL LANTANA RD ALT A1A 45 ST SUMMIT BLVD TEQUESTA DR CENTER ST TONEY PENNA DR FOREST HILL BLVD PURDY LN KIRK RD CONGRESS AVE 1 AVE N LAKE WORTH RD MELALEUCA LN HYPOLUXO RD PROSPERITY FARMS RD AUSTRALIAN AVE BELVEDERE RD MINER RD ELLISON WILSON RD 6 AVE S INTERSTATE 95 PARKER AVE N A ST GATEWAY BLVD OCEAN DR FEDERAL HWY/US1/SR5 OLD DIXIE HWY 36 ST 5 ST 15 ST DIXIE HWY BROADWAY FEDERAL HWY I FLAGLER DR FLAGLER DR OCEAN BLVD OCEAN BLVD S COUNTY RD BOYNTON BCH BLVD SR 7/US 441 HAGEN RANCH RD WOOLBRIGHT RD GOLF RD LAKE IDA RD NE 6 AVE SEACREST BLVD ATLANTIC AVE SW 1 ST LINTON BLVD Legend US 7/SR 5 Low Crashes Low-Medium Crashes Medium Crashes Medium-High Crashes High Crashes LOXAHATCHEE RD BROWARD COUNTY CAIN BLVD PONDEROSA DR GLADES RD CLINT MOORE RD YAMATO RD SW 18 ST MILITARY TR FAU BLVD AIRPORT RD NW AVE PALMETTO PARK RD W CAMINO REAL SW 18 ST DIXIE HWY NE 5 AVE OCEAN BLVD 53
54 LYONS RD JOG RD EL CLAIR RANCH RD SIMS RD NW 16 ST LYONS RD LAKE SHORE DR The Glades MUCK CITY RD OKEECHOBEE RD HATTON HWY CONNERS HWY HOOKER HIGHWAY GATOR BLVD US 7/SR 5 BACOM POINT RD CR 87A BELLE GLADE RD TABIT RD BROWNS FARM RD MUCK CITY RD 5 1 Miles DUDA RD CR 88 CONNERS HWY HOOKER HIGHWAY GATOR BLVD BROWNS FARM RD CR 88 LION COUNTRY SAFARI MARTIN COUNTY SEM PRATT WHITNEY RD INDIANTOWN RD AERO CLUB DR TEMPLE BLVD ORANGE BLVD Palm Beach MPO Pedestrian and Bicycle Safety Study Figure Bicyclist Crash Density Alcohol/Drug Related I COCONUT BLVD 1 AVE N SR 7 EXTENSION SOUTHERN BLVD PIERSON RD SR-7 JUPITER FARMS RD BEELINE HWY FLORIDA'S TURNPIKE PGA BLVD NORTHLAKE BLVD OKEECHOBEE BLVD LYONS RD ISLAND WAY PIONEER RD PINEHURST DR HAGEN RANCH RD JOG RD HOOD RD HAVERHILL RD CENTRAL BLVD MILITARY TRAIL LANTANA RD ALT A1A 45 ST SUMMIT BLVD TEQUESTA DR CENTER ST TONEY PENNA DR FOREST HILL BLVD PURDY LN KIRK RD CONGRESS AVE 1 AVE N LAKE WORTH RD MELALEUCA LN HYPOLUXO RD PROSPERITY FARMS RD AUSTRALIAN AVE BELVEDERE RD MINER RD ELLISON WILSON RD 6 AVE S INTERSTATE 95 PARKER AVE N A ST GATEWAY BLVD OCEAN DR FEDERAL HWY/US1/SR5 OLD DIXIE HWY 36 ST 5 ST 15 ST DIXIE HWY BROADWAY FEDERAL HWY FLAGLER DR FLAGLER DR OCEAN BLVD OCEAN BLVD S COUNTY RD BOYNTON BCH BLVD SR 7/US 441 HAGEN RANCH RD WOOLBRIGHT RD GOLF RD LAKE IDA RD NE 6 AVE SEACREST BLVD ATLANTIC AVE SW 1 ST LINTON BLVD Legend US 7/SR 5 Low Crashes Low-Medium Crashes Medium Crashes Medium-High Crashes High Crashes LOXAHATCHEE RD BROWARD COUNTY CAIN BLVD PONDEROSA DR GLADES RD CLINT MOORE RD YAMATO RD SW 18 ST MILITARY TR FAU BLVD AIRPORT RD NW AVE PALMETTO PARK RD W CAMINO REAL SW 18 ST DIXIE HWY NE 5 AVE OCEAN BLVD 54
55 LYONSRD JOG RD ELCLAIRRANCHRD SIMSRD NW 16ST LYONSRD LAKESHOREDR The Glades MUCKCITYRD OKEECHOBEERD HATTONHWY CONNERSHWY HOOKERHIGHWAY GATORBLVD US7/SR5 BACOM POINTRD CR87A BELLEGLADERD TABITRD BROWNSFARM RD MUCKCITYRD 5 1 Miles DUDARD CR88 CONNERSHWY HOOKERHIGHWAY GATORBLVD BROWNSFARM RD CR88 LIONCOUNTRYSAFARI MARTIN COUNTY SEM PRATTWHITNEYRD INDIANTOWNRD AERO CLUBDR TEMPLEBLVD ORANGEBLVD Palm Beach MPO Pedestrian and Bicycle Safety Study Fig ure bicyclistcrash Density JuvenileRelated Under Ag e18 I COCONUTBLVD 1AVEN SR7EX TENSION SR-7 SOUTHERNBLVD PIERSONRD JUPITERFARMSRD BEELINEHWY FLORIDA'STURNPIKE PGABLVD NORTHLAKEBLVD OKEECHOBEEBLVD LYONSRD ISLANDWAY PIONEERRD PINEHURSTDR HAGEN RANCHRD JOG RD HOODRD HAVERHILLRD CENTRALBLVD MILITARYTRAIL LANTANARD ALTA1A 45ST SUMMITBLVD TEQ UESTADR CENTERST TONEYPENNADR BELVEDERERD FORESTHILLBLVD PURDYLN KIRKRD CONGRESSAVE 1AVEN LAKEWORTHRD MELALEUCALN HYPOLUX O RD PROSPERITYFARMSRD AUSTRALIANAVE MINERRD ELLISONWILSONRD INTERSTATE95 PARKERAVE NAST OCEAN DR FEDERALHWY/US1/SR5 OLDDIX IEHWY 36ST DIX IEHWY 6AVES GATEWAYBLVD 5ST 15ST BROADWAY FEDERALHWY FLAGLERDR FLAGLERDR OCEAN BLVD OCEAN BLVD SCOUNTYRD HAGEN RANCHRD BOYNTONBCHBLVD WOOLBRIGHTRD GOLFRD LAKEIDARD NE6AVE SEACRESTBLVD Legend US7/SR5 Low Crash es Low -Medium Crash es Medium Crash es Medium -Hig h Crash es Hig h Crash es LOX AHATCHEERD BROWARD COUNTY CAINBLVD PONDEROSADR SR7/US441 ATLANTICAVE GLADESRD CLINTMOORERD YAMATO RD SW 18ST MILITARYTR LINTONBLVD FAUBLVD AIRPORTRD NW AVE PALMETTO PARKRD W CAMINO REAL SW 18ST SW 1ST DIX IEHWY NE5AVE OCEAN BLVD 55
56 LYONS RD JOG RD EL CLAIR RANCH RD SIMS RD NW 16 ST LYONS RD LAKE SHORE DR The Glades MUCK CITY RD OKEECHOBEE RD HATTON HWY CONNERS HWY HOOKER HIGHWAY GATOR BLVD US 7/SR 5 BACOM POINT RD CR 87A BELLE GLADE RD TABIT RD BROWNS FARM RD MUCK CITY RD 5 1 Miles DUDA RD CR 88 CONNERS HWY HOOKER HIGHWAY GATOR BLVD BROWNS FARM RD CR 88 LION COUNTRY SAFARI MARTIN COUNTY SEM PRATT WHITNEY RD INDIANTOWN RD AERO CLUB DR TEMPLE BLVD ORANGE BLVD Palm Beach MPO Pedestrian and Bicycle Safety Study Figure Bicyclist Crash Density Elderly Related-Over Age 65 I COCONUT BLVD 1 AVE N SR 7 EXTENSION SOUTHERN BLVD PIERSON RD SR-7 JUPITER FARMS RD BEELINE HWY FLORIDA'S TURNPIKE PGA BLVD NORTHLAKE BLVD OKEECHOBEE BLVD LYONS RD ISLAND WAY PIONEER RD PINEHURST DR HAGEN RANCH RD JOG RD HOOD RD HAVERHILL RD CENTRAL BLVD MILITARY TRAIL LANTANA RD ALT A1A 45 ST SUMMIT BLVD TEQUESTA DR CENTER ST TONEY PENNA DR FOREST HILL BLVD PURDY LN KIRK RD CONGRESS AVE 1 AVE N LAKE WORTH RD MELALEUCA LN HYPOLUXO RD PROSPERITY FARMS RD AUSTRALIAN AVE BELVEDERE RD MINER RD ELLISON WILSON RD 6 AVE S INTERSTATE 95 PARKER AVE N A ST GATEWAY BLVD OCEAN DR FEDERAL HWY/US1/SR5 OLD DIXIE HWY 36 ST 5 ST 15 ST DIXIE HWY BROADWAY FEDERAL HWY FLAGLER DR FLAGLER DR OCEAN BLVD OCEAN BLVD S COUNTY RD BOYNTON BCH BLVD SR 7/US 441 HAGEN RANCH RD WOOLBRIGHT RD GOLF RD LAKE IDA RD NE 6 AVE SEACREST BLVD ATLANTIC AVE SW 1 ST LINTON BLVD US 7/SR 5 Legend Low Crashes Low-Medium Crashes Medium-High Crashes High Crashes LOXAHATCHEE RD BROWARD COUNTY CAIN BLVD PONDEROSA DR GLADES RD CLINT MOORE RD YAMATO RD SW 18 ST MILITARY TR FAU BLVD AIRPORT RD NW AVE PALMETTO PARK RD W CAMINO REAL SW 18 ST DIXIE HWY NE 5 AVE OCEAN BLVD 56
57 LYONS RD JOG RD EL CLAIR RANCH RD SIMS RD NW 16 ST LYONS RD LAKE SHORE DR The Glades MUCK CITY RD OKEECHOBEE RD HATTON HWY CONNERS HWY HOOKER HIGHWAY GATOR BLVD US 7/SR 5 BACOM POINT RD CR 87A BELLE GLADE RD TABIT RD BROWNS FARM RD MUCK CITY RD 5 1 Miles DUDA RD CR 88 CONNERS HWY HOOKER HIGHWAY GATOR BLVD BROWNS FARM RD CR 88 LION COUNTRY SAFARI MARTIN COUNTY SEM PRATT WHITNEY RD INDIANTOWN RD AERO CLUB DR TEMPLE BLVD ORANGE BLVD Palm Beach MPO Pedestrian and Bicycle Safety Study Figure Bicyclist Crash Density Nighttime Related-Between -6 I COCONUT BLVD 1 AVE N SR 7 EXTENSION SOUTHERN BLVD PIERSON RD SR-7 JUPITER FARMS RD BEELINE HWY FLORIDA'S TURNPIKE PGA BLVD NORTHLAKE BLVD OKEECHOBEE BLVD LYONS RD ISLAND WAY PIONEER RD PINEHURST DR HAGEN RANCH RD JOG RD HOOD RD HAVERHILL RD CENTRAL BLVD MILITARY TRAIL LANTANA RD ALT A1A 45 ST SUMMIT BLVD TEQUESTA DR CENTER ST TONEY PENNA DR FOREST HILL BLVD PURDY LN KIRK RD CONGRESS AVE 1 AVE N LAKE WORTH RD MELALEUCA LN HYPOLUXO RD PROSPERITY FARMS RD AUSTRALIAN AVE BELVEDERE RD MINER RD ELLISON WILSON RD 6 AVE S INTERSTATE 95 PARKER AVE N A ST GATEWAY BLVD OCEAN DR FEDERAL HWY/US1/SR5 OLD DIXIE HWY 36 ST 5 ST 15 ST DIXIE HWY BROADWAY FEDERAL HWY FLAGLER DR FLAGLER DR OCEAN BLVD OCEAN BLVD S COUNTY RD BOYNTON BCH BLVD SR 7/US 441 HAGEN RANCH RD WOOLBRIGHT RD GOLF RD LAKE IDA RD NE 6 AVE SEACREST BLVD ATLANTIC AVE SW 1 ST LINTON BLVD Legend US 7/SR 5 Low Crashes Low-Medium Crashes Medium Crashes Medium-High Crashes High Crashes LOXAHATCHEE RD BROWARD COUNTY CAIN BLVD PONDEROSA DR GLADES RD CLINT MOORE RD YAMATO RD SW 18 ST MILITARY TR FAU BLVD AIRPORT RD NW AVE PALMETTO PARK RD W CAMINO REAL SW 18 ST DIXIE HWY NE 5 AVE OCEAN BLVD 57
58 Table 4 and Table 5 lists the top ten (1) hot spots and top ten (1) high crash corridor with rightof-way (ROW) ownership as shown in Figure 56. Table 4. Top 1 Hot Spots Map ID Projects Intersection ROW Ownership S1 Palmetto Park Road Federal Highway S Atlantic Avenue NE 5 Avenue/Old Dixie Highway S3 Boynton Beach Boulevard Seacrest Boulevard S4 Lake Worth Road Congress Avenue S5 Lake Worth Road Davis Road S6 Lake Worth Road Jog Road City of Boca Raton FDOT City of Delray Beach FDOT County FDOT County FDOT Village of Palm Springs County FDOT County FDOT S7 Military Trail Forest Hill Boulevard FDOT S8 Dr Martin Luther King Jr Boulevard SW 5 Street City of Belle Glade S9 Okeechobee Boulevard Military Trail FDOT S1 45 Street Australian Avenue County Clicking on the Map ID s, will bring you to the respective maps in Appendix D - Individual Spots/Corridors. 58
59 Table 5. Top 1 High Crash Corridors Map ID Projects Limits ROW Ownership C1 Federal Highway Camino Real to Glades Road FDOT C Ocean Boulevard Linton Boulevard to Thomas Street FDOT C3 Atlantic Avenue Military Trail to Ocean Boulevard City of Delray Beach FDOT C4 Lantana Road Jog Road to Military Trail County C5 Lake Worth Road Jog Road to Lakeside Drive FDOT C6 Military Trail Melaleuca Lane to Community Drive County FDOT C7 Okeechobee Road Drexel Road to Congress Avenue FDOT C8 US 1 Okeechobee Boulevard to 49 Street City of West Palm Beach FDOT C9 Northlake Boulevard Military Trail to Alt A1A County C1 Indiantown Road Central Boulevard to Alt A1A FDOT 59
60 LYONS RD JOG RD EL CLAIR RANCH RD SIMS RD DAVIS RD Palm Beach MPO Pedestrian and Bicycle Safety Study Figure 56. Top 1 Hot Spots & Top 1 High Crash Corridors LAKE SHORE DR The Glades MUCK CITY RD OKEECHOBEE RD HATTON HWY US 7/SR 5 BACOM POINT RD S8 CR 87A CONNERS HWY HOOKER HIGHWAY S1 Glades Road at NW 13 Street/FAU Boulevard SGATOR Atlantic BLVD Avenue at NE 5 Avenue/Old Dixie Highway BELLE GLADE RD TABIT RD BROWNS FARM RD MUCK CITY RD 5 1 Miles DUDA RD CR 88 CONNERS HWY HOOKER HIGHWAY GATOR BLVD BROWNS FARM RD S3 Boynton Beach Boulevard at Seacrest Boulevard S4 Lake Worth Road at Congress Avenue S5 Lake Worth Road at Davis Road S6 Lake Worth Road at Jog Road S7Military Trail at Forest Hill Boulevard S8 Dr Martin Luther King Jr Boulevard at SW 5 Street S9 Okeechobee Boulevard at Military Trail S1 45 Street at Australian Avenue C1 C Federal Highway from Camino Real to Glades Road Ocean Boulevard from Linton Boulevard to Thomas Street CR 88 LION COUNTRY SAFARI MARTIN COUNTY SEM PRATT WHITNEY RD INDIANTOWN RD AERO CLUB DR TEMPLE BLVD ORANGE BLVD COCONUT BLVD 1 AVE N SR 7 EXTENSION SOUTHERN BLVD PIERSON RD SR-7 JUPITER FARMS RD LAKE WORTH RD BEELINE HWY LYONS RD FLORIDA'S TURNPIKE PGA BLVD NORTHLAKE BLVD OKEECHOBEE BLVD S6 HOOD RD C7 FOREST HILL BLVD PINEHURST DR ISLAND WAY PIONEER RD HAGEN RANCH RD JOG RD HAVERHILL RD C5 C4 CENTER ST C1 CENTRAL BLVD C6 MILITARY TRAIL S9 S7 PURDY LN 1 AVE N LANTANA RD BOYNTON BCH BLVD TEQUESTA DR TONEY PENNA DR ALT A1A 45 ST MELALEUCA LN C9 CONGRESS AVE HYPOLUXO RD PROSPERITY FARMS RD S5 S4 S1 BELVEDERE RD CONGRESS AVE MINER RD ELLISON WILSON RD INTERSTATE 95 GATEWAY BLVD OCEAN DR AUSTRALIAN AVE PARKER AVE N A ST 6 AVE S FEDERAL HWY/US1/SR5 OLD DIXIE HWY DIXIE HWY BROADWAY FEDERAL HWY S3 I C8 FLAGLER DR FLAGLER DR OCEAN BLVD OCEAN BLVD S COUNTY RD C3 C4 C5 C6 C7 Atlantic Avenue from Barwick Road to Ocean Boulevard Lantana Road from Jog Road to Military Trail Lake Worth Road from Jog Road to Lakeside Drive Military Trail from Melaleuca Lane to Okeechobee Boulevard Okeechobee Road from Drexel Road to Palm Beach Lakes Boulevard SR 7/US 441 HAGEN RANCH RD ATLANTIC AVE WOOLBRIGHT RD GOLF RD LAKE IDA RD C3 LINTON BLVD SEACREST BLVD SW 1 ST S C C8 C9 C1 N Dixie Highway from Okeechobee Boulevard to 45 Street Northlake Boulevard from Military Trail to Old Dixie Highway US 7/SR 5 Indiantown Road from Central Boulevard to Alt A1A Legend Hot Spots LOXAHATCHEE RD CAIN BLVD PONDEROSA DR GLADES RD CLINT MOORE RD YAMATO RD MILITARY TR FAU BLVD AIRPORT RD PALMETTO PARK RD NW AVE W CAMINO REAL DIXIE HWY OCEAN BLVD S1 C1 High Crash Corridors BROWARD COUNTY SW 18 ST SW 18 ST 6
61 Chapter 4. Recommendations Pedestrian and bicycle safety recommendations were developed based on the literature review, crash data analysis, and input from the Pedestrian and Bicycle Safety Team Meetings. The recommendations follow the 5-E model Education, Encouragement, Engineering, Enforcement, and Evaluation. In addition, the recommendations have been developed in a manner that will help engineers, planners, and policy makers to select countermeasures for specific crash types that the data show are common in Palm Beach County, and in locations identified through the hot spot analysis. These and other countermeasures can be implemented throughout Palm Beach County, but are particularly relevant within the hot spots and corridor areas. Engineering and Enforcement Countermeasures A summary of the general countermeasures for pedestrian and bicycle safety are as follows. Advanced Stop Lines/Bike Boxes Move stop lines farther back from the pedestrian crosswalk to allow pedestrians, bicyclists, and drivers to have a clearer view of each other. Stop lines should be 15-3 feet back to the marked crosswalk and gives cyclist the opportunity to position themselves. Bus Stop Treatments Relocate bus stops closer to intersections and/or marked crosswalks to promote safe pedestrian behavior. This will reduce the frequency and severity of pedestrian and bicycle crashes. Shared Lane Markings (sharrows) Indicate a shared lane environment and proper path for bicycles and automobiles. Shared lane markings encourage drivers to leave space for cyclists and alert drivers the space cyclists are likely to occupy in the lane. Crossing Islands Provide raised pedestrian refuge islands in strategic locations of the street at intersections or midblock crossings to protect crossing pedestrians from motor vehicles. Center crossing islands allow pedestrians to deal with only one direction of traffic at a time. Median Crossings Install median crossings at divided roadways that separate traffic flows. Median crossings help pedestrians cross intersections by reducing the crossing distance from the curb to a protected area. Raised Pedestrian Crossings Install a raised intersection or a raised pedestrian crossing, which carries the added benefit of reducing vehicle speeds. The intersections 61
62 can be built with a variety of materials, such as asphalt, concrete, stamped concrete, or pavers. The raised pedestrian crossings are usually located at a midblock crossing. Accessible Pedestrian Signals (APS) Communicates information about the WALK and DON T WALK intervals in non-visual forms (Ex: audible tones and vibrotactile surfaces) to people who are blind or visually-impaired. The APS are devices imbedded to pedestrian signal poles. Exclusive Pedestrian Phasing Add exclusive pedestrian phases in downtown areas with high pedestrian traffic. The exclusive pedestrian phase stops all vehicular movement and allows pedestrians access to cross in any direction at the intersection. Leading Pedestrian Interval (LPI) Give the pedestrian the WALK signal 3-7 seconds prior to the concurrent green phase with permissive turns for motor vehicles to allow pedestrians to enter the crosswalk before turning vehicles attempt to cross their path. Flashing Yellow Arrow Allow drivers to turn left or right after yielding to all oncoming traffic and to any pedestrians in the crosswalk. The oncoming traffic has a green light and drivers must wait for a safe gap in the oncoming traffic before turning. Prohibited Right Turn on Red (RTOR) Prohibit motorists from turning right on red and reduce the risk of a collision with a pedestrian/bicyclist who is to the right of the motorist and crossing the main road at locations with visibility concerns or high pedestrian activity. Lane Eliminations/Narrowing Some roads may have more travel lanes than necessary, and the width of the excess lanes could be re-purposed to meet other community goals. The opportunities of lane eliminations/narrowing, include bicycle facilities, parking, or wider sidewalks and will encourage motor vehicles to lower their speeds. Lighting and Illumination Install lighting on both sides of wide streets and streets in urban areas. Provide lighting at mid-block locations that front-lights the pedestrian. Rectangular Rapid Flashing Beacons (RRFB) Provide user-actuated amber LEDs that supplement warning signs at unsignalized intersections or mid-block crosswalks. RRFBs are activated by pedestrians manually by a push button or an automated pedestrian detection system. Pedestrian Hybrid Beacons (PHB) At higher volume mid-block locations, provide PHBs that are only activated by pedestrians when needed at uncontrolled mainline crossing points. 6
63 Speed Monitoring Devices Install along the side of the road and display the speed of each approaching vehicle along with the posted speed of the facility. Portable radar speed trailers are used to deter speeding and may be more effective than static signs due to their portability. Visible Enforcement Focuses on a Triple E strategy, Enforcement intervention, inexpensive Engineering enhancements, and an Education component. The Education component includes signage, community presentations, online engagement, school participation, and media attention. Enforcement intervention techniques include focused enforcement of driver yielding to pedestrian lanes in high-volume pedestrian locations. An example is the Best Foot Forward program currently in the City of Orlando and Orange County. Progressive Ticketing Introduce ticketing through a three-staged process, Educating, Warning, and Ticketing. 63

64 Advanced Stop Lines/Bike Boxes Description: Move stop lines farther back from the pedestrian crosswalk to allow pedestrians, bicyclists, and drivers to have a clearer view of each other. Stop lines should be 15-3 feet back of the marked crosswalk and give cyclists the opportunity to position themselves in a visible location. Targeted 5-E Model: Engineering Targeted Crash Types: Left-Hook and Right-Hook Crashes Hot Spots and Corridors: C: Ocean Boulevard from Linton Boulevard to Thomas Street (Ocean Boulevard at Atlantic Avenue) C3: Atlantic Avenue from Military Trail to Ocean Boulevard (Atlantic Avenue at Congress Avenue) Notes: Allow cyclists to bypass motor vehicles that are queued rather than be in the blind spot to the right of the traffic. Cyclists are in a safer and visible location since they are in front of traffic. Make pedestrian crossing movements more visible. Lead Agencies: FDOT, Palm Beach County Engineering and Public Works, and Local Government Agencies Implementation Strategy: Implement as a component of any road improvement project or as a separate project. Source: NACTO 64

65 Bus Stop Treatments Description: Provide safe, convenient, and inviting access for transit users to reduce the frequency and severity of pedestrian and bicycle crashes at and near bus stops. This may include building new crosswalks or relocating bus stops to be near existing crosswalks. Targeted 5-E Model: Engineering Targeted Crash Types: Midblock and Right-Angle Crashes C7: Okeechobee Road from Drexel Road to Congress Avenue Notes: Ensure that the stops have adequate: Sidewalk connectivity Roadway crossing treatments Signage Americans with Disabilities Act (ADA) access Shelters, places to sit, trash receptacles, and schedules Hot Spots and Corridors: S4: Lake Worth Road at Congress Ave S5: Lake Worth Road at Davis Road S6: Lake Worth Road at Jog Road S8: Dr Martin Luther King Jr Boulevard at SW 5 Street C4: Lantana Road from Jog Road to Military Trail Lead Agency: Palm Tran Implementation Strategy: Relocate bus stops closer to an intersection and/or marked crosswalk as a component of roadway improvement or beautification projects by coordinating with local government/transit agencies. 65

66 Shared Lane Markings (sharrows) Description: Indicate a shared lane environment and proper path for bicycles and automobiles. Shared lane markings encourage drivers to leave space for cyclists and alert drivers the space cyclists are likely to occupy in the lane. Targeted 5-E Model: Engineering Targeted Crash Types: Bicycle crashes Hot Spots and Corridors: C3: Atlantic Avenue from Military Trail to Ocean Boulevard (Swinton Avenue to Ocean Boulevard) Notes: Sharrows do not designate a particular part of the road with cyclists, it is a marking to guide cyclists to the best place to ride and help motorist to share the lane with bicyclist. Sharrows are appropriate for low volume and speed. Lead Agency: FDOT and Palm Beach County Engineering and Public Works Implementation Strategy: Implement as a roadway improvement or beautification projects by coordinating with local government/transit agencies. 66

 Notes: Crossing islands")
67 Crossing Islands Description: Provide raised pedestrian refuge islands in strategic locations of the street at intersections or midblock crossings to help protect crossing pedestrians from motor vehicles. Crossing islands reduce the exposure time experienced by a pedestrian in the intersection or midblock crossing and allow pedestrians to cross only one direction of traffic at a time. Targeted 5-E Model: Engineering Targeted Crash Types: Midblock and Intersection Crashes Hot Spots and Corridors: S4: Lake Worth Road at Congress Avenue S6: Lake Worth Road at Jog Road S7: Military Trail at Forest Hill Boulevard S8: Dr Martin Luther King Jr Boulevard at SW 6 Street C1: Indiantown Road from Central Boulevard to Alt A1A (Indiantown Road at Hepburn Avenue) Notes: Crossing islands should consider: Supplemental to the crosswalk at uncontrolled locations. Illuminate islands with street lights, signs, or reflectors. Accommodation to pedestrians in wheelchairs. Lead Agencies: FDOT, Palm Beach County Engineering and Public Works, and Local Government Agencies Implementation Strategy: Implement as a component of any road improvement project or as a separate project. 67
68 Median Crossings Description: Install curbed median treatments at divided roadways that separate traffic flows. Median crossings help pedestrians cross intersections by reducing the crossing distance from the curb to a protected area. Notes: Median crossings may be depressed, raised, or flush with the road surface. Provides a protected space for pedestrians and bicyclists. Targeted 5-E Model: Engineering Targeted Crash Types: Midblock Crashes Lead Agencies: FDOT, Palm Beach County Engineering and Public Works, and Local Government Agencies Hot Spots and Corridors: S1: Palmetto Park Road at Federal Highway C3: Atlantic Avenue from Military Trail to Ocean Boulevard (Atlantic Avenue at Swinton Avenue) Implementation Strategy: Implement as a component of any road improvement project, lane reduction project, or as a separate project as needed. 68


69 Raised Pedestrian Crossings Description: Install a raised intersection or a raised pedestrian crossing, which carries the added benefit of reducing vehicle speeds. The intersections can be built with a variety of materials, such as asphalt, concrete, stamped concrete, or pavers. The raised pedestrian crossings are usually located at a midblock crossing. Targeted 5-E Model: Engineering Appropriate in areas with significant pedestrian traffic and where motor vehicle traffic should move slowly. Can be an urban design element through the use of special paving materials. Ensure the crossings will be detectable by and accessible to pedestrians with vision impairments and ADA compliance. Targeted Crash Types: Midblock Crashes Hot Spots and Corridors: S8: Dr Martin Luther King Jr Boulevard at SW 6 Street Notes: Slows traffic and put pedestrians in a more visible position. Lead Agencies: FDOT, Palm Beach County Engineering and Public Works, and Local Government Agencies Implementation Strategy: Implement as a component of any road improvement project, lane reduction project, or as a separate project as needed. 69

70 Accessible Pedestrian Signals (APS) Description: Communicates information about the WALK and DON T WALK intervals in non-visual forms (Ex: audible tones and vibrotactile surfaces) to people who are blind or visually-impaired. The APS are devices imbedded to pedestrian signal poles. Targeted 5-E Model: Engineering standard for the audible is a rapid ticking, beeping sound, or a speech message Vibrotactile walk indications the arrow on the pushbutton or the pushbutton housing, vibrates for the visual WALK sign or walking man symbol (your hand must be on the arrow in order to feel it) Targeted Crash Types: Right-Hook Crashes Hot Spots and Corridors: S9: Okeechobee Boulevard at Military Trail S1: 45 Street at Australian Avenue C7: Okeechobee Road from Drexel Road to Congress Avenue Notes: Some of the features are Audible walk indications when the visual WALK sign or walking person symbol is on, the recommended APS is recommended to be placed on two separated poles, rather than with two pushbuttons on one pole. Lead Agencies: FDOT and Palm Beach County Engineering and Public Works Implementation Strategy: Implement as part of traffic operations projects at signalized intersections with heavy pedestrian traffic. 7

71 Excusive Pedestrian Phasing Description: Add exclusive pedestrian phases in downtown areas with high pedestrian traffic. The exclusive pedestrian phase stops all vehicular movement and allows pedestrians access to cross in any direction at the intersection. Targeted 5-E Model: Engineering Targeted Crash Types: Right-Hook Crashes Hot Spots and Corridors: C1: Federal Highway from Camino Real to Glades Road (Federal Highway at Palmetto Park Road) C3: Atlantic Avenue from Military Trail to Ocean Boulevard (Atlantic Avenue at Swinton Avenue and NE 5 Avenue) Notes: The phasing is referred to as exclusive or as a pedestrian scramble. The signal timing needs to consider the needs of trucks, buses, other motor vehicles, and vehicle volumes, including volumes of right and left turn motorists. Install pedestrian crossing markings indicating pedestrians may walk diagonally across the intersection. Lead Agencies: FDOT, Palm Beach County Engineering and Public Works, and Local Government Agencies Implementation Strategy: Implement as part of resurfacing and traffic operations projects at signalized intersection where there are heavy pedestrian traffic. Source: U.S. Department of Transportation Federal Highway Administrations Chapter 4 71

72 Leading Pedestrian Interval (LPI) Description: Give the pedestrian the WALK signal 3-7 seconds prior to the concurrent green phase with permissive turns for motor vehicles to allow pedestrians to enter the crosswalk before turning vehicles attempt to cross their path. LPIs increase the visibility of pedestrians in the intersection and reinforce their right-of-way over turning vehicles. Targeted 5-E Model: Engineering Targeted Crash Types: Right-Hook Crashes S9: Okeechobee Road at Military Trail Notes: Increase the percentage of motorists who yield the right-of-way to pedestrians because pedestrians are in the crosswalk by the time the traffic signal turns green. Increase the visibility of crossing pedestrians and give them priority within the intersection. LPI may benefit people who are older or mobility-impaired to provide more time to cross the street safely. Hot Spots and Corridors: C: Ocean Boulevard from Linton Boulevard to Thomas Street (Ocean Boulevard at Atlantic Avenue) C3: Atlantic Avenue from Military Trail to Ocean Boulevard (Atlantic Avenue at Swinton Avenue) C5: Lake Worth Road from Jog Road to Lakeside Drive (Lake Worth Road at Military Trail) S7: Military Trail at Forest Hill Boulevard Lead Agencies: FDOT, Palm Beach County Engineering and Public Works, and Local Government Agencies Implementation Strategy: Implement as part of resurfacing and traffic operations projects at signalized intersection where heavy turning traffic comes into conflict with crossing pedestrians during the permissive phase of the signal cycle. The Traffic Operations Office can also implement LPIs as standalone projects. 7


73 Flashing Yellow Arrow Description: Allow drivers to turn left or right after yielding to all oncoming traffic and to any pedestrians in the crosswalk. The oncoming traffic has a green light and drivers must wait for a safe gap in the oncoming traffic before turning. Targeted 5-E Model: Engineering Targeted Crash Types: Left-Hook and Right-Hook Crashes Hot Spots and Corridors: C5: Lake Worth Road from Jog Road to Lakeside Drive C6: Military Trail from Melaleuca Lane to Community Drive S1: 45 Street at Australian Avenue Notes: The flashing yellow arrow means left or right turns permitted and yield to oncoming traffic and pedestrians. The signal s left or right turn phase could operate as protected only with the green and solid yellow arrows during certain hours of the day and then as protected/permissive during other hours of the day, depending upon traffic flows. Lead Agencies: FDOT, Palm Beach County Engineering and Public Works, and Local Government Agencies Implementation Strategy: Implement as part of resurfacing and traffic operations projects at signalized intersection 73

74 Prohibited Right Turn on Red (RTOR) Description: Prohibit motorists from turning right on red and reduce the risk of a collision with a pedestrian/bicyclist who is to the right of the motorist and crossing the main road at locations with visibility concerns or high pedestrian activity. Targeted 5-E Model: Engineering Targeted Crash Types: Right-Hook Crashes Notes: RTOR restrictions should be used at school crossings. Can be part-time ROTR prohibitions during certain time periods or at all times of day. Signs should be visible to rightturning motorists stopped in the curb lane at the crosswalk. Provide illuminated No Turn on Red signs. Hot Spots and Corridors: C5: Lake Worth Road from Jog Road to Lakeside Drive C8: US 1 from Okeechobee Boulevard to 45 Street Lead Agencies: FDOT, Palm Beach County Engineering and Public Works, and Local Government Agencies Implementation Strategy: Implement as part of resurfacing and traffic operations projects at signalized intersections. 74
).")

75 Lane Eliminations/Narrowing Description: Some roads may have more travel lanes than necessary, and the width of the excess lanes could be re-purposed to meet other community goals. The opportunities of lane eliminations/narrowing, include bicycle lanes, parking, or sidewalks and will encourage motor vehicles to lower their speeds. center two-way left-turn lane (TWLTL)). Consider for four-lane bi-directional roadways with moderate volumes with average daily traffic (ADT) of 15, or less, and for three-lane one-way streets with ADT of, or less. Targeted 5-E Model: Engineering Targeted Crash Types: Midblock Crashes Hot Spots and Corridors: S3: Boynton Beach Boulevard at Seacrest Boulevard S8: Dr Martin Luther King Jr Boulevard at SW 6 Street Notes: A traffic analysis should be conducted to see if vehicle capacity exceeds existing and projected volumes for a lane elimination. Convert four-lane undivided roadways into three lanes (one travel lane in each direction and a Lane narrowing reduces travel speeds on high-speed roadways. The recommended minimum widths of lanes: 11 feet for major/minor arterials and collectors 1 feet for local roads and auxiliary lanes Lead Agencies: FDOT, Palm Beach County Engineering and Public Works, and Local Government Agencies Implementation Strategy: Implement as a component of any roadway resurfacing or improvement projects, or as a stand-alone project. 75
76 Lighting and Illumination Description: Install lighting on both sides of wide streets and streets in urban areas. Provide lighting at mid-block locations that front-lights the pedestrian. This will optimize visibility and personal security of pedestrian and bicyclists during low-light conditions. Targeted 5-E Model: Engineering Targeted Crash Types: Nighttime Crashes Hot Spots and Corridors: S9: Okeechobee Road at Military Trail C3: Atlantic Avenue from Military Trail to Ocean Boulevard C5: Lake Worth Road from Jog Road to Lakeside Drive C6: Military Trail from Melaleuca Lane to Community Drive C7: Okeechobee Road from Drexel Road to Congress Avenue C8: US 1 from Okeechobee Boulevard to 45 Street C9: Northlake Boulevard from Military Trail to Alt A1A state for both intersection safety and bicycle and pedestrian safety. An allocation of $ million per year over the next five years are targeted for state highway system (SHS) intersection lighting retrofits. For fiscal year (FY) 17, fourteen (14) locations were identified in Palm Beach County. Appendix E includes the Intersection Lighting Retrofits for Pedestrians Methodology and the FY 17 locations. Effective in July 16, FDOT changed their policy to require pedestrian lighting for all new and reconstructed signalized intersections, roundabouts, and midblock crossings. The illumination should produce 1.5 times the normal roadway illumination while maintaining the uniformity lighting levels. Lead Agencies: FDOT, Palm Beach County Engineering and Public Works, and Local Government Agencies Implementation Strategy: Implement as a component of any roadway improvement or beautification projects, or as a stand-alone project. Notes: FDOT s vision is a fatality free transportation system and an FHWA focus 76

77 Rectangular Rapid Flashing Beacons (RRFB) Description: Provide user-actuated amber LEDs that supplement warning signs at unsignalized intersections or mid-block crosswalks. RRFBs are activated by pedestrians manually by a push button or an automated pedestrian detection system. Targeted 5-E Model: Engineering Targeted Crash Types: Midblock Crashes Hot Spots and Corridors: C1: Indiantown Road from Central Boulevard to Alt A1A Notes: Rectangular-shaped high intensity lighting emitting diode (LED)-based indications, flashes rapidly in a wigwag flickering flash pattern and is mounted immediately between the crossing sign and the sign s supplemental arrow plaque. Installed in conjunction with marked crosswalks and signs. May be installed on either two-lane or multi-lane roadways. But it s less well-suited for multi-lane roadways. In conditions where there is a combination of both high traffic volumes and high pedestrian volumes, the use of RRBs may not be appropriate and a PHB may be more appropriate. Lead Agencies: FDOT, Palm Beach County Engineering and Public Works, and Local Government Agencies Implementation Strategy: Implement at an unsignalized intersection when a conventional traffic signal or pedestrian hybrid beacon (PHB) is not desired. 77


78 Pedestrian Hybrid Beacons (PHB) Description: PHBs are a special type of beacon used to warn and control traffic at an unsignalized location. The beacon head consists of two red lenses above a single yellow lens and is dark until the pedestrian activates the PHBs. PHBs are recommended for locations at higher volume midblock locations to assist pedestrians in crossing a street at a marked crosswalk. Targeted 5-E Model: Engineering Targeted Crash Types: Midblock Crashes Hot Spots and Corridors: S8: Dr Martin Luther King Jr Boulevard at SW 6 Street Notes: Activated by pedestrians detectors, such as pushbuttons. Installed in conjunction with marked crosswalks, signs, advanced yield lines to warn and control traffic, and pedestrian countdown signals. Lead Agencies: FDOT, Palm Beach County Engineering and Public Works, and Local Government Agencies Implementation Strategy: Implement when a conventional signal warrant is not met or where a conventional traffic signal is not desired. 78

79 Speed Monitoring Devices Description: Install along the side of the road and display the speed of each approaching vehicle along with the posted speed at the facility. Portable radar speed trailers are used to deter speeding and may be more effective than static signs due to their portability. And increase speed limit compliance. It will display drivers real-time speeds compared to the speed limit. Targeted 5-E Model: Education and Enforcement Targeted Crash Types: High-Speed Crashes C8: US 1 from Okeechobee Boulevard to 45 Street Notes: Portable speed trailers are not a substitute for permanent actions, such as traffic-calming treatments to address neighborhood speeding issues. Best used in residential areas and can be used in conjunction with neighborhood speech watch programs or other safety education programs because it provides immediate feedback to motorists. Hot Spots and Corridors: S5: Lake Worth Road at Davis Road C1: Federal Highway from Camino Real to Glades Road C: Ocean Boulevard from Linton Boulevard to Thomas Street Lead Agencies: FDOT, Palm Beach County Engineering and Public Works, and Local Government Agencies Implementation Strategy: Implement as part of education, enforcement, or work zone projects. 79


80 Visible Enforcement Description: Focuses on a Triple E strategy, Enforcement intervention, inexpensive Engineering enhancements, and an Education component. The Education component includes signage, community presentations, online engagement, school participation, and media attention. Enforcement intervention techniques include focused enforcement of driver yielding to pedestrian lanes in highvolume pedestrian locations. An example is the Best Foot Forward program currently in the City of Orlando and Orange County. Targeted 5-E Model: Enforcement and Engineering Targeted Crash Types: All Crashes Notes: The Orlando Police Department and the Orange County Sheriff s Office set up enforcement operations throughout the region and stopped drivers who failed to yield to pedestrians in marked crosswalks as the law requires. Every person stopped is reminded that drivers must yield to people walking while driving through marked crosswalks. Increase driver-awareness of the need to share the roadway with pedestrians and bicyclist. Lead Agencies: FDOT and Police Departments Source: BestFootOrlando Implementation Focus Areas: Boca Raton Delray Beach Boynton Beach Lake Worth West Palm Beach Riviera Beach Belle Glade 8


81 Progressive Ticketing Description: Introduce ticketing through a three-staged process, Educating, Warning, and Ticketing. Targeted 5-E Model: Enforcement Targeted Crash Types: All crashes Notes: Issuing tickets is the strongest strategy of an enforcement program. The three main steps of the progressive ticketing program are as follows. 1. Educating Establish community awareness of the problem. To inform the public understanding that drivers are speeding and the consequences of speeding.. Warning Announce what action will be taken and why and give the public time to change behaviors before ticketing starts. 3. Ticketing Hold a press conference announcing when and where the police operations will occur. If the public continue their unsafe behaviors, officers issue tickets. Lead Agency: Police Departments Implementation Focus Areas: Delray Beach Palm Springs Greenacres Source: SafeRoutesInfo.org 81
82 Educational and Encouragement Strategies Adult Cycling Skills Class Provide practical hands-on classes for adults, age 18 and up, to teach biking for transportation, fun, and fitness. Driver/Pedestrian Education Expand efforts to better reach the general driving and pedestrian population such as the Florida s 3-foot law for cyclist and enforcement in yielding to pedestrians. Some of the efforts include a marketing campaign focused on drivers, increasing cycling questions on the driver s test, providing more information at the Department of Highway Safety and Motor Vehicles (DHSMV) and local bicycle shops. Spanish Language Outreach Campaign Implement a large-scale outreach effort to educate pedestrians and cyclists on key safety issues in certain demographic areas. These include crossing on marked crosswalks, using pedestrian signals, wearing helmets, not running red lights/riding onto oncoming traffic, and staying visible. K-1 Pedestrian and Bicycle Education Inform K-1 students the importance and education of walking and bicycling. Students are full of energy and eager to learn. This could be associated with National Walk to School Day and National Bike to School Day. Open Streets Events Open Streets events temporarily restrict automobile traffic to open roads for community members of all ages to walk, bike, skate, socialize, and more. This will give residents an opportunity to explore their neighborhood and local businesses in a safe, fun, and family-friendly way. Officer Training Include information on what, when, where, and how law enforcement should occur to maximize behavior change and to reduce the number of crashes involving pedestrians. 8

83 Adult Cycling Skills Class Description: Provide practical hands-on classes for adults, age 18 and up, to teach biking for transportation, fun, and fitness. Targeted 5-E Model: Education and Encouragement Targeted Crash Types: Adult Crashes Notes: Introduction and hands-on classes for adults. Teach the basics of balancing, starting, stopping, and steering a bike, as well a proper helmet fit and adjustment. Learn the rules of the road and route planning. FDOT has held a free bicycle helmet fitting training. Lead Agencies: FDOT, Palm Beach MPO, and Local Government Agencies Implementation Focus Areas: Delray Beach Palm Springs Greenacres West Palm Beach Jupiter Source: The League of American Bicyclists 83


84 Driver/Pedestrian Education Description: Expand efforts to better reach the general driving and pedestrian population such as the Florida s 3-foot law for cyclist and enforcement in yielding to pedestrians. Some of the efforts include a marketing campaign focused on drivers, increasing cycling questions on the driver s test, providing more information at the DHSMV and local bicycle shops. Provide educational materials at DHSMV and local bicycle shops. Educational materials, marketing campaigns, and programs should be sensitive of different groups of people. Lead Agencies: FDOT, Palm Beach MPO, and Local Government Agencies Targeted 5-E Model: Education, Enforcement, and Encouragement Targeted Crash Types: Straight-Through Crashes Notes: Educate the public of the state law that requires the motorists give a three-foot clearance when passing cyclists through posters, installation of signage in high-crash areas, and enforcement of the law. Implementation Strategy: Implement signage as a component of any roadway improvement projects and coordinate with local municipalities and law enforcement agencies to distribute educational materials and enforce the law. Collaborate with local agencies on marketing campaigns. Implementation Focus Areas: Delray Beach Palm Springs Greenacres West Palm Beach Jupiter 84


85 Spanish Language Outreach Campaign Description: Implement a large-scale outreach effort to educate pedestrians and cyclists on key safety issues in certain demographic areas. These include crossing on marked crosswalks, using pedestrian signals, wearing helmets, not running red lights/riding onto oncoming traffic, and staying visible. Targeted 5-E Model: Education and Encouragement Targeted Crash Types: All Crashes Notes: Create educational materials and guidelines in Spanish. Understand the audience to develop the right message and content. Distribute and educate people in particularly at local Hispanic Community Centers, churches, bilingual handouts in schools/parent workshops & etc. Lead Agencies: FDOT, Palm Beach MPO, and Local Government Agencies Implementation Focus Areas: Palm Springs Lake Worth Boynton Beach Greenacres Palm Springs 85

86 K-1 Pedestrian and Bicycle Education Description: Inform K-1 students the importance and education of walking and bicycling. Students are full of energy and eager to learn. This could be associated with National Walk to School Day and National Bike to School Day. Targeted 5-E Model: Education and Encouragement Targeted Crash Types: Juvenile Crashes Notes: Some of the education should include the basics: How to cross the street safely Basic bike and helmet fitting How to position yourself properly on the road How to let drivers know your intentions, safely negotiate turns, and intersections Basics of traffic law Lead Agencies: FDOT, Palm Beach MPO, Palm Beach County Schools, and Local Government Agencies Implementation Focus Areas: Delray Beach Boynton Beach Atlantis Belle Glade Lake Worth Greenacres Riviera Beach 86


87 Open Streets Events Description: Open Streets events temporarily restrict automobile traffic to open roads for community members of all ages to walk, bike, skate, dance, socialize, and more. This will give residents an opportunity to explore their neighborhood and local businesses in a safe, fun, and family-friendly way. Open streets generate positive public heath, offer environmental benefits and new economic opportunities, building community, cultural identity, and social engagement. Display pop-up projects such as bike lanes. Targeted 5-E Model: Education and Encouragement Targeted Crash Types: All Crashes Notes: Cities are hosting a Ciclovia or Open Streets event such as City of St. Petersburg in Pinellas County and City of Fort Lauderdale in Broward County. Lead Agencies: FDOT, Local Government Agencies, Local Businesses, and Police Departments Implementation Focus Areas: Boca Raton Delray Beach Boynton Beach West Palm Beach 87

88 Officer Training Description: Include information on what, when, where, and how law enforcement should occur to maximize behavior change and to reduce the number of crashes involving pedestrians and bicyclists. Targeted 5-E Model: Education Targeted Crash Types: All Crashes Notes: The officer training will improve officers understanding of cyclists rights and responsibilities, as well as boost awareness. The pedestrian and bicycle training consist of understanding the role of engineering, education, and enforcement can and should play in improving pedestrian and bicycle safety. Lead Agency: Police Departments Implementation Focus Areas: Boca Raton Delray Beach Palm Springs Lake Worth Palm Beach Jupiter Source: PedBikeInfo.org 88


89 Evaluation Evaluation consists of two parts; monitoring activity levels and monitoring incidents (injuries and fatalities). Monitoring Activity The bike & pedestrian count program evaluates and verify accuracy for the 36 bike count stations and 3 pedestrian count stations. Bike & Pedestrian Count Program Description: Evaluate and verify accuracy for the 36 bike count stations and 3 pedestrian count stations. Targeted 5-E Model: Evaluation Notes: There are two counters that are being used to collect data, pyro-box for pedestrians and pneumatic tubes for bicyclists. Collecting and verifying pedestrian and bicycle counts will help identify deficiencies in the transportation system, analyze existing patterns, evaluate the impacts of projects; and inform future design, planning, prioritization, and maintenance decisions. Appendix F includes more information about the bike & pedestrian count program. Implementation Focus Areas: West Palm Beach Delray Beach 89
90 Next Steps Quantifiable safety targets and performance measures will assist Palm Beach MPO and its partners in monitoring progress and Vision Zero is a multi-national road traffic safety philosophy that eventually no one will be killed or seriously injured within the road transportation system. establishing best practices. The Palm Beach MPO will monitor performance measures and targets in this plan as shown in Table 6 with the ultimate goal of zero incidents and will work with partner agencies to implement county-wide safety initiatives which is shown in Table 7. The Palm Beach MPO encourages the use of its grant funds to the program countermeasures for hot spots and corridors listed in this plan. A current listing of projects funded through the MPO near hot spots and corridors can be found in Appendix C. Additionally, other initiatives of the MPO will provide additional resources for local jurisdictions. These resources include the Bike and Pedestrian Count Program, Commuter Challenge, Complete Streets Plan, and the Hazardous Walking Conditions analysis. More information about these projects can be found in Appendix F. Table 6. Pedestrian and Bicycle Safety Performance Measures and Targets Objective Reduce the number of. Current Value (14) (1) 5 Target Vision () Pedestrian Injuries Pedestrian Fatalities 3 15 Bicyclist Injuries Bicyclist Fatalities 9 4 Pedestrian and Bicyclists Injuries and Fatalities that occurred within the hot spots and high crash corridors Juvenile (Age -18) Bicycle and Pedestrian Crashes 8 41 Reduce pedestrian and bicyclist crashes that occur under dark conditions and between 1pm and 6am 57 (3) 8 (1) The current value (14) are obtained from FDOT UBR data. () Palm Beach MPO strives towards Vision Zero; where no pedestrians and bicyclists are injured or killed. (3) Accounts for the number of crashes occur under dark conditions where street lights are both present and not present. 9
91 Table 7. Safety Initiatives Initiative Lead Agency Partners Goal Provide complete streets/safety education workshops Conduct road safety audits (RSAs) for hot spots & high crash corridors identified in this plan Conduct crosswalk safety campaigns in hot spots in this plan Educate children on pedestrian and bicycle safety skills Educate adults on bicycle safety skills Implement bike light safety campaigns to educate and distribute bike lights to cyclists in each hot spot and high crash corridor identified in this plan Palm Beach MPO Palm Beach MPO Local Law Enforcement Palm Beach County School District League of American Bicyclists Local Law Enforcement and FDOT Local Municipalities, Palm Beach County Engineering, FDOT, FHWA, and FAU Center for Urban & Environmental Solutions (CUES) FDOT, Local Municipalities, and Palm Beach County Engineering FDOT Community Traffic Safety Team (CTST) and Alert Today Alive Tomorrow, Local Municipalities, Palm Beach County Engineering, FDOT, FHWA, South Florida Regional Transportation Authority (SFRTA), and Palm Tran FDOT Safe Routes to School, SafeKids, WalkSafe, BikeSafe, Palm Beach YMCAs, and FAU CUES Adult Education Organizations, FDOT, Palm Beach MPO, Local Municipalities, and AARP Local Municipalities FDOT CTST and Alert Today Alive Tomorrow, and League of American Cyclists At least 1 Workshop annually At least 1 RSA annually At least 1 Campaign annually All K-1 Schools Implement Curriculum annually At least 1 Training annually At least 1 Campaign annually 91
92 Appendix A Literature Review
 created this guide to present proven countermeasure strategies for common traffic safety problems.")
93 Literature Review Countermeasures That Work: A Highway Safety Countermeasure Guide for State Highway Safety Offices, Eighth Edition, NHTSA, 15 In 15, the National Highway Traffic Safety Administration (NHTSA) created this guide to present proven countermeasure strategies for common traffic safety problems. This guide explains in detail the effectiveness, associated costs, and usage of each countermeasure. In addition, NHTSA cites the importance of vehicle design as a part of countermeasures that help reduce pedestrian and bicyclist injuries. Some of the suggested roadway countermeasures related to pedestrians are described below. Pedestrian safety zones Increase cost-effectiveness of interventions by targeting education, enforcement, and engineering measures to specific geographic areas and audiences where significant portions of the pedestrian crash pattern exist. Pedestrian zone programs can target a full range of pedestrian crash problems within a limited geographic area or focus on particular types of problems that comprise a large portion of the problem within a limited area. Reduce and enforce speed limits Increase reaction times for both drivers and pedestrians to avoid crashes, as well as reduce the severity of pedestrian injuries when these crashes do occur by reducing motorist travel speeds in key areas. Reducing speed limits as a stand-alone tactic has been shown in evidence-based studies to reduce actual speeds by only a fraction of the reduction in posted speed limit. However, it was noted that even one or two mile per hour (mph) reductions in actual travel speeds are estimated to yield substantial fatal and injury crash reductions for pedestrians. For maximum effectiveness, speed limit reductions should be accompanied by communication and outreach that inform the public and make the case for speed reduction, engineering techniques that actively
94 encourage motorists to drive at slower speeds such as narrower lanes, and heightened, visible law enforcement. Targeted enforcement Increase compliance with appropriate traffic laws by both pedestrians and motorists to reduce injuries and fatalities. Traffic enforcement is most effective when it is highly visible and publicized to reinforce the message of the required behavior and to raise the expectation that failure to comply may result in legal consequences. A coordinated program of targeted enforcement should involve a range of support activities, such as communications and outreach to notify the public, training law enforcement officers on goals and procedures, and educating prosecutors and judges so they understand the importance of the campaign and are prepared for the increase in citations that enforcement will produce. Safe Routes to School (SRTS) Increase the amount of bicycling and walking trips to and from school while simultaneously improving safety for children walking and bicycling. SRTS programs are community-based and are intended to be comprehensive from education to enforcement to engineering. Encouragement and learning about positive health outcomes are often incorporated into SRTS programs. Since October 1, SRTS funding has been incorporated into the Transportation Alternatives Program (TAP). FHWA Concludes Pedestrian Countermeasure Study in Three Cities. Tamara Redmon. ITE Journal, Volume 81, Number 8. August 11 In 3, the Federal Highway Administration (FHWA) conducted a study of pedestrian safety countermeasures in three major U.S. cities; Miami, Las Vegas, and San Francisco. These cities were given grants to develop, deploy, and evaluate low-cost countermeasures for improving pedestrian safety. Field teams were tasked with assessing the effectiveness of the new countermeasures. In an effort to help their assessments, FHWA researchers helped create a list of measures of effectiveness (MOEs). MOEs ranged from measuring the motor vehicle s speed, percentage of driver s braking, percentage of pedestrians trapped in crosswalk, percentage of yielding drivers, pedestrian delay time, and pedestrian crossing time. Countermeasures implemented as part of the FHWA study are listed below.
 Leading pedestrian interval Prohibition of permissive left-turns Dangerous By Design, Smart")
 that ranks state and cities according to the relative risk pedestrians face.")
95 TURNING VEHICLES YIELD TO PEDESTRIANS (R1-15 series) signs In-Street Pedestrian Crossing (R1-6 series) signs NO TURN ON RED (R1-11 series) signs Portable radar speed trailers Pedestrian signal push buttons that confirm the press Automated pedestrian detection Rectangular rapid flashing beacons (RRFBs) Leading pedestrian interval Prohibition of permissive left-turns Dangerous By Design, Smart Growth America, 14 Dangerous by Design describes the pedestrian safety issue in the United States and documents preventable pedestrian fatalities and what can be done to make our streets safer for everyone. The authors use years of data to calculate a Pedestrian Danger Index (PDI) that ranks state and cities according to the relative risk pedestrians face. Florida is consistently ranked #1 with the highest PDI in the nation. Another key finding of the data analysis is that although the number of pedestrian fatalities dipped during 6 through 9, the number of pedestrian fatalities has been on an increasing trend since 1. Furthermore, the percentage of traffic fatalities that are pedestrians has steadily increased regardless of the raw number of pedestrian fatalities. In 1, people on foot represented nearly 15 percent (15%) of all traffic fatalities.

96 Effects of Shared Lane Markings on Bicyclist and Motorist Behavior, Federal Highway Administration, 4 The primary goal of this study was to determine the effects that a sharing lane (sharrow) has on the safety of the motorist and bicyclist. The sharrow is denoted by a pavement marking visible to both the motorist and bicyclist. The placement of this marking is determined by the safest bicyclist lane position. It is recommend by researchers to place this marking in the center of the travel lane unless both the motorist and bicyclist can share the lane side by side with enough passing separation. The placement in the center of the travel lane will encourage bicyclists to occupy the full travel lane and minimize wear. This study also shows that sharrows can be installed per MUTCD guidance spacing for about $4, per lane-mile. PEDSAFE: Pedestrian Safety Guide and Countermeasure Selection System, 4 The Pedestrian Safety Guide and Countermeasure Selection System provides users with information for improving the movement and safety of pedestrians. PEDSAFE includes several tools: Selection Tool Find appropriate countermeasures on the basis of desired objectives. Interactive Matrices View the countermeasures associated with crash types and performance objectives. Countermeasures Read descriptions of the 49 engineering, education, and enforcement treatments. Case Studies Review real-world examples of implemented treatments.

97 BIKESAFE: Bicycle Countermeasure Selection System, 6 The Bicycle Countermeasure Selection System provides users with information for improving the movement and safety of bicyclists. BIKESAFE includes several tools: Selection Tool Find appropriate countermeasures based on desired objectives. Interactive Matrices View the countermeasures associated with crash types and performance objectives. Countermeasures Read descriptions of the 5 engineering, education, and enforcement treatments. Case Studies Review real-world examples of implemented treatments. Pedestrian Safety Engineering and ITS-Based Countermeasures Program for Reducing Pedestrian Fatalities, Injury Conflicts, and Other Surrogate Measures Final System Impact Report, Federal Highway Administration, 9 This report details the deployment and evaluation of a countermeasures program that is ITSbased and includes pedestrian safety engineering. The focus of this program was to reduce pedestrian fatalities, injuries, and conflicts in three cities: Las Vegas, Miami, and San Francisco. The first phase of this program consisted of analyzing pedestrian crashes, selecting appropriate countermeasures, deployment and evaluation plans, and collecting and analyzing baseline data. The second phase included implementing and evaluating the impacts of the countermeasures. A total of 18 unique pedestrian safety countermeasure combinations were deployed, ten of which were set in more than one of the three cities. The rest were deployed in only one city. After these countermeasures were evaluated, the following seven were classified as being highly effective in impacting behaviors related to pedestrian safety : Leading pedestrian interval Pedestrian countdown signals In-street pedestrian signs Activated flashing beacons

98 Rectangular rapid flashing beacons (RRFB) Call buttons that confirm the press Danish offset combined with high-visibility crosswalk, advance yield markings, and YIELD HERE TO PEDESTRIAN signs Pedestrian Countermeasure Policy Best Practice Report, Federal Highway Administration The Pedestrian Countermeasure Policy Best Practice report discusses proven pedestrian safety countermeasures such as raised medians, refuge islands, paved shoulders, and walkways. The report states that the use of raised medians and refuge islands can benefit the safety of pedestrians by: allowing pedestrians to cross one direction of traffic at a time providing space for improved lighting for pedestrian crossing reducing motor vehicle crashes decreasing motorist delays increasing roadway capacity reducing vehicle speeds providing space for landscaping within the right-of-way All multilane facilities shall be designed with a raised or restrictive median except four-lane sections with design speeds of 4 mph or less. Facilities having design speeds of 4 mph or less are to include sections of raised or restrictive median for enhancing vehicular and pedestrian safety, improving traffic efficiency, and attainment of the standards of the Access Management Classification of that highway system.
99 Best Practices in State Bicycle and Pedestrian Planning. Florida Planning and Development Lab, Florida State University, Department of Urban and Regional Planning, 5 This report presents the best practices for bicycle and pedestrian planning suitable to the Florida. This project consisted of reviewing bicycle and pedestrian plans from 18 states across the U.S. This report concludes with the following recommendations organized into three categories: Intervention o Targeting pedestrian and bicyclist safety education programs at motorists, roadway design professionals, and law enforcement officers o Enforcing unsafe motor vehicle driver and bicyclist behaviors o Increasing bikeway and walkway width standards o Adopting roadway standards that allow the construction of narrower streets o Prioritizing projects that provide for exclusive pedestrian phases at intersections Implementation o Connecting land use planning and bicycle and pedestrian planning o Fostering intergovernmental coordination of bicycle and pedestrian planning o Promoting bicycle and pedestrian planning with MPOs and local agencies o Targeting capital improvements to high risk geographical areas Evaluation o Collecting data related to the percentage of Floridians who travel by bicycling or walking during daily activities o Collecting data related to the percentage of streets in urban areas with adequate pedestrian and bicycle facilities o Using direct digital input of all crash-related information at the scene of a crash
 was created to supplant The Florida Strategic Highway")

100 Florida Pedestrian and Bicycle Strategic Safety Plan. The Center for Urban Transportation Research, University of South Florida, 13 The Florida Pedestrian and Bicycle Strategic Safety Plan (PBSSP) was created to supplant The Florida Strategic Highway Safety Plan by taking a more detailed approach to improving pedestrian and bicycle safety in the state of Florida. Palm Beach has been listed in the PBSSP as one of the top ten counties in Florida with the highest number of pedestrian fatalities and injuries. Some of the objectives of the PBSSP include: Conducting studies to determine pedestrian and bicycle fatality/injury trends. Evaluate the current use of countermeasures and their effectiveness. Identify, promote, and implement pedestrian and bicycle best practices on Florida s transportation network. Florida Strategic Highway Safety Plan, Florida Department of Transportation, 1 The Florida Strategic Highway Safety Plan emphasizes the importance of improving pedestrian and bicyclist safety. According to this Safety Plan, from 6 to 1, pedestrian fatalities decreased from 546 to 46. To address the issue of pedestrians and bicyclist safety, this safety plan offers the following suggestions: Using better detection systems for bicycles at signalized intersections Initiating bicycle and pedestrian traffic count programs Determining the relationship between design, capacity, and safety Conducting annual training for bicycle and pedestrian design Minimizing conflict severity by implementation of innovative intersection design options Increasing the knowledge of safety related policies, laws, programs, and procedures Educating planners, engineers, and decision-makers on community and infrastructure design that enhances the use of transportation alternatives
 or they can be channelized (raised medians or islands) to separate various road users.")

101 Proven Safety Countermeasures Medians and Pedestrian Crossing Islands in Urban and Suburban Areas A median is an area between opposing lanes of traffic, excluding turn lanes. Medians in urban and suburban areas can either be open (pavement markings only) or they can be channelized (raised medians or islands) to separate various road users. Pedestrian crossing islands (or refuge areas) also known as center islands, refuge islands, pedestrian islands, or median slow points are raised islands placed on a street at intersections or midblock locations to separate crossing pedestrians from motor vehicles. There are several types of medians and pedestrian crossing islands, and if designed and applied appropriately, they improve the safety benefits to both pedestrians and vehicles in the following ways: They may reduce pedestrian crashes by 46 percent and motor vehicle crashes by up to 39 percent. They may decrease delays (by greater than 3 percent) for motorists. They allow pedestrians a safe place to stop at the mid point of the roadway before crossing the remaining distance. They enhance the visibility of pedestrian crossings, particularly at unsignalized crossing points. They can reduce the speed of vehicles approaching pedestrian crossings. They can be used for access management for vehicles (allowing only right in/right out turning movements). They provide space for supplemental signage on multi lane roadways. Background Midblock locations account for more than 7 percent of pedestrian fatalities. This is where vehicle travel speeds are higher, contributing to the larger injury and fatality rate seen at these locations. More than 8 percent of pedestrians die when hit by vehicles traveling at 4 mph or faster while less than 1 percent die when hit at mph or less. Installing such raised channelization on approaches to multi lane intersections has been shown to be especially effective. Medians are a particularly important pedestrian safety countermeasure in areas where pedestrians access a transit stop or other clear origins/destinations across from each other. Providing raised medians or pedestrian refuge areas at marked crosswalks has demonstrated a 46 percent reduction in pedestrian crashes. At unmarked crosswalk locations, medians have demonstrated a 39 percent reduction in pedestrian crashes.
) and intermediate or high travel speeds.")
102 Guidance Raised medians (or refuge areas) should be considered in curbed sections of multi lane roadways in urban and suburban areas, particularly in areas where there are mixtures of significant pedestrian and vehicle traffic (more than 1, Average Daily Traffic (ADT)) and intermediate or high travel speeds. Medians/refuge islands should be at least 4 feet wide (preferably 8 feet wide to accommodate pedestrian comfort and safety) and of adequate length to allow the anticipated number of pedestrians to stand and wait for gaps in traffic before crossing the second half of the street. Key Resources A Review of Pedestrian Safety Research in the United States and Abroad, p Pedestrian Facility User s Guide: Providing Safety and Mobility, p Guide for the Planning, Design, and Operation of Pedestrian Facilities, American Association of State Highway and Transportation Officials, 4 [Available for purchase from AASHTO] Pedestrian Road Safety Audits and Prompt Lists FHWA Office of Safety Bicycle and Pedestrian Safety Safety Effects of Marked vs. Unmarked Crosswalks at Uncontrolled Locations, p Handbook of Road Safety Measures Analyzing Raised Median Safety Impacts Using Bayesian Methods FHWA Contacts Office of Safety: Tamara Redmon, tamara.redmon@dot.gov, FHWA Office of Research: Ann Do, ann.do@dot.gov, FHWA Resource Center: Peter Eun, peter.eun@dot.gov, FHWA Web site: FHWA-SA-1-11
103 Appendix B Crash Data Maps
104 MARTIN COUNTY BROWARD COUNTY JOG RD INTERSTATE 95 CR 88 SR 7/US 441 FLORIDA'S TURNPIKE MILITARY TR BEELINE HWY ALT A1A SOUTHERN BLVD CONNERS HWY MILITARY TRAIL OCEAN BLVD INDIANTOWN RD HAVERHILL RD GLADES RD PGA BLVD OKEECHOBEE BLVD FEDERAL HWY US 7/SR 5 YAMATO RD HOOKER HIGHWAY BROWNS FARM RD LANTANA RD 1 AVE N NORTHLAKE BLVD LAKE WORTH RD 45 ST FOREST HILL BLVD DIXIE HWY LYONS RD ATLANTIC AVE SW 18 ST BELVEDERE RD KIRK RD HATTON HWY OCEAN DR PALMETTO PARK RD FEDERAL HWY/US1/SR5 CONGRESS AVE NW AVE HOOD RD BOYNTON BCH BLVD SR-7 GATEWAY BLVD HYPOLUXO RD GATOR BLVD CLINT MOORE RD LAKE IDA RD AUSTRALIAN AVE LINTON BLVD SUMMIT BLVD SEACREST BLVD SEM PRATT WHITNEY RD LAKE SHORE DR CENTRAL BLVD COCONUT BLVD 6 AVE S HAGEN RANCH RD WOOLBRIGHT RD ORANGE BLVD PARKER AVE N A ST MUCK CITY RD TEMPLE BLVD 1 AVE N EL CLAIR RANCH RD PURDY LN LOXAHATCHEE RD MELALEUCA LN GOLF RD PROSPERITY FARMS RD PIERSON RD MINER RD CENTER ST FLAGLER DR SR 7 EXTENSION CAIN BLVD S COUNTY RD OLD DIXIE HWY FAU BLVD 15 ST PINEHURST DR 36 ST W CAMINO REAL ELLISON WILSON RD TONEY PENNA DR NE 5 AVE ISLAND WAY SW 1 ST AERO CLUB DR JUPITER FARMS RD 5 ST PIONEER RD AIRPORT RD PONDEROSA DR TEQUESTA DR SIMS RD NE 6 AVE BROADWAY LION COUNTRY SAFARI JOG RD LYONS RD LYONS RD SW 18 ST FLAGLER DR OCEAN BLVD DIXIE HWY HAGEN RANCH RD OCEAN BLVD 1 5 Miles CR 88 CONNERS HWY HOOKER HIGHWAY US 7/SR 5 OKEECHOBEE RD GATOR BLVD BACOM POINT RD CR 87A BROWNS FARM RD MUCK CITY RD DUDA RD BELLE GLADE RD TABIT RD NW 16 ST Palm Beach MPO Pedestrian and Bicycle Safety Study 1-14 Pedestrian Crashes I The Glades Legend Pedestrian Crashes African American Population Density Low Low-Medium Medium Medium-High High
105 MARTIN COUNTY BROWARD COUNTY JOG RD INTERSTATE 95 CR 88 SR 7/US 441 FLORIDA'S TURNPIKE MILITARY TR BEELINE HWY ALT A1A SOUTHERN BLVD CONNERS HWY MILITARY TRAIL OCEAN BLVD INDIANTOWN RD HAVERHILL RD GLADES RD PGA BLVD OKEECHOBEE BLVD FEDERAL HWY US 7/SR 5 YAMATO RD HOOKER HIGHWAY BROWNS FARM RD LANTANA RD 1 AVE N NORTHLAKE BLVD LAKE WORTH RD 45 ST FOREST HILL BLVD DIXIE HWY LYONS RD ATLANTIC AVE SW 18 ST BELVEDERE RD KIRK RD HATTON HWY OCEAN DR PALMETTO PARK RD FEDERAL HWY/US1/SR5 CONGRESS AVE NW AVE HOOD RD BOYNTON BCH BLVD SR-7 GATEWAY BLVD HYPOLUXO RD GATOR BLVD CLINT MOORE RD LAKE IDA RD AUSTRALIAN AVE LINTON BLVD SUMMIT BLVD SEACREST BLVD SEM PRATT WHITNEY RD LAKE SHORE DR CENTRAL BLVD COCONUT BLVD 6 AVE S HAGEN RANCH RD WOOLBRIGHT RD ORANGE BLVD PARKER AVE N A ST MUCK CITY RD TEMPLE BLVD 1 AVE N EL CLAIR RANCH RD PURDY LN LOXAHATCHEE RD MELALEUCA LN GOLF RD PROSPERITY FARMS RD PIERSON RD MINER RD CENTER ST FLAGLER DR SR 7 EXTENSION CAIN BLVD S COUNTY RD OLD DIXIE HWY FAU BLVD 15 ST PINEHURST DR 36 ST W CAMINO REAL ELLISON WILSON RD TONEY PENNA DR NE 5 AVE ISLAND WAY SW 1 ST AERO CLUB DR JUPITER FARMS RD 5 ST PIONEER RD AIRPORT RD PONDEROSA DR TEQUESTA DR SIMS RD NE 6 AVE BROADWAY LION COUNTRY SAFARI JOG RD LYONS RD LYONS RD SW 18 ST FLAGLER DR OCEAN BLVD DIXIE HWY HAGEN RANCH RD OCEAN BLVD 1 5 Miles CR 88 CONNERS HWY HOOKER HIGHWAY US 7/SR 5 OKEECHOBEE RD GATOR BLVD BACOM POINT RD CR 87A BROWNS FARM RD MUCK CITY RD DUDA RD BELLE GLADE RD TABIT RD NW 16 ST Palm Beach MPO Pedestrian and Bicycle Safety Study 1-14 Pedestrian Crashes I The Glades Legend Pedestrian Crashes Hispanic/Latino Population Density Low Low-Medium Medium Medium-High High
106 MARTIN COUNTY BROWARD COUNTY JOG RD INTERSTATE 95 CR 88 SR 7/US 441 FLORIDA'S TURNPIKE MILITARY TR BEELINE HWY ALT A1A SOUTHERN BLVD CONNERS HWY MILITARY TRAIL OCEAN BLVD INDIANTOWN RD HAVERHILL RD GLADES RD PGA BLVD OKEECHOBEE BLVD FEDERAL HWY US 7/SR 5 YAMATO RD HOOKER HIGHWAY BROWNS FARM RD LANTANA RD 1 AVE N NORTHLAKE BLVD LAKE WORTH RD 45 ST FOREST HILL BLVD DIXIE HWY LYONS RD ATLANTIC AVE SW 18 ST BELVEDERE RD KIRK RD HATTON HWY OCEAN DR PALMETTO PARK RD FEDERAL HWY/US1/SR5 CONGRESS AVE NW AVE HOOD RD BOYNTON BCH BLVD SR-7 GATEWAY BLVD HYPOLUXO RD GATOR BLVD CLINT MOORE RD LAKE IDA RD AUSTRALIAN AVE LINTON BLVD SUMMIT BLVD SEACREST BLVD SEM PRATT WHITNEY RD LAKE SHORE DR CENTRAL BLVD COCONUT BLVD 6 AVE S HAGEN RANCH RD WOOLBRIGHT RD ORANGE BLVD PARKER AVE N A ST MUCK CITY RD TEMPLE BLVD 1 AVE N EL CLAIR RANCH RD PURDY LN LOXAHATCHEE RD MELALEUCA LN GOLF RD PROSPERITY FARMS RD PIERSON RD MINER RD CENTER ST FLAGLER DR SR 7 EXTENSION CAIN BLVD S COUNTY RD OLD DIXIE HWY FAU BLVD 15 ST PINEHURST DR 36 ST W CAMINO REAL ELLISON WILSON RD TONEY PENNA DR NE 5 AVE ISLAND WAY SW 1 ST AERO CLUB DR JUPITER FARMS RD 5 ST PIONEER RD AIRPORT RD PONDEROSA DR TEQUESTA DR SIMS RD NE 6 AVE BROADWAY LION COUNTRY SAFARI JOG RD LYONS RD LYONS RD SW 18 ST FLAGLER DR OCEAN BLVD DIXIE HWY HAGEN RANCH RD OCEAN BLVD 1 5 Miles CR 88 CONNERS HWY HOOKER HIGHWAY US 7/SR 5 OKEECHOBEE RD GATOR BLVD BACOM POINT RD CR 87A BROWNS FARM RD MUCK CITY RD DUDA RD BELLE GLADE RD TABIT RD NW 16 ST Palm Beach MPO Pedestrian and Bicycle Safety Study 1-14 Pedestrian Crashes I The Glades Legend Pedestrian Crashes Functional Classification Principal Arterial-Interstate (Rural) Principal Arterial-Expressway (Rural) Principal Arterial-Other (Rural) Principal Arterial-Interstate (Urban) Principal Arterial-Freeway/Expressway (Urban) Principal Arterial-Other (Urban)
107 MARTIN COUNTY BROWARD COUNTY JOG RD INTERSTATE 95 CR 88 SR 7/US 441 FLORIDA'S TURNPIKE MILITARY TR BEELINE HWY ALT A1A SOUTHERN BLVD CONNERS HWY MILITARY TRAIL OCEAN BLVD INDIANTOWN RD HAVERHILL RD GLADES RD PGA BLVD OKEECHOBEE BLVD FEDERAL HWY US 7/SR 5 YAMATO RD HOOKER HIGHWAY BROWNS FARM RD LANTANA RD 1 AVE N NORTHLAKE BLVD LAKE WORTH RD 45 ST FOREST HILL BLVD DIXIE HWY LYONS RD ATLANTIC AVE SW 18 ST BELVEDERE RD KIRK RD HATTON HWY OCEAN DR PALMETTO PARK RD FEDERAL HWY/US1/SR5 CONGRESS AVE NW AVE HOOD RD BOYNTON BCH BLVD SR-7 GATEWAY BLVD HYPOLUXO RD GATOR BLVD CLINT MOORE RD LAKE IDA RD AUSTRALIAN AVE LINTON BLVD SUMMIT BLVD SEACREST BLVD SEM PRATT WHITNEY RD LAKE SHORE DR CENTRAL BLVD COCONUT BLVD 6 AVE S HAGEN RANCH RD WOOLBRIGHT RD ORANGE BLVD PARKER AVE N A ST MUCK CITY RD TEMPLE BLVD 1 AVE N EL CLAIR RANCH RD PURDY LN LOXAHATCHEE RD MELALEUCA LN GOLF RD PROSPERITY FARMS RD PIERSON RD MINER RD CENTER ST FLAGLER DR SR 7 EXTENSION CAIN BLVD S COUNTY RD OLD DIXIE HWY FAU BLVD 15 ST PINEHURST DR 36 ST W CAMINO REAL ELLISON WILSON RD TONEY PENNA DR NE 5 AVE ISLAND WAY SW 1 ST AERO CLUB DR JUPITER FARMS RD 5 ST PIONEER RD AIRPORT RD PONDEROSA DR TEQUESTA DR SIMS RD NE 6 AVE BROADWAY LION COUNTRY SAFARI JOG RD LYONS RD LYONS RD SW 18 ST FLAGLER DR OCEAN BLVD DIXIE HWY HAGEN RANCH RD OCEAN BLVD 1 5 Miles CR 88 CONNERS HWY HOOKER HIGHWAY US 7/SR 5 OKEECHOBEE RD GATOR BLVD BACOM POINT RD CR 87A BROWNS FARM RD MUCK CITY RD DUDA RD BELLE GLADE RD TABIT RD NW 16 ST Palm Beach MPO Pedestrian and Bicycle Safety Study 1-14 Pedestrian Crashes I The Glades Legend Pedestrian Crashes Land Use Agricultural Industrial Institutional Recreation Residential Retail/Office Source: Palm Beach County
108 MARTIN COUNTY BROWARD COUNTY JOG RD INTERSTATE 95 CR 88 SR 7/US 441 FLORIDA'S TURNPIKE MILITARY TR BEELINE HWY ALT A1A SOUTHERN BLVD CONNERS HWY MILITARY TRAIL OCEAN BLVD INDIANTOWN RD HAVERHILL RD GLADES RD PGA BLVD OKEECHOBEE BLVD FEDERAL HWY US 7/SR 5 YAMATO RD HOOKER HIGHWAY BROWNS FARM RD LANTANA RD 1 AVE N NORTHLAKE BLVD LAKE WORTH RD 45 ST FOREST HILL BLVD DIXIE HWY LYONS RD ATLANTIC AVE SW 18 ST BELVEDERE RD KIRK RD HATTON HWY OCEAN DR PALMETTO PARK RD FEDERAL HWY/US1/SR5 CONGRESS AVE NW AVE HOOD RD BOYNTON BCH BLVD SR-7 GATEWAY BLVD HYPOLUXO RD GATOR BLVD CLINT MOORE RD LAKE IDA RD AUSTRALIAN AVE LINTON BLVD SUMMIT BLVD SEACREST BLVD SEM PRATT WHITNEY RD LAKE SHORE DR CENTRAL BLVD COCONUT BLVD 6 AVE S HAGEN RANCH RD WOOLBRIGHT RD ORANGE BLVD PARKER AVE N A ST MUCK CITY RD TEMPLE BLVD 1 AVE N EL CLAIR RANCH RD PURDY LN LOXAHATCHEE RD MELALEUCA LN GOLF RD PROSPERITY FARMS RD PIERSON RD MINER RD CENTER ST FLAGLER DR SR 7 EXTENSION CAIN BLVD S COUNTY RD OLD DIXIE HWY FAU BLVD 15 ST PINEHURST DR 36 ST W CAMINO REAL ELLISON WILSON RD TONEY PENNA DR NE 5 AVE ISLAND WAY SW 1 ST AERO CLUB DR JUPITER FARMS RD 5 ST PIONEER RD AIRPORT RD PONDEROSA DR TEQUESTA DR SIMS RD NE 6 AVE BROADWAY LION COUNTRY SAFARI JOG RD LYONS RD LYONS RD SW 18 ST FLAGLER DR OCEAN BLVD DIXIE HWY HAGEN RANCH RD OCEAN BLVD 1 5 Miles CR 88 CONNERS HWY HOOKER HIGHWAY US 7/SR 5 OKEECHOBEE RD GATOR BLVD BACOM POINT RD CR 87A BROWNS FARM RD MUCK CITY RD DUDA RD BELLE GLADE RD TABIT RD NW 16 ST Palm Beach MPO Pedestrian and Bicycle Safety Study 1-14 Pedestrian Crashes I The Glades Legend Pedestrian Crashes High Ridership Stops Palm Tram Routes
109 LYONS RD JOG RD EL CLAIR RANCH RD SIMS RD NW 16 ST LYONS RD LAKE SHORE DR The Glades MUCK CITY RD OKEECHOBEE RD HATTON HWY CONNERS HWY HOOKER HIGHWAY GATOR BLVD US 7/SR 5 BACOM POINT RD CR 87A BELLE GLADE RD TABIT RD BROWNS FARM RD MUCK CITY RD 5 1 Miles DUDA RD CR 88 CONNERS HWY HOOKER HIGHWAY GATOR BLVD BROWNS FARM RD CR 88 LION COUNTRY SAFARI MARTIN COUNTY SEM PRATT WHITNEY RD INDIANTOWN RD AERO CLUB DR TEMPLE BLVD ORANGE BLVD Palm Beach MPO Pedestrian and Bicycle Safety Study COCONUT BLVD 1 AVE N SR 7 EXTENSION SOUTHERN BLVD PIERSON RD SR-7 JUPITER FARMS RD BEELINE HWY FLORIDA'S TURNPIKE PGA BLVD NORTHLAKE BLVD OKEECHOBEE BLVD LYONS RD 1-14 Pedestrian Crashes Juvenile Related (Under Age 18) I ISLAND WAY PIONEER RD PINEHURST DR HAGEN RANCH RD JOG RD HOOD RD HAVERHILL RD CENTRAL BLVD MILITARY TRAIL LANTANA RD ALT A1A 45 ST SUMMIT BLVD TEQUESTA DR CENTER ST TONEY PENNA DR FOREST HILL BLVD PURDY LN KIRK RD CONGRESS AVE 1 AVE N LAKE WORTH RD MELALEUCA LN HYPOLUXO RD PROSPERITY FARMS RD AUSTRALIAN AVE BELVEDERE RD MINER RD ELLISON WILSON RD 6 AVE S INTERSTATE 95 PARKER AVE N A ST GATEWAY BLVD OCEAN DR FEDERAL HWY/US1/SR5 OLD DIXIE HWY 36 ST 5 ST 15 ST DIXIE HWY BROADWAY FEDERAL HWY FLAGLER DR FLAGLER DR OCEAN BLVD OCEAN BLVD S COUNTY RD BOYNTON BCH BLVD SR 7/US 441 HAGEN RANCH RD WOOLBRIGHT RD GOLF RD LAKE IDA RD NE 6 AVE SEACREST BLVD ATLANTIC AVE SW 1 ST LINTON BLVD Legend US 7/SR 5 Palm Beach County School Bus Stops Low Crashes Low-Medium Crashes Medium Crashes Medium-High Crashes High Crashes LOXAHATCHEE RD BROWARD COUNTY CAIN BLVD PONDEROSA DR GLADES RD CLINT MOORE RD YAMATO RD SW 18 ST MILITARY TR FAU BLVD AIRPORT RD NW AVE PALMETTO PARK RD W CAMINO REAL SW 18 ST DIXIE HWY NE 5 AVE OCEAN BLVD
110 LYONS RD JOG RD EL CLAIR RANCH RD SIMS RD NW 16 ST LYONS RD LAKE SHORE DR The Glades MUCK CITY RD OKEECHOBEE RD HATTON HWY CONNERS HWY HOOKER HIGHWAY GATOR BLVD US 7/SR 5 BACOM POINT RD CR 87A BELLE GLADE RD TABIT RD BROWNS FARM RD MUCK CITY RD 5 1 Miles DUDA RD CR 88 CONNERS HWY HOOKER HIGHWAY GATOR BLVD BROWNS FARM RD CR 88 LION COUNTRY SAFARI MARTIN COUNTY SEM PRATT WHITNEY RD INDIANTOWN RD AERO CLUB DR TEMPLE BLVD ORANGE BLVD Palm Beach MPO Pedestrian and Bicycle Safety Study COCONUT BLVD 1 AVE N SR 7 EXTENSION SOUTHERN BLVD PIERSON RD SR-7 JUPITER FARMS RD BEELINE HWY FLORIDA'S TURNPIKE PGA BLVD NORTHLAKE BLVD OKEECHOBEE BLVD LYONS RD 1-14 Pedestrian Crashes Juvenile Related (Under Age 18) I ISLAND WAY PIONEER RD PINEHURST DR HAGEN RANCH RD JOG RD HOOD RD HAVERHILL RD CENTRAL BLVD MILITARY TRAIL LANTANA RD ALT A1A 45 ST SUMMIT BLVD TEQUESTA DR CENTER ST TONEY PENNA DR FOREST HILL BLVD PURDY LN KIRK RD CONGRESS AVE 1 AVE N LAKE WORTH RD MELALEUCA LN HYPOLUXO RD PROSPERITY FARMS RD AUSTRALIAN AVE BELVEDERE RD MINER RD ELLISON WILSON RD 6 AVE S INTERSTATE 95 PARKER AVE N A ST GATEWAY BLVD OCEAN DR FEDERAL HWY/US1/SR5 OLD DIXIE HWY 36 ST 5 ST 15 ST DIXIE HWY BROADWAY FEDERAL HWY FLAGLER DR FLAGLER DR OCEAN BLVD OCEAN BLVD S COUNTY RD BOYNTON BCH BLVD SR 7/US 441 HAGEN RANCH RD WOOLBRIGHT RD GOLF RD LAKE IDA RD NE 6 AVE SEACREST BLVD ATLANTIC AVE SW 1 ST LINTON BLVD Legend n US 7/SR 5 Palm Beach Schools Low Crashes Low-Medium Crashes Medium Crashes Medium-High Crashes High Crashes LOXAHATCHEE RD BROWARD COUNTY CAIN BLVD PONDEROSA DR GLADES RD CLINT MOORE RD YAMATO RD SW 18 ST MILITARY TR FAU BLVD AIRPORT RD NW AVE PALMETTO PARK RD W CAMINO REAL SW 18 ST DIXIE HWY NE 5 AVE OCEAN BLVD
111 MARTIN COUNTY BROWARD COUNTY JOG RD INTERSTATE 95 CR 88 SR 7/US 441 FLORIDA'S TURNPIKE MILITARY TR BEELINE HWY ALT A1A SOUTHERN BLVD CONNERS HWY MILITARY TRAIL OCEAN BLVD INDIANTOWN RD HAVERHILL RD GLADES RD PGA BLVD OKEECHOBEE BLVD FEDERAL HWY US 7/SR 5 YAMATO RD HOOKER HIGHWAY BROWNS FARM RD LANTANA RD 1 AVE N NORTHLAKE BLVD LAKE WORTH RD 45 ST FOREST HILL BLVD DIXIE HWY LYONS RD ATLANTIC AVE SW 18 ST BELVEDERE RD KIRK RD HATTON HWY OCEAN DR PALMETTO PARK RD FEDERAL HWY/US1/SR5 CONGRESS AVE NW AVE HOOD RD BOYNTON BCH BLVD SR-7 GATEWAY BLVD HYPOLUXO RD GATOR BLVD CLINT MOORE RD LAKE IDA RD AUSTRALIAN AVE LINTON BLVD SUMMIT BLVD SEACREST BLVD SEM PRATT WHITNEY RD LAKE SHORE DR CENTRAL BLVD COCONUT BLVD 6 AVE S HAGEN RANCH RD WOOLBRIGHT RD ORANGE BLVD PARKER AVE N A ST MUCK CITY RD TEMPLE BLVD 1 AVE N EL CLAIR RANCH RD PURDY LN LOXAHATCHEE RD MELALEUCA LN GOLF RD PROSPERITY FARMS RD PIERSON RD MINER RD CENTER ST FLAGLER DR SR 7 EXTENSION CAIN BLVD S COUNTY RD OLD DIXIE HWY FAU BLVD 15 ST PINEHURST DR 36 ST W CAMINO REAL ELLISON WILSON RD TONEY PENNA DR NE 5 AVE ISLAND WAY SW 1 ST AERO CLUB DR JUPITER FARMS RD 5 ST PIONEER RD AIRPORT RD PONDEROSA DR TEQUESTA DR SIMS RD NE 6 AVE BROADWAY LION COUNTRY SAFARI JOG RD LYONS RD LYONS RD SW 18 ST FLAGLER DR OCEAN BLVD DIXIE HWY HAGEN RANCH RD OCEAN BLVD 1 5 Miles CR 88 CONNERS HWY HOOKER HIGHWAY US 7/SR 5 OKEECHOBEE RD GATOR BLVD BACOM POINT RD CR 87A BROWNS FARM RD MUCK CITY RD DUDA RD BELLE GLADE RD TABIT RD NW 16 ST Palm Beach MPO Pedestrian and Bicycle Safety Study 1-14 Bicyclist Crashes I The Glades Legend Bicyclist Crashes African American Population Density Low Low-Medium Medium Medium-High High

112 MARTIN COUNTY BROWARD COUNTY JOG RD INTERSTATE 95 CR 88 SR 7/US 441 FLORIDA'S TURNPIKE MILITARY TR BEELINE HWY ALT A1A SOUTHERN BLVD CONNERS HWY MILITARY TRAIL OCEAN BLVD INDIANTOWN RD HAVERHILL RD GLADES RD PGA BLVD OKEECHOBEE BLVD FEDERAL HWY US 7/SR 5 YAMATO RD HOOKER HIGHWAY BROWNS FARM RD LANTANA RD 1 AVE N NORTHLAKE BLVD LAKE WORTH RD 45 ST FOREST HILL BLVD DIXIE HWY LYONS RD ATLANTIC AVE SW 18 ST BELVEDERE RD KIRK RD HATTON HWY OCEAN DR PALMETTO PARK RD FEDERAL HWY/US1/SR5 CONGRESS AVE NW AVE HOOD RD BOYNTON BCH BLVD SR-7 GATEWAY BLVD HYPOLUXO RD GATOR BLVD CLINT MOORE RD LAKE IDA RD AUSTRALIAN AVE LINTON BLVD SUMMIT BLVD SEACREST BLVD SEM PRATT WHITNEY RD LAKE SHORE DR CENTRAL BLVD COCONUT BLVD 6 AVE S HAGEN RANCH RD WOOLBRIGHT RD ORANGE BLVD PARKER AVE N A ST MUCK CITY RD TEMPLE BLVD 1 AVE N EL CLAIR RANCH RD PURDY LN LOXAHATCHEE RD MELALEUCA LN GOLF RD PROSPERITY FARMS RD PIERSON RD MINER RD CENTER ST FLAGLER DR SR 7 EXTENSION CAIN BLVD S COUNTY RD OLD DIXIE HWY FAU BLVD 15 ST PINEHURST DR 36 ST W CAMINO REAL ELLISON WILSON RD TONEY PENNA DR NE 5 AVE ISLAND WAY SW 1 ST AERO CLUB DR JUPITER FARMS RD 5 ST PIONEER RD AIRPORT RD PONDEROSA DR TEQUESTA DR SIMS RD NE 6 AVE BROADWAY LION COUNTRY SAFARI JOG RD LYONS RD LYONS RD SW 18 ST FLAGLER DR OCEAN BLVD DIXIE HWY HAGEN RANCH RD OCEAN BLVD 1 5 Miles CR 88 CONNERS HWY HOOKER HIGHWAY US 7/SR 5 OKEECHOBEE RD GATOR BLVD BACOM POINT RD CR 87A BROWNS FARM RD MUCK CITY RD DUDA RD BELLE GLADE RD TABIT RD NW 16 ST Palm Beach MPO Pedestrian and Bicycle Safety Study 1-14 Bicyclist Crashes I The Glades Legend Bicyclist Crashes Hispanic/Latino Population Density Low Low-Medium Medium Medium-High High
113 MARTIN COUNTY BROWARD COUNTY JOG RD INTERSTATE 95 CR 88 SR 7/US 441 FLORIDA'S TURNPIKE MILITARY TR BEELINE HWY ALT A1A SOUTHERN BLVD CONNERS HWY MILITARY TRAIL OCEAN BLVD INDIANTOWN RD HAVERHILL RD GLADES RD PGA BLVD OKEECHOBEE BLVD FEDERAL HWY US 7/SR 5 YAMATO RD HOOKER HIGHWAY BROWNS FARM RD LANTANA RD 1 AVE N NORTHLAKE BLVD LAKE WORTH RD 45 ST FOREST HILL BLVD DIXIE HWY LYONS RD ATLANTIC AVE SW 18 ST BELVEDERE RD KIRK RD HATTON HWY OCEAN DR PALMETTO PARK RD FEDERAL HWY/US1/SR5 CONGRESS AVE NW AVE HOOD RD BOYNTON BCH BLVD SR-7 GATEWAY BLVD HYPOLUXO RD GATOR BLVD CLINT MOORE RD LAKE IDA RD AUSTRALIAN AVE LINTON BLVD SUMMIT BLVD SEACREST BLVD SEM PRATT WHITNEY RD LAKE SHORE DR CENTRAL BLVD COCONUT BLVD 6 AVE S HAGEN RANCH RD WOOLBRIGHT RD ORANGE BLVD PARKER AVE N A ST MUCK CITY RD TEMPLE BLVD 1 AVE N EL CLAIR RANCH RD PURDY LN LOXAHATCHEE RD MELALEUCA LN GOLF RD PROSPERITY FARMS RD PIERSON RD MINER RD CENTER ST FLAGLER DR SR 7 EXTENSION CAIN BLVD S COUNTY RD OLD DIXIE HWY FAU BLVD 15 ST PINEHURST DR 36 ST W CAMINO REAL ELLISON WILSON RD TONEY PENNA DR NE 5 AVE ISLAND WAY SW 1 ST AERO CLUB DR JUPITER FARMS RD 5 ST PIONEER RD AIRPORT RD PONDEROSA DR TEQUESTA DR SIMS RD NE 6 AVE BROADWAY LION COUNTRY SAFARI JOG RD LYONS RD LYONS RD SW 18 ST FLAGLER DR OCEAN BLVD DIXIE HWY HAGEN RANCH RD OCEAN BLVD 1 5 Miles CR 88 CONNERS HWY HOOKER HIGHWAY US 7/SR 5 OKEECHOBEE RD GATOR BLVD BACOM POINT RD CR 87A BROWNS FARM RD MUCK CITY RD DUDA RD BELLE GLADE RD TABIT RD NW 16 ST Palm Beach MPO Pedestrian and Bicycle Safety Study 1-14 Bicyclist Crashes I The Glades Legend Bicyclist Crashes Existing Bike Lanes Existing Greenways
114 MARTIN COUNTY BROWARD COUNTY JOG RD INTERSTATE 95 CR 88 SR 7/US 441 FLORIDA'S TURNPIKE MILITARY TR BEELINE HWY ALT A1A SOUTHERN BLVD CONNERS HWY MILITARY TRAIL OCEAN BLVD INDIANTOWN RD HAVERHILL RD GLADES RD PGA BLVD OKEECHOBEE BLVD FEDERAL HWY US 7/SR 5 YAMATO RD HOOKER HIGHWAY BROWNS FARM RD LANTANA RD 1 AVE N NORTHLAKE BLVD LAKE WORTH RD 45 ST FOREST HILL BLVD DIXIE HWY LYONS RD ATLANTIC AVE SW 18 ST BELVEDERE RD KIRK RD HATTON HWY OCEAN DR PALMETTO PARK RD FEDERAL HWY/US1/SR5 CONGRESS AVE NW AVE HOOD RD BOYNTON BCH BLVD SR-7 GATEWAY BLVD HYPOLUXO RD GATOR BLVD CLINT MOORE RD LAKE IDA RD AUSTRALIAN AVE LINTON BLVD SUMMIT BLVD SEACREST BLVD SEM PRATT WHITNEY RD LAKE SHORE DR CENTRAL BLVD COCONUT BLVD 6 AVE S HAGEN RANCH RD WOOLBRIGHT RD ORANGE BLVD PARKER AVE N A ST MUCK CITY RD TEMPLE BLVD 1 AVE N EL CLAIR RANCH RD PURDY LN LOXAHATCHEE RD MELALEUCA LN GOLF RD PROSPERITY FARMS RD PIERSON RD MINER RD CENTER ST FLAGLER DR SR 7 EXTENSION CAIN BLVD S COUNTY RD OLD DIXIE HWY FAU BLVD 15 ST PINEHURST DR 36 ST W CAMINO REAL ELLISON WILSON RD TONEY PENNA DR NE 5 AVE ISLAND WAY SW 1 ST AERO CLUB DR JUPITER FARMS RD 5 ST PIONEER RD AIRPORT RD PONDEROSA DR TEQUESTA DR SIMS RD NE 6 AVE BROADWAY LION COUNTRY SAFARI JOG RD LYONS RD LYONS RD SW 18 ST FLAGLER DR OCEAN BLVD DIXIE HWY HAGEN RANCH RD OCEAN BLVD 1 5 Miles CR 88 CONNERS HWY HOOKER HIGHWAY US 7/SR 5 OKEECHOBEE RD GATOR BLVD BACOM POINT RD CR 87A BROWNS FARM RD MUCK CITY RD DUDA RD BELLE GLADE RD TABIT RD NW 16 ST Palm Beach MPO Pedestrian and Bicycle Safety Study 1-14 Bicyclist Crashes I The Glades Legend Bicyclist Crashes Functional Classification Principal Arterial-Interstate (Rural) Principal Arterial-Expressway (Rural) Principal Arterial-Other (Rural) Principal Arterial-Interstate (Urban) Principal Arterial-Freeway/Expressway (Urban) Principal Arterial-Other (Urban)


115 MARTIN COUNTY BROWARD COUNTY JOG RD INTERSTATE 95 CR 88 SR 7/US 441 FLORIDA'S TURNPIKE MILITARY TR BEELINE HWY ALT A1A SOUTHERN BLVD CONNERS HWY MILITARY TRAIL OCEAN BLVD INDIANTOWN RD HAVERHILL RD GLADES RD PGA BLVD OKEECHOBEE BLVD FEDERAL HWY US 7/SR 5 YAMATO RD HOOKER HIGHWAY BROWNS FARM RD LANTANA RD 1 AVE N NORTHLAKE BLVD LAKE WORTH RD 45 ST FOREST HILL BLVD DIXIE HWY LYONS RD ATLANTIC AVE SW 18 ST BELVEDERE RD KIRK RD HATTON HWY OCEAN DR PALMETTO PARK RD FEDERAL HWY/US1/SR5 CONGRESS AVE NW AVE HOOD RD BOYNTON BCH BLVD SR-7 GATEWAY BLVD HYPOLUXO RD GATOR BLVD CLINT MOORE RD LAKE IDA RD AUSTRALIAN AVE LINTON BLVD SUMMIT BLVD SEACREST BLVD SEM PRATT WHITNEY RD LAKE SHORE DR CENTRAL BLVD COCONUT BLVD 6 AVE S HAGEN RANCH RD WOOLBRIGHT RD ORANGE BLVD PARKER AVE N A ST MUCK CITY RD TEMPLE BLVD 1 AVE N EL CLAIR RANCH RD PURDY LN LOXAHATCHEE RD MELALEUCA LN GOLF RD PROSPERITY FARMS RD PIERSON RD MINER RD CENTER ST FLAGLER DR SR 7 EXTENSION CAIN BLVD S COUNTY RD OLD DIXIE HWY FAU BLVD 15 ST PINEHURST DR 36 ST W CAMINO REAL ELLISON WILSON RD TONEY PENNA DR NE 5 AVE ISLAND WAY SW 1 ST AERO CLUB DR JUPITER FARMS RD 5 ST PIONEER RD AIRPORT RD PONDEROSA DR TEQUESTA DR SIMS RD NE 6 AVE BROADWAY LION COUNTRY SAFARI JOG RD LYONS RD LYONS RD SW 18 ST FLAGLER DR OCEAN BLVD DIXIE HWY HAGEN RANCH RD OCEAN BLVD 1 5 Miles CR 88 CONNERS HWY HOOKER HIGHWAY US 7/SR 5 OKEECHOBEE RD GATOR BLVD BACOM POINT RD CR 87A BROWNS FARM RD MUCK CITY RD DUDA RD BELLE GLADE RD TABIT RD NW 16 ST Palm Beach MPO Pedestrian and Bicycle Safety Study 1-14 Bicyclist Crashes I The Glades Legend Bicyclist Crashes Land Use Agricultural Industrial Institutional Recreation Residential Retail/Office
116 MARTIN COUNTY BROWARD COUNTY JOG RD INTERSTATE 95 CR 88 SR 7/US 441 FLORIDA'S TURNPIKE MILITARY TR BEELINE HWY ALT A1A SOUTHERN BLVD CONNERS HWY MILITARY TRAIL OCEAN BLVD INDIANTOWN RD HAVERHILL RD GLADES RD PGA BLVD OKEECHOBEE BLVD FEDERAL HWY US 7/SR 5 YAMATO RD HOOKER HIGHWAY BROWNS FARM RD LANTANA RD 1 AVE N NORTHLAKE BLVD LAKE WORTH RD 45 ST FOREST HILL BLVD DIXIE HWY LYONS RD ATLANTIC AVE SW 18 ST BELVEDERE RD KIRK RD HATTON HWY OCEAN DR PALMETTO PARK RD FEDERAL HWY/US1/SR5 CONGRESS AVE NW AVE HOOD RD BOYNTON BCH BLVD SR-7 GATEWAY BLVD HYPOLUXO RD GATOR BLVD CLINT MOORE RD LAKE IDA RD AUSTRALIAN AVE LINTON BLVD SUMMIT BLVD SEACREST BLVD SEM PRATT WHITNEY RD LAKE SHORE DR CENTRAL BLVD COCONUT BLVD 6 AVE S HAGEN RANCH RD WOOLBRIGHT RD ORANGE BLVD PARKER AVE N A ST MUCK CITY RD TEMPLE BLVD 1 AVE N EL CLAIR RANCH RD PURDY LN LOXAHATCHEE RD MELALEUCA LN GOLF RD PROSPERITY FARMS RD PIERSON RD MINER RD CENTER ST FLAGLER DR SR 7 EXTENSION CAIN BLVD S COUNTY RD OLD DIXIE HWY FAU BLVD 15 ST PINEHURST DR 36 ST W CAMINO REAL ELLISON WILSON RD TONEY PENNA DR NE 5 AVE ISLAND WAY SW 1 ST AERO CLUB DR JUPITER FARMS RD 5 ST PIONEER RD AIRPORT RD PONDEROSA DR TEQUESTA DR SIMS RD NE 6 AVE BROADWAY LION COUNTRY SAFARI JOG RD LYONS RD LYONS RD SW 18 ST FLAGLER DR OCEAN BLVD DIXIE HWY HAGEN RANCH RD OCEAN BLVD 1 5 Miles CR 88 CONNERS HWY HOOKER HIGHWAY US 7/SR 5 OKEECHOBEE RD GATOR BLVD BACOM POINT RD CR 87A BROWNS FARM RD MUCK CITY RD DUDA RD BELLE GLADE RD TABIT RD NW 16 ST Palm Beach MPO Pedestrian and Bicycle Safety Study 1-14 Bicyclist Crashes I The Glades Legend Bicyclist Crashes High Ridership Stops Palm Tram Routes
117 LYONS RD JOG RD EL CLAIR RANCH RD SIMS RD NW 16 ST LYONS RD LAKE SHORE DR The Glades MUCK CITY RD OKEECHOBEE RD HATTON HWY CONNERS HWY HOOKER HIGHWAY GATOR BLVD US 7/SR 5 BACOM POINT RD CR 87A BELLE GLADE RD TABIT RD BROWNS FARM RD MUCK CITY RD 5 1 Miles DUDA RD CR 88 CONNERS HWY HOOKER HIGHWAY GATOR BLVD BROWNS FARM RD CR 88 LION COUNTRY SAFARI MARTIN COUNTY SEM PRATT WHITNEY RD INDIANTOWN RD AERO CLUB DR TEMPLE BLVD ORANGE BLVD Palm Beach MPO Pedestrian and Bicycle Safety Study COCONUT BLVD 1 AVE N SR 7 EXTENSION SOUTHERN BLVD PIERSON RD SR-7 JUPITER FARMS RD BEELINE HWY FLORIDA'S TURNPIKE PGA BLVD NORTHLAKE BLVD OKEECHOBEE BLVD LYONS RD 1-14 Bicyclist Crashes Juvenile Related (Under Age 18) I ISLAND WAY PIONEER RD PINEHURST DR HAGEN RANCH RD JOG RD HOOD RD HAVERHILL RD CENTRAL BLVD MILITARY TRAIL LANTANA RD ALT A1A 45 ST SUMMIT BLVD TEQUESTA DR CENTER ST TONEY PENNA DR FOREST HILL BLVD PURDY LN KIRK RD CONGRESS AVE 1 AVE N LAKE WORTH RD MELALEUCA LN HYPOLUXO RD PROSPERITY FARMS RD AUSTRALIAN AVE BELVEDERE RD MINER RD ELLISON WILSON RD 6 AVE S INTERSTATE 95 PARKER AVE N A ST GATEWAY BLVD OCEAN DR FEDERAL HWY/US1/SR5 OLD DIXIE HWY 36 ST 5 ST 15 ST DIXIE HWY BROADWAY FEDERAL HWY FLAGLER DR FLAGLER DR OCEAN BLVD OCEAN BLVD S COUNTY RD BOYNTON BCH BLVD SR 7/US 441 HAGEN RANCH RD WOOLBRIGHT RD GOLF RD LAKE IDA RD NE 6 AVE SEACREST BLVD ATLANTIC AVE SW 1 ST LINTON BLVD Legend US 7/SR 5 Palm Beach County School Bus Stops Low Crashes Low-Medium Crashes Medium Crashes Medium-High Crashes High Crashes LOXAHATCHEE RD BROWARD COUNTY CAIN BLVD PONDEROSA DR GLADES RD CLINT MOORE RD YAMATO RD SW 18 ST MILITARY TR FAU BLVD AIRPORT RD NW AVE PALMETTO PARK RD W CAMINO REAL SW 18 ST DIXIE HWY NE 5 AVE OCEAN BLVD
118 LYONS RD JOG RD EL CLAIR RANCH RD SIMS RD NW 16 ST LYONS RD LAKE SHORE DR The Glades MUCK CITY RD OKEECHOBEE RD HATTON HWY CONNERS HWY HOOKER HIGHWAY GATOR BLVD US 7/SR 5 BACOM POINT RD CR 87A BELLE GLADE RD TABIT RD BROWNS FARM RD MUCK CITY RD 5 1 Miles DUDA RD CR 88 CONNERS HWY HOOKER HIGHWAY GATOR BLVD BROWNS FARM RD CR 88 LION COUNTRY SAFARI MARTIN COUNTY SEM PRATT WHITNEY RD INDIANTOWN RD AERO CLUB DR TEMPLE BLVD ORANGE BLVD Palm Beach MPO Pedestrian and Bicycle Safety Study COCONUT BLVD 1 AVE N SR 7 EXTENSION SOUTHERN BLVD PIERSON RD SR-7 JUPITER FARMS RD BEELINE HWY FLORIDA'S TURNPIKE PGA BLVD NORTHLAKE BLVD OKEECHOBEE BLVD LYONS RD 1-14 Bicyclist Crashes Juvenile Related (Under Age 18) I ISLAND WAY PIONEER RD PINEHURST DR HAGEN RANCH RD JOG RD HOOD RD HAVERHILL RD CENTRAL BLVD MILITARY TRAIL LANTANA RD ALT A1A 45 ST SUMMIT BLVD TEQUESTA DR CENTER ST TONEY PENNA DR FOREST HILL BLVD PURDY LN KIRK RD CONGRESS AVE 1 AVE N LAKE WORTH RD MELALEUCA LN HYPOLUXO RD PROSPERITY FARMS RD AUSTRALIAN AVE BELVEDERE RD MINER RD ELLISON WILSON RD 6 AVE S INTERSTATE 95 PARKER AVE N A ST GATEWAY BLVD OCEAN DR FEDERAL HWY/US1/SR5 OLD DIXIE HWY 36 ST 5 ST 15 ST DIXIE HWY BROADWAY FEDERAL HWY FLAGLER DR FLAGLER DR OCEAN BLVD OCEAN BLVD S COUNTY RD BOYNTON BCH BLVD SR 7/US 441 HAGEN RANCH RD WOOLBRIGHT RD GOLF RD LAKE IDA RD NE 6 AVE SEACREST BLVD ATLANTIC AVE SW 1 ST LINTON BLVD Legend n US 7/SR 5 Palm Beach Schools Low Crashes Low-Medium Crashes Medium Crashes Medium-High Crashes High Crashes LOXAHATCHEE RD BROWARD COUNTY CAIN BLVD PONDEROSA DR GLADES RD CLINT MOORE RD YAMATO RD SW 18 ST MILITARY TR FAU BLVD AIRPORT RD NW AVE PALMETTO PARK RD W CAMINO REAL SW 18 ST DIXIE HWY NE 5 AVE OCEAN BLVD
119 Appendix C Transportation Improvements Program (TIP) Projects FY 17-1
120 Map ID S1 S S3 S4 S5 S6 S7 S8 S9 S1 Top 1 Hot Spots and adjacent TIP Projects FY 17 1 TIP Funding Project Location Program Number Location Improvement Total Cost Construct 1ft Palmetto Park Rd at Local Initiatives SR 7 to NW Federal Hwy multi-use pathway Ave on the south side of $3,154,565 roadway Atlantic Avenue at NE 5 Ave/ Old Dixie Hwy Boynton Beach Blvd at Seacrest Blvd Lake Worth Rd at Congress Ave Lake Worth Rd at Davis Rd Lake Worth Rd at Jog Rd Military Trail at Forest Hill Blvd Dr. Martin Luther King Jr. Blvd at SW 5th St Okeechobee Blvd at Military Trail 45 th St at Australian Ave Major MPO Projects SIS Capacity Major Maintenance Tri-Rail Station to Atlantic I-95/SR-9 at Atlantic Ave interchange Boynton Beach from W. of Palm Isle Drive to Congress Ave Purchase Delray Beach Trolleys (replacement) Add Lanes, New SIS Connector Project $86, $13,44,61 Resurfacing $6,557, Minor Projects 15-5 Major Maintenance Transportation Alternatives Railroads Local Initiatives Minor Projects Minor Projects Lake Worth Rd at Jog Rd. Military Trail from Lake Worth Road to S. of Southern Blvd Various Belle Glade Neighborhoods SR 715 SCFC Crossing No.731H Various locations along existing bus routes (3 total) Military Trail at Adult Education Center, N. of Okeechobee Blvd Various locations along existing bus routes (3 total) Intersection Improvement $63, Resurfacing $1,68,18 Sidewalk $877, Rail Safety Project $3, Public Transportation Shelter $6, Traffic Signals $68,37 Public Transportation Shelter $6,
121 Map ID C1 C C3 C4 C5 C6 C7 C8 C9 C1 Top 1 High Crash Corridors and adjacent TIP Projects FY 17 1 TIP Funding Project Location Program Number Location Improvement Total Cost Federal Highway from Camino Real to Glades Rd Ocean Boulevard from Linton Boulevard to Thomas Street Atlantic Avenue from Military Trail to Ocean Boulevard Lantana Road from Jog Road to Military Trail Lake Worth Road from Jog Road to Lakeside Drive Military Trail from Melaleuca Lane to Community Drive Okeechobee Road from Drexel Road to Congress Avenue US 1 from Okeechobee Boulevard to 49 th Street Northlake Boulevard from Military Trail to Alt A1A Indiantown Road from Central Boulevard to Alt A1A Major MPO Projects Camino Real to Indiantown Rd New express bus service with associated multimodal corridor improvements Local Initiatives Tri-rail Station to Atlantic Ave/A1A $54,5, Delray Beach Trolleys $86, Minor Projects 15-5 Minor Projects Major Maintenance Local Initiatives Major Maintenance Minor Projects Major MPO Projects O&M Roadways Local Initiatives Lake Worth Rd at Jog Rd. Lake Worth Rd from Sherwood Forest Blvd to Military Trail Military Trail from Lake Worth Rd to S. of Southern Blvd Various locations along existing bus routes (3 total) Military Trail at Forest Hill Blvd Okeechobee Blvd. at Church St. Camino Real to Indiantown Rd Northlake Blvd from S.R. 71 to Military Trail Island Way to U.S. 1 Intersection Improvement $63, Lighting $47,81 Resurfacing $1,68,18 Public Transportation Shelter Intersection Improvement Intersection Improvement New express bus service with associated multimodal corridor improvements Safety Improvements and Resurfacing Install Adaptive Signal Technology. Install patterned pavement crosswalk improvements at signalized intersections from 67 th Road to Alt A1A. $6, $11,143,836 $,, $54,5, $1,5, $3,9,
122 LYONS RD JOG RD EL CLAIR RANCH RD SIMS RD DAVIS RD LAKE SHORE DR The Glades MUCK CITY RD OKEECHOBEE RD HATTON HWY CONNERS HWY HOOKER HIGHWAY GATOR BLVD US 7/SR 5 BACOM POINT RD S8 CR 87A BELLE GLADE RD TABIT RD BROWNS FARM RD MUCK CITY RD 5 1 Miles DUDA RD CR 88 CONNERS HWY HOOKER HIGHWAY GATOR BLVD BROWNS FARM RD CR 88 LION COUNTRY SAFARI Top 1 Hot Spots & Top 1 High Crash Corridors TIP Projects FY 17-1 MARTIN COUNTY I INDIANTOWN RD C1 SEM PRATT WHITNEY RD AERO CLUB DR TEMPLE BLVD ORANGE BLVD Palm Beach MPO Pedestrian and Bicycle Safety Study COCONUT BLVD 1 AVE N SR 7 EXTENSION SOUTHERN BLVD PIERSON RD SR-7 JUPITER FARMS RD LAKE WORTH RD BEELINE HWY FLORIDA'S TURNPIKE PGA BLVD NORTHLAKE BLVD OKEECHOBEE BLVD LYONS RD S6 HOOD RD C7 FOREST HILL BLVD PINEHURST DR ISLAND WAY PIONEER RD HAGEN RANCH RD JOG RD HAVERHILL RD C5 C4 CENTRAL BLVD C6 MILITARY TRAIL S9 S7 PURDY LN 1 AVE N LANTANA RD BOYNTON BCH BLVD TEQUESTA DR CENTER ST TONEY PENNA DR ALT A1A 45 ST MELALEUCA LN C9 CONGRESS AVE HYPOLUXO RD PROSPERITY FARMS RD S5 S4 S1 BELVEDERE RD CONGRESS AVE MINER RD ELLISON WILSON RD INTERSTATE 95 GATEWAY BLVD OCEAN DR AUSTRALIAN AVE PARKER AVE N A ST 6 AVE S FEDERAL HWY/US1/SR5 OLD DIXIE HWY DIXIE HWY BROADWAY FEDERAL HWY S3 C8 FLAGLER DR FLAGLER DR OCEAN BLVD OCEAN BLVD S COUNTY RD SR 7/US 441 HAGEN RANCH RD ATLANTIC AVE WOOLBRIGHT RD GOLF RD LAKE IDA RD C3 LINTON BLVD SEACREST BLVD SW 1 ST S C US 7/SR 5 Legend Hot Spots High Crash Corridors TIP Projects FY 17-1 LOXAHATCHEE RD BROWARD COUNTY CAIN BLVD PONDEROSA DR GLADES RD CLINT MOORE RD YAMATO RD SW 18 ST MILITARY TR FAU BLVD AIRPORT RD PALMETTO PARK RD NW AVE W CAMINO REAL SW 18 ST DIXIE HWY OCEAN BLVD S1 C1
123 Appendix D Individual Spots/Corridors
124 SR 7/US 441 JOG RD MILITARY TR FEDERAL HWY Palm Beach MPO Pedestrian and Bicycle Safety Study S1 (Palmetto Park Road at Federal Highway) Palm Beach County INDIANTOWN RD BEELINE HWY ALT A1A OCEAN DR PGA BLVD I OKEECHOBEE RD BACOM POINT RD CR 87 US 7/SR 5 CONNERS HWY HOOKER HIGHWAY GATOR BLVD CR 88 BROWNS FARM RD ORANGE BLVD OKEECHOBEE BLVD SOUTHERN BLVD FLORIDA'S TURNPIKE 57 AVE MILITARY TRAIL KIRK RD CONGRESS AVE GLADES RD 45 ST LAKE AVE INTERSTATE 95 1 ST OCEAN BLVD SW 18 ST DIXIE HWY PALMETTO PARK RD Legend Pedestrian Crash Bicyclist Crash ' Nighttime Crash Fatal Crash Hot Spot ( High Ridership Stops Palm Tran Stops.5.5 Miles
125 Palmetto Park Road at Federal Highway (S1) Palmetto Park Road at Federal Highway (S1) Year Total Average Percent Crash Type Coll. w/ Pedestrian % Coll. w/ Bicycle % Total Crashes % Severity PDO Crashes..% Fatal Crashes % Lighting Conditions Surface Conditions Month of Year Day of Week Hour of Day Injury Crashes % Daylight % Dusk..% Dawn..% Dark % Unknown..% Dry % Wet..% Others..% January..% February % March % April..% May..% June..% July..% August..% September..% October % November..% December..% Sunday % Monday % Tuesday..% Wednesday..% Thursday..% Friday..% Saturday.4 5.% :-6:..% 6:-9:..% 9:-11:..% 11:-13:..% 13:-15:..% 15:-18: % 18:-4: %
126 Palmetto Park Road at Federal Highway (S1) Crash Histograms 4 Crashes by Type Coll. w/ Pedestrian Coll. w/ Bicycle 3 1 Crashes by Severity PDO Crashes Fatal Crashes Injury Crashes Crashes by Light Condition 3 Crashes by Surface Condition 1 1 Daylight Dusk Dawn Dark Unknown Dry Wet Others Crashes by Month of Year 3 Crashes by Day of Week
127 SR 7/US 441 JOG RD MILITARY TR NE 5 AVE/OLD DIXIE SE 6 AVE Palm Beach MPO Pedestrian and Bicycle Safety Study S (Atlantic Avenue at NE 5 Avenue/Old Dixie Highway) Palm Beach County INDIANTOWN RD BEELINE HWY ALT A1A OCEAN DR PGA BLVD I OKEECHOBEE RD BACOM POINT RD CR 87 US 7/SR 5 CONNERS HWY HOOKER HIGHWAY GATOR BLVD CR 88 BROWNS FARM RD ORANGE BLVD OKEECHOBEE BLVD SOUTHERN BLVD FLORIDA'S TURNPIKE 57 AVE MILITARY TRAIL KIRK RD CONGRESS AVE GLADES RD 45 ST LAKE AVE INTERSTATE 95 1 ST OCEAN BLVD NE 6 AVE SW 18 ST ATLANTIC AVE Legend Pedestrian Crash Bicyclist Crash ' Nighttime Crash Fatal Crash Hot Spot ( High Ridership Stops Palm Tran Stops.15.5 Miles
128 Atlantic Avenue at NE 5 Avenue/Old Dixie Highway (S) Atlantic Avenue at NE 5 Avenue/Old Dixie Highway (S) Year Total Average Percent Crash Type Coll. w/ Pedestrian % Coll. w/ Bicycle % Total Crashes % Severity PDO Crashes % Fatal Crashes..% Lighting Conditions Surface Conditions Month of Year Day of Week Hour of Day Injury Crashes % Daylight % Dusk..% Dawn..% Dark % Unknown..% Dry % Wet % Others..% January..% February..% March..% April % May % June..% July % August..% September % October % November..% December % Sunday % Monday % Tuesday % Wednesday % Thursday % Friday % Saturday % :-6: % 6:-9: % 9:-11: % 11:-13: % 13:-15: % 15:-18: % 18:-4: %
129 Atlantic Avenue at NE 5 Avenue/Old Dixie Highway (S) Crash Histograms Crashes by Type Coll. w/ Pedestrian Coll. w/ Bicycle Crashes by Severity PDO Crashes Fatal Crashes Injury Crashes Crashes by Light Condition 5 Crashes by Surface Condition Daylight Dusk Dawn Dark Unknown Dry Wet Others Crashes by Month of Year Crashes by Day of Week
130 SR 7/US 441 JOG RD MILITARY TR Palm Beach MPO Pedestrian and Bicycle Safety Study S3 (Boynton Beach Boulevard at Seacrest Boulevard) Palm Beach County INDIANTOWN RD BEELINE HWY ALT A1A OCEAN DR PGA BLVD I OKEECHOBEE RD BACOM POINT RD CR 87 US 7/SR 5 CONNERS HWY HOOKER HIGHWAY GATOR BLVD CR 88 BROWNS FARM RD ORANGE BLVD OKEECHOBEE BLVD SOUTHERN BLVD FLORIDA'S TURNPIKE 57 AVE MILITARY TRAIL KIRK RD CONGRESS AVE GLADES RD 45 ST LAKE AVE INTERSTATE 95 1 ST OCEAN BLVD SW 18 ST BOYNTON BCH BLVD SEACREST BLVD OCEAN AVE Legend Pedestrian Crash Bicyclist Crash ' Nighttime Crash Fatal Crash Hot Spot ( High Ridership Stops Palm Tran Stops.5.1 Miles
131 Boynton Beach Boulevard at Seacrest Boulevard (S3) Boynton Beach Boulevard at Seacrest Boulevard (S3) Year Total Average Percent Crash Type Coll. w/ Pedestrian % Coll. w/ Bicycle % Total Crashes % Severity PDO Crashes % Fatal Crashes..% Lighting Conditions Surface Conditions Month of Year Day of Week Hour of Day Injury Crashes % Daylight % Dusk % Dawn..% Dark..% Unknown..% Dry % Wet..% Others..% January % February % March % April % May..% June..% July..% August % September..% October..% November..% December % Sunday % Monday % Tuesday % Wednesday % Thursday..% Friday.4.% Saturday % :-6:..% 6:-9:..% 9:-11: % 11:-13: % 13:-15:..% 15:-18: % 18:-4: %
132 Boynton Beach Boulevard at Seacrest Boulevard (S3) Crash Histograms Crashes by Type Coll. w/ Pedestrian Coll. w/ Bicycle Crashes by Severity PDO Crashes Fatal Crashes Injury Crashes Crashes by Light Condition 5 Crashes by Surface Condition Daylight Dusk Dawn Dark Unknown Dry Wet Others Crashes by Month of Year 3 Crashes by Day of Week
133 SR 7/US 441 JOG RD MILITARY TR Palm Beach MPO Pedestrian and Bicycle Safety Study S4 (Lake Worth Road at Congress Avenue) Palm Beach County INDIANTOWN RD BEELINE HWY ALT A1A OCEAN DR PGA BLVD I OKEECHOBEE RD BACOM POINT RD CR 87 US 7/SR 5 CONNERS HWY HOOKER HIGHWAY GATOR BLVD CR 88 BROWNS FARM RD ORANGE BLVD OKEECHOBEE BLVD SOUTHERN BLVD FLORIDA'S TURNPIKE 57 AVE MILITARY TRAIL KIRK RD CONGRESS AVE GLADES RD 45 ST LAKE AVE INTERSTATE 95 1 ST OCEAN BLVD CONGRESS AVE SW 18 ST AVE N LAKE WORTH RD Legend Pedestrian Crash Bicyclist Crash ' Nighttime Crash Fatal Crash Hot Spot ( High Ridership Stops Palm Tran Stops.5.1 Miles
134 Lake Worth Road at Congress Avenue (S4) Lake Worth Road at Congress Avenue (S4) Year Total Average Percent Crash Type Coll. w/ Pedestrian % Coll. w/ Bicycle % Total Crashes % Severity PDO Crashes..% Fatal Crashes % Lighting Conditions Surface Conditions Month of Year Day of Week Hour of Day Injury Crashes % Daylight % Dusk % Dawn..% Dark % Unknown..% Dry % Wet % Others..% January % February % March..% April..% May % June.4 9.5% July % August % September % October % November % December % Sunday % Monday % Tuesday % Wednesday % Thursday % Friday % Saturday..% :-6: % 6:-9: % 9:-11: % 11:-13: % 13:-15: % 15:-18: % 18:-4: %
135 Lake Worth Road at Congress Avenue (S4) Crash Histograms Crashes by Type Coll. w/ Pedestrian Coll. w/ Bicycle Crashes by Severity PDO Crashes Fatal Crashes Injury Crashes Crashes by Light Condition Daylight Dusk Dawn Dark Unknown Crashes by Surface Condition Dry Wet Others Crashes by Month of Year 3 Crashes by Day of Week
136 SR 7/US 441 JOG RD MILITARY TR Palm Beach MPO Pedestrian and Bicycle Safety Study S5 (Lake Worth Road at Davis Road) Palm Beach County INDIANTOWN RD BEELINE HWY ALT A1A OCEAN DR PGA BLVD I OKEECHOBEE RD BACOM POINT RD CR 87 US 7/SR 5 CONNERS HWY HOOKER HIGHWAY GATOR BLVD CR 88 BROWNS FARM RD OKEECHOBEE BLVD AVE N ORANGE BLVD SOUTHERN BLVD FLORIDA'S TURNPIKE 57 AVE MILITARY TRAIL KIRK RD GLADES RD SW 18 ST CONGRESS AVE 45 ST LAKE AVE INTERSTATE 95 1 ST OCEAN BLVD LAKE WORTH RD DAVIS RD Legend Pedestrian Crash Bicyclist Crash ' Nighttime Crash Fatal Crash Hot Spot ( High Ridership Stops Palm Tran Stops.5.5 Miles
137 Lake Worth Road at Davis Road (S5) Lake Worth Road at Davis Road (S5) Year Total Average Percent Crash Type Coll. w/ Pedestrian % Coll. w/ Bicycle % Total Crashes % Severity PDO Crashes % Fatal Crashes % Lighting Conditions Surface Conditions Month of Year Day of Week Hour of Day Injury Crashes % Daylight % Dusk..% Dawn..% Dark % Unknown..% Dry % Wet % Others..% January % February..% March % April % May % June % July..% August % September % October % November..% December % Sunday % Monday % Tuesday..% Wednesday..% Thursday % Friday % Saturday % :-6: % 6:-9: % 9:-11: % 11:-13: % 13:-15: % 15:-18: % 18:-4: %
138 Lake Worth Road at Davis Road (S5) Crash Histograms Crashes by Type Coll. w/ Pedestrian Coll. w/ Bicycle Crashes by Severity PDO Crashes Fatal Crashes Injury Crashes Crashes by Light Condition 5 Crashes by Surface Condition Daylight Dusk Dawn Dark Unknown Dry Wet Others Crashes by Month of Year 3 Crashes by Day of Week
139 SR 7/US 441 JOG RD MILITARY TR Palm Beach MPO Pedestrian and Bicycle Safety Study S6 (Lake Worth Road at Jog Road) Palm Beach County INDIANTOWN RD BEELINE HWY ALT A1A OCEAN DR PGA BLVD I OKEECHOBEE RD BACOM POINT RD CR 87 US 7/SR 5 CONNERS HWY HOOKER HIGHWAY GATOR BLVD CR 88 BROWNS FARM RD ORANGE BLVD OKEECHOBEE BLVD SOUTHERN BLVD FLORIDA'S TURNPIKE 57 AVE MILITARY TRAIL KIRK RD CONGRESS AVE GLADES RD 45 ST LAKE AVE INTERSTATE 95 1 ST OCEAN BLVD SW 18 ST LAKE WORTH RD JOG RD Legend Pedestrian Crash Bicyclist Crash ' Nighttime Crash Fatal Crash Hot Spot ( High Ridership Stops Palm Tran Stops.5.1 Miles
140 Lake Worth Road at Jog Road (S6) Year Lake Worth Road at Jog Road (S6) Total Average Percent Crash Type Coll. w/ Pedestrian % Coll. w/ Bicycle % Total Crashes % Severity PDO Crashes..% Fatal Crashes % Lighting Conditions Surface Conditions Month of Year Day of Week Hour of Day Injury Crashes % Daylight % Dusk % Dawn..% Dark % Unknown..% Dry % Wet..% Others..% January % February % March % April % May % June.4 1.5% July % August % September..% October % November..% December % Sunday % Monday.4 1.5% Tuesday % Wednesday % Thursday % Friday % Saturday % :-6: % 6:-9: % 9:-11: % 11:-13: % 13:-15: % 15:-18: % 18:-4: %
141 Lake Worth Road at Jog Road (S6) Crash Histograms Crashes by Type Coll. w/ Pedestrian Coll. w/ Bicycle Crashes by Severity PDO Crashes Fatal Crashes Injury Crashes Crashes by Light Condition 5 Crashes by Surface Condition Daylight Dusk Dawn Dark Unknown Dry Wet Others Crashes by Month of Year 3 Crashes by Day of Week
142 SR 7/US 441 JOG RD MILITARY TR MILITARY TR Palm Beach MPO Pedestrian and Bicycle Safety Study S7 (Military Trail at Forest Hill Boulevard) Palm Beach County INDIANTOWN RD BEELINE HWY ALT A1A OCEAN DR PGA BLVD I OKEECHOBEE RD BACOM POINT RD CR 87 US 7/SR 5 CONNERS HWY HOOKER HIGHWAY GATOR BLVD CR 88 BROWNS FARM RD ORANGE BLVD OKEECHOBEE BLVD SOUTHERN BLVD FLORIDA'S TURNPIKE 57 AVE MILITARY TRAIL KIRK RD CONGRESS AVE GLADES RD 45 ST LAKE AVE INTERSTATE 95 1 ST OCEAN BLVD SW 18 ST FOREST HILL BLVD Legend Pedestrian Crash Bicyclist Crash ' Nighttime Crash Fatal Crash Hot Spot ( High Ridership Stops Palm Tran Stops.15.5 Miles
143 Military Trail at Forest Hill Boulevard (S7) Military Trail at Forest Hill Boulevard (S7) Year Total Average Percent Crash Type Coll. w/ Pedestrian % Coll. w/ Bicycle % Total Crashes % Severity PDO Crashes % Fatal Crashes..% Lighting Conditions Surface Conditions Month of Year Day of Week Hour of Day Injury Crashes % Daylight % Dusk..% Dawn % Dark % Unknown..% Dry % Wet % Others..% January % February..% March % April % May % June % July % August..% September % October % November % December % Sunday % Monday % Tuesday % Wednesday % Thursday % Friday..% Saturday % :-6: % 6:-9: % 9:-11: % 11:-13: % 13:-15: % 15:-18:.4 8.7% 18:-4: %
144 Military Trail at Forest Hill Boulevard (S7) Crash Histograms Crashes by Type Coll. w/ Pedestrian Coll. w/ Bicycle Crashes by Severity PDO Crashes Fatal Crashes Injury Crashes Crashes by Light Condition 7 Crashes by Surface Condition Daylight Dusk Dawn Dark Unknown Dry Wet Others Crashes by Month of Year 4 Crashes by Day of Week
145 SR 7/US 441 JOG RD MILITARY TR SW 5 ST Palm Beach MPO Pedestrian and Bicycle Safety Study S8 (Dr Martin Luther King Jr Boulevard at SW 5 Street) Palm Beach County INDIANTOWN RD BEELINE HWY ALT A1A OCEAN DR PGA BLVD I OKEECHOBEE RD BACOM POINT RD CR 87 US 7/SR 5 CONNERS HWY HOOKER HIGHWAY GATOR BLVD CR 88 BROWNS FARM RD ORANGE BLVD OKEECHOBEE BLVD SOUTHERN BLVD FLORIDA'S TURNPIKE 57 AVE MILITARY TRAIL KIRK RD CONGRESS AVE GLADES RD 45 ST LAKE AVE INTERSTATE 95 1 ST OCEAN BLVD SW 18 ST DR M L KING JR BLVD Legend Pedestrian Crash Bicyclist Crash ' Nighttime Crash Fatal Crash Hot Spot ( High Ridership Stops Palm Tran Stops.5.5 Miles
146 Dr Martin Luther King Jr Boulevard at SW 5 Street (S8) Dr Martin Luther King Jr Boulevard at SW 5 Street (S8) Year Total Average Percent Crash Type Coll. w/ Pedestrian % Coll. w/ Bicycle..% Total Crashes % Severity PDO Crashes..% Fatal Crashes..% Lighting Conditions Surface Conditions Month of Year Day of Week Hour of Day Injury Crashes % Daylight % Dusk..% Dawn..% Dark % Unknown..% Dry % Wet % Others..% January % February % March % April % May..% June..% July.4 5.% August..% September % October..% November % December..% Sunday % Monday % Tuesday % Wednesday..% Thursday % Friday % Saturday % :-6: % 6:-9: % 9:-11: % 11:-13:..% 13:-15: % 15:-18: % 18:-4: %
147 Dr Martin Luther King Jr Boulevard at SW 5 Street (S8) Crash Histograms Crashes by Type Coll. w/ Pedestrian Coll. w/ Bicycle Crashes by Severity PDO Crashes Fatal Crashes Injury Crashes Crashes by Light Condition 4 Crashes by Surface Condition Daylight Dusk Dawn Dark Unknown Dry Wet Others Crashes by Month of Year Crashes by Day of Week
148 SR 7/US 441 JOG RD MILITARY TR Palm Beach MPO Pedestrian and Bicycle Safety Study S9 (Okeechobee Boulevard at Military Trail) Palm Beach County INDIANTOWN RD BEELINE HWY ALT A1A OCEAN DR PGA BLVD I OKEECHOBEE RD BACOM POINT RD CR 87 US 7/SR 5 CONNERS HWY HOOKER HIGHWAY GATOR BLVD CR 88 BROWNS FARM RD ORANGE BLVD OKEECHOBEE BLVD SOUTHERN BLVD FLORIDA'S TURNPIKE 57 AVE MILITARY TRAIL KIRK RD CONGRESS AVE GLADES RD 45 ST LAKE AVE INTERSTATE 95 1 ST OCEAN BLVD SW 18 ST OKEECHOBEE BLVD MILITARY TRAIL Legend Pedestrian Crash Bicyclist Crash ' Nighttime Crash Fatal Crash Hot Spot ( High Ridership Stops Palm Tran Stops.15.5 Miles
149 Okeechobee Boulevard at Military Trail (S9) Okeechobee Boulevard at Military Trail (S9) Year Total Average Percent Crash Type Coll. w/ Pedestrian % Coll. w/ Bicycle % Total Crashes % Severity PDO Crashes..% Fatal Crashes % Lighting Conditions Surface Conditions Month of Year Day of Week Hour of Day Injury Crashes % Daylight % Dusk % Dawn..% Dark % Unknown..% Dry % Wet % Others..% January % February % March % April % May % June % July..% August % September % October % November % December..% Sunday % Monday..% Tuesday % Wednesday % Thursday..% Friday % Saturday % :-6: % 6:-9: % 9:-11: % 11:-13: % 13:-15: % 15:-18: % 18:-4: %
150 Okeechobee Boulevard at Military Trail (S9) Crash Histograms Crashes by Type Coll. w/ Pedestrian Coll. w/ Bicycle Crashes by Severity PDO Crashes Fatal Crashes Injury Crashes Crashes by Light Condition Daylight Dusk Dawn Dark Unknown Crashes by Surface Condition Dry Wet Others Crashes by Month of Year 3 Crashes by Day of Week
151 SR 7/US 441 JOG RD MILITARY TR Palm Beach MPO Pedestrian and Bicycle Safety Study S1 (45 Street at Australian Avenue) Palm Beach County INDIANTOWN RD BEELINE HWY ALT A1A OCEAN DR PGA BLVD I OKEECHOBEE RD BACOM POINT RD CR 87 US 7/SR 5 CONNERS HWY HOOKER HIGHWAY GATOR BLVD CR 88 BROWNS FARM RD ORANGE BLVD OKEECHOBEE BLVD SOUTHERN BLVD FLORIDA'S TURNPIKE 57 AVE MILITARY TRAIL KIRK RD GLADES RD SW 18 ST CONGRESS AVE 45 ST LAKE AVE INTERSTATE 95 1 ST OCEAN BLVD AUSTRALIAN AVE 45 ST Legend Pedestrian Crash Bicyclist Crash ' Nighttime Crash Fatal Crash Hot Spot ( High Ridership Stops Palm Tran Stops.5.5 Miles
152 45 Street at Australian Avenue (S1) 45 Street at Australian Avenue (S1) Year Total Average Percent Crash Type Coll. w/ Pedestrian % Coll. w/ Bicycle 1 1..% Total Crashes % Severity PDO Crashes..% Fatal Crashes 1 1..% Lighting Conditions Surface Conditions Month of Year Day of Week Hour of Day Injury Crashes % Daylight % Dusk..% Dawn..% Dark % Unknown..% Dry % Wet..% Others..% January 1 1..% February..% March 1 1..% April..% May 1 1..% June..% July..% August 1 1..% September..% October..% November..% December 1 1..% Sunday..% Monday % Tuesday..% Wednesday..% Thursday 1 1..% Friday..% Saturday.4 4.% :-6:..% 6:-9:..% 9:-11:..% 11:-13:..% 13:-15: 1 1..% 15:-18:..% 18:-4: %
153 45 Street at Australian Avenue (S1) Crash Histograms 6 4 Crashes by Type Coll. w/ Pedestrian Coll. w/ Bicycle 3 1 Crashes by Severity PDO Crashes Fatal Crashes Injury Crashes Crashes by Light Condition 3 Crashes by Surface Condition 1 1 Daylight Dusk Dawn Dark Unknown Dry Wet Others Crashes by Month of Year 3 Crashes by Day of Week
154 SW 4 AVE SR 7/US 441 JOG RD MILITARY TR MIZNER BLVD NE 5 AVE Palm Beach MPO Pedestrian and Bicycle Safety Study C1 (Federal Highway from Camino Real to Glades Road) Palm Beach County INDIANTOWN RD BEELINE HWY ALT A1A OCEAN DR PGA BLVD GLADES RD OKEECHOBEE RD BACOM POINT RD CR 87 US 7/SR 5 CONNERS HWY HOOKER HIGHWAY GATOR BLVD NW 4 AVE CR 88 BROWNS FARM RD ORANGE BLVD OKEECHOBEE BLVD SOUTHERN BLVD FLORIDA'S TURNPIKE NW AVE 57 AVE MILITARY TRAIL KIRK RD CONGRESS AVE GLADES RD 45 ST LAKE AVE INTERSTATE 95 1 ST OCEAN BLVD DIXIE HWY I SW 18 ST FEDERAL HWY PALMETTO PARK RD Legend Pedestrian Crash Bicyclist Crash ' Nighttime Crash Fatal Crash High Crash Corridor ( High Ridership Stops Palm Tran Stops W CAMINO REAL CAMINO REAL.15.5 Miles
155 Federal Highway from Camino Real to Glades Road (C1) Federal Highway from Camino Real to Glades Road (C1) Year Total Average Percent Crash Type Coll. w/ Pedestrian % Coll. w/ Bicycle % Total Crashes % Severity PDO Crashes % Fatal Crashes % Lighting Conditions Surface Conditions Month of Year Day of Week Hour of Day Injury Crashes % Daylight % Dusk..% Dawn..% Dark % Unknown..% Dry % Wet % Others..% January 4.8.% February % March % April % May % June..% July..% August % September..% October % November..% December % Sunday % Monday 4.8.% Tuesday % Wednesday.4 1.% Thursday % Friday % Saturday % :-6: % 6:-9:.4 1.% 9:-11:.4 1.% 11:-13:..% 13:-15: % 15:-18: % 18:-4: %
156 Federal Highway from Camino Real to Glades Road (C1) Crash Histograms Crashes by Type Coll. w/ Pedestrian Coll. w/ Bicycle Crashes by Severity PDO Crashes Fatal Crashes Injury Crashes Crashes by Light Condition 7 Crashes by Surface Condition Daylight Dusk Dawn Dark Unknown Dry Wet Others Crashes by Month of Year 4 Crashes by Day of Week
157 SR 7/US 441 JOG RD MILITARY TR Palm Beach MPO Pedestrian and Bicycle Safety Study C (Ocean Boulevard from Linton Boulevard to Thomas Street) Palm Beach County NE 4 ST INDIANTOWN RD BEELINE HWY ALT A1A OCEAN DR PGA BLVD I OKEECHOBEE RD BACOM POINT RD CR 87 US 7/SR 5 CONNERS HWY HOOKER HIGHWAY GATOR BLVD CR 88 BROWNS FARM RD ATLANTIC AVE NE 1 ST ORANGE BLVD OKEECHOBEE BLVD SOUTHERN BLVD FLORIDA'S TURNPIKE NE 5 AVE/OLD DIXIE 57 AVE MILITARY TRAIL GLADES RD NE 6 AVE KIRK RD SW 18 ST CONGRESS AVE 45 ST INTERSTATE 95 1 ST LAKE AVE OCEAN BLVD ATLANTIC AVE SWINTON AVE SE 1 ST SE 6 AVE SW 1 ST SE 1 ST OCEAN BLVD Legend DIXIE HWY Pedestrian Crash Bicyclist Crash ' Nighttime Crash Fatal Crash LINTON BLVD High Crash Corridor ( High Ridership Stops Palm Tran Stops FEDERAL HWY.5.5 Miles
158 Ocean Boulevard from Linton Boulevard to Thomas Street (C) Ocean Boulevard from Linton Boulevard to Thomas Street (C) Year Total Average Percent Crash Type Coll. w/ Pedestrian % Coll. w/ Bicycle % Total Crashes % Severity PDO Crashes % Fatal Crashes..% Lighting Conditions Surface Conditions Month of Year Day of Week Hour of Day Injury Crashes % Daylight % Dusk..% Dawn..% Dark % Unknown..% Dry % Wet % Others..% January % February % March % April % May % June % July % August % September % October % November % December % Sunday % Monday % Tuesday % Wednesday % Thursday % Friday % Saturday % :-6: % 6:-9: % 9:-11: % 11:-13: % 13:-15: % 15:-18: % 18:-4: %
159 Ocean Boulevard from Linton Boulevard to Thomas Street (C) Crash Histograms Crashes by Type Coll. w/ Pedestrian Coll. w/ Bicycle Crashes by Severity PDO Crashes Fatal Crashes Injury Crashes Crashes by Light Condition Daylight Dusk Dawn Dark Unknown Crashes by Surface Condition Dry Wet Others Crashes by Month of Year 5 Crashes by Day of Week
160 SR 7/US 441 HOMEWOOD BLVD JOG RD MILITARY TR SE 6 AVE Palm Beach MPO Pedestrian and Bicycle Safety Study C3 (Atlantic Avenue from Military Trail to Ocean Boulevard) Palm Beach County OKEECHOBEE RD COCONUT LN BACOM POINT RD CR 87 US 7/SR 5 BARWICK RD CONNERS HWY HOOKER HIGHWAY GATOR BLVD CR 88 BROWNS FARM RD INDIANTOWN RD ORANGE BLVD BEELINE HWY OKEECHOBEE BLVD SOUTHERN BLVD FLORIDA'S TURNPIKE 57 AVE MILITARY TRAIL ALT A1A GLADES RD PGA BLVD KIRK RD CONGRESS AVE INTERSTATE 95 OCEAN BLVD OCEAN DR 1 ST 45 ST LAKE AVE INTERSTATE 95 SWINTON AVE SEACREST BLVD NE AVE FEDERAL HWY I SW 18 ST LAKE IDA RD GEORGE BUSH BLVD NE 4 ST NE 5 AVE/OLD DIXIE NE 1 ST ATLANTIC AVE ATLANTIC AVE SWINTON AVE SE 1 ST LOWSON BLVD SW 1 ST SW 1 AVE SE 1 ST LINTON BLVD LINTON BLVD MILITARY TR Legend Pedestrian Crash High Crash Corridor CONGRESS AVE DIXIE HWY Bicyclist Crash ' Nighttime Crash Fatal Crash ( High Ridership Stops Palm Tran Stops BRANT DR FEDERAL HWY OCEAN BLVD.5 1 Miles
161 Atlantic Avenue from Military Trail to Ocean Boulevard (C3) Atlantic Avenue from Military Trail to Ocean Boulevard (C3) Year Total Average Percent Crash Type Coll. w/ Pedestrian % Coll. w/ Bicycle % Total Crashes % Severity PDO Crashes % Fatal Crashes..% Lighting Conditions Surface Conditions Month of Year Day of Week Hour of Day Injury Crashes % Daylight % Dusk % Dawn % Dark % Unknown..% Dry % Wet % Others..% January % February % March % April % May % June % July % August % September % October % November % December % Sunday % Monday % Tuesday % Wednesday % Thursday % Friday % Saturday % :-6: % 6:-9: % 9:-11: % 11:-13: % 13:-15: % 15:-18: % 18:-4: %
162 Atlantic Avenue from Military Trail to Ocean Boulevard (C3) Crash Histograms Crashes by Type Coll. w/ Pedestrian Coll. w/ Bicycle Crashes by Severity PDO Crashes Fatal Crashes Injury Crashes Crashes by Light Condition Daylight Dusk Dawn Dark Unknown Crashes by Surface Condition Dry Wet Others Crashes by Month of Year Crashes by Day of Week
163 JOG RD SR 7/US 441 JOG RD MILITARY TR Palm Beach MPO Pedestrian and Bicycle Safety Study C4 (Lantana Road from Jog Road to Military Trail) Palm Beach County INDIANTOWN RD BEELINE HWY ALT A1A OCEAN DR PGA BLVD MELALEUCA LN OKEECHOBEE RD BACOM POINT RD CR 87 US 7/SR 5 CONNERS HWY HOOKER HIGHWAY GATOR BLVD CR 88 BROWNS FARM RD ORANGE BLVD OKEECHOBEE BLVD SOUTHERN BLVD FLORIDA'S TURNPIKE 57 AVE MILITARY TRAIL KIRK RD GLADES RD SW 18 ST CONGRESS AVE 45 ST INTERSTATE 95 1 ST LAKE AVE OCEAN BLVD HAVERHILL RD I MILITARY TR LANTANA RD Legend Pedestrian Crash Bicyclist Crash ' Nighttime Crash Fatal Crash High Crash Corridor ( High Ridership Stops Palm Tran Stops HYPOLUXO RD.5.5 Miles
164 Lantana Road from Jog Road to Military Trail (C4) Lantana Road from Jog Road to Military Trail (C4) Year Total Average Percent Crash Type Coll. w/ Pedestrian % Coll. w/ Bicycle % Total Crashes % Severity PDO Crashes % Fatal Crashes..% Lighting Conditions Surface Conditions Month of Year Day of Week Hour of Day Injury Crashes % Daylight % Dusk % Dawn..% Dark % Unknown..% Dry % Wet % Others..% January..% February..% March % April % May % June % July % August % September % October.4 6.7% November % December % Sunday % Monday % Tuesday % Wednesday % Thursday % Friday % Saturday % :-6: % 6:-9: % 9:-11: % 11:-13: % 13:-15: % 15:-18: % 18:-4: %
165 Lantana Road from Jog Road to Military Trail (C4) Crash Histograms Crashes by Type Coll. w/ Pedestrian Coll. w/ Bicycle Crashes by Severity PDO Crashes Fatal Crashes Injury Crashes Crashes by Light Condition Crashes by Surface Condition Daylight Dusk Dawn Dark Unknown Dry Wet Others Crashes by Month of Year 5 Crashes by Day of Week
166 SR 7/US 441 JOG RD MILITARY TR Palm Beach MPO Pedestrian and Bicycle Safety Study C5 (Lake Worth Road from Jog Road to Lakeside Drive) Palm Beach County OKEECHOBEE RD JOG RD BACOM POINT RD CR 87 US 7/SR 5 SHERWOOD FOREST BLVD CONNERS HWY HOOKER HIGHWAY GATOR BLVD 57 AVE CR 88 BROWNS FARM RD SUMMIT BLVD CRESTHAVEN BLVD INDIANTOWN RD ORANGE BLVD PURDY LN HAVERHILL RD BEELINE HWY OKEECHOBEE BLVD SOUTHERN BLVD FLORIDA'S TURNPIKE 57 AVE MILITARY TRAIL ALT A1A GLADES RD PGA BLVD KIRK RD SW 18 ST FOREST HILL BLVD CONGRESS AVE INTERSTATE 95 OCEAN BLVD BOWMAN ST OCEAN DR 1 ST 45 ST LAKE AVE PARK LN MILITARY TR KIRK RD LAKEWOOD RD MELALEUCA LN DAVIS RD DAVIS RD ALEMEDA DR 1 AVE N CONGRESS AVE FLORIDA MANGO RD AVE N LAKE WORTH RD BOUTWELL RD PARKER AVE N A ST LAKE AVE N D ST S A ST S D ST GEORGIA AVE MADDOCK ST AVE N DIXIE HWY 7 AVE N LUCERNE AVE 6 AVE S I S OLIVE AVE FEDERAL HWY WELLESLEY DR LAKESIDE DR FLAGLER DR LANTANA RD HIGH RIDGE RD 1 AVE S S LAKESIDE DR Legend Pedestrian Crash Bicyclist Crash ' Nighttime Crash Fatal Crash High Crash Corridor ( High Ridership Stops HYPOLUXO RD Palm Tran Stops LAWRENCE RD INTERSTATE 95 OVERLOOK DR BROADWAY OCEAN AVE.5 1 Miles
167 Lake Worth Road from Jog Road to Lakeside Drive (C5) Lake Worth Road from Jog Road to Lakeside Drive (C5) Year Total Average Percent Crash Type Coll. w/ Pedestrian % Coll. w/ Bicycle % Total Crashes % Severity PDO Crashes % Fatal Crashes % Lighting Conditions Surface Conditions Month of Year Day of Week Hour of Day Injury Crashes % Daylight % Dusk % Dawn..% Dark % Unknown..% Dry % Wet % Others..% January..% February..% March % April % May % June % July % August % September % October.4 6.7% November % December % Sunday % Monday % Tuesday % Wednesday % Thursday % Friday % Saturday % :-6: % 6:-9: % 9:-11: % 11:-13: % 13:-15: % 15:-18: % 18:-4: %
168 Lake Worth Road from Jog Road to Lakeside Drive (C5) Crash Histograms Crashes by Type Coll. w/ Pedestrian Coll. w/ Bicycle Crashes by Severity PDO Crashes Fatal Crashes Injury Crashes Crashes by Light Condition Daylight Dusk Dawn Dark Unknown Crashes by Surface Condition Dry Wet Others Crashes by Month of Year 5 Crashes by Day of Week
169 PIKE RD SR 7/US 441 JOG RD MILITARY TR Palm Beach MPO Pedestrian and Bicycle Safety Study C6 (Military Trail from Melaleuca Lane to Community Drive) Palm Beach County OKEECHOBEE RD OKEECHOBEE BLVD BACOM POINT RD CR 87 BELVEDERE RD SOUTHERN BLVD SKEES RD US 7/SR 5 CONNERS HWY HOOKER HIGHWAY GATOR BLVD PIONEER RD CR 88 BROWNS FARM RD FLORIDA'S TURNPIKE INDIANTOWN RD ORANGE BLVD BEELINE HWY OKEECHOBEE BLVD SOUTHERN BLVD FLORIDA'S TURNPIKE DREXEL RD 57 AVE MILITARY TRAIL ALT A1A GLADES RD PGA BLVD KIRK RD SW 18 ST CONGRESS AVE INTERSTATE 95 OCEAN BLVD OCEAN DR 1 ST 45 ST LAKE AVE HAVERHILL RD SUMMIT BLVD COMMUNITY DR MILITARY TRAIL GUN CLUB RD PALM BCH LAKES BLVD WESTGATE AVE CONGRESS AVE MP ON RT CHURCH ST GEM LAKE DR AUSTRALIAN AVE MERCER AVE I BELVEDERE FROM I-95 TAMARIND AVE PARKER AVE LAKE AVE JOG RD DAVIS RD FOREST HILL BLVD Legend Pedestrian Crash Bicyclist Crash ' Nighttime Crash Fatal Crash PINEHURST DR SHERWOOD FOREST BLVD 57 AVE High Crash Corridor ( High Ridership Stops Palm Tran Stops PURDY LN CRESTHAVEN BLVD MILITARY TR PARK LN KIRK RD LAKEWOOD RD MELALEUCA LN ALEMEDA DR DAVIS RD 1 AVE N CONGRESS AVE FLORIDA MANGO RD AVE N LAKE WORTH RD BOUTWELL RD INTERSTATE 95 N A ST S A ST 6 AVE S N D ST S D ST.5 1 Miles
170 Military Trail from Melaleuca Lane to Community Drive (C6) Military Trail from Melaleuca Lane to Community Drive (C6) Year Total Average Percent Crash Type Coll. w/ Pedestrian % Coll. w/ Bicycle % Total Crashes % Severity PDO Crashes % Fatal Crashes % Lighting Conditions Surface Conditions Month of Year Day of Week Hour of Day Injury Crashes % Daylight % Dusk % Dawn % Dark % Unknown..% Dry % Wet % Others..% January % February % March % April % May % June % July % August % September % October % November % December % Sunday % Monday % Tuesday % Wednesday % Thursday % Friday % Saturday % :-6: % 6:-9: % 9:-11: % 11:-13: % 13:-15: % 15:-18: % 18:-4: %
171 Military Trail from Melaleuca Lane to Community Drive (C6) Crash Histograms Crashes by Type Coll. w/ Pedestrian Coll. w/ Bicycle Crashes by Severity PDO Crashes Fatal Crashes Injury Crashes Crashes by Light Condition Daylight Dusk Dawn Dark Unknown Crashes by Surface Condition Dry Wet Others Crashes by Month of Year Crashes by Day of Week
172 SR 7/US 441 JOG RD MILITARY TR Palm Beach MPO Pedestrian and Bicycle Safety Study C7 (Okeechobee Road from Drexel Road to Congress Avenue) Palm Beach County FLORIDA'S TURNPIKE OKEECHOBEE RD BACOM POINT RD CR 87 US 7/SR 5 CONNERS HWY HOOKER HIGHWAY GATOR BLVD CR 88 BROWNS FARM RD INDIANTOWN RD ORANGE BLVD BEELINE HWY OKEECHOBEE BLVD SOUTHERN BLVD FLORIDA'S TURNPIKE 57 AVE MILITARY TRAIL ALT A1A GLADES RD PGA BLVD KIRK RD SW 18 ST CONGRESS AVE 45 ST INTERSTATE 95 OCEAN BLVD OCEAN DR 1 ST LAKE AVE HAVERHILL RD COMMUNITY DR VILLAGE BLVD I OKEECHOBEE BLVD ELMHURST RD WESTGATE AVE WABASSO DR DREXEL RD MILITARY TRAIL Legend BELVEDERE RD Pedestrian Crash Bicyclist Crash ' Nighttime Crash Fatal Crash High Crash Corridor ( High Ridership Stops Palm Tran Stops.5.5 Miles
173 Okeechobee Road from Drexel Road to Congress Avenue (C7) Okeechobee Road from Drexel Road to Congress Avenue (C7) Year Total Average Percent Crash Type Coll. w/ Pedestrian % Coll. w/ Bicycle % Total Crashes % Severity PDO Crashes % Fatal Crashes % Lighting Conditions Surface Conditions Month of Year Day of Week Hour of Day Injury Crashes % Daylight % Dusk % Dawn..% Dark % Unknown..% Dry % Wet % Others..% January % February % March % April % May % June % July % August % September % October % November % December % Sunday % Monday % Tuesday % Wednesday % Thursday % Friday % Saturday % :-6: % 6:-9: % 9:-11: % 11:-13: % 13:-15: % 15:-18: % 18:-4: %
174 Okeechobee Road from Drexel Road to Congress Avenue (C7) Crash Histograms Crashes by Type Coll. w/ Pedestrian Coll. w/ Bicycle Crashes by Severity PDO Crashes Fatal Crashes Injury Crashes Crashes by Light Condition Crashes by Surface Condition Daylight Dusk Dawn Dark Unknown Dry Wet Others Crashes by Month of Year 5 Crashes by Day of Week
175 SR 7/US 441 JOG RD MILITARY TR Palm Beach MPO Pedestrian and Bicycle Safety Study C8 (US 1 from Okeechobee Boulevard to 45 Street) CONGRESS AVE Palm Beach County OKEECHOBEE RD Legend BACOM POINT RD CR 87 US 7/SR 5 45 ST PALM BCH LAKES BLVD INTERSTATE 95 CONNERS HWY HOOKER HIGHWAY GATOR BLVD Pedestrian Crash Bicyclist Crash ' Nighttime Crash Fatal Crash OKEECHOBEE BLVD CR 88 BROWNS FARM RD INDIANTOWN RD ORANGE BLVD BEELINE HWY OKEECHOBEE BLVD SOUTHERN BLVD AUSTRALIAN AVE FLORIDA'S TURNPIKE 57 AVE MILITARY TRAIL ALT A1A GLADES RD SW 18 ST High Crash Corridor ( High Ridership Stops Palm Tran Stops PGA BLVD KIRK RD CONGRESS AVE INTERSTATE 95 OCEAN BLVD OCEAN DR 1 ST 45 ST LAKE AVE 5 ST TAMARIND AVE 36 ST 15 ST BROADWAY AVE 4 ST BANYAN BLVD CLEMATIS ST QUADRILLE BLVD S DIXIE HWY POINSETTA AVE FLAGLER DR N DIXIE HWY N DIXIE HWY N OLIVE AVE S OLIVE AVE FLAGLER DR LAKEVIEW AVE COCOANUT ROW BRADLEY PL SLOPE TERR ROYAL POINCIANA WAY N COUNTY RD S COUNTY RD OCEAN BLVD I.5.5 Miles
176 US 1 from Okeechobee Boulevard to 45 Street (C8) US 1 from Okeechobee Boulevard to 45 Street (C8) Year Total Average Percent Crash Type Coll. w/ Pedestrian % Coll. w/ Bicycle % Total Crashes % Severity PDO Crashes..% Fatal Crashes..% Lighting Conditions Surface Conditions Month of Year Day of Week Hour of Day Injury Crashes % Daylight % Dusk..% Dawn..% Dark % Unknown..% Dry % Wet % Others..% January % February % March % April.4 3.9% May.4 3.9% June % July % August % September % October % November % December % Sunday % Monday % Tuesday % Wednesday % Thursday % Friday % Saturday % :-6: % 6:-9: % 9:-11: % 11:-13: % 13:-15: % 15:-18: % 18:-4: %
177 US 1 from Okeechobee Boulevard to 45 Street (C8) Crash Histograms Crashes by Type Coll. w/ Pedestrian Coll. w/ Bicycle Crashes by Severity PDO Crashes Fatal Crashes Injury Crashes Crashes by Light Condition Crashes by Surface Condition Daylight Dusk Dawn Dark Unknown Dry Wet Others Crashes by Month of Year 5 Crashes by Day of Week
178 SR 7/US 441 JOG RD MILITARY TR Palm Beach MPO Pedestrian and Bicycle Safety Study C9 (Northlake Boulevard from Military Trail to Alt A1A) MILITARY TRAIL Palm Beach County OKEECHOBEE RD BACOM POINT RD HOLLY DR CR 87 US 7/SR 5 CONNERS HWY HOOKER HIGHWAY GATOR BLVD CR 88 BROWNS FARM RD INDIANTOWN RD ORANGE BLVD BEELINE HWY OKEECHOBEE BLVD SOUTHERN BLVD FLORIDA'S TURNPIKE 57 AVE MILITARY TRAIL ALT A1A GLADES RD PGA BLVD KIRK RD SW 18 ST CONGRESS AVE INTERSTATE 95 OCEAN BLVD OCEAN DR 1 ST 45 ST LAKE AVE LIGHTHOUSE BLVD GARDEN BLVD ALT A1A LIGHTHOUSE DR I INTERSTATE 95 NB ON FR NORTH LAKE MACARTHUR BLVD NB I-95 TO SR 85 NORTHLAKE BLVD OLD DIXIE HWY 1 ST WATERTOWER RD Legend INVESTMENT LANE Pedestrian Crash Bicyclist Crash ' Nighttime Crash Fatal Crash High Crash Corridor ( High Ridership Stops Palm Tran Stops GARDEN RD INVESTMENT LANE CONGRESS AVE SILVER BEACH RD.5.5 Miles
179 Northlake Boulevard from Military Trail to Alt A1A (C9) Northlake Boulevard from Military Trail to Alt A1A (C9) Year Total Average Percent Crash Type Coll. w/ Pedestrian % Coll. w/ Bicycle % Total Crashes % Severity PDO Crashes % Fatal Crashes % Lighting Conditions Surface Conditions Month of Year Day of Week Hour of Day Injury Crashes % Daylight % Dusk..% Dawn..% Dark % Unknown..% Dry % Wet.4 6.9% Others..% January % February % March % April..% May % June % July % August % September % October % November % December % Sunday % Monday % Tuesday % Wednesday % Thursday % Friday % Saturday % :-6: % 6:-9:.4 6.9% 9:-11: % 11:-13: % 13:-15: % 15:-18: % 18:-4: %
180 Northlake Boulevard from Military Trail to Alt A1A (C9) Crash Histograms Crashes by Type Coll. w/ Pedestrian Coll. w/ Bicycle Crashes by Severity PDO Crashes Fatal Crashes Injury Crashes Crashes by Light Condition Daylight Dusk Dawn Dark Unknown Crashes by Surface Condition Dry Wet Others Crashes by Month of Year 4 Crashes by Day of Week
181 LOXAHATCHEE RIVER RD SR 7/US 441 JOG RD MILITARY TR Palm Beach MPO Pedestrian and Bicycle Safety Study C1 (Indiantown Road from Central Boulevard to Alt A1A) Palm Beach County INDIANTOWN RD BEELINE HWY ALT A1A OCEAN DR PGA BLVD I OKEECHOBEE RD BACOM POINT RD CR 87 US 7/SR 5 CONNERS HWY HOOKER HIGHWAY GATOR BLVD CR 88 ROEBUCK RD BROWNS FARM RD ORANGE BLVD OKEECHOBEE BLVD SOUTHERN BLVD FLORIDA'S TURNPIKE 57 AVE MILITARY TRAIL KIRK RD CONGRESS AVE GLADES RD 45 ST INTERSTATE 95 1 ST LAKE AVE OCEAN BLVD SW 18 ST CENTER ST CENTRAL BLVD MAPLEWOOD DR INDIANTOWN RD TONEY PENNA DR Legend Pedestrian Crash Bicyclist Crash ' Nighttime Crash Fatal Crash High Crash Corridor ( High Ridership Stops Palm Tran Stops INDIAN CREEK BLVD MILITARY TRAIL ALT A1A.5.5 Miles
182 Indiantown Road from Central Boulevard to Alt A1A (C1) Indiantown Road from Central Boulevard to Alt A1A (C1) Year Total Average Percent Crash Type Coll. w/ Pedestrian % Coll. w/ Bicycle % Total Crashes % Severity PDO Crashes % Fatal Crashes % Lighting Conditions Surface Conditions Month of Year Day of Week Hour of Day Injury Crashes % Daylight % Dusk % Dawn..% Dark % Unknown % Dry % Wet % Others..% January % February % March % April % May % June % July % August % September % October % November % December % Sunday % Monday % Tuesday % Wednesday % Thursday % Friday % Saturday % :-6: % 6:-9: % 9:-11: % 11:-13: % 13:-15: % 15:-18: % 18:-4: %
183 Indiantown Road from Central Boulevard to Alt A1A (C1) Crash Histograms Crashes by Type Coll. w/ Pedestrian Coll. w/ Bicycle Crashes by Severity PDO Crashes Fatal Crashes Injury Crashes Crashes by Light Condition Daylight Dusk Dawn Dark Unknown Crashes by Surface Condition Dry Wet Others Crashes by Month of Year Crashes by Day of Week
184 Appendix E Lighting and Illumination
185 Florida Department of Transportation (FDOT) Intersection Lighting Retrofits for Pedestrians BLUF (Bottom Line Up-Front): FDOT Vision: Fatality Free Transportation System. $ Million/year spent over the next five years for targeted State Highway System (SHS) Intersection Lighting Retrofits can save approximately $4 Billion (Net Present Value) over the next years in societal costs related to pedestrian fatality and injury crashes. This is a recurring benefit that will continue to reduce pedestrian crashes on the SHS well beyond the typical year life cycle. Motor vehicle (and other user) crashes will also be reduced by this effort, but those benefits were not quantified in this study. Purpose and Need: FDOT is an FHWA focus state for both Intersection Safety and Bicycle and Pedestrian Safety. These priority areas will benefit from this Lighting Initiative. In 13, Florida had the nd highest per capita Pedestrian Fatality Rate (Governors Highway Safety Association Report). Most pedestrian crashes occur at urban intersections, the majority (78%) of which happen at night between the hours 6 pm and 6 am. As a result, a Joint State Roadway Design Office and State Safety Office Team has been evaluating cost-effective solutions to increase safety at those signalized intersections having the greatest risk of night-time pedestrian crashes. "Installing street lighting can reduce late-night/early-morning crashes at intersections by a weighted average of 35%" FHWA Website To target intersections with the highest number of crashes, the Central Office (CO) worked with the Districts to address the Top intersections statewide. These intersections were ranked based on their total number of pedestrian night-time crashes. The number of crashes ranged from 6 to 11 crashes per intersection over a five year period between 9 and 13. Central office staff, partnering with the District offices, developed contract documents and utilized District Design-Build Pushbutton Contracts to provide pedestrian lighting at these Top intersections. The retrofit lighting installation at these Top intersections was completed in April 15. In January 16, we changed our policy (with management approval) to require pedestrian lighting for all new and reconstructed signalized intersections, roundabouts, and midblock crossings. Effective July 16, all new lighting will be LED. "While education and enforcement are important components of a comprehensive pedestrian safety program, the key is making structural changes in roadway design that better separate motor vehicles and pedestrians, slowing down motor vehicles, and enhancing visibility and awareness through signage and lighting." Governors Highway Safety Association Report 1 P a g e
186 Florida Department of Transportation (FDOT) Intersection Lighting Retrofits for Pedestrians Following this concentrated effort for the top intersections, a more systemic approach was developed to address nighttime intersections statewide. Due to its relatively low cost and high return on crash reduction, lighting retrofits were evaluated for the remaining urban signalized intersections in Florida. Data Collection Crash data was provided in an Excel spreadsheet by the State Safety Office on all intersection related nighttime pedestrian related crashes and fatalities from Data was extracted from the FDOT CARS database for intersection crashes that occurred within 5 of the center of a signalized intersection with a breakdown of crashes per intersection. Of the 8,5 signalized intersections on the SHS, 5, were chosen for review based on the number of pedestrian crashes that occurred at or near these intersections. Those intersections with the most crashes provide a higher statistical reliability of success in the reduction of pedestrian related fatality and injury crashes. When looking at those intersections with at least one crash, it was found that four-lane and six-lane urban facilities represent a majority of these nighttime pedestrian crashes. HSM Methodology and Process Due to the randomness of pedestrian related crashes throughout roadway corridors a riskbased systemic approach was developed. The engineering analysis for this internal FDOT study was performed using a hybrid Highway Safety Manual (HSM)/Historical Crash Method (HCM) process. This process is comprised of observed Florida historical pedestrian crash rates and frequencies provided by the State Safety Office combined with portions of those processes in the HSM, Volumes 1-3. The processes in the chapters on Network Screening (Chapter 4), Economic Appraisal (Chapter 7), Project Prioritization (Chapter 8), Urban and Suburban Arterials (Chapter 1) and Chapter 14 (Intersections) were reviewed and included where appropriate. Crash Modification Factors (CMFs) Used: During the statewide analysis of intersection crashes, multiple research studies were reviewed to confirm the benefits of pedestrian lighting. Some of the studies are based on before-after crash comparisons and some are based on meta-analysis (Crash system data observations). Regardless of method, all of the research reviewed indicated a higher than average reduction in pedestrian crashes as a result of the presence of, or addition of, intersection lighting. The CMFs used in this study were from the HSM, Volume 3, Table (Below), and are consistent with the application of most HSM CMFs, in that the lighting countermeasure was not broken down further into subordinate crash types. Doing so, often leads to a loss in statistical reliability due to limits in available research data. P a g e
187 Florida Department of Transportation (FDOT) Intersection Lighting Retrofits for Pedestrians HSM Table 14-18: Potential Crash Effects of Providing Intersection Illumination.6 CMF 38% reduction All nighttime injury crashes.58 CMF 4% reduction Pedestrian Nighttime Crashes Other HSM Lighting CMFs for Urban Intersections (4-Leg Signalized) offer reductions of 8% - 1% of total nighttime crashes (inclusive of cars, bikes, and peds). While these reductions also include pedestrian crashes, these benefits were not included in the benefit-cost analysis performed. Adding these crashes would increase the B/C ratios accordingly. Average Crash Reduction Benefit Average crash costs were computed representative of existing Florida distribution rates for pedestrian crashes. Using the values from the PPM, Volume 1, Ch. 3, the value to society for one nighttime pedestrian crash was derived as follows: Nighttime Pedestrian Crash Cost (Weighted Average) PPM Crash Cost (VSL) Nighttime Pedestrian Crashes (9-13) Proportion (F+I) Cost per Crash (F+I) K - $ 1,1, 34 13% $1,313, A - $ 574, 78 9% $166,46 B - $ 155, % $54,5 C - $ 96, % $,18 Avg. Cost Nighttime Pedestrian Crash,454 1% $1,555,98 3 P a g e
188 Florida Department of Transportation (FDOT) Intersection Lighting Retrofits for Pedestrians Construction Costs The average cost for each intersection lighting retrofit is $39,64 and is based on the statewide average unit cost for the pay items used to retrofit lighting on the top intersections. Intersections where partial lighting is present will have slightly reduced costs. The average cost per intersection is broken down as follows: Pay Item No. Intersection Lighting Retrofit Unit Cost Light Upgrades by Intersection Average Quantity Units Unit Cost New Light Poles 3 EA $4,5. $1, Relocated Light Poles 1 EA $,15. $, Re-lamp & Re-ballast Luminaire 1 EA $5. $ Add Luminaire to Exist Pole 1 EA $45. $ Pull Boxes 3 EA $5. $1, Remove Light Pole/Arm.5 EA $. $ Conduit (Directional Bore) 4 LF $18.5 $7, Lighting Conductors (No.6) 4 LF $1.75 $ Lighting Conductors (No.1) 8 LF $5.75 $4, Pole Cable Distribution System 4 LF $75. $3, Cost Signalized Intersection Lighting Retrofit $3,7 Add Design and Other Construction Costs at % $6,544 Total Lighting Retrofit for Signalized Intersection $39,64 Project Approach and Rankings Once all of the intersections with crashes were identified, the signalized intersections were then plotted on a GIS map along with nighttime pedestrian crashes along major urban and suburban highways according to relatively homogeneous segment characteristics. Segments and intersections were filtered by typical section, traffic volume, land development context, pedestrian traffic generators, and uniformity. The Intersection crash spreadsheets from the Safety Office were reviewed, updated, and then ranked based on the highest benefit-cost ratios for retrofitting of lighting to address nighttime pedestrian crashes. Intersections for retrofitting were selected based on a roadway segment approach instead of selected isolated intersections. This approach targets roadway segments inclusive of multiple intersections exhibiting high pedestrian crash frequencies. While some intersections within the selected high crash segments had no crashes, these intersections are still proposed for retrofitting. This is due to their similarity in roadway characteristics to other intersections within the segment exhibiting high crash rates. This approach is more uniform and addresses a significant portion of nighttime pedestrian crashes in a very systemic manner. Segments with high pedestrian intersection crashes are the targeted 4 P a g e

189 Florida Department of Transportation (FDOT) Intersection Lighting Retrofits for Pedestrians approach, but lighting retrofits are only proposed at intersections within those roadway segments. No roadway or corridor lighting between intersections is proposed. Benefit-Cost The Benefit for each segment of intersections was calculated by dividing the number of existing pedestrian intersection crashes over five years by five and then multiplying that number by the crash reduction factor (HSM) and the cost for one pedestrian crash. The cost for each segment of intersections was calculated by multiplying the number of intersections within each segment by $39,64 and then applying a -year Capital Recovery Factor of.736 to annualize the cost. The segments were then ranked statewide based on their respective benefit-cost ratios. Benefit: (# of crashes over 5 years/5) *.4* $1,555,98 Cost: # Intersections Retrofitted (In Segment) * Construction Cost *.736 ( Year Factor) For Example: (1 Existing Crash/5 *.4 * $1,555,98/1) / 1 * $39,64*.736 = 45. B/C Ratio to Retrofit Lighting at an intersection with One Pedestrian Crash over 5 Years. District Funding Allocations Allocation for funding was determined based on total crash rate percentages for each district. The statewide average B/C ratio was 4:1 based on a $ million/year allocation for lighting retrofits over five years. This B/C far exceeds other initiatives that we are advancing within the Department. This statewide allocation is projected to retrofit 546 intersections representing about,39 crashes or 7 percent of all (37) nighttime pedestrian intersection crashes over the next five years. The crashes will continue to be reduced over the remainder of the year lifespan of the lighting projects for a total net present value of crash reduction of $4 Billion. To fund all 37 intersections with nighttime pedestrian crashes would require over $ million. The targeted segments for retrofitting have been ranked according to their benefit-cost ratios and the proposed funding allocations are provided below: Percentage of Crash Sites Retrofitted 1% 8% 6% 4% % Lighting Retrofit at Signalized Intersections 9% 7% 45% 1% % $5 $1 $15 $ Funding Over 5-YR Period ($ Million) 5 P a g e
190 Florida Department of Transportation (FDOT) Intersection Lighting Retrofits for Pedestrians Intersection Retrofit Funding Allocation District No. of Crashes Addressed (5-Year) Fatalities (5-Year) Intersections Retrofitted (5-Year) Funding Allocation (5-Year) Benefit (Annualized) Cost (Annualized) Avg. B/C Ratio $ 7,34, $ 17,95,619 $ 54, $ 9,79, $ 7,185,174 $ 7, $ 6,4, $ 18,36,317 $ 471, $,51, $ 61,48,37 $ 1,59, $ 17,6, $ 5,449,49 $ 1,7, $ 3,61, $ 79,,959 $ 1,737, $ 15,9, $ 47,574,55 $ 1,11,64 43 Statewide $ 1,, $ 31,781,571 $ 7,36, 4 References and Studies: AASHTO Highway Safety Manual Holland-Wanvik 9: 3% Reduction in Nighttime Ped Crashes, 46%-49% Reduction in all crashes (Non-EB, but based on 763, crashes), HSM Ref. for Table Elvik and Vaa (38 Before-After Studies, 14 in USA, 4 UK/Europe), HSM for Table Minnesota DOT; Before-After Study Ohio-Chowdury: Adding Interchange Lighting results in 5% Reductions in all crashes (KABCO), 6% Reduction in KABC crashes. (Before/After-EB) Bullough: 1% reduction in total nighttime crashes through intersection lighting (KABCO) Michigan: 3% Reduction in Pedestrian Fatal and Injury Crashes (KA) Donnell: 1% reduction in total nighttime crashes (KABCO) 6 P a g e
191 FY 17 INTERSECTION FM# City Commercial Blvd NE 6th Ave Oakland Park Oakland Park NE 6 Ave Oakland Park W Sunrise Blvd Sunset Strip Sunrise SR 817 / University Dr Sunset Strip Sunrise Blue Heron Blvd Avenue S Riviera Beach Blue Heron Blvd Avenue O Riviera Beach Blue Heron Blvd Australian Ave Riviera Beach Blue Heron Blvd Old Dixie Hwy Riviera Beach Blue Heron Blvd Ave H West Riviera Beach Blue Heron Blvd Ave F Riviera Beach Military Tr PGA Blvd Palm Bch. Gardens SR 7 Marina Blvd Boca Raton SR 7 Sandalfoot Blvd Boca Raton SR 7 Judge Winikoff Rd Boca Raton SR 7 Boca Woods Ln Boca Raton SR 7 SW 3 St Boca Raton SR 7 Palmetto Park Rd Boca Raton SR 7 Atlantic Blvd Margate SR 7 SW 11 St North Lauderdale SR 7 Southgate Blvd Margate SR 7 SW 17 St North Lauderdale SR 7 SW 7 St Margate SR 7 Coconut Creek Pkwy Margate SR 7 Margate Blvd Margate SR 7 Copans Rd Margate SR 7 Rancho Blvd Margate SR 7 Winfield Blvd Margate SR 7 Prospect Rd North Lauderdale SR 7 Bailey Rd North Lauderdale SR 7 Blvd of Champions North Lauderdale SR 7 SW 1 St North Lauderdale SR 7 NB Sample Rd Coconut/Margate/Coral SR 7 SB Sample Rd Coconut/Margate/Coral SR 7 NW 31 St Margate SR 7 Glades Rd Boca Raton Ocean Dr Arizona St Hollywood Ocean Dr Sheridan St Hollywood Ocean Dr Michigan St Hollywood Ocean Dr Harrison St Hollywood Ocean Dr Johnson St Hollywood Ocean Dr Indiana St Hollywood Palm Beach County Projects
192 Appendix F Palm Beach MPO Initiatives

193 Palm Beach MPO Commuter Challenge March 16 The Palm Beach Metropolitan Planning Organization (MPO) held its first Commuter Challenge during March 16. The MPO collaborated with County Departments and community partners to promote the Challenge and encourage people to create workplace teams and log trips taken by transit, walking, bicycling, and carpooling within and to/from Palm Beach County (PBC) at: The Challenge motivated commuters to use alternative modes of transportation and supported team building. Teams organized activities such as the PBC Department of Environmental Resources Management s 1 mile group bicycle ride to work and the MPO s Transit Tuesday where staff took transit to work from across the county and documented their experiences. MPO Board members also participated in bicycle rides and took transit to work. Over 5 participants signed up for the Challenge and 48 teams were created. Altogether more than 68, miles were logged by taking alternative modes of transportation for work, saving approximately 3, lbs of CO. In addition, the Florida Department of Transportation (FDOT) District 4 was inspired by the MPO s initiative and organized its own challenge for FDOT D4 employees that commuted another 8, miles by not driving alone. The Palm Beach MPO also coordinated with the PBC School District to do a March Walk & Roll Challenge with students from 8 schools that walked and biked 1, miles. The Commuter Challenge culminated with a family friendly celebration that included a 1-mile bicycle ride, helmet fitting, bicycle safety rodeo, bus exhibit, bike share demonstration, and a transportation scavenger hunt with educational booths. Awards were presented to the top teams and individual commuters. Participants were surveyed for feedback and more than 9% said they took an alternative mode of transportation they would have not normally taken because of the Challenge. Participants were also asked how often they would continue to take alternative modes of transportation as a result of the Challenge and approximately % responded frequently; 5% responded occasionally; approximately % responded rarely; and less than 1% responded that the Challenge did not influence their transportation mode choice. Lastly, participants were asked if they would participate again in the Challenge and 1% said Yes The Palm Beach MPO looks forward to making the Commuter Challenge an annual event and possibly expanding it to include Broward and Miami-Dade Counties to encourage all commuters in the Miami- Urbanized Area to use alternative modes of transportation.


194

 looking within two miles of the school, () refining the study boundary to the school attendance zone, (3) focusing on arrival and dismissal hours, and (4) identifying")

195 Hazardous Walking Conditions Analysis House Bill 41, also known as Gabby s Law for Student Safety, outlines the identification and mitigation of hazardous walking conditions defined by s. 16.3, F.S. House Bill 41 was amended in July 15 to include Metropolitan Planning Organizations in the hazard identification process. The MPO conducted a preliminary desktop analysis of five public elementary schools using aerial imagery. The analysis consisted of (1) looking within two miles of the school, () refining the study boundary to the school attendance zone, (3) focusing on arrival and dismissal hours, and (4) identifying hazards outlined in the statute. Section 16.3, F.S. defines hazardous conditions for walking surfaces parallel to the road based on volume or posted speed as well as walking surfaces perpendicular to the road based on traffic volume. (1) A two-mile buffer is placed around each school. Hazardous conditions are also defined for uncontrolled crossing sites based on traffic volume of the road or intersection, as well as uncontrolled crossing sites over the road based on posted speed or number of lanes. Following the preliminary analysis, the MPO procured the services of Kimley-Horn and Associates to complete a county-wide study. The study included creating an inventory of sidewalks on major roads, an inventory of major intersections including traffic turn counts, whether or not the signals are controlled, as well as a sample assessment of two additional public elementary schools. () The two-mile buffer is refined to the school attendance zone. Students outside of two miles from the school are eligible for school bus transportation. Moving forward, the MPO will use the sidewalk and intersection data to complete the analysis for all public elementary schools in Palm Beach County. Where there are missing sidewalks or hazardous crossings, the MPO will facilitate the mitigation process with local agencies including the PBC School District, municipalities, and utility organizations.
 Bicycle-Pedestrian Count Technology Pilot Program.")


196 Executive Summary Overview In March 15 the Palm Beach Metropolitan Planning Organization (MPO) was awarded a $, grant to participate in the Federal Highway Administration s (FHWA) Bicycle-Pedestrian Count Technology Pilot Program. This program allowed the MPO to purchase equipment to capture pedestrian and bicycle activity throughout the county. Purpose and Goals The purpose of collecting bicycle and pedestrian counts throughout the county is to analyze existing patterns, identify deficiencies in the transportation system, evaluate the impacts of projects, and inform future design, planning, prioritization, and maintenance decisions. Deployment Methodology Eco-Counter portable counters were identified as the preferred automated devices. A total of 54 stations were selected for data collection. Count stations were categorized into factor groups according to area type and facility type to allow MPO Staff to estimate activity levels in uncounted locations with similar characteristics. Data Daily Pedestrian Averages by Area Type Daily Bicyclists Averages by Area Type Observed Pedestrian Facility Usage Observed Bicycle Facility Usage 93 Daily average pedestrians observed 19 Daily average bicyclists observed
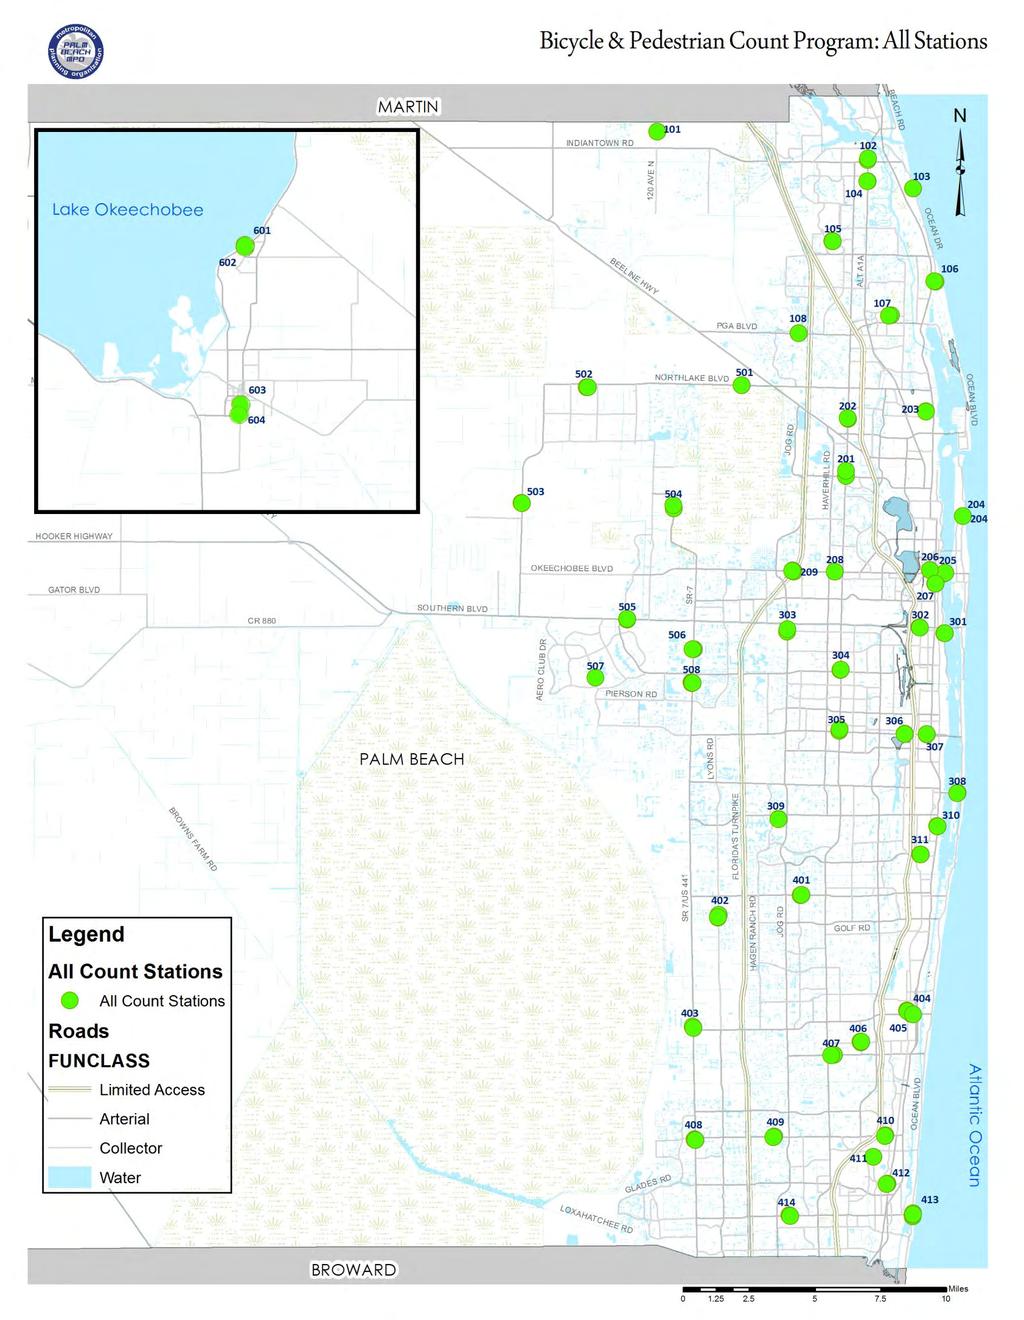
197

198 1/13/17 Palm Beach Metropolitan Planning Organization's Bicycle and Pedestrian Count Pilot Program 16 South Florida GIS EXPO A Semi-Technical Presentation about How to Passively Stalk the General Public 1
 Chapter 3: Geospatial Data Management Chapter 4: Maps and Data Chapter 5: Future Espionage Missions")
199 1/13/17 Don t worry it s socially acceptable Presentation Chapters Chapter 1: Why Stalk Pedestrians and Cyclists? Chapter : Best Places to Stalk (with given technology) Chapter 3: Geospatial Data Management Chapter 4: Maps and Data Chapter 5: Future Espionage Missions Chapter 6: How Can Stalkers Better Manage their Data?

200 1/13/17 Chapter 1. Why Count Pedestrians and Cyclists? Palm Beach MPO Designated by Federal Law for populations over 5, Help allocate funding Represent various users and modes of transportation Promote safety and transportation equity 3

201 1/13/17 Long Range Transportation Plan (LRTP) Goal 3: Prioritize a safe and convenient non-motorized transportation network 5 4 CURREN TARGE TARGE T VALUE T T DESCRIPTION 3.1 Increase the percentage of Pedestrian mode choice Bicycling mode choice 3. Increase centerline mileage of Buffered bike lanes 1-ft or wider shared use Designated bike lanes Priority bike network operating at LOS C or better 3.3 Increase percentage of thoroughfare mileage near transit hubs That provides dedicated bicycle facilities (within 3 miles) That provides dedicated pedestrian facilities (within 1 mile) 1.45% 1 3.5%.5% 1 1.5% % 85% Notes: 1. Source: U.S. Census Bureau, Year American Community Survey, Table B % 1% 5% 3% % 1% Project Timeline March 15 April- Oct. 15 Oct. 15 Obtained $K FHWA Pilot Grant Identified Counter 54 Stations Purchased Counter Sets (6 each, 1 total) Nov. 15 Deployed Counters Aug. 16 Sept. 16 Conclude Pilot, Summarize and Report Findings Completed counts of all stations 4

202 1/13/17 Purpose & Goals Understand traffic patterns Mid term Identify deficiencies in transportation system Expand data collection system Evaluate impact of projects Inform future design, planning, prioritization, and maintenance decisions Short term Long term Important Reasons for Counting Encourage Mode Switch Approximately 5% of all trips in the U.S. are less than 1 mile; yet 75% of these trips are taken by automobile. Improve Health Car usage Less physical activity, environmental impacts, associated costs Active Modes Involves physical activity, no carbon footprint, more socially equitable, improves social engagement Improve Safety Given the size of the automobile versus pedestrians and cyclists; if this active user group were to be hit they are more likely to be injured. 5

203 1/13/17 Risk = Hazard x Exposure Pedestrian and Bicyclist exposure (or volume) is not readily available or collected. Researchers often use surrogate measures, such as population density, number of lanes crossed, time spent walking number or pedestrian trips and aggregate distance traveled by all pedestrians in a specific area of interest. Although there are different types of exposure measures, they have been criticized since they do not account for the actual amount of walking people do. Researchers have developed statistical regression models; or applied computer vision techniques to estimate pedestrian [and cyclists] exposure or volumes. Chapter. Best Places to Stalk (with given technology) 6

 Need vertical element (Tree, pole,")
 How is data")


204 1/13/17 Counter Specifications Pneumatic Tubes Pyro-Box Needs vertical element (Tree, pole, etc.) Tubes up to 3 long Mode Selective (Cars vs. Bikes) Need vertical element (Tree, pole, etc.) 15 range heat sensor Not mode selective (Counts heat emitting objects) How is data captured? PNUEMATIC TUBES PYRO -BOX City: West Palm Beach, FL Location : South Rosemary Ave, near Okeechobee Blvd City: Palm Beach Gardens, FL Location: Gardens Pkwy, near Kew Gardens Ave 7
 Locations with light car traffic")

205 1/13/17 Best Places to Stalk Public Places Near Vertical Elements Locations with little to no background traffic (Pyro boxes) Locations with light car traffic (Pneumatic tubes) City: Palm Beach Gardens, FL Location: Gardens Pkwy, near Kew Gardens Ave City: Delray Beach, FL Location: East Atlantic Ave, near NE 3rd Ave Installation Video 8
 Deploy Counters at Stations 4.) Upload Count Data to Eco-Visio Platform via Bluetooth 5.) Download to Business Table 6.")
206 1/13/17 Chapter 3. Geospatial Data Management The Process 1.) Mapped Count Station Locations.) Categorized Stations in Business Table 3.) Deploy Counters at Stations 4.) Upload Count Data to Eco-Visio Platform via Bluetooth 5.) Download to Business Table 6.) Join Data to Count Shape file 9
 Categorized Stations in Business Table Factor Grouping Extrapolation factors are used to expand shortduration counts to estimate volumes over longer time periods or to estimate activity level where")

207 1/13/17 1.) Mapped All Count Station Locations Station Identification Process Upcoming Planning Projects MPO Committee Engagement Local Knowledge.) Categorized Stations in Business Table Factor Grouping Extrapolation factors are used to expand shortduration counts to estimate volumes over longer time periods or to estimate activity level where no counts exist based counts collected from other locations with similar characteristics. One method of extrapolation is called factor grouping. According to the National Cooperative Highway Research Program, it is important to extrapolate based on site similarities. The long term goals of using factor grouping include extrapolating short term counts over longer periods of time and correlating non-motorized travel to zoning categories (e.g. average bike usage in school areas). Stations were assigned to factor groups: Area Type Facility Type 1


208 1/13/17 Variation by Area Type Area Type by Land Use Designation Variation by Facility Type 11
 Deploy")


209 1/13/17 3.) Deploy Counters at Stations 9. First Day of Deployment 4.) Upload Count Data to Eco-Link Platform via Bluetooth 1
 Download to Business Table & 6.")

210 1/13/17 5.) Download to Business Table & 6.) Join Data to Count Shape file Chapter 4. Maps and Data (from November 15 to September 16) 13

211 1/13/17 Quick Stats Pedestrian Count Totals 5,35 Days Counted 7 Average Daily Activity 93 Bicyclist Count Totals 16,89 Days Counted 868 Average Daily Activity 19 Pedestrian Facilities and Average Daily Usage Multiuse Trail 33% Sidewal k 67% 14

212 1/13/17 Bike Facilities and Average Daily Usage Shoulde r 6% Sidewal k 9% Shared Lane Markin g 14% Bike Lane 14% Multius e Trail 57% Observations by Area Type Daily Avg. of Bicyclist Obs. Daily Avg. of Pedestrians -Obs. 1, Recreational Major Commercial Minor Commercial Schools Residential Recreational Major Commercial Minor Commercial Schools Residential 15

213 1/13/17 Safety Commuter Travel 16


214 1/13/17 Safety + Equity Are there other ways to analyze this data? 17

215 1/13/17 Chapter 5. Future Espionage Missions MAJOR TAKEWAY Plenty of opportunity for error in multi-step processes NEXT STEPS Manually verify counts to confirm accuracy Audit program for inconsistencies and improvements Give someone else a chance to stalk 18


216 1/13/17 Special Thanks to James Jimmy Davis Equipment Technician PBC Engineering Department Nick Uhren, P.E. Jeremy Raw, FHWA Palm Beach MPO staff YOU Chapter 6. How Can Stalkers Better Manage their Data? 19
PEDESTRIAN/BICYCLIST CRASH ANALYSIS 2015
 PEDESTRIAN/BICYCLIST CRASH ANALYSIS 2015 Central Arkansas Regional Transportation Study Table of Contents Executive Summary... 3 CARTS Pedestrian/Bicycle Crash Analysis... 3 Report Format... 3 Results...
Turnpike Projects in Palm Beach County. Palm Beach TPA Update September 20, 2018
 Turnpike Projects in Palm Beach County Palm Beach TPA Update September 20, 2018 Agenda Background Funded Projects Future Project Status Widenings Interchanges Express Lanes Phasing 2 Background 45 Miles
Agenda. US-1 Corridor Study and HIA Update. Pathway Diagram / Primary Indicators. Research Questions. Linking Multimodal Improvements to Indicators
 Icebreaker Agenda US-1 Corridor Study and HIA Update Pathway Diagram / Primary Indicators Research Questions Linking Multimodal Improvements to Indicators Vulnerable Populations US-1 Corridor Study Vision
FDOT Bicycle/Pedestrian Focused Initiative & Complete Streets
 Florida Department of TRANSPORTATION FDOT Bicycle/Pedestrian Focused Initiative & Complete Streets Billy L. Hattaway, PE District One Secretary Secretary s Pedestrian Safety Initiative Dangerous by Design
Broward Complete Streets Advisory Committee (CSAC) Meeting. Monday, September 24, 2018
 Meeting. Monday, September 24, 2018") Broward Complete Streets Advisory Committee (CSAC) Meeting Monday, September 24, 2018 HOUSEKEEPING Please make sure you have signed in and have an agenda. This meeting is being recorded. Please introduce
Broward Complete Streets Advisory Committee (CSAC) Meeting Monday, September 24, 2018 HOUSEKEEPING Please make sure you have signed in and have an agenda. This meeting is being recorded. Please introduce
VISION ZERO ACTION PLAN
 PALM BEACH Transportation Planning Agency VISION ZERO ACTION PLAN TPA Advisory Committee Meetings March 2019 PURPOSE Present the Data Analysis Key Findings and the Action Items from the Draft Action Plan
Congress Avenue. Palm Beach MPO Subcommittee Meetings December 2017
 1 Congress Avenue Palm Beach MPO Subcommittee Meetings December 2017 2 Agenda Study Purpose Study Process Multimodal Alternatives Development Next Steps *ACTION ITEM: CONFIRM ALTERNATIVES TO MOVE INTO
May 10, 2013 Meredith Cruz, (561) Palm Beach County Traffic Report May 10 through May 17, 2013
 Palm Beach County Traffic Report May 10 through May 17, 2013") May 10, 2013 Meredith Cruz, (561) 641-6440 mcruz@corradino.com Palm Beach County Traffic Report May 10 through May 17, 2013 Palm Beach County Palm Beach County traffic will be affected this week by ongoing
May 10, 2013 Meredith Cruz, (561) 641-6440 mcruz@corradino.com Palm Beach County Traffic Report May 10 through May 17, 2013 Palm Beach County Palm Beach County traffic will be affected this week by ongoing
CITY OF DELRAY BEACH. Overview Map. Commuter Mode of Choice QUICK FACTS. 47 Median Age. 65,804 Residents. 29.1% Traditionally Underserved
 CITY OF $51,829 Median Income 291% Traditionally Underserved 438% Growth from 2010 859% HS/GED 345% Bachelors 27,041 Households 620% Labor Force Lake Okeechobee Delray Beach Palm Beach County Commuter
PALM BEACH METROPOLITAN PLANNING ORGANIZATION
 TECHNICAL ADVISORY COMMITTEE AGENDA DATE: WEDNESDAY, MARCH 1, 217 TIME: PALM METROPOLITAN PLANNING ORGANIZATION 23 N. Jog Rd., 4 th Floor, West Palm Beach, Florida 33411-2749 Phone 561.684.417 Fax 561.242.7165
Pedestrian Safety Action Plan Bicycle Safety Action Plan
 Pedestrian Safety Action Plan Bicycle Safety Action Plan January 24, 2017 VISION: Safe travel for all MISSION STATEMENT: Partner with the community to plan and fund transportation projects and programs
LIST OF PRIORITY PROJECTS FY TPA Committee Meetings & Board Review September 2018
 LIST OF PRIORITY PROJECTS FY 2020-2024 TPA Committee Meetings & Board Review September 2018 MISSION To collaboratively plan, prioritize, and fund the transportation system. El Rio Trail Boca Raton, May
PEDESTRIAN ACTION PLAN
 ATTACHMENT 2 CITY OF SANTA MONICA PEDESTRIAN ACTION PLAN CITY OF SANTA MONICA PEDESTRIAN ACTION PLAN This page intentionally left blank EXECUTIVE SUMMARY CHAPTER 1 EXECUTIVE SUMMARY Setting the Stage
Hillsborough Pedestrian Safety Action Plan 2015 Update. Hillsborough MPO BPAC May 2015
 Hillsborough Pedestrian Safety Action Plan 2015 Update Hillsborough MPO BPAC May 2015 Presentation Overview Pedestrian Safety Action Plan (PSAP) Review Pedestrian Crash Trends Stakeholder Activities Engineering
National Performance Management Measures. April 20, 2016 Webinar
 Safety Performance Measures September 26, 2016 National Performance Management Measures April 20, 2016 Webinar Highway Safety Improvement Program Performance Measures 1 2 3 4 5 Number of fatalities Rate
Transportation Planning Division
 Transportation Planning Division Presentation Outline Study Tasks Recap of Previous Meetings Data Collected Focus Areas within Study Limits Design Principles Tool Box Recommended Concepts Schedule Moving
SR 693 (Pasadena Avenue) Corridor Study from Shore Drive South to 66 th Street
 Corridor Study from Shore Drive South to 66 th Street") Welcome and Introduction Sign-in and comment sheets Restrooms and exits Meeting agenda and timeline Meeting goals / expectations Provide input to guide study recommendations Actively participate throughout
Welcome and Introduction Sign-in and comment sheets Restrooms and exits Meeting agenda and timeline Meeting goals / expectations Provide input to guide study recommendations Actively participate throughout
PRELIMINARY DRAFT FIRST AMENDMENT TO VISION 2050: A REGIONAL LAND USE AND TRANSPORTATION PLAN FOR SOUTHEASTERN WISCONSIN
 PRELIMINARY DRAFT FIRST AMENDMENT TO VISION 2050: A REGIONAL LAND USE AND TRANSPORTATION PLAN FOR SOUTHEASTERN WISCONSIN ESTABLISHING TARGETS FOR FEDERAL PERFORMANCE MEASURES: HIGHWAY SAFETY SOUTHEASTERN
PALM BEACH COUNTY LOCAL ROAD SAFETY PLAN
 PALM BEACH COUNTY LOCAL ROAD SAFETY PLAN JANUARY 2019 Street View Images Google 2018 Notice This document is disseminated under the sponsorship of the U.S. Department of Transportation in the interest
2014 QUICK FACTS ILLINOIS CRASH INFORMATION. Illinois Emergency Medical Services for Children February 2016 Edition
 2014 QUICK FACTS ILLINOIS CRASH INFORMATION February 2016 Edition Illinois Emergency Medical Services for Children www.luhs.org/emsc Illinois Emergency Medical Services for Children TABLE OF CONTENTS
APPENDIX C. Systems Performance Report C-1
 APPENDIX C Systems Performance Report C-1 System Performance Report & Requirements According to the FAST Act, a long range transportation plan needs to include a system performance report and subsequent
2012 QUICK FACTS ILLINOIS CRASH INFORMATION. Illinois Emergency Medical Services for Children September 2014 Edition
 2012 QUICK FACTS ILLINOIS CRASH INFORMATION September 2014 Edition Illinois Emergency Medical Services for Children www.luhs.org/emsc Illinois Emergency Medical Services for Children TABLE OF CONTENTS
CITY OF COCOA BEACH 2025 COMPREHENSIVE PLAN. Section VIII Mobility Element Goals, Objectives, and Policies
 CITY OF COCOA BEACH 2025 COMPREHENSIVE PLAN Section VIII Mobility Element Goals, Objectives, and Policies Adopted August 6, 2015 by Ordinance No. 1591 VIII MOBILITY ELEMENT Table of Contents Page Number
Bicycle Crashes. Number of Bike Crashes. Total Bike Crashes. are down 21% and severe bike crashes down 8% since 2013 (5 years).
.") Bicycle Crashes The City of Fort Collins is well known for its bike culture, and there is a strong focus on encouraging increased riding. Bike safety is an important component of supporting these efforts.
Bicycle Crashes The City of Fort Collins is well known for its bike culture, and there is a strong focus on encouraging increased riding. Bike safety is an important component of supporting these efforts.
North Carolina. Bicycle Crash Facts Prepared for
 North Carolina Bicycle Crash Facts 2006-2010 Prepared for The North Carolina Department of Transportation Division of Bicycle and Pedestrian Transportation Prepared by The University of North Carolina
A review of 2015 fatal collision statistics as of 31 December 2015
 A review of fatal collision statistics as of 31 December This report summarises the main trends in road fatalities that have emerged in. This has been prepared by the Road Safety Authority following analysis
Financial Project ID No(s).: and ETDM No(s).: and 14181
.: and ETDM No(s).: and 14181") Palm Beach Metropolitan Planning Organization (MPO) Presentation I-95 at Boynton Beach Boulevard Interchange and I-95 at Gateway Boulevard Interchange Project Development and Environment Study Palm Beach
Palm Beach Metropolitan Planning Organization (MPO) Presentation I-95 at Boynton Beach Boulevard Interchange and I-95 at Gateway Boulevard Interchange Project Development and Environment Study Palm Beach
APPENDIX G: INTERSECTION NEEDS AT OKEECHOBEE BOULEVARD
 APPENDIX G: INTERSECTION NEEDS AT OKEECHOBEE BOULEVARD INTERSECTION NEEDS AT SR 7 and OKEECHOBEE BOULEVARD SR 7 Extension Project Development and Environment (PD&E) Study From Okeechobee Boulevard (SR
2018 Transportation Alternatives Program (TAP) Application Presentation to Palm Beach TPA BRANT BRIDGE CONNECTION LOOP EXTENSION ON CARL BOLTER DR
 Application Presentation to Palm Beach TPA BRANT BRIDGE CONNECTION LOOP EXTENSION ON CARL BOLTER DR") 2018 Transportation Alternatives Program (TAP) Application Presentation to Palm Beach TPA BRANT BRIDGE CONNECTION LOOP EXTENSION ON CARL BOLTER DR Project Location N N Connecting South Delray Beach Existing
2018 Transportation Alternatives Program (TAP) Application Presentation to Palm Beach TPA BRANT BRIDGE CONNECTION LOOP EXTENSION ON CARL BOLTER DR Project Location N N Connecting South Delray Beach Existing
Pedestrian and Bicycle Crashes
 Pedestrian and Bicycle Crashes Pedestrian and Bicycles Overview Pedestrian-related crashes represent 3.6% of the total reported traffic crashes; however, they account for 11.1% of all traffic crash deaths.
Street Smart - Regional Pedestrian Safety Campaign. Hopkins Grand Rounds July 16, 2014
 Street Smart - Regional Pedestrian Safety Campaign Hopkins Grand Rounds July 16, 2014 Baltimore Metropolitan Council (BMC) Who We Are The organization of the Baltimore region s elected executives, representing
FDOT Bicycle/Pedestrian Focused Initiative & Complete Streets
 Florida Department of TRANSPORTATION FDOT Bicycle/Pedestrian Focused Initiative & Complete Streets DeWayne Carver, AICP State Bicycle/Pedestrian Coordinator Secretary s Pedestrian Safety Initiative Dangerous
MEMORANDUM. City Constituents. Leilani Schwarcz, Vision Zero Surveillance Epidemiologist, SFDPH
 MEMORANDUM TO: FROM: CC: City Constituents Leilani Schwarcz, Vision Zero Surveillance Epidemiologist, SFDPH Megan Wier, Co-Chair, San Francisco Vision Zero Task Force, SFDPH Commander Ann Mannix, Traffic
Safety Emphasis Areas & Safety Project Development Florida Department of Transportation District Seven Tampa Bay
 Safety Emphasis Areas & Safety Project Development Florida Department of Transportation District Seven Tampa Bay Stephen L. Benson, AICP, CNU-A FDOT District Seven Safety Office Presentation Overview Safety
Citizen Advocacy. VISION ZERO IN HILLSBOROUGH COUNTY TODAY
 Citizen Advocacy http://www.tampabay.com/news/publicsafety/accidents/car-bus-crash-kills-one/441282 VISION ZERO IN HILLSBOROUGH COUNTY TODAY Does Vision Zero Make Sense Here? Traffic Deaths per 100,000
MARTIN COUNTY CRASH SURVEILLANCE REPORT
 MARTIN COUNTY CRASH SURVEILLANCE REPORT FROM JULY 1, 2011 TO JUNE 30, 2013 IDENTIFICATION AND ANALYSIS OF CRASHES AT INTERSECTIONS & RAIL CROSSINGS AND INVOLVING PEDESTRIANS & BICYCLISTS APRIL 14, 2014
Application of Demographic Analysis to Pedestrian Safety. Center for Urban Transportation Research University of South Florida
 Application of Demographic Analysis to Pedestrian Safety BDV25 TWO 977 30 Pei Sung Lin, Ph.D., P.E., PTOE, FITE Program Director Achilleas Kourtellis, Ph.D. Senior Research Associate CUTR, University of
TPA Committee Meetings May 2018
 TPA Committee Meetings May 2018 Purpose Develop a comprehensive plan to identify multimodal improvements for all users of the roadway and evaluate the potential for a premium express bus service Overview
APPENDIX A: Complete Streets Checklist DRAFT NOVEMBER 2016
 APPENDIX A: Complete Streets Checklist DRAFT NOVEMBER 2016 Complete Streets Checklist MetroPlan Orlando s Complete Streets Checklist is an internal planning tool for staff to further implementation of
CTDOT Pedestrian and Bicycle Safety Initiatives
 CTDOT Pedestrian and Bicycle Safety Initiatives 2017 Northeast Transportation Safety Conference Mark F. Carlino, P.E. Traffic Engineering Division Chief Bureau of Engineering and Construction Connecticut
Speed Limits Study and Proposal. Public Input Session: 8/14/13
 Speed Limits Study and Proposal Public Input Session: 8/14/13 Why is Decatur a unique place for this project? First Community Transportation Plan in the nation with a Health Impact Assessment. Strong sense
Complete Streets Advisory Committee Meeting Summary
 Complete Streets Advisory Committee Meeting Summary September 24, 2018 BrowardMPO.org Broward MPO Complete Streets Advisory Committee (CSAC) September 24, 2018 ADVISORY COMMITTEE MEETING 2 MEETING PARTICIPANTS
MTCF. Michigan Traffic Crash Facts FACT SHEETS
 FACT SHEETS This page left intentionally blank GENERAL FACTS The driver, the roadway, and the motor vehicle contribute in some measure to every crash. A preponderance of evidence, however, points to driver
95 Express Annual Operations Report: Fiscal Year
 95 Express Annual Operations Report: Fiscal Year 2014-2015 General The 95 Express Program completed its sixth full Fiscal Year of operations in June 2015. For the FDOT, its Fiscal Year (FY) is from July
Lane Area Transportation Safety and Security Plan Vulnerable Users Focus Group
 Lane Area Transportation Safety and Security Plan Vulnerable Users Focus Group Agenda 1. Planning Process Review 2. What are Emphasis Areas? 3. Your Role Today 4. Data Review 5. Small group discussion
UPDATES, SUCCESSES, AND WHAT S AHEAD ON THE ROAD TO ZERO
 Vol. 1, Issue 1 I Spring 2018 www.planhillsborough.org/vision-zero S A F E S T R E E T S N O W H I L L S B O R O U G H UPDATES, SUCCESSES, AND WHAT S AHEAD ON THE ROAD TO ZERO TRACKING PROGRESS This is
Truck Tractor Trailer Crash Analysis
 Building Tribal Traffic Safety Capacity Truck Tractor Trailer Crash Analysis Arizona Department of Transportation (ADOT) Motor Vehicle Crash (MVC) Data ITCA, Inc. 04/18/06 Truck Tractor Trailer Crash Analysis
For Information Only. Pedestrian Collisions (2011 to 2015) Resolution. Presented: Monday, Apr 18, Report Date Tuesday, Apr 05, 2016
 Resolution. Presented: Monday, Apr 18, Report Date Tuesday, Apr 05, 2016") Presented To: Operations Committee For Information Only Pedestrian Collisions (0 to 0) Presented: Monday, Apr 8, 06 Report Date Tuesday, Apr 0, 06 Type: Correspondence for Information Only Resolution For
Presented To: Operations Committee For Information Only Pedestrian Collisions (0 to 0) Presented: Monday, Apr 8, 06 Report Date Tuesday, Apr 0, 06 Type: Correspondence for Information Only Resolution For
TRAFFIC CRASH FACTS FOR CHAMPAIGN-URBANA SELECTED CRASH INTERSECTION LOCATIONS (SCIL)
") TRAFFIC CRASH FACTS FOR CHAMPAIGN-URBANA SELECTED CRASH INTERSECTION LOCATIONS (SCIL) 2007-2011 February 2014 Prepared by: Champaign Urbana Urbanized Area Transportation Study (CUUATS) TABLE OF CONTENTS
TRAFFIC CRASH FACTS FOR CHAMPAIGN-URBANA SELECTED CRASH INTERSECTION LOCATIONS (SCIL) 2007-2011 February 2014 Prepared by: Champaign Urbana Urbanized Area Transportation Study (CUUATS) TABLE OF CONTENTS
Traffic Safety Study Report City Wide Intersection Study City of Coconut Creek Broward County, Florida
 EXHIBIT "A" Traffic Safety Study Report City Wide Intersection Study City of Coconut Creek Broward County, Florida Prepared by: June 8, 2017 Revised January 18, 2018 TABLE OF CONTENTS 1. Introduction...
Pedestrian Accidents in Utah
 TRANSPORTATION RESEARCH RECORD 1325 69 Pedestrian Accidents in Utah ERIC YUAN-CHIN CHENG The objectives are to investigate the trend of Utah's pedestrian accident rate and to analyze and discuss some of
HIA Working Group Meeting #4 September 27, 2017
 HIA Working Group Meeting #4 September 27, 2017 Icebreaker Agenda US-1 Corridor Study Update Health Indicator Assessment Station Demonstration Area Assessment Preliminary Recommendations Discussion Next
FLETCHER AVENUE PEDESTRIAN AND BICYCLIST BEHAVIOR CHANGE FORMATIVE RESEARCH PROJECT
 FLETCHER AVENUE PEDESTRIAN AND BICYCLIST BEHAVIOR CHANGE FORMATIVE RESEARCH PROJECT EXTENT OF CHANGES IN PEDESTRIAN AND BICYCLIST ATTITUDES AND BEHAVIORS DIRECTLY AFTER A COMPLETE STREETS PROJECT IN FLORIDA
Transportation Planning Division
 Transportation Planning Division Presentation Outline Study Tasks Recap of Previous Meeting Stakeholder Interviews Data Collection Design Principles Tool Box Recommendations Schedule Moving Forward North
USDOT Bicycle and Pedestrian Safety Initiative: Safer People and Safer Streets. Barbara McCann, USDOT Office of Policy
 { USDOT Bicycle and Pedestrian Safety Initiative: Safer People and Safer Streets Barbara McCann, USDOT Office of Policy 4 Steps from policy to practice Creating multi-modal streets means: 1. Change Decision-Making
Transit Initiatives 1
 Transit Initiatives 1 TPA Transit Overview Capital Projects Transit Planning Initiatives Challenges Tri-Rail Layover Facility, New Boca Station Northern Layover Facility $28.7 M; Completion in 2023 Boca
Safety Benefits of Raised Medians and Pedestrian Refuge Areas. FHWA Safety Program.
 Safety Benefits of Raised Medians and Pedestrian Refuge Areas FHWA Safety Program http://safety.fhwa.dot.gov There s a signal up the block, but looking left there s a gap in traffi c. Looking right there
MTCF. Michigan Traffic Crash Facts FACT SHEETS
 FACT SHEETS This page left intentionally blank GENERAL FACTS The driver, the roadway, and the motor vehicle contribute in some measure to every crash. A preponderance of evidence, however, points to driver
LANE ELIMINATION PROJECTS
 PRESENTATION OUTLINE Lane Elimination Considerations Districts 4 & 7 Draft Lane Elimination Processes FDOT Lane Elimination Guidelines Example Projects D4 Case Study: SR A1A (Ft. Lauderdale) D7 Case Study:
Pinellas County Metropolitan Planning Organization (MPO) 2014 Crash Data Report
 2014 Crash Data Report") Pinellas County Metropolitan Planning Organization (MPO) 2014 Crash Data Report MPO Board July 8, 2015 2 Crash Data Collection Motorcycle drove between stopped cars, ran a red light and collided with a
Pinellas County Metropolitan Planning Organization (MPO) 2014 Crash Data Report MPO Board July 8, 2015 2 Crash Data Collection Motorcycle drove between stopped cars, ran a red light and collided with a
City of Toronto Pedestrian Collision Study. Transportation Services Division Traffic Data Centre and Safety Bureau
 City of Toronto Pedestrian Collision Study Transportation Services Division Traffic Data Centre and Safety Bureau January 2007 EXECUTIVE SUMMARY Pedestrian safety is a primary concern for the city of
Deaths/injuries in motor vehicle crashes per million hours spent travelling, July 2007 June 2011 (All ages) Mode of travel
 Mode of travel") Cyclists CRASH STATISTICS FOR THE YEAR ENDED 31 DECEMBER 211 Prepared by the Ministry of Transport CRASH FACTSHEET 212 Cyclists have a number of risk factors that do not affect car drivers. The main risk
Cyclists CRASH STATISTICS FOR THE YEAR ENDED 31 DECEMBER 211 Prepared by the Ministry of Transport CRASH FACTSHEET 212 Cyclists have a number of risk factors that do not affect car drivers. The main risk
Most Dangerous Roads for Walking And How States Can Make them Safer. Route 110, Long Island, New York Image by Dougtone
 Most Dangerous Roads for Walking And How States Can Make them Safer Route 110, Long Island, New York Image by Dougtone Tri-State Transportation Campaign February 2013 Introduction Key Findings More than
AMATS Complete Streets Policy
 AMATS Complete Streets Policy Table of Contents: Section 1. Definition of Complete Streets Section 2. Principles of Complete Streets Section 3. Complete Streets Policy Section 4. Consistency Section 5.
Bicycle and Pedestrian Level of Service Evaluation
 Bicycle and Pedestrian Level of Service Evaluation June 214 Florida Department of Transportation Bicycle and Pedestrian Evaluation Prepared by Sprinkle Consulting Cambridge Systematics For the Florida
BIKE PLAN CONTENTS GATEWAY
 CONTENTS Acknowledgments...vii Great Rivers Greenway District Board of Directors... vii Great Rivers Greenway District Staff... vii Project Consultants... vii Committees... viii Citizens Advisory Committee
::~-~ w ANNUAL LIST OF PALM BEACH MPO PRIORITY PROJECTS FY Adopted July 20, '"',, - ==~"'c;;f'";~":?:'!""
 PALM BEACH MPO w ANNUAL LIST OF PRIORITY PROJECTS FY 2019-2023 Adopted July 20, 2017 ::~-~ '"',, - ==~"'c;;f'";~":?:'!"" ~~ Ch a r www. Pa Im M PO.org/p ri oriti es 2300 North Jog Road. 4th Floor.. FL.
FHWA Resources for Pedestrian and Bicycle Professionals
 FHWA Resources for Pedestrian and Bicycle Professionals Charlie Zegeer, UNC Highway Safety Research Center/PBIC Libby Thomas, UNC Highway Safety Research Center Dan Nabors, Vanasse Hangen Brustlin (VHB)
Florida Department of Transportation District Four. I-95 at 6 th Avenue Interchange Improvements FDOT PM - Fernando Morales, PE
 1 Florida Department of Transportation District Four I-95 at 6 th Avenue Interchange Improvements FDOT PM - Fernando Morales, PE Presentation Outline Overview of Planning and Programming I-95 Interchange
People killed and injured per million hours spent travelling, Motorcyclist Cyclist Driver Car / van passenger
 Cyclists CRASH FACTSHEET 27 CRASH STATISTICS FOR THE YEAR ENDED 31 DEC 26 Prepared by Strategy and Sustainability, Ministry of Transport Cyclists have a number of risk factors that do not affect car drivers.
motor vehicle collisions
 motor vehicle collisions 2017 2017 QUICK FACTS City of Edmonton motor vehicle collisions 2017 legal note The City of Edmonton provides this information in good faith but gives no warranty, nor accepts
Figure 1. Indiana fatal collisions by young driver involvement,
 INDIANA TRAFFIC SAFETY FACTS YOUNG DRIVERS 2016 MAY 2017 ISSUE 17-C06 IN 2016: In 2016, 13.4 percent of all drivers involved in Indiana collisions were young drivers. Young drivers were involved in 105
SR/CR A1A PEDESTRIAN SAFETY & MOBILITY STUDY RIVER TO SEA TRANSPORTATION PLANNING ORGANIZATION
 SR/CR A1A PEDESTRIAN SAFETY & MOBILITY STUDY RIVER TO SEA TRANSPORTATION PLANNING ORGANIZATION 2016 Florida Section ITE Annual Summer Meeting June 24, 2016 Today s Presenters Lois Bollenback Executive
NY Route 5 Comprehensive Pedestrian Safety Study: A Corridor Perspective CDTC Planning Committee. January 7, 2015
 NY Route 5 Comprehensive Pedestrian Safety Study: A Corridor Perspective CDTC Planning Committee January 7, 2015 Project Objective Study Scope: Perform an analysis of pedestrian related accidents, An engineering
2015 Florida Main Street Annual Conference. Complete Streets Equal Stronger Main Streets
 WHAT ARE COMPLETE STREETS? CASE STUDIES COMPLETING YOUR MAIN STREET 2015 Florida Main Street Annual Conference St. Petersburg, Florida August 19, 2015 WHAT ARE COMPLETE STREETS? CASE STUDIES COMPLETING
FLORIDA STRATEGIC HIGHWAY SAFETY PLAN
 FLORIDA STRATEGIC HIGHWAY SAFETY PLAN 1 FLORIDA STRATEGIC HIGHWAY SAFETY PLAN Presenter: Joe Santos State Safety Engineer FDOT State Safety Office 2 Presentation 3/28/2017 3 FLORIDA STRATEGIC HIGHWAY SAFETY
Chapter PERFORMANCE MEASURES AND ACCOUNTABILITY. Introduction
 PERFORMANCE MEASURES AND ACCOUNTABILITY Introduction Performance measures are helpful in evaluating the progress being made toward achieving the goals and objectives of the Gateway Bicycle Plan. The Plan
TSTC s analysis of federal transportation data reveals that in the three years from 2010 through 2012:
 THE REGION S Tri-State Region KEY FINDINGS TSTC s analysis of federal transportation data reveals that in the three years from through :, pedestrians lost their lives on Connecticut, Jersey and downstate
the Ministry of Transport is attributed as the source of the material
 Cyclists 2015 Disclaimer All reasonable endeavours are made to ensure the accuracy of the information in this report. However, the information is provided without warranties of any kind including accuracy,
2012 TOWN OF CASTLE ROCK MOTOR VEHICLE ACCIDENT FACTS PREPARED BY THE PUBLIC WORKS DEPARTMENT
 ATTACHMENT A 2012 TOWN OF CASTLE ROCK MOTOR VEHICLE ACCIDENT FACTS PREPARED BY THE PUBLIC WORKS DEPARTMENT ACKNOWLEDGEMENTS This report was assembled from data provided by the Castle Rock Police Department
PEDESTRIAN/BICYCLE CRASH STUDY
 PEDESTRIAN/BICYCLE CRASH STUDY This report summarizes an analysis of pedestrian and bicycle crashes that has been conducted by the CRCOG staff. In 2004, CRCOG completed a study of pedestrian crash data
Dear Mr. Tweed: Sincerely, Min Zhou, P.E. Vice President
 December 17, 2012 Mr. Steve Tweed City of Long Beach, Department of Public Works Traffic & Transportation Bureau, 10 th Floor City Hall 333 West Ocean Boulevard Long Beach, CA 90802 Subject: Broadway and
Pedestrian Safety Guide for Transit Agencies
 Pedestrian Safety Guide for Transit Agencies FDOT/FTPA/CUTR Professional Development Workshop June 15, 2010 1 Purpose Presentation Overview Bus Stop Location and Design Process/Partnership 2 Purpose Every
Road Diets FDOT Process
 Florida Department of TRANSPORTATION Road Diets FDOT Process Humberto Castillero, PE, PTOE Roadway Design Office Purpose of Guide Develop a statewide lane elimination review process Balance state & local
Lessons Learned from Cycle Tracks (Class IV Bikeways) Design Practice
 Design Practice") Lessons Learned from Cycle Tracks (Class IV Bikeways) Design Practice By: Min Zhou, P.E., Principal/Vice President KOA Corporation 1 What is a Cycle Track (Class IV) TYPICAL BIKEWAY CLASSIFICATION CLASS
Lessons Learned from Cycle Tracks (Class IV Bikeways) Design Practice By: Min Zhou, P.E., Principal/Vice President KOA Corporation 1 What is a Cycle Track (Class IV) TYPICAL BIKEWAY CLASSIFICATION CLASS
Bicycle - Motor Vehicle Collisions on Controlled Access Highways in Arizona
 Bicycle - Motor Vehicle Collisions on Controlled Access Highways in Arizona Analysis from January 1, 1991 to June 30, 2002 Richard C. Moeur, PE Traffic Design Manager, Northern Region Michelle N. Bina
2018 FTBA ANNUAL CONFERENCE FDOT WORK PROGRAM OVERVIEW BOCA RATON RESORT AND CLUB August 2-5, 2018
 Florida Department of TRANSPORTATION 2018 FTBA ANNUAL CONFERENCE FDOT WORK PROGRAM OVERVIEW BOCA RATON RESORT AND CLUB August 2-5, 2018 Mike Dew, Secretary FLORIDA S CONTINUED GROWTH Florida has currently
1000 FRIENDS OF FLORIDA PALM BEACH COUNTY 2070 OCTOBER 2018
 1000 FRIENDS OF FLORIDA PALM BEACH COUNTY 2070 OCTOBER 2018 HEALTHIER COMMUNITIES & BETTER ECONOMIES THROUGH COMPLETE STREETS PRESENTED BY TREASURE COAST REGIONAL PLANNING COUNCIL The Question of Safety
FEDERAL HIGHWAY ADMINISTRATION APPLICATION
 FEDERAL HIGHWAY ADMINISTRATION APPLICATION REQUEST FOR PERMISSION TO EXPERIMENT WITH A BICYCLE BOX INTERSECTION TREATMENT Submitted by: City of Columbus Department of Public Service Date: June 26, 2009
ADOT Statewide Bicycle and Pedestrian Program Summary of Phase IV Activities APPENDIX B PEDESTRIAN DEMAND INDEX
 ADOT Statewide Bicycle and Pedestrian Program Summary of Activities APPENDIX B PEDESTRIAN DEMAND INDEX May 24, 2009 Pedestrian Demand Index for State Highway Facilities Revised: May 29, 2007 Introduction
Chapter 2. Bellingham Bicycle Master Plan Chapter 2: Policies and Actions
 Chapter 2 Bellingham Bicycle Master Plan Chapter 2: Policies and Actions Chapter 2: Policies and Actions The Bicycle Master Plan provides a road map for making bicycling in Bellingham a viable transportation
Traffic Safety Plan Traffic Safety Plan 2015
 Traffic Safety Plan 2015 Purpose Airdrie s last Traffic Safety Plan was created in 2011. The 2015 Traffic Safety Plan is a revised model of the traffic operations for the City of Airdrie. The purpose of
Agenda. Overview PRINCE GEORGE S PLAZA METRO AREA PEDESTRIAN PLAN
 PRINCE GEORGE S PLAZA METRO AREA PEDESTRIAN PLAN May 28, 2008 Agenda Welcome and introductions Project overview and issue identification Planning context and strengths Design challenges and initial recommendations
Pedestrian & Bicycle Safety Innovations & Applications
 Pedestrian & Bicycle Safety Innovations & Applications County Engineers Association of Maryland Spring, 2017 Conference May 25, 2017 George Branyan Pedestrian Program Coordinator District Department of
MONTCLAIR TOWNSHIP PEDESTRIAN SAFETY COMMITTEE
 + MONTCLAIR TOWNSHIP PEDESTRIAN SAFETY COMMITTEE + PEDESTRIAN SAFETY COMMITTEE CURRENT MISSION: The Committee was formed in 2013 to call attention to and eliminate unsafe conditions on Montclair streets
Pinellas County Safety Initiatives
 Florida Department of TRANSPORTATION Pinellas County Safety Initiatives Whit Blanton, FAICP Pinellas County MPO A Distinctive County A unique geography Multi-jurisdictional Key demographics seniors and
Table of Content. Cyclist Injury Crashes APPENDIX GIS Heat Maps by Municipality P a g e
 Table of Content INTRODUCTION... 5 ALCOHOL... 6 Impaired Driving - Fatalities... 6 Youth Alcohol... 11 Youth Impaired Driving - Fatalities... 11 Alcohol-Impaired Driving Injury crashes... 16 SPEEDING &
CITY OF OAKLAND. 27th Street Bikeway Feasibility and Design. Final Report (v3) March 23, Kimley-Horn and Associates, Inc.
 March 23, Kimley-Horn and Associates, Inc.") CITY OF OAKLAND 27th Street Bikeway Feasibility and Design Final Report (v3) March 23, 2007 PREPARED BY: Kimley-Horn and Associates, Inc. Table of Contents 1. Introduction 3 2. 27 th Street/Bay Place Corridor
CITY OF OAKLAND 27th Street Bikeway Feasibility and Design Final Report (v3) March 23, 2007 PREPARED BY: Kimley-Horn and Associates, Inc. Table of Contents 1. Introduction 3 2. 27 th Street/Bay Place Corridor
Downtown BRT Corridor Alternatives Review: 1 st, 2 nd, 3 rd and 4 th Avenue. Bus Rapid and Conventional Transit Planning and Design Services
 Downtown BRT Corridor Alternatives Review: 1 st, 2 nd, 3 rd and 4 th Avenue Bus Rapid and Conventional Transit Planning and Design Services City of Saskatoon February 2018 Project Team HDR Corporation
Potential Factors Affecting Roadway Departure Crashes in Oahu, Hawaii
 Potential Factors Affecting Roadway Departure Crashes in Oahu, Hawaii Pasha Hashemi (1), Adrian Ricardo Archilla(2) (1)Graduate Research Assistant, Department of Civil and Environmental Engineering, University