FLORIDA S OCEANS AND COASTS: AN ECONOMIC AND CLUSTER ANALYSIS
|
|
|
- Barnaby Bond
- 5 years ago
- Views:
Transcription


1 FLORIDA S OCEANS AND COASTS: AN ECONOMIC AND CLUSTER ANALYSIS MAY 2013
2 ii
3 Table of Contents Preface List of Board Members Acknowledgments Executive Summary 1 Introduction..6 I. Economic Contribution of Florida s Oceans... 9 A. The Contribution of Ocean Resources to the Florida Economy... 9 B. Contribution by Industry C. Contribution to Coastal Metropolitan Areas D. Employment in the Ocean Economy E. Total Contribution, Including Indirect and Induced Effects.. 23 II. Ocean and Coastal Industries A Cluster Analysis A. Florida s Key Ocean Legacy Industries Economic Clout Location of Industry Clusters B. Overview/Discussion of Key Ocean Legacy Industries Tourism Seaports a. Cargo b. Cruise Lines Marine Industry a. Economic Impact of Recreational Boating Recreation Fishing Industry a. Recreational Fishing. 44 b. Commercial Fishing c. Florida Marine Aquaculture C. Other Industry Sectors The Defense Industry in Florida Marine Research a. Research Funding b. Ocean Observing c. Marine Biomedical Research d. Scientific Response to the Gulf Oil Spill Renewable Energy III. Methodology iii
4 Preface The Florida Ocean Alliance is a nonpartisan organization dedicated to bringing together the private sector, academia, and nonprofit research organizations in Florida to protect and enhance Florida s coastal and ocean resources for continued social and economic benefits. Recognizing the interconnection of Florida to its neighbors in the Caribbean Basin, along the Gulf of Mexico, and the Atlantic Coast, the Florida Ocean Alliance is committed to positioning Florida as an international leader to integrate ocean conservation, education, and responsible economic development. Private sector members include representatives from ocean-related industries in tourism, ports, shipping, cruising, recreational and commercial fishing, and recreational boating. Other members include representatives from nonprofit research organizations, academia, the ocean research community, and public interest groups. The Alliance serves as a clearinghouse for information on key ocean and coastal issues facing Florida. It monitors and publicizes actions related to the oceans and coasts. The Alliance focuses on outreach and educational activities for the public and policymakers, including conferences, papers on ocean and coastal policies, economic studies, and testimony to national or state agencies and commissions concerned with ocean or coastal policy. Each year the Alliance sponsors Florida Oceans Day in the State Capitol in Tallahassee. The Alliance was formed in late 1999 and evolved from the members participating in the Florida Governor's Ocean Committee. This group recognized the vital role of coastal and ocean resources to Florida's quality of life and economic vitality in their 1999 Final Report, available at: Additional information on the Alliance is available online at iv
5 Florida Ocean Alliance Board Members Steven M. Cernak (Chair) Florida Ports Council Michael W. Sole (Vice Chair) Florida Power & Light Company Karl E. Havens, Ph.D. (Secretary) Florida Sea Grant College Program Laura Geselbracht (Treasurer) The Nature Conservancy James Cantonis Acme Sponge & Chamois, Co. Duane E. De Freese, Ph.D. AquaFiber Technologies Corporation Richard Dodge, Ph.D. Nova Southeastern University Eric Draper Audubon Society Deborah Flack FL Shore & Beach Preservation Association Ken Haddad Florida Fish and Wildlife Conservation Commission, Retired Elaine Heldewier Carnival Cruise Lines Kristina Hebert Marine Industries Association of South Florida Bill Hogarth, Ph.D. Florida Institute of Oceanography Rob Kramer International Game Fish Association Margaret Leinen, Ph.D. Harbor Branch Oceanographic Institution Kumar Mahadevan, Ph.D. Mote Marine Laboratory George A. Maul, Ph.D. Florida Institute of Technology David L. McDonald McDonald, Miller & Coleman LLC James F. Murley, Esq. South Florida Regional Planning Council John Ogden, Ph.D. University of South Florida Jamie Picard Ocean Renewable Power Company LLC Ellen Prager, Ph.D. Earth2Ocean, Inc. Richard M. Pruitt Royal Caribbean Cruises Ltd. Mitchell Roffer, Ph.D. Roffer s Ocean Fishing Forecasting Service Jerry Sansom Organized Fishermen of Florida Anne Savage, Ph.D. Walt Disney Parks and Resorts Megan Stolen Hubbs-Sea World Research Institute Lenore Alpert, Ph.D. (Executive Director) Florida Ocean Alliance v
6 Acknowledgments The Florida Ocean Alliance gratefully acknowledges the support of Florida Sea Grant, Mote Scientific Foundation, and the Florida Institute of Oceanography for funding this initial effort to develop cluster mapping and update the economic impact of Florida s ocean and coastal industries. The Board of Directors of the Florida Ocean Alliance has guided the development and content of this report. The research effort was led by Dr. Lenore Alpert, Executive Director of the Florida Ocean Alliance, in collaboration with Dr. William B. Stronge, who prepared the economic study. Key research assistance was provided by Angela Grooms and Dr. Brian Johnson. vi
7 Executive Summary Florida s coastal counties contributed over $584 billion in gross regional product to Florida s economy in 2010, or 79% of the state s economy. More than 228,000 jobs in Florida are directly created by activities that use ocean resources. When indirect effects are taken into account, the number of jobs supported by ocean resources exceeds 440,000. In 2011, about one out of every twenty dollars worth of Florida s gross domestic product resulted from use of the state s ocean resources. Florida, as well as the nation, is looking for a future with low unemployment that is high in opportunity and that comes with a stable and growing economy. The oceans, coasts, and a wide variety of related industries play a critical role in this vision of Florida s future. Already, in setting national priorities, the importance of sustaining the productivity of the oceans has been recognized. 1 Specifically, these priorities advocate balancing the economic well-being of the nation derived from its oceans with the protection of the environments that provide those economic benefits. In Florida, the importance of this nexus between the state s economy and the ocean environment is of the utmost significance. Over 75 percent of the state s population resides in the 35 coastal counties that occupy only 57 percent of the land. 2 It is critical to maintain the productivity of the coastal oceans for the state s economy. The Florida Ocean Alliance highlights the connection between the health of the state s economy and the oceans by completing this economic study and cluster analysis of the industries linked to the oceans and coasts. In doing so, the Florida Ocean Alliance is essentially updating and expanding sections of an earlier 2008 economic study of Florida s ocean assets, focusing on the traditional ocean industries. 3 This study confines the estimation of the direct contributions of Florida s ocean industries to their impact on the coastal counties and estimates the contribution made by activities that use the ocean resources off the state s coast. As great budgetary uncertainty now exists, there are also new opportunities to explore in emerging technologies and energy. The information provided in this report will enable the state and its representatives to take full advantage of these opportunities and make the most of dwindling resources. 1 National Science and Technology Council, Subcommittee on Ocean Science and Technology, Science for an Ocean Nation: An Update of the Ocean Research Priorities Plan, February U.S. Census Bureau, 2010 Census, cited in 3 Florida Oceans and Coastal Council, Florida s Ocean and Coastal Economies Report, Prepared by Dr. Judith Kildow at Monterey Bay Aquarium Research Institute, June This update is a pilot study so is not intended to be as comprehensive as the earlier study, which relied on 2005 and 2006 datasets. We have relied primarily on 2010 and 2011 datasets and 2012 data as available. 1


8 FLORIDA S COASTAL ECONOMY Florida s oceans and coasts drive our economy. In 2010, Florida s coastal counties contributed over $584 billion in gross regional product to the state s economy, or 79% of Florida s economy. The Atlantic shoreline contributed $366 billion and the Gulf shoreline $218 billion. The coastal economy supported more than 440,000 jobs in the state in More than 60 percent were in the tourism industry, and 20.5 percent were in ocean transportation. The ocean economy made a total contribution of more than $35 billion in This amounted to 4.7% of the state s GDP. The total contribution was almost evenly divided between the direct contribution of $17.5 billion and the indirect plus induced contribution of $17.7 billion. Direct Contribution of Ocean Industries to Florida's Economy, 2011 ($ Billions) East Coast West Coast Panhandle Coast $5,097.6B 29% $1,003.1B 6% $11,414.3B 65% Total: $17,514.9B Total: $17,514.9B FLORIDA S OCEAN ECONOMY Ocean related industries include ocean tourism, seaports and ocean transportation, the marine industry, recreation, and fishing/living resources. Ocean industries directly and indirectly support 6 percent of jobs in Florida. 4 The estimates of total jobs were derived using the direct effects multipliers of the RIMS II Model. The direct effects multipliers were applied to the Bureau of Labor Statistics Quarterly Census of Employment and Wages (QCEW) employment data, which excludes independent contractors and the self-employed. 2

9 Florida s key ocean legacy industries include over 37,000 companies along Florida s coasts that employ over 228,000 employees. 5 The state s ocean resources directly created these thousands of jobs. More than 70 percent of the jobs in the ocean economy are in tourism. More than 60 percent of the jobs in the ocean economy are in the coastal counties along the state s East Coast, almost 30 percent are on the West Coast, and less than 10 percent are along the Panhandle Coast. In all three regions, tourism is the largest employer. Coastal transportation trails as the second largest source of ocean economy jobs along the state s East Coast, which contains the three largest cruise ports in the world and three of the top 20 container ports in the nation. The marine industry ranks as the second largest source of employment in the state s West Coast and Panhandle Coast. Direct Employment by Florida s Ocean Industries in Coastal Counties, 2011 DIRECT CONTRIBUTION TO OCEAN ECONOMY Economic activity directly created by Florida s ocean resources amounted to $17.5 billion in Of this, $8 billion was created by out of state ocean-oriented tourism, $6.3 billion was created by seaports/ocean transportation and its supporting activities, $1.8 billion was created by the marine industry, $1.1 billion was created by ocean-oriented recreation and $0.4 billion was created by the harvest, processing and distribution of the ocean s fishing/living resources. 6 5 Bureau of Labor Statistics Quarterly Census of Employment and Wages employment data, ES-202 data, Based on data from U.S. Bureau of Economic Analysis, 2010 Flash Estimates. 3

10 More than 65% of the economic activity was created along the state s East Coast; almost 30% was created along the state s West Coast (south from Taylor county in the Big Bend area), and a little more than 5% was created in the Panhandle region. Along Florida s East Coast, almost three-fourths of the contribution to Gross Regional Product from ocean industries to metropolitan economies is made in Southeast Florida (Miami-Fort Lauderdale MSA, including Palm Beach and Monroe counties); another 14.2% is contributed in the Jacksonville MSA, which includes Nassau and St. John counties. Along Florida s West Coast, more than 50 percent of the contributions to Gross Regional Product from ocean resources are made in the Tampa-St. Petersburg MSA; sizeable contributions (in excess of 10 percent) are also made in the North Port-Sarasota area (which includes Manatee County) and in the Cape Coral-Ft. Myers area. Along the Panhandle Coast, Fort Walton Beach and Panama City MSAs each account for approximately one-third of the contributions made by ocean resources to gross product; Pensacola- Santa Rosa accounts for one-fourth. INDUSTRY CLUSTERS A cluster analysis and mapping of industry sectors associated with the state s oceans and coasts is an essential prerequisite to preparing Florida for future policy discussions. The distribution of employees in coastal and ocean industries is generally concentrated in the populous areas located in six major counties along Florida s coasts Miami-Dade, Broward, Palm Beach counties in the southeast; Pinellas and Hillsborough in the southwest; and Duval county in the northeast. Other important counties are Monroe and Escambia counties for their fishing/living resources industry and Brevard county for its recreation industry. 4

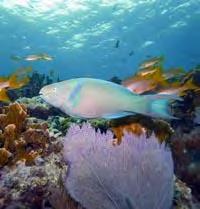
11 CONCLUSION Sustainable oceans and coastal ecosystems are the foundation for the quality of life of Florida residents, not only necessary to attract tourists to the Sunshine State, but also integrally important to economic recovery and sustainable growth. The health and sustainability of ocean and coastal ecosystems will determine the future of Florida s recreational and commercial fisheries, recreational boating and diving, beach-related recreation, tourism, nature observation and a myriad of other natural and societal values that are collectively worth hundreds of billions of dollars a year to the state s economy. 5
12 Introduction Florida, as well as the nation, is looking for a future with low unemployment that is high in opportunity and comes with a stable and growing economy. The ocean, coasts, and a wide variety of related industries play a critical role in this vision of Florida s future. Already, in setting national priorities, the importance of sustaining the productivity of the oceans has been recognized. 7 Specifically, these priorities advocate balancing the economic well-being of the nation derived from its oceans with the protection of the environments that provide those economic benefits. In the recently released National Ocean Policy Implementation Plan, the oceans and coasts were described as our Nation s most valuable resources and strongest economic drivers, with marine-related industries contributing $258 billion in gross domestic product to the national economy and 2.8 million jobs. 8 In Florida, the importance of this nexus between the state s economy and the ocean environment is of the utmost significance. Over 75 percent of the state s population resides in the 35 coastal counties that occupy only 57 percent of the land. 9 Florida is an ocean state. In this report, we highlight the connection between the health of the state s economy and the oceans by completing an economic study and cluster analysis of the industries linked to the oceans and coasts. In doing so, the Florida Ocean Alliance is essentially updating and expanding sections of an earlier 2008 economic study of Florida s ocean assets, focusing on the traditional ocean industries. 10 As great budgetary uncertainty now exists, there are also new opportunities to explore in emerging technologies and energy. The information provided in this report will enable the state and its representatives to take full advantage of these opportunities and make the most of dwindling resources. Unfortunately, the scale, diversity and economic value of Florida s ocean and coastal economies are not well known. Enterprise Florida Inc. (a public-private partnership serving as Florida s primary organization devoted to statewide economic development) has identified marine science as a strategic area of emphasis and emerging technology sector. The threads of the Florida ocean economy are woven both directly and indirectly throughout Florida s legacy industries (tourism, agriculture and construction) as well as Florida s leading industry clusters and strategic areas of emphasis recognized by Enterprise Florida Inc. These are listed below with select examples of ocean-related activities. 7 National Science and Technology Council, Subcommittee on Ocean Science and Technology, Science for an Ocean Nation: An Update of the Ocean Research Priorities Plan, February National Ocean Council, National Ocean Policy Implementation Plan, April 2013, p U.S. Census Bureau, 2010 Census, cited in 10 Florida Oceans and Coastal Council, Florida s Ocean and Coastal Economies Report, Prepared by Dr. Judith Kildow at Monterey Bay Aquarium Research Institute, June This update is a pilot study so is not intended to be as comprehensive as the earlier study by Kildow, which relied on 2005 and 2006 datasets. We have relied primarily on 2010 and 2011 datasets and 2012 data as available. 6
13 Florida Legacy Industries Tourism (ocean and coastal tourism, marine animal parks, marine and coastal recreation activities) Agriculture (aquaculture and mariculture) Construction (ship building, coastal construction and marine construction) Florida Leading Industry Clusters Cleantech (ocean energy, efficient ship design and advanced materials) Life Sciences (ocean research, marine pharmaceuticals, pollution mitigation) Information Technology (ocean and coastal sensor development, data acquisition, data analysis, ocean and coastal monitoring, mapping and modeling). Aviation and Aerospace (space-earth observation systems, remote observation vehicles, advanced composite development) Logistics and Distribution (ocean-related wholesale trade, transportation, training, logistics and distribution). Defense and Homeland Security (ocean and coastal safety and security) Financial/Professional Services (activities in banking, insurance, and a wide range of professional services associated with coastal and ocean activities and industries). Strategic Areas of Emphasis Manufacturing (advanced manufacturing of ocean and coastal related products like marine pharmaceuticals, advanced composites for ship building, marine instrumentation and even surfboards) Corporate Headquarters (relocation or expansion of large headquarters like SRI International) Emerging Technologies (material science, nanotechnology and marine science). Because of the large scale and diversity of sectors within the Florida ocean and coastal economy, the economic data and summaries provided in this report represent a conservative estimate of the true economic value of Florida s ocean economy. It contains estimates of the contribution to the economy of Florida made by activities that use the ocean resources off the state s coast. The activities include fishing, fish processing and distribution, marine construction, ship and boat building and repair, boat dealers and other parts of the marine industry, cargo transportation, passenger transportation (including cruising), nature parks, oceanoriented attractions and other recreation, and ocean-oriented tourism including 7
14 tourists drawn to the state s world famous beaches. There is no single industry that contains all these economic activities to estimate the contribution of ocean resources, it is necessary to extract parts of many industries that also contain businesses that are unrelated to the ocean. In this study, we will select detailed industries that are predominantly ocean-oriented following the methodology developed for the National Ocean Economics Program (NOEP). It has gradually been extended across additional states and has benefitted from the leadership of a large team of professional economists. By following the NOEP methodology, the results in this report are comparable to the studies that have been undertaken on the contribution of ocean resources to other states, and it can be viewed as an update of a previous NOEP Study of the Florida Ocean Economy conducted several years ago. 11 The definitions of the sub-industries used in this report will conflict with the definitions used in some other studies that have been made of individual Florida industries. For example, this report includes only commercial fishing in the fishing industry; other studies may include recreational fishing also, but this activity is included in recreation in this study. The same issues might arise in studies of the economic contribution of ports, of the cruise industry and of parks. Individual studies are likely to include tourism in the industry this study treats tourism as a separate industry. This report begins by providing estimates of the direct contribution made by ocean industries to the gross domestic products of the metropolitan coastal counties of Florida. A later section of the report will include indirect and induced contributions popularly called the ripple effects of the primary industries. Almost all of the East Coast of Florida lies in metropolitan statistical areas for which gross domestic product by broad industry groups are available. (Metropolitan Statistical Areas (MSAs) are groups of one or more counties which the Census Bureau determines form an independent metropolitan economy, comprise at least 50,000 people, and have a high degree of commuting among them.) The only East Coast county for which GDP estimates are not published by the US Bureau of Economic Analysis is Monroe County. Estimates have been made for this report using earnings data for the county and for the Miami MSA. GDP estimates are also available for the southern two-thirds of the West Coast of Florida, including the large Tampa-St. Petersburg MSA. Most of the Panhandle counties in the state s northwest also have gross domestic estimates. The exception is Walton County, which is included in the Crestview-Fort Walton Beach MSA, and Gulf and Franklin counties, which are very small counties that are east of Panama City. They are not included in the study. Four small counties north of the Tampa-St. Petersburg MSA are also not included, namely, Citrus, Levy, Dixie and Taylor counties. This study confines the estimation of the direct contributions of the ocean industries to their impact on the coastal counties. This is a conservative assumption because there may also be direct impacts by the interior counties in the state. For example, tourists staying in the interior counties may drive into a neighboring coastal county to partake of activities that use ocean resources. 11 Florida Oceans and Coastal Council, Florida s Ocean and Coastal Economies Report, Prepared by Dr. Judith Kildow at Monterey Bay Aquarium Research Institute, June


15 I. Economic Contribution of Florida s Oceans A. The Contribution of Ocean Resources to the Florida Economy The ocean waters off the coast of Florida are a major engine of economic activity in the state, as well as a beautiful natural resource. The ocean provides a habitat for a variety of living resources including fish, birds and turtles. Harvesting, processing and distributing the fish create jobs and increase the level of economic activity in the state. Construction of ocean infrastructure and marinas, as well as shipbuilding and repair, are key parts of the state s marine industry which creates jobs and incomes for many Florida residents. Ocean-oriented recreation, including scenic and sightseeing transportation, sales and rentals of recreational equipment, as well as ocean parks and amusement centers, also contributes to the state s economy. Transportation along the ocean waters also creates jobs and incomes in the state, and the use of the state s beaches and other resources by out of state tourists generates a large number of jobs, supporting the well-being of many Florida families and individuals. In 2010, Florida s coastal counties contributed over $584 billion in gross regional product to the state s economy, or 79% of Florida s economy. The Atlantic shoreline contributed $366 billion and the Gulf shoreline $218 billion Based on data from U.S. Bureau of Economic Analysis, 2010 Flash Estimates. 9
16 TABLE 1 Total Regional Values of Coastal Areas and Contribution to State Economy, 2010 Gross Regional Product % FL Total Florida Total $736,065,000, % Shoreline Areas $584,088,000,000 79% Atlantic Shoreline $366,188,000,000 50% Gulf Shoreline $217,900,000,000 29% Non Shoreline $151,977,000,000 21% In 2011, economic activity directly created by Florida s ocean resources amounted to $17.5 billion (See Table 2). Of this, $8 billion was created by out of state ocean-oriented tourism (45.6 percent), $6.3 billion was created by ocean transportation and its supporting activities (36 percent), $1.8 billion was created by the marine industry (10.1 percent), $1.1 billion was created by ocean-oriented recreation (6.2 percent), and $0.4 billion was created by the harvest, processing and distribution of the ocean s living resources (2.0 percent). TABLE 2 Direct Contribution of Florida Ocean Resources to the Gross Regional Product of the Florida Coastal Counties, 2011 Millions of Dollar Fishing/ Living Resources Marine Industry Seaports/Ocean Transportation Recreation Ocean- Oriented Tourism Total Percent East Coast , , , , West Coast , , , Panhandle , Total , , , , , Percent

17 9,000 8,000 7,000 6,000 Figure 2 Contribution of Florida Ocean Resources to the Gross Regional Product of the Florida Coastal Counties, 2011 ($Millions) $6,314.0B $7,984.8B $Millions 5,000 4,000 3,000 2,000 1,000 $350.7M $1,775.6B $1,089.8B 0 Fishing/Living Resources Marine Industry Seaports/Water Transportation Recreation Ocean Tourism 11
18 B. Contribution by Industry Aquaculture and fishing (in the coastal counties) contributed more than 58 percent of living resources to the gross regional product. About one-fourth was contributed by seafood processors. Seafood markets contributed 17.3 percent (See Table 3 and Figure 3). Figure 3 Total Fishing/Living Resources Contributions to Gross Regional Product, 2011 Seafood Markets, 17.3% $60.5M Seafood Processing, 24.0% $84.0M Aquaculture & Fishing, 58.8% $206.1M TABLE 3 Fishing/Living Resources Contribution to Gross Regional Product (Millions of Dollar) Industry Amount Percent Aquaculture & Fishing Seafood Processing Seafood Markets Total

. Figure 4 Total Marine Industry Contribution to Gross Regional Product, 2011 Marinas, 16.1% $285.")

19 Table 4 shows that ship and boat building and repair comprised the largest part of the marine industry (36.9 percent). Boat dealers contributed $446.8 million to coastal regional product (25.2 percent), and marine infrastructure construction accounted for more than 20 percent. Marinas amounted to $285.9 million (16.1 percent). Figure 4 Total Marine Industry Contribution to Gross Regional Product, 2011 Marinas, 16.1% $285.9M Marine Construction, 21.9% $388.2M Boat Dealers, 25.2% $446.8M Ship & Boat Building & Repair, 36.9% $654.8M TABLE 4 Marine Industry Contribution to Gross Regional Product Millions of Dollars Industry Amount Percent Marine Construction Ship & Boat Building & Repair Boat Dealers Marinas Total 1,


20 Coastal water transportation contributed $5.3 billion to gross regional product in 2011 (84.1 percent of the total contribution of ocean transportation) (See Table 5). Businesses supporting water transportation contributed an additional $928.1 million; warehousing and storage contributed $75.3 million. Figure 5 Total Seaports/Ocean Transportation Contribution to Gross Regional Product, 2011 Other Warehousing & Storage, 1.2% Support for Water Transportation, 14.7% Coastal Water Transportation, 84.1% TABLE 5 Seaports/Water Transportation Contribution to Gross Regional Product Millions of Dollars Industry Amount Percent Coastal Water Transportation 5, Support for Water Transportation Other Warehousing & Storage Total 6,
.")


21 Ocean-oriented recreation contributed $1,089.8 billion to gross regional product in 2011 (See Table 6). Rental of recreation goods accounted for the largest share (22 percent), with purchase of such goods accounting for an additional 5.8 percent. Amusement and recreation services accounted for 19.3 percent, and scenic and sightseeing transportation accounted for 15.5 percent. Parks, zoos and similar institutions accounted for most of the rest, with sports and recreation instruction and R.V. parks and campsites accounting for the remainder. Figure 6 Total Recreation Contribution to Gross Regional Product, 2011 R.V. Parks & Campsites 8.3% $90.8M Sports/Athletic Goods Sales 5.8% $62.8M Amusements & Recreation Services 19% $210.0M Recreation Goods Rentals 22.0% $239.5M Nature Parks and Other Institutions 11.1% $121.1M Zoos/Botanical Gardens 10.1% $110.1M Sports/Recreation Instruction 7.9% $86.3M Scenic/Sightseeing Transportation 15.5% $169.3M TABLE 6 Recreation Contribution to Gross Regional Product (Millions of Dollar) Industry Amount Percent Sports/Athletic Goods Sales Recreation Goods Rentals Scenic/Sightseeing Transportation Sports/Recreation Instruction Zoos/Botanical Gardens Nature Parks and Other Institutions Amusement & Recreation Services R.V. Parks & Campsites Total 1,
. Food services and drinking places accounted for $2.7 billion.")
22 Ocean-oriented tourism accounted for the largest contribution by Florida s ocean resources to the state economy, amounting to $8.0 billion in The accommodations industry accounted for the largest portion of this ($5.3 billion or 65.9 percent of the total). Food services and drinking places accounted for $2.7 billion. Figure 7 Total Ocean Tourism Contribution to Gross Regional Product, 2011 Food Services & Drinking Places 34.1% $2,719.7B Accommodations 65.9% $5,265.1B TABLE 7 Ocean Tourism Contribution to Gross Regional Product (Millions of Dollar) Industry Amount Percent Accommodations $5, Food Services & Drinking Places $2, Total $7,
23 C. Contribution to Coastal Metropolitan Areas More than 65 percent of the economic activity was created along the state s East Coast; almost 30 percent was created along the state s West Coast (south from Taylor county in the Big Bend area), and a little more than five percent was created in the Panhandle region (See Table 2 above). The contributions to the coastal metropolitan areas are presented in the tables below. Metropolitan Statistical Areas (MSAs) are groups of one or more counties which the Census Bureau determines form an independent metropolitan economy. Metropolitan areas comprise at least 50,000 people, and counties are grouped together if there is a high degree of commuting among them. Interdependence is based on the extent of commuting between the constituent counties. All of the counties in Florida s East Coast are parts of metropolitan areas, with the exception of Monroe County, which is included in the Miami-Fort Lauderdale MSA in the tables below. The East Coast of Florida comprises seven MSAs (Jacksonville, Palm Coast, Deltona-Daytona, Palm Bay-Melbourne, Sebastian-Vero, Port St. Lucie-Stuart, Miami-Fort Lauderdale). Palm Coast, Deltona-Daytona, Palm Bay-Melbourne, and Sebastian-Vero contain single counties as members. Port St. Lucie-Stuart contains two counties; Jacksonville MSA contains three coastal counties (Nassau, Duval and St. Johns) and two non-coastal counties (Baker and Clay). Miami-Fort Lauderdale also contains Palm Beach County; Monroe County is included for the purpose of this study. Estimates of Gross Regional Product (GRP) are produced by the US Bureau of Economic Analysis (BEA) for the metropolitan areas of Florida. The estimates are produced for industry aggregates, and they were scaled down to the micro industries of the ocean economy using detailed estimates of earnings and employee compensation, also produced by the US Bureau of Economic Analysis. Further detail on the methodology is provided at the end of this report. Almost three-fourths of the contribution to Gross Regional Product made by ocean resources to metropolitan economies along Florida s East Coast are made in Southeast Florida (the Miami-Fort Lauderdale MSA, including Palm Beach and Monroe Counties). Another 14.2 percent is contributed in the Jacksonville MSA, which includes Nassau and St. John counties. The contributions made to the other metro areas are each less than 5 percent of the East Coast total. Ocean tourism is the largest industry benefitting from ocean resources, followed by water transportation in all metro areas except Palm Bay-Melbourne, where the two industries switch their ranking. 17
24 Figure 8 East Coast Total Contribution of Florida Ocean Resources to the Gross Regional Product, 2011 (Millions of Dollar) $4,163.7B $5,374.0B $Million $1,061.3B $673.1M $142.1M 0 Fishing/Living Resources Marine Industry Seaports/Water Transportation Recreation Ocean Tourism East Coast Total MSAs arrayed From North to South TABLE Contribution Of Florida Ocean Resources to the Gross Regional Product of the Florida East Coast Metropolitan Statistical Areas (MSAs) (Millions of Dollar) Fishing/ Living Resources Marine Industry Seaports/ Water Transportation Recreation Ocean Tourism Total Percent Jacksonville* , Palm Coast-Flagler Deltona-Daytona Palm Bay-Melbourne Sebastian-Vero Port St. Lucie-Stuart Miami -Ft. Lauderdale , , , East Coast Total , , , , Percent *Includes Nassau and St. Johns counties ** Includes Palm Beach and Monroe counties 18
25 The West Coast of Florida comprises five MSAs (Tampa-St. Petersburg, North Port-Sarasota, Punta Gorda, Cape Coral and Naples) as well as the nonmetro counties along its northern part (Taylor, Dixie, Levy and Citrus). Tampa-St. Petersburg MSA contains four counties (Hernando, Pasco, Pinellas, Hillsborough) and North Port-Sarasota contains Manatee and Sarasota counties. Punta Gorda, Cape Coral and Naples MSAs each contain a single county Figure 9 West Coast Total Contribution of Florida Ocean Resources to the Gross Regional Product, 2011 Millions of Dollars $1,984.9B $2,086.5B $Million $184.4M $544.7M $297.0M 0 Fishing/Living Resources Marine Industry Seaports/Water Transportation Recreation Ocean Tourism West Coast Total MSAs arrayed From North to South TABLE Contribution Of Florida Ocean Resources to the Gross Regional Product of the Florida West Coast Metropolitan Statistical Areas (Millions of Dollars) Fishing/ Living Resources Marine Industry Seaports/ Water Transportation Recreation Ocean Tourism Total Percent Non-Metro North* Tampa-St , , Petersburg North Port-Sarasota Punta Gorda Cape Coral Ft. Myers Naples West Coast , , , Percent * including Taylor, Dixie, Levy and Citrus counties. 19
26 More than 50 percent of the contribution to Gross Regional Product made by ocean resources to metropolitan economies along Florida s West Coast is made in the Tampa-St. Petersburg MSA. Sizeable contributions (in excess of 10 percent) are also made in the North Port-Sarasota area (which includes Manatee County) and in the Cape Coral-Ft. Myers area. The remaining areas, including Punta Gorda MSA, Naples MSA, and the northern non-metropolitan area make contributions of less than 10 percent. Ocean tourism is the largest industry benefitting from ocean resources, followed by water transportation in Tampa-St. Petersburg, Cape Coral- Ft. Myers, Naples and the Non-Metro North. In North Port-Sarasota and Punta Gorda, the two industries switch their ranking. The Panhandle Coast in the state s northwest comprises four MSAs (Pensacola-Santa Rosa, Ft. Walton Beach, Panama City and Tallahassee), as well as the non-metro counties in the east (Gulf and Franklin counties). The Pensacola MSA comprises two counties and the Tallahassee MSA comprises four counties (the coastal counties of Wakulla and Jefferson, and the larger non-coastal counties of Leon and Gadsden). Both Panama City Beach and Panama City MSAs consist of single counties, although Walton is included in the latter for the purposes of this study. 600 Figure 10 Panhandle Coast Total Contribution of Florida Ocean Resources to the Gross Regional Product, 2011 (Millions of Dollars) $524.2M $Million $169.7M $165.3M $119.7M 100 $24.2M 0 Fishing/Living Resources Marine Industry Seaports/Water Transportation Recreation Ocean Tourism Panhandle Coast Total 20
27 TABLE Contribution Of Florida Ocean Resources to the Gross Regional Product of the Florida Panhandle Metropolitan Statistical Areas (Millions of Dollars) MSAs arrayed Fishing/Living Marine Seaports/Water From North to South Resources Industry Transportation Recreation Ocean Tourism Total Percent Pensacola Santa Rosa Ft. Walton* Panama City Tallahassee Non-Metro East** Panhandle Coast , Percent * including Walton County ** including Gulf and Franklin counties Fort Walton Beach and Panama City MSAs each account for approximately one-third of the contributions made by ocean resources to gross regional product along the Panhandle Coast; Pensacola-Santa Rosa accounts for one-fourth. The contributions by the Tallahassee MSA and the Non-Metro East are each less than 4 percent. Ocean tourism is the largest industry benefitting from ocean resources in the four metro areas; water transportation is the most important in the Non-Metro Eastern area. The Marine Industry is a slightly more important beneficiary of ocean resources along the Panhandle Coast than is Water Transportation. D. Employment in the Ocean Economy In 2011, Floridians held 228,555 jobs that were directly created by the state s ocean resources. These jobs represent employees covered by the state s unemployment compensation law and exclude independent contractors or selfemployed persons. Because individuals may hold more than one job, the 228,555 figure is probably a little larger than the number of job holders. 21
28 Figure 11 Employment in the Florida Ocean Economy (Number of Jobs) 165, ,985 Fishing/Living Resources 21,121 21,224 Marine Industry Seaports/Water Transportation 17,835 Recreation Ocean Tourism Coastal Counties Total Coastal Region Fishing/Living Resources TABLE 11 Employment in the Florida Ocean Economy Marine Industry Seaports/Water Transportation Recreation Industry Ocean Tourism Total Percent East Coast ,975 18,646 10, , , West Coast 1,573 6,970 2,165 5,609 48,162 64, Panhandle 483 2, ,061 12,850 17, Coastal Counties 2,985 21,121 21,224 17, , , Percent More than 70 percent of the jobs in the ocean economy (165,390) are in tourism, defined as accommodations and food services and drinking places. Most tourism jobs in the state s coastal counties are not part of the coastal economy. This analysis assumes that 25 percent of the jobs in food services and drinking places are ocean-related while 75 percent of the jobs in accommodations (the smallest part of the tourism industry) are treated as ocean-related. Coastal transportation and supporting activities account for 9.3 percent of the jobs in the ocean economy (21,224), and the marine industry accounts for 9.2 percent (21,121). 22
 are along the Panhandle Coast. In all three regions, more than 70 percent of the jobs are in the tourism industry.")


29 More than 60 percent of the jobs in the ocean economy (146,000) are in the coastal counties along the state s East Coast; almost 30 percent (64,000) are on the West Coast, and less than 10 percent (18,000) are along the Panhandle Coast. In all three regions, more than 70 percent of the jobs are in the tourism industry. Coastal transportation is the second largest source of ocean economy jobs along the state s East Coast which contains the three largest cruise ports in the world. The marine industry is the second largest source of employment in the state s West and Panhandle coasts. E. Total Contribution, Including Indirect and Induced Effects The direct contribution of the ocean economy is supplemented by the contribution of ocean industries to the production of the industries that supply them with materials and other inputs and by the additional suppliers back along the supply chain. These are known as the indirect effects of the ocean industries. There is an additional effect as the employees in the ocean industries and the industries in the various supply chains expend their earnings, and consumer goods industries expand their production. These are referred to as the induced effects of the ocean economy. Table 12 shows the total contribution of the ocean industries to Florida GDP, including the direct, indirect and induced effects. The total and indirect and induced effects were estimated using multipliers obtained from The RIMS II Model of Florida produced by the US Bureau of Economic Analysis. The RIMS II Model was based on the national input-output model, based on 2002 benchmark data scaled down to Florida conditions using 2008 Florida data. Figure 12 Ocean Economy Contribution to Florida GDP in 2011 Fishing/Living Resources 1.7% $607.7M Marine Industry 10.3% $3,605.0B Tourism 44.3% $15,590.7B Seaports/Water Transport 37.1% $13,051.8B Recreation 6.6% $2,309.8B 23
30 TABLE 12 Ocean Economy Total Contribution to Florida GDP in 2011 (Millions of Dollars) Direct Contribution Indirect & Induced Total Percent Multipliers (Total/Direct) Fishing/Living $350.7 $257.0 $ Resources Marine Industry 1, , , Seaports/Water 6, , , Transportation Recreation 1, , , Ocean Tourism 7, , , Total $17,514.9 $17,650.1 $35, Percent The ocean economy made a total contribution of more than $35 billion in This amounted to 4.7 percent of the state s GDP. The total contribution was almost evenly divided between the direct contribution of $17.5 billion and the indirect plus induced contribution of $17.7 billion. The tourism industry was the largest contributor, followed by transportation. The multipliers for the various industries were similar in size (close to 2.00), except for living resources, which had a multiplier of Recreation and transportation had the largest multipliers (2.12 and 2.07), and the marine industry and tourism had the smallest multipliers (2.03 and 1.95), other than living resources. Number of Jobs Figure 13 Coastal Economy Total Contribution to Florida Employment in 2011 Number of Jobs 6,307 Fishing/Living Resources 41,637 90,383 Marine Industry Seaports/Water Transportation Total Jobs: 440,820 33,674 Recreation 268,818 Ocean Tourism 24
31 TABLE 13 Ocean Economy Total Contribution to Florida Employment in 2011 (Number of Jobs) Direct Indirect & Induced Total Percent Fishing/Living 2,985 3,323 6, Resources Marine 21,121 20,516 41, Industry Seaports/Water 21,224 69,158 90, Transportation Recreation 17,835 15,839 33, Ocean Tourism 165, , , Total 228, , , Percent The coastal economy supported more than 440,000 jobs in the state in More than 60 percent were in the tourism industry and 20.5 percent were in ocean transportation. Development agencies of the State of Florida (Enterprise Florida Inc. and Workforce Florida Inc.) recognized the economic growth and job creation potential of Florida s emerging clean tech industry cluster. Florida s ocean and coastal industries have significant connections and alignment to the clean tech industry cluster. This creates an opportunity to highlight the State s diverse coastal and marine industries. The cluster analysis and mapping of industry sectors associated with the state s oceans and coasts is an essential prerequisite to preparing Florida for future policy discussions. We begin with an overview of the key ocean legacy industries ocean tourism (hospitality), seaports (water transportation and warehousing), marine industry (recreational boating), recreation, and fishing (living resources). 13 The estimates of total jobs were derived using the direct effects multipliers of the RIMS II Model. The direct effects multipliers were applied to the BLS QCEW employment data which excludes independent contractors and the self-employed. 25
32 I. Ocean and Coastal Industries A Cluster Analysis A. Florida s Key Ocean Legacy Industries 1. Economic Clout In 2011, Florida s key ocean legacy industries ocean tourism, seaports (water transportation and warehousing), marine industry (recreational boating), recreation, and fishing (living resources) contributed over $6.2 billion in direct wages to the state s coastal and ocean economy. The overall impact is even greater when adding indirect and induced impacts to the direct payments. We found that 37,565 companies in these industries along Florida s coasts employed 228,555 employees in $4,000,000,000 $3,500,000,000 Figure 14 Comparison of Wages in Florida's Major Ocean and Coastal Industries in Florida's Coastal Counties, 2011 $3.6 B $3,000,000,000 $2,500,000,000 $Billion $2,000,000,000 $1,500,000,000 $1.2 B $1,000,000,000 $889 M $500,000,000 $0 Ocean Tourism Seaports/Water Transportation and Warehousing Marine Industry $460 M Recreation $94 M Fishing/Living Resources 14 Bureau of Labor Statistics, Quarterly Census of Employment and Wages, ES-202 data,

33 Table 14 Comparison of Florida s Major Ocean and Coastal Industries in Florida s Coastal Counties, 2011 Estimated Establishments Percentage Employees Percentage Wages Percentage Subtotals Industries Tourism/Ocean 31, % 165, % $3,605,303, % Seaports/Water % 21, % $1,165,809, % Transportation and Warehousing Marine Industry 2, % 21, % $888,627, % Recreation 2, % 17, % $459,964, % Fishing/Living 1.1% 1.3% 1.5% Resources 419 2,985 $93,681,141 Total 37, % 228, % $6,213,385, % Among these industries, ocean tourism contributed the most wages, or $3.6 billion, in 2011, and employed 165,390 employees. Seaports (water transportation), at $1.2 billion in wages, and marine industries, at $888 million, employed fewer employees at 21,000 each, but paid higher wages to those they employ. Recreation paid 17,835 employees a total of $460 million, and the fishing industry paid 2,985 employees $94 million Ibid. 27
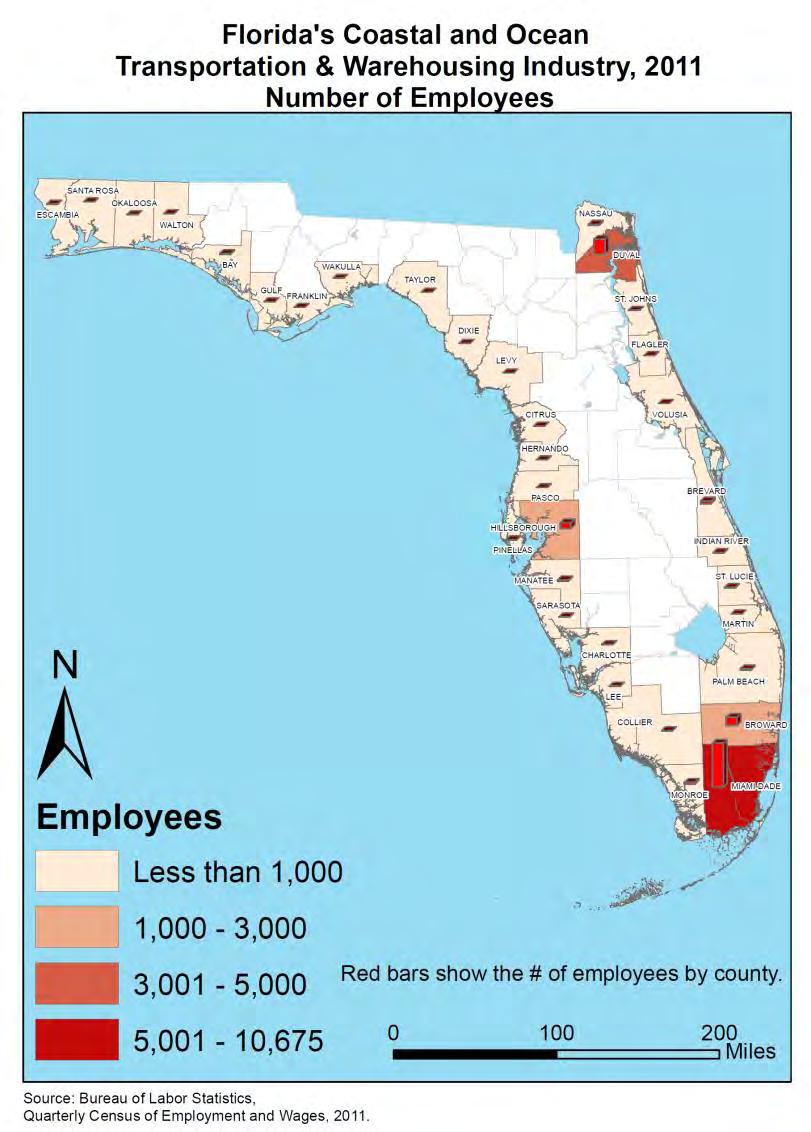
34 2. Location of Industry Clusters The population of Florida s coastal region is higher in major metropolitan areas of the state. Not surprisingly, the distribution of employees in coastal and ocean industries is generally concentrated in these populous areas in six major counties along Florida s coasts Miami-Dade, Broward, Palm Beach counties in the southeast, Pinellas and Hillsborough in the southwest, and Duval county in the northeast. Exceptions are the fishing/living resources industry, where Monroe and Escambia counties are in the top tier, and recreation, where Brevard is in the top tier. Map 1 28
35 Table 15 Employment in Top Florida Counties for Ocean and Coastal Industries, 2011 (Number of Employees) Ocean Tourism Seaports/Water Transportation Marine Industry Recreation Fishing/ Living Resources Counties Rank # Rank # Rank # Rank # Rank # Miami-Dade 1 34, , , , Broward 2 19, , , ,471 * * Palm Beach 3 16,355 * * 6 1, ,621 * * Hillsborough 4 12, , , , Pinellas 5 11,272 * * 5 1, , Duval 6 10, , ,739 * * * * Monroe * * * * * * * * Escambia * * * * * * * * Brevard * * * * * * 6 1,031 * * *Not ranked in top tier Source: Bureau of Labor Statistics, Quarterly Census of Employment and Wages, 2011 The distribution of jobs among Florida s coastal counties for each ocean legacy industry is shown in Maps 2-6. Additional cluster maps for each industry sector s wages are shown in the Appendices. The same areas of the state generally show the highest concentration of jobs and wages for the ocean industries, albeit with some individual variation. As shown in Table 15, Miami-Dade County ranks number one for employment in three sectors ocean tourism, seaports/water transportation, and recreation. Broward County ranks number one for marine industry employment, and Hillsborough County is number one for fishing/living resources. Strong ocean industry employment for select sectors is also found in six other counties Palm Beach, Pinellas, Duval, Monroe, Escambia and Brevard counties. These top six counties are also ranked among the top 50 counties in the nation for their GDP ocean economy contribution in 2009 and their level of oceanrelated employment in a recent study by the National Working Waterfront Network. 16 Miami-Dade, Pinellas, Broward, Palm Beach, Hillsborough, and Duval counties all rank in the top half of 50 counties nationwide rated highest for their ocean-related economic contributions. Florida ranks number 2 nationally among 30 coastal states for total economic contributions of its ocean-related industries. 16 Accessed at Tables 7 and 8. Lee County is also ranked #50 in the list. Differences among the actual numbers from this report may be due to methodology differences in the studies, such as differing years of data and multipliers used. The study was released May 2, 2013, but used 2009 data. 29

36 Map 2 Map 3 30

37 Map 4 Map 5 31

38 Map 6 It is logical to assume that since there is industry concentration in the populous areas of the state, there is room for growth for some industry sectors as Florida s population shifts into the less populated areas. This growth will obviously be limited by locations of businesses, such as in ports for marine transportation. Noteworthy are developing industries, such as renewable energy, that are not included in this analysis and that are beginning to expand in Florida. B. Overview and Discussion of Key Ocean Legacy Industries 1. Tourism Tourism is making waves for Florida s economy. The state s tourism market is no longer in decline but in recovery mode after the economic downturn of The latest numbers from Visit Florida indicate that 89.3 million tourists visited Florida in This makes 2012 a banner year, with over two million more visitors than
39 Tourists visit coastal areas, including over 63% who visit Orlando and its attractions. That is good news for the state s economy, which relies on the sales tax revenues from tourism and the jobs it creates in the hospitality industry. In 2011, Visit Florida reports that tourists spent $67.2 billion in Florida, contributed $4 billion to the sales tax coffers of the state, and employed over a million in the tourism industry. This represents nearly a quarter of the state sales tax revenue. Because this part of sales tax is paid by visitors, it does not burden Floridians with additional taxes. Visit Florida also claims that every $1 spent on tourism results in $258 in tourism spending and $15 in new sales tax collections. Preliminary estimates for 2012 are $71.8 billion in visitor spending. 17 The figures below track the economic impact of visitor increases to Florida since 2002, reflecting an upward trend since 2009 in tourism visitation and spending, accompanied by increased employment in the tourism industry. Figure Visitors to Florida, (in millions) Millions Visit Florida Research, 2012, accessed at 33
40 Figure 17 Total Tourism Spending: Tourism/Recreation Taxable Sales $Billions $80 $70 $60 $51 $52 $57 $62 $65 $66 $65 $61 $63 $67 $72 $50 $40 $30 $20 $10 $ Source: Visit Florida Research, 2012, accessed at Figure 18 1,050,000 1,000, ,000 Total Tourism Industry Employees, ,007, , , , , , ,700 1,030,600 1,013, , , , , , , Source: Visit Florida Research, 2012, accessed at 34

41 2. Seaports (Marine Transportation) a. Cargo Florida s fifteen deepwater ports are a critical part of the state s economy. The state s ranking as sixth among the nation s exporting states in 2012 reinforces this fact. Florida ports moved million tons of cargo, with waterborne international trade valued at $85.6 billion in 2012, slightly over half of Florida s $162.2 billion total international trade. The exports and imports were split in waterborne international trade at $71 billion in imports and $90 billion in exports, resulting in a $19 billion trade surplus. Cargo activities generated over 550 thousand direct and indirect jobs for Florida and $90.3 billion in total economic value, including $2.2 billion in state and local tax revenues. Key cargo ports are PortMiami, Port Everglades, JAXPORT and the Port of Palm Beach, ranking among the nation s top 20 container ports. Along with Port of Tampa, these seaports handled 87.8 million tons of cargo in FY 2012, including international and domestic cargo, which represents 87% of the state s cargo handled at all Florida ports. The national average wage for seaport-related employment is higher than the average wage, at $54,400 annually. 18 Map 7 Florida Seaports Source: 18 Florida Seaport Transportation and Economic Development Council, May 2013, The Statewide Economic Impacts of Florida Public Seaports, 2012, by Martin Associates. Florida Ports Council, Florida Seaports: Charting Our Future, Fast Facts,
42 Table 16 Economic Impact of Florida s Ports, 2011 Seaport # of Jobs Economic Impact Port Canaveral 17,000 $2,200,000,000 Port Everglades 160,673 $15,286,991,000 Port of Jacksonville 65,000 $19,000,000,000 Port Manatee 24,000 $2,380,202,000 PortMiami 207,000 $27,000,000,000 Port of Palm Beach 2,850 $261,000,000 Port Panama City 10,863 $1,442,468,000 Port of Tampa 100,000 $8,000,000,000 Total 587,386 $75,571,480,000 Table 17 Comparison of Cargo and Cruise Employment in Florida Ports Florida Ports Total # of Jobs Economic Impact Cargo only 554,347 $66,330,535,000 Cruise only 130,950 $13,800,000,000 Total 685,297 $80,130,535,000 Note: Totals are for cargo and cruise. Cruise ports include Port Canaveral, Port Everglades, PortMiami, and Port of Tampa. Totals for the eight ports represent 94% of the economic impact for the state s ports and 86% of employees. Data available for cruise traffic in individual ports report nearly 4 million multi-day cruise passengers per port in PortMiami, Port Canaveral, and Port Everglades for FY 2011/2012. Sources: Florida Seaport Transportation and Economic Development Council, Florida Seaports: Charting our Future: The Five Year Florida Seaport Mission Plan, Data for FY 2011/2012. Statewide Economic Impact of Maritime Cargo Handled at Florida s Public Seaports, 2008, Port Everglades FY 2011 Commerce Report, Prepared for Florida Ports Council by Martin Associates, p. 28. The 2009 Economic Impact of Port Canaveral, May 2010, Prepared for Florida Ports Council by Martin Associates, p. 1. Port Canaveral 2012 data provided by Roslyn Harvey. pb.pdf (2007 data) (2009 data) (2009 data) (2009 data from Steve Tyndall and website) (2012 data from Final Report, The Local and Regional Economic Impacts of Port Panama City, April 5, 2013, prepared by Martin Associates) Florida data: The Statewide Economic Impacts of Florida Public Seaports, 2012, prepared for Florida Seaport Transportation and Economic Development Council, May 2013, by Martin Associates. The Statewide Economic Impacts of Maritime Cargo Handled at Florida s Public Seaports 2008, Final Report, March 30, Prepared for Florida Ports Council by Martin Associates, p. 4. Personal Communication with Bob Sharak, Cruise Lines International Association, October
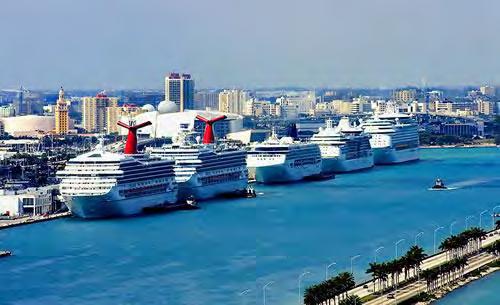
43 b. Cruise Lines Cruise lines are an important component of the seaports economic impact, housing corporate and administrative offices of the top cruise lines. Florida is known as the cruise capital of the nation, ranking first in cruise industry direct expenditures, at $6.7 billion. Florida operations generate 60 percent (or nearly 6 million) of all U.S. cruise embarkations, with nearly 14 million passengers embarking and disembarking in the state s seaports in FY This includes cruise locations at PortMiami, Port Everglades, Port Canaveral, which are the top ranked cruise ports in the nation, and Port of Tampa, ranked 6th. In 2012, the cruise lines total economic output in Florida was $13.8 billion, about a third of the nation s cruise output. Wages and salaries contributed $5.76 billion to the state s economy and 130,950 jobs for Floridians. 19 Table 18 Economic Impact of the Cruise Industry in Florida, 2011 Direct Economic Impacts Florida Share of US Direct Cruise Industry Expenditures ($Billions) $ % Employment 56, % Wages and Salaries ($Billions) $ % Total Economic Impacts Total Output ($Billions) $ % Employment 130, % Wages and Salaries ($Billions) $ % Source: Cruise Lines International Association (CLIA), The Contribution of the North American Cruise Industry to the United States Economy in 2011, prepared by Business Research and Economic Advisors. Personal communication with Bob Sharak, CLIA, October CLIA, Economic Benefit of the Cruise Industry in Florida (2011), figures prepared by Business Research and Economic Advisors. 3. Marine Industry a. The Economic Impact of Recreational Boating Activity Florida is a boating paradise and the number one destination in the nation for saltwater boating, accounting for 21% of all saltwater boating activity in the U.S. An estimated 4.2 million people participate in boating each year, with the average boater spending 30 days on the water, resulting in 22 million trips per year. 19 Cruise Lines International Association (CLIA), The Contribution of the North American Cruise Industry to the United States Economy in 2011, prepared by Business Research and Economic Advisors. 37
44 There are over a million registered boats in Florida, plus an estimated 300 thousand boats visiting annually. 20 The importance of recreational boating to Florida s economy is underscored in a study by the Florida Fish and Wildlife Conservation Commission (FWC). That study found that the combined economic impact of trip and craft-related direct spending of $9.01 billion by recreational boaters to the Florida economy in 2007 is over 97,000 jobs, $3.1 billion in labor income, $726 million of indirect business taxes and $5.3 billion of value added. 21 The Marine Industries Association of Florida estimates a total economic output of the recreational boating industry statewide at $18.9 billion and 220,000 jobs. 22 Because the FWC study only included boats registered in Florida, it overlooks expenditures by non-florida yachts, such as international megayachts that frequent Florida waters and retrofit in local boatyards, which is significant in south Florida and other areas. (It is estimated that 1,500 megayachts visited south Florida in 2006, spending up to $500,000 per visit.) South Florida tops the industry s sales among the regions of the state at $1.7 billion, followed by southwest Florida, the Tampa Bay area, and southeast Florida. Boating brings 56,000 jobs to these four regions, nearly 60% of the industry s jobs. According to a study by the Marine Industries Association of South Florida in 2010, the tri county area of Miami-Dade, Broward, and Palm Beach counties contributed over 100 thousand jobs to the state s economy in fiscal year 2010, with wage income over $3 billion and nearly $9 billion in total output. Gross retail sales of boat and motor products was $3.5 billion statewide, with the tri county area accounting for 49% of those sales. 23 Table 19 Economic Impact of Marine Industry in Miami-Dade, Broward, and Palm Beach Counties (FY2010) Total Jobs Wage Income Total Output Broward County 92,832 $2,593,962,110 $7,440,152,206 Miami-Dade County 5,476 $195,932,393 $540,982,000 Palm Beach County 8,931 $334,400,500 $923,301,392 Total Tri-County Areas 107,239 $3,124,295,003 $8,904,435,598 Source: Marine Industries Association of South Florida, Economic Impact of the Recreational Marine Industry Broward, Dade, and Palm Beach Counties, Florida 2010, pp. iv-v, pp Fish and Wildlife Conservation Commission (FWC), Managing the Balancing Act: Recreational Boating Access and Protecting Submerged Land Resources, 2010, accessed at 21 Florida Fish and Wildlife Conservation Commission, Florida Boating Access Facilities Inventory and Economic Study Report, August 30, 2009, p Marine Industries Association of Florida, Boating is Big Business, 2005, adjusted through November 2008 by FWC. Accessed February 13, 2010, at See also, Thomas J. Murray & Associates, Economic Impact of the Recreational Marine Industry: Broward, Dade and Palm Beach Counties, Florida 2005, Marine Industries Association of South Florida, Ft. Lauderdale, FL, Marine Industries Association of South Florida, Economic Impact of the Recreational marine Industry Broward, Dade, and Palm Beach Counties, Florida 2010, pp. iv, v,
45 Table 20 Impact of Recreational Boater Spending on Florida s Economy, 2007 Region Sales Labor Income Value Added Jobs South $1.72 Billion $592 Million $1.01 Billion 18,095 Southwest $1.31 Billion $463 Million $790 Million 14,530 West Central $1.09 Billion $371 Million $640 Million 12,149 East Central $1.08 Billion $375 Million $645 Million 12,008 Southeast $869 Million $306 Million $528 Million 9,315 Northeast $642 Million $218 Million $376 Million 7,056 West Panhandle $559 Million $192 Million $329 Million 7,123 North Central $545 Million $181 Million $309 Million 7,529 Central Panhandle $207 Million $71 Million $120 Million 2,868 Statewide $9.01 Billion $3.10 Billion $5.32 Billion 97,112 Source: FWC, 2009, Appendices and Executive Summary: Florida Boating Access Facilities Inventory and Economic Study Report, p. 129, Table Note: The regions include some inland counties, except for the southeast and southwest regions, so this economic study involves not only coastal boating, but also boating activity on inland lakes. The south inland region is totally inland so is omitted from this chart. Totals for Florida include this inland region. County data are not reported in the FWC study, but only regional data. Regional totals will not sum to state totals due to multipliers at regional level. 39

46 Map 8 Source: Florida Department of Environmental Protection (FDEP), Florida Boating Access Facilities Inventory and Economic Study Report, August 30, 2009, p

47 Map 9 Source: Florida Department of Environmental Protection (FDEP), Florida Boating Access Facilities Inventory and Economic Study Report, August 30, 2009, p
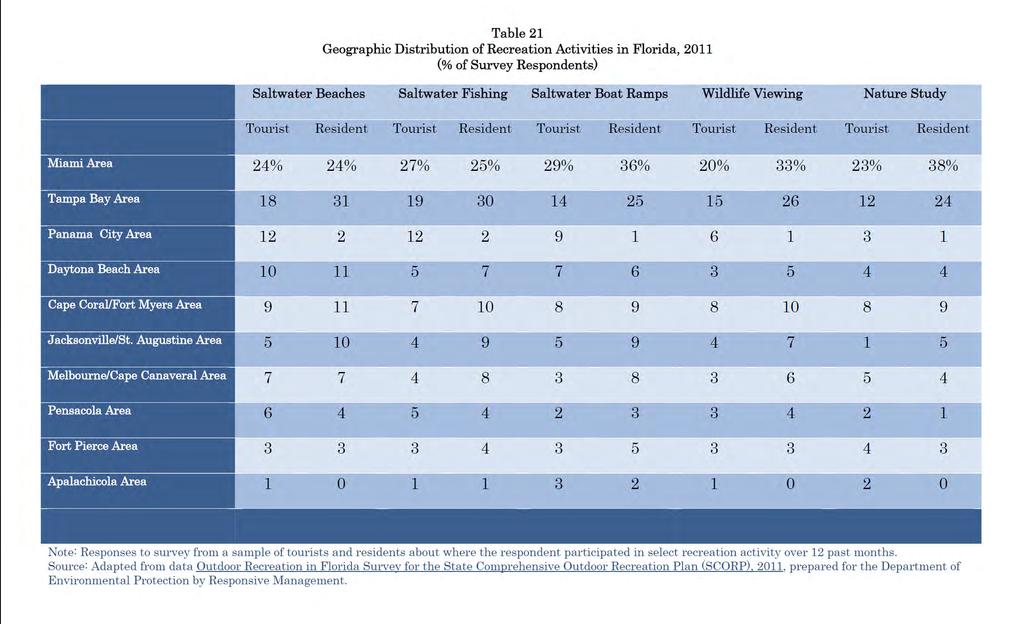
48 4. Recreation Outdoor recreation is big business in Florida. An estimated 86.5 million visitors visited the state in The overwhelming reason for tourists visiting Florida is the appeal of recreation and leisure options that the state offers through its oceans, beaches, and parks. The state s tourism industry generated $67.2 billion of expenditures in 2011 and more than one million jobs. 24 The direct economic impact of the state s park system was $970 million to local economies in fiscal year 2010/2011 and 19,347 jobs. This economic impact included $61 million in state sales taxes. 25 The array of coastal activities includes saltwater beaches, saltwater fishing, saltwater boat ramps, wildlife viewing and nature study. Surveys conducted for the Florida Department of Environmental Protection found that the top tier of activities included saltwater beach activities, wildlife viewing, and saltwater fishing for twofifths or more of tourists and resident respondents. The table below shows the distribution of recreation activities by region of the state. 26 The Miami and Tampa Bay areas attract a large number of both tourists and residents alike who enjoy the region s saltwater beaches, saltwater fishing and boat ramps. These folks also participate in wildlife viewing and nature study. Other areas of the state may not have the same proportion of folks participating in these activities, but they nonetheless attract recreation participation. Those who enjoyed saltwater fishing in the state generally fished from a boat (70% of respondents), with a quarter of Florida residents using a saltwater boat ramp. 27 Nature-based tourism is also an important part of Florida s economy. Wildlife viewing, hunting, boating and fishing generate more than 34,000 jobs statewide, with an economic impact of $3.2 billion Outdoor Recreation in Florida: The Statewide Comprehensive Outdoor Recreation Plan, 2013, Draft Prepared for Florida Dept. of Environmental Protection by Responsive Management, pp Cited as SCORP hereafter. Figures are based on Visit Florida tourism rates. 25 Florida State Park Economic Impact Assessment, Fiscal Year SCORP, p. iii-iv. 27 Outdoor Recreation in Florida: Survey for the State Comprehensive Outdoor Recreation Plan, 2011, Prepared for Florida Dept. of Environmental Protection by Responsive Management, pp. iii-iv, 47-49, Tables. 28 Florida Fish and Wildlife Conservation Commission (FWC), cited in SCORP, p
49 43
50 5. Fishing Industry a. Recreational Fishing Florida s bounty flows from its oceans and its 2,276 miles of tidal shoreline. Fishing continues to be a major industry in Florida. The state is known as the fishing capital of the world because of its record fish catches. The annual economic impact of recreational saltwater fishing in the state is $6.9 billion based on marine anglers expenditures of $3.9 billion in These expenditures in turn support 65,212 jobs in Florida. This impact includes $544 million in federal tax revenues and $416 million in state and local tax revenues. Salaries and wages account for $2.1 billion of the impact of saltwater fishing. The state s marine recreational fisheries and their expenditures lead the nation. There are over 2.4 million saltwater anglers in Florida, with total revenue topping $25 million from recreational fishing license sales. The state s marine recreational anglers logged over 36 million fishing trips in Boating tops $16.8 billion and contributes 203,000 jobs. 29 b. Commercial Fishing The state s commercial fisheries are among the most important in the country, ranking second in the nation for in state sales and third in jobs. The commercial fishing industry contributed 64,744 jobs, nearly $13 billion in sales, $2.4 billion in income, and $4.3 billion in value added impact. Florida s seafood industry includes commercial harvesters, seafood processors and dealers, importers, wholesalers and distributors, and retail. 30 Revenue for total landings is at $157 million statewide, including $116 million from west Florida and $41 million from east Florida. The state s commercial licenses/permits contributed $3.9 million to the state during the 2010/2011 fiscal year, with 10,685 licenses producing these revenues out of a total of 23,864 saltwater products licenses sold. The commercial saltwater fishing industry contributes over 100,000 jobs and over $5.7 billion to the state s economy NOAA, National Marine Fisheries Service, Fisheries Economics of the United States, 2009, NOAA Technical Memorandum NMFS-F/SPO-118, May 2011, hereafter cited as NOAA, Fisheries Economics. Florida Fish and Wildlife Conservation Commission, accessed at American Sportsfishing Association, Sportsfishing in American, January Florida Fish and Wildlife Conservation Commission, accessed at The economic impacts of the commercial fishing sector and seafood industry refer to the employment (full-time and part-time jobs), personal income, and output (sales by Florida. businesses) generated by the commercial harvest sector and other major components of the U.S. seafood industry including processors and dealers, wholesalers and distributors, grocers and restaurants. The original source is NOAA, Fisheries Economics. 31 NOAA, Fisheries Economics; U.S. Fish & Wildlife Service, National Survey on Hunting, Fishing, and Wildlife Viewing, 2006 values updated through February
 produced $6.2 million, other food fish (tilapia, sturgeon, etc.) $3.")
51 Map 10 c. Florida Marine Aquaculture Aquaculture in Florida is ranked 7 th in the nation, with income of $61.3 million for 469 farms. Ornamental fish is the largest segment, at $32.1 million income, followed by mollusk/hard clams, at $15.2 million. Other aquaculture (alligator, snails, frogs, etc.) produced $6.2 million, other food fish (tilapia, sturgeon, etc.) $3.4 million, and crustacean (shrimp, crawfish, prawn) $2.5 million. The hard clam represents 99.9% of marine species production on leased sovereign submerged lands, located on Cedar Key, Pine Island, and Sebastian. Based upon a 2008 production year analysis, total hard clam farm gate sales (money to the grower) was 45
52 $19 million. Of that total, the Cedar Key region/levy County sold $18 million, Sebastian/Indian River County about $900,000 and Pine Island/Lee County about $100, The combined total output impact for the state s clam growers and processors is estimated at $53 million, with a value added impact of $31.5 million, including $25.3 million labor income for 606 jobs, $4.6 million in other property income, and $1.6 million in indirect business taxes. 33 C. Other Industry Sectors 1. The Defense Industry in Florida The location of military facilities along Florida s coasts provides a significant boost to the state s economy. Defense-related spending contributed $58.1 billion, or 7.5%, of Florida s gross state product in FY 2008, according to the University of West Florida s Haas Center for Business Research and Economic Development (Haas Center). 34 This was estimated at $64.8 billion in 2010 and expected to reach $67.7 billion in There was an estimated $1.26 billion in state and local government tax spending in FY Florida ranks fourth in federal defense expenditures, at $20.96 billion in Defense spending accounted for 686,181 direct and indirect jobs in Florida in FY The largest proportion (37%) of defense jobs is located in northwest Florida, followed by central Florida with 30%, northeast Florida with 22%, and south Florida with 11%. Nearly all military installations are located near the coast, with eight in northwest Florida counties, three in the northeast, five in the central region, and three in the southeast. An additional three installations are in noncoastal locations. Defense jobs represent 8,262 contractors, 133,751 contracts, and $66.3 billion of expenditures in the state s coastal counties. (See Appendix for a listing of defense contractors by county.) The study confirms that all of the state s counties benefit from defense-related spending, with at least $4 million annual spending from the defense industry in all but three counties. 32 Florida Dept. of Agriculture and Consumer Affairs (FDACS), Florida ranks 7 th in U.S. Aquaculture Value, Florida Aquaculture, March 2009, no. 69, p.1. Marine species information provided by personal communication with Paul Zajicek and FDACS, Estimating the Economic Impact for the Commercial Hard Clam Culture Industry on the Economy of Florida, Final Report, March 2009, prepared by Florida Sea Grant, UF Project # FDACS, 2009, p. 10 and Table 7, p Haas Center for Business Research and Economic Development (Haas Center), Florida Defense Industry Economic Impact Analysis, Final Report, January, 2011, p

53 Map 11 U.S. Military Bases in Florida 47
54 The economic impact of Florida s four regions is summarized in the table below, adapted from data in the Haas Center study. The Central region has the highest concentration of jobs, followed by the Northwest and Northeast, and trailed by the Southeast region. This is reflected in the higher gross wages and gross regional product in the Central region. Table 22 Economic Impact of Defense Industry in Florida s Regions Region Northwest Northeast Central Southeast #Jobs (Direct + Indirect) , , , , Estimates 168, , , ,906 Gross Wages ($Billion) 2008 $3.5 $4.1 $6.3 $3.2 Gross Regional Product ($Million) 2008 $14,281.2 $14,248.7 $19,429.9 $10, Estimates $17,043.2 $16,251.6 $22,178.7 $12,228.3 Adapted from Tables 12, 14, 16, 18 on pages 31, 37, 44, 51, Haas Center for Business Research and Economic Development (Haas Center), Florida Defense Industry Economic Impact Analysis, Final Report, January, Marine Research a. Research Funding The Florida Institute of Oceanography (FIO) includes nearly all the major research facilities in Florida doing research on oceans, including public and private universities and research institutes. They report that their members receive millions of dollars from federal, state, and private sources for research funding. 35 Its members do not include Disney in Orlando, the Florida Aquarium in Tampa, and the Pier Aquarium in St. Petersburg. There are also federal groups that have a research component in Florida, including the Environmental Protection Agency in Pensacola, the U.S. Geological Survey in St. Petersburg, NOAA Fisheries in St. 35 Personal communication with Jyotika Virmani, FIO, January Partial reports to FIO show that federal sources provide $8.9 million in funding for FIO members, state funding another $3.7 million, and private funding the largest share at $43.9 million 48
55 Petersburg, NOAA s Hurricane Center in Miami, NOAA s Atlantic Oceanographic and Meteorological Laboratory, and the NOAA Florida Keys National Marine Sanctuary in Key Largo. Additionally, annual budgets for the state s marine and coastal research and education institutions were reported at $272.5 million in FY 2007, with wages at $154 million for nearly 3,000 employees and over 2,200 students. The total marine research funding was $162 million at that time. 36 Together these research entities contribute significant funding to the state s economy. A list of specific sources that provide funding for Florida s marine research is listed in the Appendix. While we may think of marine research as academic, it also involves industry members. For example, Roffer s Ocean Fishing Forecasting Service Inc. is but one example of a combined technology and professional service company that serves both the fishing and oil/gas industries with its forecasting. SRI International, an independent nonprofit research institute in St. Petersburg, Florida, is focused on marine technology development. Ocean Research and Conservation Association in Ft. Pierce, Florida, is focused on the development of innovative technologies and applied science to protect and restore aquatic ecosystems. Coil Industries, a small surfboard manufacturing company in Brevard County, Florida, has developed new composite materials and processes to build high-performance surfboards. The economic impact of surf tourism in Brevard County alone was estimated at $21 million/year. 37 So there are applications of marine research to technology companies, among others. b. Ocean Observing The Florida Coastal Ocean Observing System (FCOOS) was established to coordinate efforts for ocean observing in Florida, as a partner with the Southeast Atlantic Regional Association and the Gulf of Mexico Regional Association that manage those efforts for ocean observing in the southeast states, splitting Florida between two regional associations. The FCOOS 18 member state network of public and private marine research institutes is developing an integrated and interdisciplinary network to address issues of climate change and weather, safety of maritime operations, natural hazards, ocean health and water quality, homeland security, public health, fisheries and other natural resources. Its goal is to provide reliable interdisciplinary observations, manage data, and formulate models to support operational forecasts. Its members are listed in the table below. 36 National Oceans and Coastal Council, Florida s Ocean and Coastal Economies Report, June, 2008, pp. 137, Michael H. Slotkina, Karen Chambliss, Alexander R. Vamosia, and Chris Lindoc Surf Tourism, Artificial Surfing Reefs, and Environmental Sustainability. In Sustainability 2009: The Next Horizon. Gordon L. Nelson and Imre Hronszky, Eds. American Institute of Physics, NY. AIP Conference Proceedings. Vol pp

56 Table 23 Members of Florida s Coastal Ocean Observing System 1. University of Miami Rosenstiel School of Marine and Atmospheric Science, Miami 2. Nova Southeastern University Oceanographic Center, Dania Beach 3. University of South Florida College of Marine Science, St. Petersburg 4. Florida Atlantic University Harbor Branch Oceanographic Institution, Inc., Fort Pierce 5. Mote Marine Laboratory, Sarasota 6. Florida Institute of Technology Dept. of Marine & Environmental Systems, Melbourne 7. Florida State University Department of Oceanography, Tallahassee 8. Florida Atlantic University Department of Ocean Engineering/SeaTech, Dania Beach 9. University of Florida Civil and Coastal Engineering, Gainesville 10. Roffer s Ocean Fishing Forecasting Service, Inc., Miami 11. University of North Florida College of Computing, Engineering & Construction, Jacksonville 12. Florida International University Southeast Environmental Research Center, Miami 13. Florida Gulf Coast University Dept. of Marine and Ecological Sciences, Fort Myers 14. State of Florida Institute of Oceanography, St. Petersburg 15. Weatherflow, Inc., New Smyrna Beach 16. HARRIS Corporation, Melbourne 17. University of Central Florida Department of Biology, Orlando 18. University of West Florida, Pensacola Map 12 Ocean Observing Sites Source: FLCOOS Maps of Oceans Observation Locations 50
Population workforce, and employment in Florida :
 University of South Florida Scholar Commons College of Business Publications College of Business 1-1-2000 Population workforce, and employment in Florida : 1999-2000 University of South Florida. Center
Phase II Florida s Ocean and Coastal Economies Report
 Center for the Blue Economy Digital Commons @ Center for the Blue Economy Publications National Ocean Economics Program Summer 6-15-2008 Phase II Florida s Ocean and Coastal Economies Report Judith T.
Economic Impact of the Recreational Marine Industry Broward, Miami-Dade, and Palm Beach Counties, Florida
 Economic Impact of the Recreational Marine Industry Broward, Miami-Dade, and Palm Beach Counties, Florida - 2018 Completed by THOMAS J. MURRAY & ASSOCIATES, INC. For MARINE INDUSTRIES ASSOCIATION OF SOUTH
FWC DEER HARVEST SURVEY: FINAL REPORT
 FWC 2010-2011 DEER HARVEST SURVEY: FINAL REPORT Prepared for: FLORIDA FISH AND WILDLIFE CONSERVATION COMMISSION Prepared by: THE RESEARCH STAFF DRAFT REPORT 1.1 October 11, 2011 TABLE OF CONTENTS INTRODUCTION...
JERRY D. PARRISH, PH.D. Chief Economist Florida Chamber
 JERRY D. PARRISH, PH.D. Chief Economist Florida Chamber Foundation jparrish@flfoundation.org @DrJerryParrish 2007 2007 2014 US versus Florida Coincident Indicators 190 180 170 160 150 140 130 120 110 100
A Threatened Bay: Challenges to the Future of the Penobscot Bay Region and its Communities
 A Threatened Bay: Challenges to the Future of the Penobscot Bay Region and its Communities 1 A A Threatened Bay: Challenges to the Future of the Penobscot Bay Region and its Communities In 1996 the Island
FWC DEER HARVEST SURVEY: FINAL REPORT
 FWC 2007-2008 DEER HARVEST SURVEY: FINAL REPORT Prepared for: FLORIDA FISH AND WILDLIFE CONSERVATION COMMISSION Prepared by: VAI November 3, 2009 TABLE OF CONTENTS INTRODUCTION... 1 SUMMARY OF FINDINGS...
DEPARTMENT OF REVENUE Property Tax Oversight 2008 Taxable Value of Real Property by Category Part 1
 2008 Taxable Value of Real Property by Category Part 1 Single Multi Multi Vacant Family Mobile Condo- Family Family Coop- County Residential Residential Mobile miniums < 10 > or = 10 -eratives Alachua
DEPARTMENT OF REVENUE Property Tax Oversight 2009 Taxable Value of Real Property by Category - Part 1
 2009 Taxable Value of Real Property by Category - Part 1 Single Multi Multi Vacant Family Mobile Condo- Family Family Coop- County Residential Residential Homes miniums < 10 > or = 10 eratives Alachua
Recreational Fishing License Sales in Florida:
 Recreational Fishing License Sales in Florida: 1990-2000 1 Kristina Stephan and Chuck Adams 2 Introduction The recreational fishing industry is an important natural resource-based industry in Florida.
Final Report, October 19, Socioeconomic characteristics of reef users
 Socioeconomic Study of Reefs in Southeast Florida - Executive Summary By Hazen and Sawyer in association with Florida State University and National Oceanic and Atmospheric Administration, October 19, 2001
Marine Recreational and Commercial Industries and Activities in Lee and Charlotte Counties: Economic Consequences and Impacts
 Marine Recreational and Commercial Industries and Activities in Lee and Charlotte Counties: Economic Consequences and Impacts Betty Staugler Florida Sea Grant Extension Marine Agent & Chuck Adams Florida
Economic Contribution of the 2018 Recreational Red Snapper Season in the South Atlantic
 Economic Contribution of the 2018 Recreational Red Snapper Season in the South Atlantic Produced for the: American Sportfishing Association (ASA) PO Box 6435 Fernandina Beach, FL 32035 Office (904) 277-9765
Re: Algae/Cyanobacteria Bloom in St. Lucie, Martin, Palm Beach and Lee Counties.
 July 18, 2016 Richard L. Scott Governor, State of Florida 400 S Monroe St Tallahassee, FL 32399 Re: Algae/Cyanobacteria Bloom in St. Lucie, Martin, Palm Beach and Lee Counties. Dear Governor Scott: I am
Florida LAKEWATCH Expanding to the Coast? CITIZEN'SCIENCE'SINCE'1986'
 Florida LAKEWATCH Expanding to the Coast? CITIZEN'SCIENCE'SINCE'1986' Founder of Florida LAKEWATCH Dr. Daniel E. Canfield Jr. (1986) Lake Santa Fe 214 / 63 ( ) ( ) ( ) ( 0215 Florida LAKEWATCH Started
Texas Housing Markets: Metropolitan vs. Border Communities. September 22, 2014
 Texas Housing Markets: Metropolitan vs. Border Communities Luis Bernardo Torres Ruiz, Ph.D. Research Economist El Paso Branch Dallas Federal Rio Grande Economic Association September 22, 2014 Contents
The Economic Impact of Recreational Fishing in the Everglades Region
 The Economic Impact of Recreational Fishing in the Everglades Region Prepared for: The Everglades Foundation Prepared by: Tony Fedler, Ph.D. For the Bonefish and Tarpon Trust December 2009 Table of Contents
VALUES ASSOCIATED WITH THE APALACHICOLA BAY MARINE ECONOMY
 PBTC 03-3 VALUES ASSOCIATED WITH THE APALACHICOLA BAY MARINE ECONOMY By Alan W. Hodges and Charles Adams PBTC 03-3 March 2003 POLICY BRIEF SERIES INTERNATIONAL AGRICULTURAL TRADE AND POLICY CENTER MISSION
colorado.edu/business/brd
 colorado.edu/business/brd Big Changes, Unknown Impacts Southwest Business Forum Place cover image here Richard Wobbekind Senior Economist and Associate Dean for Business and Government Relations January
Re: Port Everglades Feasibility Project, Final Feasibility Report and Environmental Impact Statement
 April 20, 2015 Terri Jordan-Sellers, Regional Technical Specialist U.S. Army Corps of Engineers Jacksonville District 701 San Marco Boulevard Jacksonville, FL 32207 Via Email: Terri.Jordan-Sellers@usace.army.mil
Coastal and marine recreation in New England is ingrained in the region s economic and
 RECREATION Coastal and marine recreation in New England is ingrained in the region s economic and social fabric. Recreation on the ocean and coast includes many of New Englanders most time-honored and
THE ECONOMIC CONTRIBUTION FROM HORSES
 THE ECONOMIC CONTRIBUTION FROM HORSES ECONOMIC CONTRIBUTION FROM HORSES HIGHLIGHTS The horse industry contributes more than $19 billion annually to the Canadian economy On-farm activities with horses generate
The 2001 Economic Benefits of Hunting, Fishing and Wildlife Watching in MISSOURI. Prepared by:
 The 2001 Economic Benefits of Hunting, Fishing and Wildlife Watching in MISSOURI Prepared by: Southwick Associates, Inc. PO Box 6435 Fernandina Beach, FL 32035 Ph (904) 277-9765 Fax (904) 261-1145 Email:
COOPERATIVE EXTENSION Bringing the University to You
 COOPERATIVE EXTENSION Bringing the University to You Special Publication - 06-16 ECONOMIC IMPACT OF TOURISM ON COLORADO RIVER COMMUNITIES INCLUDING: LAUGHLIN BULLHEAD CITY FORT MOHAVE MOHAVE VALLEY GOLDEN
Integration of Sustainable Development on Long Island s Coastal Industries 1
 Integration of Sustainable Development on Long Island s Coastal Industries 1 Sheng Li, (lis@farmingdale.edu) Richard Vogel (vogelrm@farmingdale.edu) Nanda Viswanathan (nanda.viswanathan@farmingdale.edu)
The 2010 Economic Contribution of Tourism to the Meadowlands Liberty Region
 The 2010 Economic Contribution of Tourism to the Meadowlands Liberty Region Key Metrics & Evaluation 93 MAIN STREET :: ANNAPOLIS, MD 21401 WWW.VANTAGESTRATEGY.COM :: 202-449- 9708 1 Vantage Strategy ::.
FEMA-4337-DR-FL Geospatial Information Unit (GIU)
") INCIDENT MAP BOOK 10/09/201 0 00 Geospatial Information Unit (GIU) Page Map Title Map Owner 2 Geospatial Library Example Page and Link N/A 3 Map Request Example on WebEOC N/A 4 Links to IA, NFIP, and Branch
INCIDENT MAP BOOK 10/09/201 0 00 Geospatial Information Unit (GIU) Page Map Title Map Owner 2 Geospatial Library Example Page and Link N/A 3 Map Request Example on WebEOC N/A 4 Links to IA, NFIP, and Branch
FEMA-4337-DR-FL Geospatial Information Unit (GIU)
") INCIDENT MAP BOOK 11/27/201 0 00 Geospatial Information Unit (GIU) Page Map Title Map Owner 2 Geospatial Library Example Page and Link N/A 3 Map Request Example on WebEOC N/A 4 Links to IA, NFIP, and Branch
INCIDENT MAP BOOK 11/27/201 0 00 Geospatial Information Unit (GIU) Page Map Title Map Owner 2 Geospatial Library Example Page and Link N/A 3 Map Request Example on WebEOC N/A 4 Links to IA, NFIP, and Branch
0 / FEMA-4337-DR-FL Geospatial Information Unit (GIU)
") INCIDENT MAP BOOK 0 /2018 00 Geospatial Information Unit (GIU) Page Map Title Map Owner 2 Geospatial Library Example Page and Link N/A 3 Map Request Example on WebEOC N/A 4 Links to IA, NFIP, and Branch
INCIDENT MAP BOOK 0 /2018 00 Geospatial Information Unit (GIU) Page Map Title Map Owner 2 Geospatial Library Example Page and Link N/A 3 Map Request Example on WebEOC N/A 4 Links to IA, NFIP, and Branch
Big Changes, Unknown Impacts
 Big Changes, Unknown Impacts Boulder Economic Forecast Place cover image here Richard Wobbekind Senior Economist and Associate Dean for Business and Government Relations January 17, 2018 Real GDP Growth
RESEARCH Massachusetts Recreational Boater Survey. Project Summary
 Coastal and Marine Spatial Planning RESEARCH Project Summary 2010 Massachusetts Recreational Boater Survey The 2010 Massachusetts Recreational Boater Survey gathered spatial and economic data relating
2018 FLORIDA YOUTH SUBSTANCE ABUSE SURVEY
 1 2018 FLORIDA YOUTH SUBSTANCE ABUSE SURVEY September 20, 2018 Collier Broward Palm Beach Hendry Lee Glades Charlotte Martin Pasco Polk Hardee DeSoto Highlands Miami- Dade Monroe Sarasota Manatee Hillsborough
Figure 26. Map of ocean related share of GDP in counties of the Gulf of Mexico coast region in (Data Source: National Ocean Economics Program.
 Figure 22. Map of ocean related share of GDP in counties of the North and Middle Atlantic coastal regions in 2009. This map shows the share of ocean related GDP (value added economic activity) in 2009
Nevada County Population Projections 2015 to 2034
 Nevada County Population Projections 2015 to 2034 Prepared By: Jeff Hardcastle, AICP Nevada State Demographer Nevada Department of Taxation Reno Office: 4600 Kietzke Lane, Building L Suite 235 Reno, NV
ORLANDO MSA MARKET OVERVIEW LAST UPDATED: MAY 2018
 ORLANDO MSA MARKET OVERVIEW LAST UPDATED: MAY 2018 Orlando MSA Market Overview Labor Market Payroll Employment Commercial Real Estate Residential Real Estate Consumer Spending Visitor Industry Labor Market
August 3, Prepared by Rob Cheshire 1 & Joe O Hop 2. Center for Coastal Fisheries and Habitat Research Beaufort, NC
 SEDAR 19-DW05 Evaluation of the 1960, 1965, and 1970 U.S. Fish and Wildlife Service salt-water angling survey data for use in the stock assessment of red grouper (Southeast US Atlantic) and black grouper
OFFICE OF INSURANCE REGULATION IN THE MATTER OF: CASE NO.: ORDER
 FILED DEC. 6 2017 OFFICE OF INSURANC~ TION Docbted~ ~ OFFICE OF INSURANCE REGULATION DAVID ALTMAIER COMMISSIONER IN THE MATTER OF: CASE NO.: 211627-17 CITIZENS PROPERTY INSURANCE CORPORATION I ORDER TO:
Commercial Red Grouper Fishing in the Gulf of Mexico States
 Commercial Red Grouper Fishing in the Gulf of Mexico States According to NOAA Fisheries (https://www.fisheries.noaa.gov/species/red-grouper), the red grouper (Epinephelus morio) fishery in the Gulf of
LIONFISH CONTROL PLAN
 LIONFISH CONTROL PLAN Action Items Summary 2017 LIONFISH CONTROL PLAN Action Items Summary 2017 Two species of Indo-Pacific lionfish have invaded the coastal and deep waters of the state of Florida. Lionfish
Independent Economic Analysis Board. Review of the Estimated Economic Impacts of Salmon Fishing in Idaho. Task Number 99
 IEAB Independent Economic Analysis Board Roger Mann, Chair Noelwah R. Netusil, Vice-Chair Kenneth L. Casavant Daniel D. Huppert Joel R. Hamilton Lon L. Peters Susan S. Hanna Hans Radtke Review of the Estimated
Approved Residential Development Osceola County, Florida 2,250 Rural Acres N Canoe Creek Rd Kenansville, FL 34739
 Approved Residential Development Osceola County, Florida 2,250 Rural Acres 5300 N Canoe Creek Rd Kenansville, FL 34739 Endless Possibilities This pristine 2,250 Acre Cattle Ranch in the Heart of Central
Single Point of Contacts for the Release of Children s Foster Care Records
 Single Point of Contacts for the Release of Children s Foster Care Records Circuit County Community-Based Care Lead Agency Single Points of Contact 01 02 Escambia Okaloosa Santa Rosa Walton 03 Franklin
2008 Florida Alligator Hunting Survey Report
 2008 Florida Alligator Hunting Survey Report The Alligator Management Program of the Florida Fish and Wildlife Conservation Commission surveyed alligator hunters that were permitted in 2008 to gather information
2013 ECONOMIC IMPACT OF FLATS FISHING IN BELIZE
 2013 ECONOMIC IMPACT OF FLATS FISHING IN BELIZE Prepared for: Bonefish and Tarpon Trust P.O. Box 644257 Vero Beach, FL 32964 Prepared by: Anthony J. Fedler, Ph.D. Human Dimensions Consulting 9707 SW 55th
Artificial Reef Program. A Win for Our Ecosystem, a Win for Our Economy!
 Artificial Reef Program A Win for Our Ecosystem, a Win for Our Economy! A Boom for Economic Development Deploy 36 artificial reefs off the Coast of Naples/Marco/Collier County. Pay for the reefs with a
Sport Fishing Expenditures and Economic Impacts on Public Lands in Washington
 Sport Fishing Expenditures and Economic Impacts on Public Lands in Washington For: Northwest Sportfishing Industry Association By: Southwick Associates Released June 2015 PO Box 6435 Fernandina Beach,
The Economic Impacts of Carolina Beach Inlet Navigability
 The Economic s of Carolina Beach Inlet Navigability June 27, 2014 By: Chris Dumas, Ph.D. Department of Economics and Finance Cameron School of Business UNC-Wilmington 601 South College Road Wilmington,
2018 Economic Outlook Forum Daraius Irani, Ph.D. Chief Economist, Regional Economic Studies Institute VP, Division of Strategic Partnerships and
 2018 Economic Outlook Forum Daraius Irani, Ph.D. Chief Economist, Regional Economic Studies Institute VP, Division of Strategic Partnerships and Applied Research Towson University November 29, 2018 $19,000
2018 Annual Economic Forecast Dragas Center for Economic Analysis and Policy
 2018 Annual Economic Forecast Dragas Center for Economic Analysis and Policy PRESENTING SPONSOR EVENT PARTNERS 2 The forecasts and commentary do not constitute an official viewpoint of Old Dominion University,
The Power of Outdoor Recreation Spending in Pennsylvania:
 The Power of Outdoor Recreation Spending in Pennsylvania: How hunting, fishing, and outdoor activities help support a healthy state economy November, 2018 Prepared for the Theodore Roosevelt Conservation
NOTICE: This publication is available at:
 Department of Commerce National Oceanic & Atmospheric Administration National Marine Fisheries Service NATIONAL MARINE FISHERIES SERVICE POLICY DIRECTIVE 01-118 February 12, 2015 Fisheries Management NATIONAL
HEARING ON THE ENVIRONMENTAL AND ECONOMIC IMPACTS OF OCEAN ACIDIFICATION
 WRITTEN STATEMENT OF THOMAS INGRAM EXECUTIVE DIRECTOR DIVING EQUIPMENT AND MARKETING ASSOCIATION A NON-PROFIT TRADE ASSOCIATION REPRESENTING RECREATIONAL DIVING AND SNORKELING HEARING ON THE ENVIRONMENTAL
UNC Charlotte Belk College of Business Administration. The Sanford Holshouser Business Development Group LLC. Executive Summary
 UNC Charlotte Belk College of Business Administration The Sanford Holshouser Business Development Group LLC Executive Summary The Economic Impacts of the Motorsports Industry on the North Carolina Economy
The Economic Gains from Reallocating Specific Saltwater Fisheries
 The Economic Gains from Reallocating Specific Saltwater Fisheries Produced for the: American Sportfishing Association By: Southwick Associates May 12, 2015 Executive Summary Allocation arrangements between
2013 FEDERAL STORM RESPONSE
 2013 FEDERAL STORM Presented to the Florida Shore & Beach Association Sep 26, 2013 Presented by: COL Alan Dodd Commander, Jacksonville District September 2013 THE COLLABORATION 2 THE PROGRAM 3 THE STORMS
Lobsters to Dollars: The Economic Impact of the Lobster Distribution Supply Chain in Maine
 Lobsters to Dollars: The Economic Impact of the Lobster Distribution Supply Chain in Maine Maine Fishermen s Forum Friday, March 2, 2018 Michael Donihue, Professor of Economics Colby College Annie Tselikis,
Appendix G Coastal Demographic and Economic Trends Additional Figures
 Appendix G Coastal Demographic and Economic Trends Additional Figures Figure 1. Unemployment Rate in 1970-2004 18.0 16.0 14.0 12.0 10.0 8.0 6.0 4.0 1970 1972 1974 1976 1978 1980 1982 1984 1986 1988 1990
Noah Williams. University of Wisconsin-Madison Center for Research On the Wisconsin Economy (CROWE) Outlook for the Wisconsin Economy
 Outlook for the Wisconsin Economy") An Noah University of Wisconsin-Madison Center for Research On the Wisconsin Economy (CROWE) CROWE: Brief Introduction Center for Research on the Wisconsin Economy (CROWE) recently established in the Department
An Noah University of Wisconsin-Madison Center for Research On the Wisconsin Economy (CROWE) CROWE: Brief Introduction Center for Research on the Wisconsin Economy (CROWE) recently established in the Department
The 2006 Economic Benefits of Hunting, Fishing and Wildlife Watching in TEXAS. Prepared by:
 The 2006 Economic Benefits of Hunting, Fishing and Wildlife Watching in TEXAS Prepared by: Southwick Associates, Inc. P.O. Box 6435 Fernandina Beach, FL 32035 Ph (904) 277-9765 Fax (904) 261-1145 Email:
University of Leeds Travel Plan
 University of Leeds Travel Plan 2015-2018 Contents 1: Introduction 1.1 What is a Travel Plan? 1.2 Why do we need one? 1.3 Sustainability Strategy 2: Overview 2.1 The bigger picture 2.2 The City scale 2.3
The University of Georgia
 The University of Georgia Center for Agribusiness and Economic Development College of Agricultural and Environmental Sciences Economic Impacts of Alabama Quail Hunting Prepared by: Archie Flanders and
Southwest Ohio Regional Economy in Context. Richard Stock, PhD. Business Research Group
 Southwest Ohio Regional Economy in Context Richard Stock, PhD. Business Research Group State of the Metro Area (in January Each Year) Total Employment has slowly increased in the last three years after
Go to Reference with Economic Statistics for US by Region and State. NOAA summary of fisheries of the US by state
 Go to Reference with Economic Statistics for US by Region and State Fisheries Economics of the United States 2014 Economics and Sociocultural Status and Trends Series U.S. Department of Commerce National
Economic Impact of Hunting Expenditures on Southern U.S
 Economic Impact of Hunting Expenditures on Southern U.S Jagdish Poudel (Corresponding author) Graduate Research Assistant Forest and Wildlife Research Center College of Forest Resource Mississippi State
Economic Impact Analysis BOONE DOCKS RESORT AND MARINA, LLC
 Economic Impact Analysis BOONE DOCKS RESORT AND MARINA, LLC Analysis conducted using the on-line Boating Economic Impact Model developed by Drs. Ed Mahoney (mahoneye@msu.edu), Dan Stynes (stynes@msu.edu)
Telling Canada s story in numbers Elizabeth Richards Analytical Studies Branch April 20, 2017
 Recent Developments in the Canadian Economy: How have the decline in oil prices and a weaker Canadian dollar affected Canada s economy? www.statcan.gc.ca Telling Canada s story in numbers Elizabeth Richards
Florida Keys National Marine Sanctuary
 Florida Keys National Marine Sanctuary Review of the Marine Zones and Regulations [insert your name here] [insert your email here] Florida Keys National Marine Sanctuary 2900 nm 2 / 10,000 km 2 Jurisdiction
General Interest Highway Statistics Source Book
 General Interest Highway Statistics Source Book 2016 PRODUCED BY Florida Department of Transportation Transportation Statistics Office Contents Introduction 1 Public Road Mileage Summaries 1 Online Access
Economic Growth and Revitalization on Long Island: the Role of the Recreational Fishing and Marine Economy
 Economic Growth and Revitalization on Long Island: the Role of the Recreational Fishing and Marine Economy Sheng Li, Richard Vogel, & Nanda Viswanathan, Farmingdale State College Abstract Long Island s
The 2006 Economic Benefits of Hunting, Fishing and Wildlife Watching in NORTH CAROLINA. Prepared by:
 The 2006 Economic Benefits of Hunting, Fishing and Wildlife Watching in NORTH CAROLINA Prepared by: Southwick Associates, Inc. P.O. Box 6435 Fernandina Beach, FL 32035 Ph (904) 277-9765 Fax (904) 261-1145
THE ECONOMIC IMPACT OF RECREATIONAL SALTWATER FISHING ON THE LOUISIANA ECONOMY
 THE ECONOMIC IMPACT OF RECREATIONAL SALTWATER FISHING ON THE LOUISIANA ECONOMY By Loren C. Scott & Associates, Inc. 743 Woodview Court Baton Rouge, LA 70810 225-751-1707 lorencscott@aol.com for The Coastal
The Economic Impact of Colonial Downs in Virginia
 The Economic Impact of Colonial Downs in Virginia Prepared for Revolutionary Racing January 31, 2018 1309 E Cary Street, Richmond, VA 23219 1025 Huron Road East, Cleveland, OH 44115 chmuraecon.com Table
FACTS AND FIGURES: MAKING THE CASE FOR COMPLETE STREETS IN LEE COUNTY
 FACTS AND FIGURES: MAKING THE CASE FOR COMPLETE STREETS IN LEE COUNTY Safety: Close to 5,000 pedestrians and bicyclists die each year on U.S. roads, and more than 70,000 are injured. [Mean Streets, Surface
Section 13. Parks and Recreation (PR)
") Section 13 Parks and Recreation (PR) The primary objective of the Parks and Recreation Service Area is to build a performance measurement system that is specific to parks and recreation. This service area
Section 13 Parks and Recreation (PR) The primary objective of the Parks and Recreation Service Area is to build a performance measurement system that is specific to parks and recreation. This service area
Tulsa Metropolitan Area LONG RANGE TRANSPORTATION PLAN
 Tulsa Metropolitan Area LONG RANGE TRANSPORTATION PLAN Indian Nations Council of Governments August 2005 CONTACTING INCOG In developing the Destination 2030 Long Range Transportation Plan, INCOG s Transportation
October Net Loss: Overfishing Off the Pacific Coast
 October 2007 Net Loss: Overfishing Off the Pacific Coast Net Loss Overfishing Off the Pacific Coast October 2007 Acknowledgements Written by Michael Gravitz, Oceans Advocate, U.S. PIRG Education Fund,
The Global Economy: Sustaining Momentum
 The Global Economy: Sustaining Momentum David J. Stockton Senior Fellow Peterson Institute for International Economics Chief Economist Monetary Policy Analytics October 5, 2017 What s Driving the Global
2.6 Dry Bulk, Break-Bulk, and Yachts and Vehicles Cargo Market Assessment
 2.6 Dry, Break-, and Yachts and Vehicles Cargo Market Assessment 2.6.1 Forecast Summary Annual cargo demand for dry bulk, break-bulk, yachts and vehicles was forecast under three scenarios (see Figure
2015 Economic Forecast & Industry Outlook. Robert A. Kleinhenz, Ph.D. Chief Economist, Kyser Center for Economic Research, LAEDC October 8, 2014
 2015 Economic Forecast & Industry Outlook Robert A. Kleinhenz, Ph.D. Chief Economist,, LAEDC October 8, 2014 Outline U.S. Economy California Economy Southern California Economy & Industries Five-Year Outlook
2018 Annual Economic Forecast Dragas Center for Economic Analysis and Policy
 2018 Annual Economic Forecast Dragas Center for Economic Analysis and Policy PRESENTING SPONSOR EVENT PARTNERS 2 The forecasts and commentary do not constitute an official viewpoint of Old Dominion University,
Sport Fishing Expenditures and Economic Impacts on Public Lands in Oregon
 Sport Fishing Expenditures and Economic Impacts on Public Lands in Oregon For: Northwest Sportfishing Industry Association By: Southwick Associates October 2013 PO Box 6435 Fernandina Beach, FL32035 Tel
Ohio Sea Grant ECONOMIC IMPACT OF LAKE ERIE ON NORTHERN OHIO. Ohio State University Sea Grant Program. AGI HDlOl. no.604. c.6
 Ohio Sea Grant ECONOMIC IMPACT OF LAKE ERIE ON NORTHERN OHIO LEROY J. HUSHAK, Ph.D. KOFI K. APRAKU, Ph.D. GEORGE W. MORSE, Ph.D. Department of Agricultural Economics and Rural Sociology The Ohio Agricultural
Texas Shrimp Action Plan
 Texas Shrimp Action Plan Updated April 2017 Prepared by: Audubon Nature Institute Gulf United for Lasting Fisheries (G.U.L.F.) Laura Picariello - Technical Programs Manager Ashford Rosenberg - Outreach
Economic Contribution of Off-Highway Vehicle Recreation in Colorado. Executive Summary Season. A joint cooperation report
 Economic Contribution of Off-Highway Vehicle Recreation in Colorado Executive Summary 2014-2015 Season A joint cooperation report Page intentionally left blank to accommodate double-sided printing December
Challenges, Prospects & Opportunities. Seychelles Fisheries Sector
 Challenges, Prospects & Opportunities Seychelles Fisheries Sector Geographical Location General information Total population: 94,000 people Total territory: 1,374,000 km 2 Land/Ocean territory:459 km 2
The economic value of the EU shipping industry. Andrew P Goodwin
 The economic value of the EU shipping industry Andrew P Goodwin 2 nd April 2014 Introduction Shipping is a vital facilitator of world trade 135 % Increase in world GDP in the last two decades 180 % Increase
Puget Sound Regional Forecast Chris Mefford Community Attributes
 2015 Puget Sound Regional Forecast Chris Mefford Community Attributes 3 1,000s The Regional Economy has added jobs consistently for nearly 5 full years. In a few months, this will be the longest streak
Economic Update and Outlook
 The Building Industry Association Of Okaloosa-Walton Counties Economic Update and Outlook Rick Harper, PhD February 1, 2018 The Economic Outlook 3rd longest postwar expansion for U.S., marked 103 months
Recreational Boating Industry
 Recreational Boating Industry Powering the Canadian Economy 2017 policy agenda 2 Table of Contents A Note from NMMA Canada s Executive Director A Note from NMMA Canada s Executive Director...3 What is
Table of contents. Florida ranks as the second highest state (after California) in the number of people participating in wildlife-viewing recreation.
 in the number of people participating in wildlife-viewing recreation.") Acknowledgments This report examines the contributions of wildlife viewing to the Florida economy. Rob Southwick and Thomas Allen are the authors. This project was funded by the Florida Fish and Wildlife
Acknowledgments This report examines the contributions of wildlife viewing to the Florida economy. Rob Southwick and Thomas Allen are the authors. This project was funded by the Florida Fish and Wildlife
15, 2015 EXECUTIVE SUMMARY
 Economic Contribution, Impacts, and Economic Benefits of Deer, Waterfowl and Upland Game Bird Hunting in North and South Dakota: Relationship to CRP Lands Dr. John Loomis and Dr. Michelle Haefele in cooperation
ECONOMIC DEVELOPMENT ELEMENT
 ECONOMIC DEVELOPMENT ELEMENT Background The Economic Development Element considers labor force and labor force characteristics, employment by place of work and residence, and analysis of the community
Nevada County Population Projections 2013 to 2032 Based On The Last Estimate Year of 2012
 Nevada County Population Projections 2013 to 2032 Based On The Last Estimate Year of 2012 Prepared By: The Nevada State Demographer s Office Jeff Hardcastle, AICP NV State Demographer University of NV
Commercial Florida Stone Crab Fishing in the Gulf of Mexico States
 Commercial Florida Stone Crab Fishing in the Gulf of Mexico States Florida stone crabs (Menippe mercenaria, Say, 1818, Fig. 1) inhabit U.S. waters from North Carolina south to Florida. They live in burrows
2014 Economic Indicators, Trends & Observations. 51 South Main Street Janesville, WI P F RockCountyAlliance.
 2014 Economic Indicators, Trends & Observations 51 South Main Street Janesville, WI 53545 P.608.757.5598 F.608.757.5586 RockCountyAlliance.com Indicators, Trends & Observations National Level State of
Pacific States Marine Fisheries Commission 63 rd Annual Meeting
 Pacific States Marine Fisheries Commission 63 rd Annual Meeting John Oliver Deputy Assistant Administrator for Fisheries August 23, 2010 2 NOAA Fisheries Service Organization Deputy Assistant Administrator
Gulf of Mexico Oil Spill
 Bulletin 1204 May 2013 Estimation of the Baseline for Assessment of Economic Impacts of the Gulf of Mexico Oil Spill on Mississippi s Commercial Fishing Sector Discrimination based upon race, color, religion,
Southern California Economic Forecast & Industry Outlook
 2016-17 Southern California Economic Forecast & Industry Outlook Robert A. Kleinhenz, Ph.D. Sr. VP/Chief Economist, LAEDC February 17, 2016 Outline U.S. Economy California Economy Southern California Economy
WHERE ARE ARIZONA DEMOGRAPHICS TAKING US? HOW GROWING SLOWER, OLDER AND MORE DIVERSE AFFECTS REAL ESTATE
 WHERE ARE ARIZONA DEMOGRAPHICS TAKING US? HOW GROWING SLOWER, OLDER AND MORE DIVERSE AFFECTS REAL ESTATE March 2017 Tom Rex Office of the University Economist and Center for Competitiveness and Prosperity
OR DUNGENESS CRAB FISHERY:
 E 55 OR DUNGENESS CRAB FISHERY: an economic analysis of productivity and profitability David S. Liao Joe B. Stevens OREGON STATE UNIVERSITY SEA GRANT COLLEGE PROGRAM Publication no. ORESU-T-75-005 AGRICULTURAL