SUMMARY KILDARE CENSUS 2016 PROFILE KILDARE COUNTY COUNCIL. & Local Community Development Committee (LCDC)
|
|
|
- Jewel Sims
- 5 years ago
- Views:
Transcription


1 Coiste um Fhorbairt Pobail Áitiúil Chill Dara Kildare Local Community Development Committee KILDARE COUNTY COUNCIL & Local Community Development Committee (LCDC) KILDARE CENSUS 2016 PROFILE SUMMARY All-Island Research Observatory An tionad Breathnaithe um Thaighde Uile-Éireann
2 Introduction In 2015 Kildare County Council (KCC) and Kildare Local Community Development Committee (LCDC) worked with the All-Island Research Observatory (AIRO) to prepare a socio economic baseline report based on Census 2011 and other data sets. This report was used to inform the development of the Kildare Local Economic and Community Plan (LECP). This original baseline report has now been updated based on Census 2016 and other data sets. It has been designed to allow easy comparison with key regional evidence baselines produced by AIRO on behalf of the Eastern and Midland Regional Assembly (see EMRA RSES). It is presented in six reports: Demographics Education Housing Health Employment, Industry and Occupations Commuting While these reports focus on the key economic, community and environmental indicators and provide a certain amount of context relating to each indicator, it is highly recommended that it is not used in isolation to the other data initiatives that Kildare County Council have developed with its research partner, AIRO at Maynooth University. AIRO hosts a detailed census GIS mapping module for Kildare Local Authorities on its website and contains hundreds of statistical variables at the Electoral Division (ED) and Small Area (SA) level. All data and mapping results are also available through the Kildare DataHub via This report provides a short synopsis of the key facts that emerged from the analysis of the data collated. 1

3
4
5
6

7
8
9 Demographics 1. Kildare is a significant population base within the State. Census 2016 outlines that the total population within Kildare was 222,504. This represents 4.7% of the State total (4.76 million), 9.5% of the Eastern & Midlands Regional Assembly (2.32 million) and 32.3% of the Eastern Strategic Planning Area (SPA) (688,857). Kildare, as a county, has the fifth highest population in the State with only Dublin City, Cork County, Fingal and South Dublin with higher populations. 2. Kildare has a rapidly growing population. Over a 20 year period (1996 to 2016), Kildare experienced a 64.8% (+87,512) increase in its population base - the second highest rate in the State. The more recent growth rate (2006 to 2016) of 19.4% is the fourth highest in the State. This is explained by high levels of natural increase (birth rate) and a strong performance in estimated net migration. In comparison, growth rates between 2011 and 2016 have been much slower for all areas across the country. During this period, Kildare increased its population by 5.8% - the third highest rate of all local authorities. 3. Kildare has the highest rate of young people aged 0 to 24 years in the State. According to the 2016 Census, the population aged 0 to 24 years residing in Kildare was 81,517 and represents 36.6% of the total population - the highest rate in the State. 4. Kildare has high levels of child and youth dependency. Over 28% of Kildare s population is aged 0-18 years. - the 3rd highest rate of all local authorities in Ireland. Kildare s child and youth dependent cohort is the 6th highest in the State, meaning those of working age have a relatively greater burden in supporting this young population. 5. Demand for child and youth services is building and set to grow. Given the size and significance of Kildare s existing population cohorts in the 0-4, 5-12 and age ranges, it is evident that the profile of the county s population has not yet peaked, and that there is likely to be an increased demand for children s and young people s services over the next decade. For instance, the number of secondary school population (13-17 years) residing in Kildare has increased by 17.5% in the last five years. 6. Kildare has a geographically varied population density. Kildare, as a county, is the 8th most densely populated county in the State with a density figure of persons per square km. However, approximately 72% of the county s population live on 5% of the county s total land area, with the northeast of the county having by far the highest population densities. For instance, the Leixlip/Celbridge Municipal District (MD) has a density figure of persons per square km - more than four times as densely populated than all other MDs. 7. The 65 and over age cohort has rapidly increased in Kildare. The 65 and over age cohort now represents 9.9% of the total population living in the county - the 2nd lowest rate in the State. Since 2011 this cohort has increased by 32% and was one of the highest rates 2
10 of increase in the State. As such, this is a major increase in the older population across the county and will result in an increased demand on older person s services. 8. Polish nationals are by far the largest non-irish community living in Kildare. Just under 10.6% or 23,279 of the population residing in county Kildare are non-irish nationals. This is the 13th highest rate in the State. In general, non-irish residents live in the main urban centres. Polish nationals make up the largest proportion of non-nationals in Kildare, representing 30% of all non-nationals or 3.3% of the total population - the 5th highest rate in the State. 9. Kildare has lower than national and regional rates of Travellers. There are 739 Travellers living in Kildare, with an observable spatial pattern. Most Travellers live in urban areas, with the highest rates in the towns of Newbridge and Athy. According to Census 2016, the number of Travellers residing in Kildare has reduced by 15% from a total of 874 in Kildare has the 5th highest number of Lone Parent families (with children under 15) in the State. There are 4,795 lone parent families residing in Kildare. This figure represents 16.9% of all families with children under 15 in Kildare, the 8th lowest rate in the State. 11. Deprivation levels have remained stable in Kildare between Kildare is the fifth most affluent local authority in the country (relative deprivation) as it was in 2011 although dropping from third position in The county experienced the third highest rate of increases in affluence levels nationally (+2.74) between Most deprivation is clustered in the east and south of the county with the most disadvantaged areas within Athy. 3
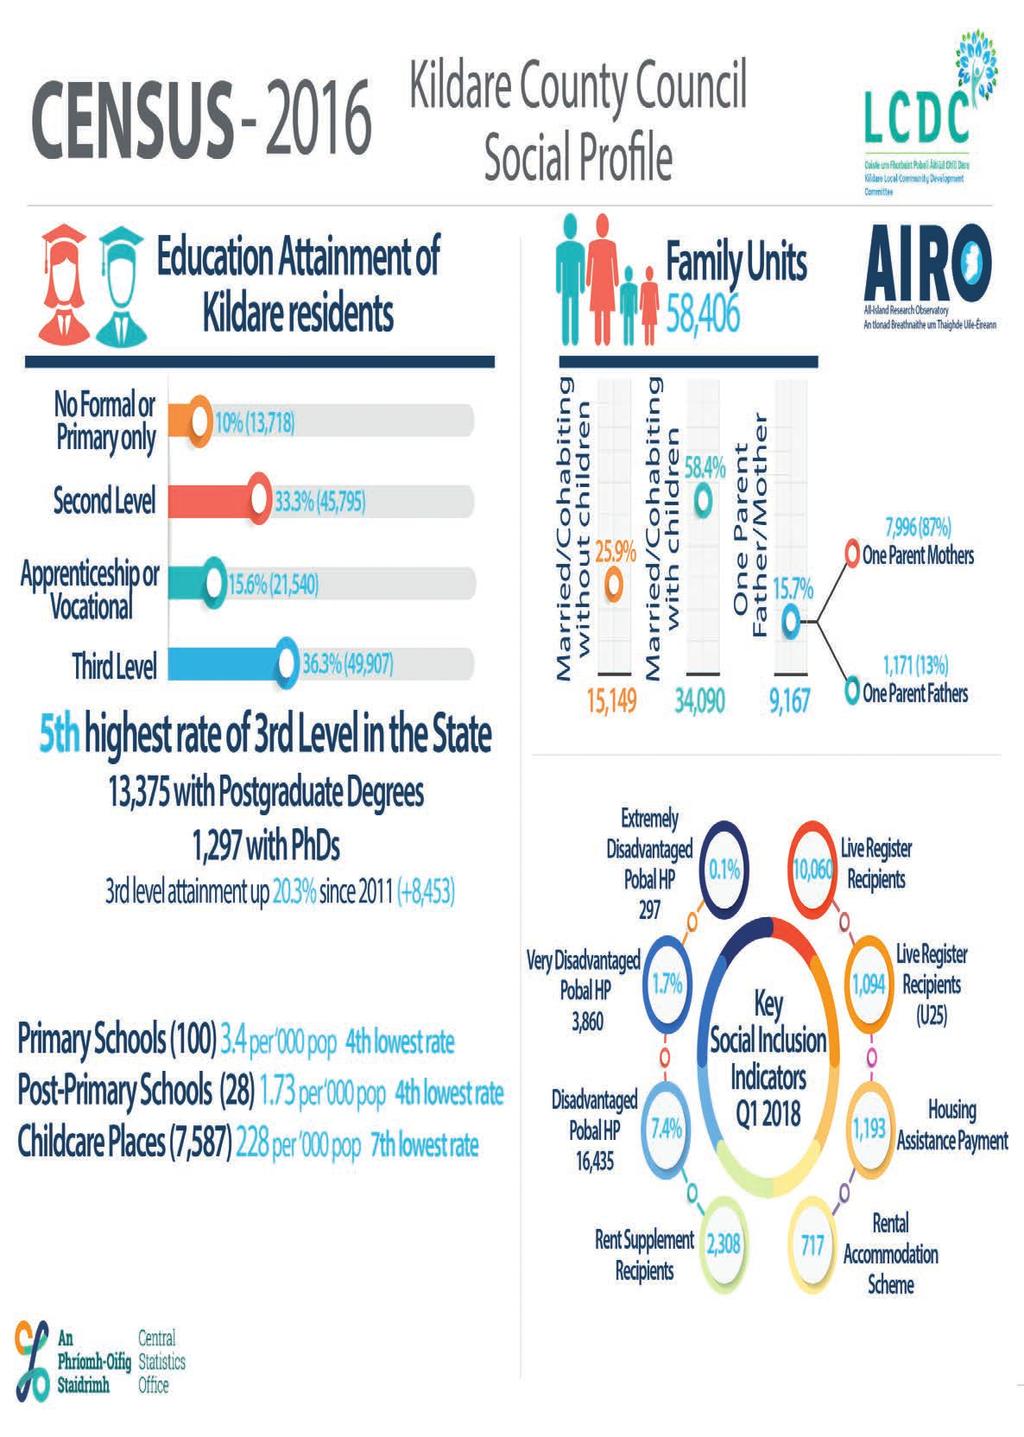
11 Education 1. Kildare has a very well educated population. 36.3% of the population have a third level degree or higher - the 5th highest rate in the country. The county has the 4th lowest rate of low education achievement (no formal/primary only - 10%) and the 5th lowest rate of medium education achievement (lower secondary %). 19.5% of the Kildare population have an education attainment level classed as higher secondary education. 2. There are clear spatial variations in education attainment across Kildare. High levels of educational attainment (third level plus) mirror the main urban centres of Naas, Newbridge and in particular the north of the county in Celbridge and Maynooth (Maynooth University employment catchment). The west and south-west of the county have much lower rates with Athy MD having a rate of only 24.9% which is considerably lower than the county average of 36.3%. 3. The main field of study of Kildare residents is similar to the State profile. In general, The Social Sciences, Business and Law category was the most popular field of study among all those with post-secondary school qualifications in 2016, and accounts for 16.4% of the Kildare population who have completed their education. This is marginally higher than the State rate but lower than the Eastern & Midlands average. 4. Kildare also performs very well in the Engineering, Manufacturing and Construction field and, at 10.1%, has a higher rate than the State and regional averages this is the second highest rate in the country. Kildare also performs quite well in the Science, Mathematics and Computing field with 5.3% of its population qualified in this area this is the 6th highest rate in the State. 5. Most Kildare students study in Dublin. According to Department of Education and Skills data, a total of 7,279 Kildare resident students were attending third level education institutions in an increase of 1,069 since The majority of these students were attending third level institutes in Dublin (52.5%), followed by Kildare/Maynooth (23%) and Carlow (10%). The remainder were distributed amongst the other main third level institutions. 6. In 2017, Kildare (7,879) had the 7th lowest number of childcare spaces available (vacant and filled). This figure equates to a rate of spaces available per 1,000 population aged 0 to 4, the 7th lowest in the State. The majority of childcare spaces held in Kildare are operated by private services operators (94%), the second highest rate in the State. The average weekly cost of childcare in Kildare is , the 7th highest average cost of childcare in the State and the 2nd highest in the Eastern SPA. The State average weekly cost was
12 7. Kildare has a low rate of schools per student population. In 2017/18 there were 100 mainstream primary schools in Kildare. This figure equates to a rate of 3.4 schools per 1,000 population aged 5 to 12 years, the 4th lowest of all local authorities and considerably lower than the State (5.73) average. For the same period, there were 28 post primary schools in Kildare. The rate of post primary schools per population aged 13 to 17 was 1.73, the 4th lowest in the State, which recorded an average of DEIS provision remains low in Kildare. Following the review of DEIS classified schools in 2017 there were no additional DEIS classified schools allocated to Kildare. The rate of DEIS primary schools per 1,000 population aged 5-12 in Kildare is 0.34, the 2nd lowest rate in the State. At post primary school level, there are a larger proportion of DEIS schools. Of the 25 secondary schools in Kildare, 25% or 7 are classed as DEIS schools and equates to a rate of 0.43 schools per 1,000 population aged 13 to 17, the 8th lowest rate in the State. 20% of post-primary pupils attend DEIS schools in Kildare. 9. Kildare has the fourth highest pupil/teacher ratio in the State. In 2015/16, Kildare had a ratio of 18.5 pupils per teacher. This is based on the total number of mainstream pupils (29,034) and teachers (1,566). The rate is a considerably higher than the State average of 17 pupils per teacher. Since 2013/4 there has been a decrease of 0.3 from 18.8 to This rate of decrease in line with the national rate of change which also saw a decrease of 0.3 pupils per teacher from 17.3 to School absenteeism is relatively high amongst primary school students in Kildare. In the 2015/2016 school term Kildare primary schools recorded an absenteeism rate of 11.7%, the 7th highest rate in the State. However, at post primary level Kildare recorded the 12th lowest rate of absenteeism in the State 5
13 Housing 1. Kildare is a significant residential base within the State with the eighth largest housing stock nationally. According to the 2016 Census, the total number of occupied households within Kildare was 73,348. This represents 4.3% of the State total (1.7 million), 9% of the Eastern & Midlands Regional Assembly (800k) and 31.7% of the Eastern Strategic Planning Area (SPA) (231,577). 2. Conventional housing is the dominant house type in Kildare. Over 89% or 65,663 of occupied housing in Kildare are classed as Conventional Housing (house/bungalow). This rate is higher than the State average of 86.5%. Flats and Apartments represent 9.5% (6,974) of housing which is lower than the State average of 11.8%. Since 2011, however, the number of Flats and Apartments in Kildare has increased by 15.4% which suggests a shift in development trends towards Flats and Apartments. 3. Home ownership rates in Kildare remain high with the county having the 3rd highest rate of households with a mortgage in the State. According to the 2016 Census, 72% of households in Kildare are Owner Occupied, considerably higher than the State average (67.6%) and the 6th highest number of all local authorities. Of this number, 41.3% are households with a Mortgage or Loan - the 3rd highest rate in the country. Since 2011 however, Kildare has followed a national trend where there has been a significant drop in mortgaged households with a decrease of -6.7% or 2,181 households. This decrease is primarily due to a lack of access to finance and housing supply. 4. The private and social rental sectors are expanding in Kildare. The rate of private rented properties in Kildare (17.2%) is marginally lower than the State (18.2%) average. However, the rate of growth in Kildare (3.7%) is more than twice the Sate (1.4%) average. There is a clear spatial distribution to the private rented sector with highest rates and numbers all located in the main settlements. Since 2011, social rented housing (local authority and voluntary body rented) in Kildare has increased by 17.6% (783), considerably higher than the rate of growth in the State (11.1%). The rate of social rented housing in Kildare is now 7.1%, still considerably lower than the State (9.4%) and EMRA (9.7%) averages. 5. In Kildare the Private Rented sector is heavily supported by State intervention funding. The private rental housing market is heavily subsidised by state funding in the form of Housing Assistance Payments (HAP), the Rental Accommodation Scheme (RAS) and Rent Supplement. In total, there are now 1,193 HAP tenancies in Kildare, 717 households linked to RAS (approximately 6.4m in Kildare in 2016) and 2,308 recipients of Rent Supplement (15.7% short term and 84.3% long-term). An analysis of the number of recipients of Rent Supplement relative to the number of private rented households in Kildare reveals that Kildare is the 5th highest rate of private sector dependency on Rent Supplement and the 3rd highest number in the State. 6
14 6. Kildare has an active property market with increasing prices for Rents and Sales. Rental accommodation in Kildare is relatively high in comparison to other eastern counties in Ireland. The average monthly rental in the county is now 1,023 (approx 25% higher than 2014) with higher rates in the north-east of the county (Leixlip = 1,235, 23.5% higher than 2014). The value and volume of sales area also increasing in Kildare and in the year to November 2017, a total of 2,104 residential property transactions were recorded in Kildare. Across the Eircode Routing Key areas located in Kildare, W91 Naas (829) recorded the highest volume of transactions followed by W23 Celbridge (709). The average value of a sold property in Kildare in this period was 279,895 - the 3rd highest average price in the State. 7. Rates of vacant housing have reduced in Kildare. According to Census 2016 there were 4,650 vacant properties (excluding holiday homes) recorded in Kildare. This figure marks a reduction of 25.5% since Census The Census vacancy rate currently stands at 5.7% which is considerably below the State (9.1%) average. Of the vacant proprieties in Kildare, 52.7% are considered Short Term vacant (Occupied in 2011, Vacant in 2016) and 27.5% are considered Long Term (Vacant in 2011 and 2016). There is considerable public debate regarding the accuracy of the Census vacancy figures with GeoDirectory recording a vacancy rate of 1.9% (Q2 2017). While different methodologies are in place, it should be acknowledged that in general the Census vacancy numbers will have certainly dropped since the 2016 Census enumeration. The vacancy section in this report explores the Census vacancy figures in more detail and focusses on both short and long-term vacancy and potential reasons for vacancy. 8. Construction of new houses in Kildare exceeded the State average. In the period since the 2011 Census, 1,739 or 2.4% of all housing in Kildare was constructed. This was marginally higher than the State (2%) average and represents the 7th highest rate of all local authorities. Of all new housing constructed between 2011 and 2016, 36.5% was built in the Maynooth MD, 22.8% in the Naas MD, 18.2% in the Kildare/Newbridge MD, 11.4% in the Celbridge/Leixlip MD and 11.4% in the Athy MD. 7
15 Health 1. Census 2016 outlines that 63.1% of Kildare s population report their health status as Very Good. This is higher than both the State and regional figures and is the third highest rate in the State. A further 26.4% reported their health as Good, while 6.8% reported their health as Fair. 2. Relative to other local authorities, Kildare does not have very high rates of its population with Very Bad or Very Bad Health. At 1.7%, a total of 2,527 of the resident population in Kildare have Bad - the 6th lowest rate in the State health and 0.2% or 549 have Very Bad health - the 7th lowest rate in the State. 3. There are 27,768 people in Kildare with a disability, being the sixth highest number in the State and the fourth lowest relative to population size. Since 2011, there has been an increase of 13% or 3,399. This increasing trend is also evident at the State level where numbers increased by 13%. The male population in Kildare accounted for 49.4% (13,719) of the population with a disability and the female population accounted for 50.5% (14,049). 4. Of those with a disability, the most common were chronic illness (17.1%), substantial physical limitation (13.1%), difficulty in going outside home (9.4%) and difficulty in participating in activities (12.4%). The least common reported disability was blindness/impaired vision (2.9%). Kildare has higher than average rates of Intellectual disability (4.1%), Difficulty learning, remembering or concentrating (9.4%), Physical or emotional conditions (6.9%), Other disability including chronic illness (17.1%) and Difficulty in working or attending school/college (11.9%). 5. In 2017, there were 69,358 eligible persons in the Kildare/West Wicklow (LHO) with a Medical Card. The Kildare West Wicklow Local Health Area recorded the 6th highest number of eligible persons with a medical card in the State. 6. There were 21 deaths by suicide in Kildare in The rate of death by suicide in Kildare was 9.4 persons per 100,000 population, higher than the State (8.4) average (399 recorded suicides). Of the recorded suicides in Kildare* a much higher rate of instances recorded in the older age cohorts of age 45 to 54 (19.9) and age 55 and over (13.8). Both rates were considerably higher than the State equivalent figures of 13.9 and 10.2 respectively (* based on 2015 data). 7. Female self-harm hospital presentations in the Kildare/West Wicklow Local Health Office (LHO) exceeded the State average in The Kildare/West Wicklow LHO recorded a rate of 240 per 100,000 female population, the 6th highest rate in the State (229). Male presentations (171) were marginally below the State (184) average and ranked as the 11th highest rate per 100,000 male population. 8
16 8. There are low levels of GP practices in Kildare. In total, there are 81 GP practices in Kildare, this number equates to a rate of 0.36 practices per 1,000 population, considerably lower than the State (0.41) and EMRA (0.42) averages and higher than the Eastern Strategic Planning Area (SPA) (0.32) average. 9. There are low levels of HSE listed Health Centres in Kildare. In total, there are 17 HSE listed Health Centres in Kildare, this number equates to a rate of 0.08 centres per 1,000 population, lower than the State (0.16) and Eastern SPA (0.09) averages and in line with the EMRA (0.08) average. 10. There are 23 Nursing Homes in Kildare which is the equivalent of 1.05 facilities per 1,000 population aged 65+. This figure is higher than the State (0.91), EMRA (0.79) and Eastern SPA (0.98) averages. Since 2015, the number of Nursing Homes in Kildare (23) has remained unchanged. In contrast, according to Census 2016, between 2011 and 2016 there has been a 32% increase in the population aged Kildare has relatively low rates of alcohol and drug addiction. In 2015 Kildare recorded 182 persons or a rate of 8.2 persons per 10,000 population in treatment for alcohol addition, the 4th lowest rate in the State. For the same period Kildare had a rate of 7.2 persons per 10,000 population in treatment for drug addiction. The majority of treatment was provided for three drug types: Opiates (49.1%), Cannabis (30.4%) and Cocaine (14.3%). Due to reporting issues, the numbers reflected in the NDTRS are not consistent with the figures known to access services in Kildare 9
17 Employment, Industry and Occupations 1. The labour force participation rate in Kildare is 64.1%, the fourth highest rate in the country. However, there is significant spread around this figure at throughout the county the highest labour force participation rate in the county is Sallins (74.5%) and the lowest is Suncroft (52.3%) % of the labour force are 'At Work' in Kildare. This is the fifth highest rate in the country and is mirrored by low unemployment rates (see below). There is, however, an uneven distribution of the labour force 'At Work' throughout Kildare with a significant variance between the highest and lowest rates in the county. The highest rate recorded is found in Straffan (95.8%) and the lowest in Athy (73.4%). 3. In 2016, the unemployment rate in Kildare was 11.4% (12,297 persons out of a labour force of 108,244). The national average unemployment rate was 12.9%. The distribution of unemployment throughout Kildare is uneven with the lowest rate recorded in Straffan (4.2%), while two areas had an unemployment rate of 20% or greater - Athy (26.6%) and Derrinturn (21.9%). 4. In April 2018, 9,389 Kildare residents were recorded on the Live Register. Of this total 11% (1,018) were under 25 years of age. In Athy and Newbridge, the equivalent rate of unemployment for those under 25 is 12%. These rates are higher than the Kildare (11%) average and marginally lower than the national average of 12.6%. 5. In 2015 there were 10,314 active enterprises in Kildare. Of these, only 15 enterprises (0.1%) employed more than 250 persons. A total of 9,598 (93.1%) enterprises employed less than 10 people. This figure is marginally higher than the State average of 92.2%. 6. The 15 largest firms employed 13,792 persons (26.7%) of the total Kildare workforce. The 9,598 smallest firms employed 16,027 persons (31.1%). 7. Kildare recorded the highest rate of employment supported by foreign owned (FDI) companies. In 2016, 18.6% or 10,377 of total employment in the Kildare enterprise sector was in foreign owned companies. This is the highest rate in the country followed by Cork (18%) and Galway (17.6%). 8. Commerce and Trade (26.6%) and Professional Services (22.8%) are the dominant industries involving Kildare residents. Combined, these sectors employ almost 50% (47,443) of all workers (95,947) resident in Kildare. 9. Kildare has the 2nd highest rate of Managers, directors and senior officials (9%) and the 3rd highest rate of Associate professional and technical occupations (13.1%). Both rates exceed the national average for each occupational group by a considerable margin and are reflective of a well educated and highly skilled workforce. 10
18 Commuting 1. Kildare has the 6th highest rate of outbound commuters in the State. Of the 95,345 workers residing in Kildare, 39.1% or 37,340 commute to local authorities outside the county. The top employment destinations for Kildare workers are: Dublin City (15,481), South Dublin (10,593), Fingal (3,324), Dún Laoghaire Rathdown (2,810) and Meath (969) % of Kildare s resident workers are employed in the Dublin Metropolitan Area. In total, 31,710 workers commute from Kildare into the Dublin Metropolitan Area. Highest rates are primarily located in the north-east of the county proximate to settlements; Naas, Celbridge, Leixlip and Maynooth, where many parts have in excess of 50% of workers commuting into the Dublin Metropolitan Area. 3. In excess of 33% of all jobs in Kildare are filled by persons living outside the county. Of the 62,985 jobs located in Kildare, 21,195 are filled by persons commuting in to the county. The top worker origins are; Laois (3,189), South Dublin (3,141), Meath (2,480), Dublin City (2,462) and Offaly (1,607). 4. Of the key settlements in Kildare, Naas (10,999) has the largest concentration of jobs. Naas accounts for 17.5% of all jobs in Kildare. Of this number 8,115 persons commute into Naas making it a key commuting destination in the county. Newbridge (6,526) has the second highest number of jobs followed by Leixlip (5,825). 5. Commuting/Jobs Profile Celbridge: There are 9,374 people in employment living in Celbridge, 12% work in Celbridge, 16% work elsewhere in Kildare and 57% commute out of Kildare - the remaining number of workers work in mobile or uncodable destinations. There are 2,339 jobs in Celbridge, this accounts for 3.7% of all jobs in Kildare. 6. Commuting/Jobs Profile Leixlip: There are 7,166 people in employment living in Leixlip, 14% work in Leixlip, 12% work elsewhere in Kildare and 59% commute out of Kildare - the remaining number of workers work in mobile or uncodable destinations. There are 5,825 jobs in Leixlip, this accounts for 9.2% of all jobs in Kildare. 7. Commuting/Jobs Profile Maynooth: There are 6,295 people in employment living in Maynooth, 19% work in Maynooth, 16% work elsewhere in Kildare and 51% commute out of Kildare - the remaining number of workers work in mobile or uncodable destinations. There are 5,201 jobs in Maynooth, this accounts for 8.3% of all jobs in Kildare. 8. Commuting/Jobs Profile Kilcock: There are 2,872 people in employment living in Kilcock, 10% work in Kilcock, 28% work elsewhere in Kildare and 48% commute out of Kildare - the remaining number of workers work in mobile or uncodable destinations. There are 848 jobs in Kilcock, this accounts for 1.3% of all jobs in Kildare. 11
19 9. Commuting/Jobs Profile Naas: There are 9,806 people in employment living in Naas, 29% work in Naas, 20% work elsewhere in Kildare and 37% commute out of Kildare - the remaining number of workers work in mobile or uncodable destinations. There are 10,999 jobs in Naas, this accounts for 17.5% of all jobs in Kildare. 10. Commuting/Jobs Profile Newbridge: There are 9,634 people in employment living in Newbridge, 26% work in Newbridge, 29% work elsewhere in Kildare and 27% commute out of Kildare - the remaining number of workers work in mobile or uncodable destinations. There are 6,526 jobs in Newbridge, this accounts for 10.4% of all jobs in Kildare. 11. Commuting/Jobs Profile Kildare Town: There are 3,520 people in employment living in Kildare Town, 20% work in Kildare Town, 35% work elsewhere in Kildare and 24% commute out of Kildare - the remaining number of workers work in mobile or uncodable destinations. There are 2,166 jobs in Kildare Town, this accounts for 3.4% of all jobs in Kildare. 12. Commuting/Jobs Profile Kilcullen: There are 1,573 people in employment living in Kilcullen, 13% work in Kilcullen, 37% work elsewhere in Kildare and 33% commute out of Kildare - the remaining number of workers work in mobile or uncodable destinations. There are 907 jobs in Kilcullen, this accounts for 1.4% of all jobs in Kildare. 13. Commuting/Jobs Profile Athy: There are 3,157 people in employment living in Athy, 29% work in Athy, 21% work elsewhere in Kildare and 28% commute out of Kildare - the remaining number of workers work in mobile or uncodable destinations. There are 2,147 jobs in Athy, this accounts for 3.4% of all jobs in Kildare. 12
20 Coiste um Fhorbairt Pobail Áitiúil Chill Dara Kildare Local Community Development Committee KILDARE COUNTY COUNCIL & Local Community Development Committee (LCDC) T: (0) W: All-Island Research Observatory An tionad Breathnaithe um Thaighde Uile-Éireann
A Socio-Economic Profile of Dún Laoghaire-Rathdown for the LCDC
 A Socio-Economic Profile of Dún Laoghaire-Rathdown for the LCDC Dublin City South Dublin Dundrum N 9 Blackrock Stillorgan 9 Dún Laoghaire Glencullen/Sandyford Killiney-Shankill Wicklow All-Island Research
REPORT OF THE ENGINEERING & PLANNING DEPARTMENT PLANNING DIVISION
 REPORT OF THE ENGINEERING & PLANNING DEPARTMENT PLANNING DIVISION 2008 09 22 TO: Mayor John Rowswell and Members of City Council SUBJECT: Official Plan Review 2008 Part 1 - Population and Household Projections
RE-CYCLING A CITY: EXAMINING THE GROWTH OF CYCLING IN DUBLIN
 Proceedings ITRN2013 5-6th September, Caulfield: Re-cycling a city: Examining the growth of cycling in Dublin RE-CYCLING A CITY: EXAMINING THE GROWTH OF CYCLING IN DUBLIN Brian Caulfield Abstract In the
The role of the Authority in promoting sustainable transport. Gerry Murphy South East Regional Assembly 27 th May 2011
 The role of the Authority in promoting sustainable transport Gerry Murphy South East Regional Assembly 27 th May 2011 Who we are National Transport Authority established on 1 st December 2009 Dublin Transport
Clackmannanshire Council. Housing Need and Demand Assessment. 1.0 Introduction
 Clackmannanshire Council Housing Need and Demand Assessment 1.0 Introduction Establishing a clear picture of housing need and demand in Clackmannanshire is essential to inform Council policy in relation
2017 Nebraska Profile
 2017 Nebraska Profile State, 9 NEW Regions, 93 Counties, plus 31 Cities Three Volumes Demographic Change in the State Economic Influences at Work Housing Statistics and Trends Summary of Findings Discuss
Life Transitions and Travel Behaviour Study. Job changes and home moves disrupt established commuting patterns
 Life Transitions and Travel Behaviour Study Evidence Summary 2 Drivers of change to commuting mode Job changes and home moves disrupt established commuting patterns This leaflet summarises new analysis
Briefing Paper #1. An Overview of Regional Demand and Mode Share
 2011 Metro Vancouver Regional Trip Diary Survey Briefing Paper #1 An Overview of Regional Demand and Mode Share Introduction The 2011 Metro Vancouver Regional Trip Diary Survey is the latest survey conducted
MANITOBA'S ABORIGINAL COMMUNITY: A 2001 TO 2026 POPULATION & DEMOGRAPHIC PROFILE
 MANITOBA'S ABORIGINAL COMMUNITY: A 2001 TO 2026 POPULATION & DEMOGRAPHIC PROFILE MBS 2005-4 JULY 2005 TABLE OF CONTENTS I. Executive Summary 3 II. Introduction.. 9 PAGE III. IV. Projected Aboriginal Identity
Population & Demographics
 Population & Demographics Conditions and Trends When looking at trends in the total number of people living in Windham (population) and at the characteristics of the people who live here by factors such
WHERE ARE ARIZONA DEMOGRAPHICS TAKING US? HOW GROWING SLOWER, OLDER AND MORE DIVERSE AFFECTS REAL ESTATE
 WHERE ARE ARIZONA DEMOGRAPHICS TAKING US? HOW GROWING SLOWER, OLDER AND MORE DIVERSE AFFECTS REAL ESTATE March 2017 Tom Rex Office of the University Economist and Center for Competitiveness and Prosperity
TRANSPORTATION TOMORROW SURVEY
 Clause No. 15 in Report No. 7 of was adopted, without amendment, by the Council of The Regional Municipality of York at its meeting held on April 17, 2014. 15 2011 TRANSPORTATION TOMORROW SURVEY recommends
Regional Profile Ebbw Vale & Blaenau Gwent
 Regional Profile Ebbw Vale & Blaenau Gwent Content Overview of Ebbw Vale Economy of Ebbw Vale & Blaenau Gwent Workforce Skills Addressing Youth Unemployment Summary Ebbw Vale & Blaenau Gwent Overview of
NC Demographic Trends Through 2035
 NC Demographic Trends Through 2035 House Select Committee on Strategic Transportation Planning and Long Term Funding Solutions February 22, 2016 Rebecca Tippett, University of North Carolina July 1 Population
Demographic Change in North Carolina
 Demographic Change in North Carolina 5 Trends to Watch North Carolina Aggregates Association June 29, 2017 Rebecca Tippett, PhD Director, Carolina Demography July 1 Population (Millions) North Carolina
Joint Strategic Needs Assessment (JSNA) Picture of Lewisham 2018
 Picture of Lewisham 2018") Joint Strategic Needs Assessment (JSNA) Picture of Lewisham 2018 Lewisham s Population Lewisham is the 13 th largest borough in London by population size and the 5 th largest in Southwark Inner London
Joint Strategic Needs Assessment (JSNA) Picture of Lewisham 2018 Lewisham s Population Lewisham is the 13 th largest borough in London by population size and the 5 th largest in Southwark Inner London
Modal Shift in the Boulder Valley 1990 to 2009
 Modal Shift in the Boulder Valley 1990 to 2009 May 2010 Prepared for the City of Boulder by National Research Center, Inc. 3005 30th Street Boulder, CO 80301 (303) 444-7863 www.n-r-c.com Table of Contents
Land Use and Cycling. Søren Underlien Jensen, Project Manager, Danish Road Directorate Niels Juels Gade 13, 1020 Copenhagen K, Denmark
 Land Use and Cycling Søren Underlien Jensen, Project Manager, Danish Road Directorate Niels Juels Gade 13, 1020 Copenhagen K, Denmark suj@vd.dk Summary: Research about correlation between land use and
East London Neighbourhood Profile
 East London Neighbourhood Profile For further information contact: John-Paul Sousa Planning Research Analyst Direct: (519) 661-2500 ext. 5989 I email: jpsousa@london.ca Page 1 Page 2 Population Characteristics
Nebraska Births Report: A look at births, fertility rates, and natural change
 University of Nebraska Omaha DigitalCommons@UNO Publications since 2000 Center for Public Affairs Research 7-2008 Nebraska Births Report: A look at births, fertility rates, and natural change David J.
Fox Hollow Neighbourhood Profile
 Fox Hollow Profile For further information contact: John-Paul Sousa Planning Research Analyst Direct: (519) 661-2500 ext. 5989 I email: jpsousa@london.ca Page 1 Page 2 Population Characteristics & Age
University Of Maryland
 2000 Census Census Data 200 Census Change 2000 to 200 SUBJECT Number Percent SUBJECT Number Percent Number Percent TOTAL POPULATION 437 TOTAL POPULATION 246-9 -43.7 White 283 64.8 White 65 67. -8-4.7 Black
Making Dublin More Accessible: The dublinbikes Scheme. Martin Rogers Colm Keenan 13th November 2012
 : The dublinbikes Scheme Martin Rogers Colm Keenan 13th November 2012 Modal Splits for Dublin 2001-2011 Dublin Mode Share Summary - Persons Crossing Canal Cordon 07.00-10.00 Year Total All PT % Car % Walk
Understanding the Pattern of Work Travel in India using the Census Data
 Understanding the Pattern of Work Travel in India using the Census Data Presented at Urban Mobility India Hyderabad (India), November 5 th 2017 Nishant Singh Research Scholar Department of Civil Engineering
BRIEFING PAPER 29 FINDINGS SERIES. Children s travel to school are we moving in the right direction?
 BRIEFING PAPER 29 FINDINGS SERIES Children s travel to school are we moving in the right direction? February 2011 FINDINGS SERIES 29 BRIEFING PAPER KEY FINDINGS National surveys show that while the level
Community Social Profile Wellesley, Wilmot and Woolwich
 Community Trends for 2013 in Cambridge, North Dumfries, Wellesley, Wilmot and Woolwich Community Social Profile - Wellesley, Wilmot and Woolwich Published December 2014 Community Social Profile Wellesley,
RED DEER HOUSING MARKET OUTLOOK
 RED DEER - JUNE 3, 2009 RED DEER HOUSING MARKET OUTLOOK Regine durand Market Analyst - CMHC Prairie and Territories 50,000 48,000 46,000 44,000 42,000 40,000 38,000 36,000 34,000 32,000 30,000 28,000 Red
Hamilton Road Neighbourhood Profile
 Hamilton Road Neighbourhood Profile For further information contact: John-Paul Sousa Planning Research Analyst Direct: (519) 661-2500 ext. 5989 I email: jpsousa@london.ca Page 1 Page 2 Population Characteristics
Coolest Cities Results Summary
 Coolest Cities Results Summary About Coolest Cities Canada s six largest urban areas provide homes and jobs for almost 15 million people, nearly half of our population. Transporting these citizens to and
Texas Housing Markets: Metropolitan vs. Border Communities. September 22, 2014
 Texas Housing Markets: Metropolitan vs. Border Communities Luis Bernardo Torres Ruiz, Ph.D. Research Economist El Paso Branch Dallas Federal Rio Grande Economic Association September 22, 2014 Contents
TRANSPORT INFRASTRUCTURE IRELAND NATIONAL ROAD NETWORK INDICATORS March 2017
 TRANSPORT INFRASTRUCTURE IRELAND NATIONAL ROAD NETWORK INDICATORS 2016 March 2017 KEY TRENDS A: KEY TREND SUMMARY 2 TRAVEL HOTSPOTS: TRAFFIC GROWTH: M50 Dublin area: 140,000 vehicles per day Hotspot: N40
Volume 1 Overview and Summary. 3 Detailed Financial Information and Council Policies. 4 Growth Forecasts
 1 Queenstown Lakes District Council Council Community Plan 2006/2016 Volume 1 Overview and Summary 2 Council Activities 3 Detailed Financial Information and Council Policies 4 Growth Forecasts 2 CONTENTS
THE I-79 CORRIDOR. I-79 provides motorists with connections to the following major highways: I-80, PA 358, PA 965 and PA 208.
 The I-79 Corridor Pittsburgh to Erie Regional Thruway I-79 was constructed through Mercer County in the early 1960s. The portion north of PA 965 opened in 1961 and the segment south of PA 965 the following
KIRKWALL PROFILE May 2014
 www.hie.co.uk KIRKWALL PROFILE May 2014 KIRKWALL PROFILE INTRODUCTION The Kirkwall profile uses 2011 Census data and other available data sources to present an up-to-date analysis of its population and
The Wisconsin and Minnesota Economies: What can we learn from each other? Noah Williams
 The Economies: What can we learn from each other? Noah University of Wisconsin - Madison Future Wisconsin Summit 2016 Economies Location, size, demographics, and history make Wisconsin and Minnesota natural
Central London Neighbourhood Profile
 Central London Neighbourhood Profile For further information contact: John-Paul Sousa Planning Research Analyst Direct: (519) 661-2500 ext. 5989 I email: jpsousa@london.ca Page 1 Page 2 Population Characteristics
ECONOMIC DEVELOPMENT ELEMENT
 ECONOMIC DEVELOPMENT ELEMENT Background The Economic Development Element considers labor force and labor force characteristics, employment by place of work and residence, and analysis of the community
Jackson Neighbourhood Profile
 Jackson Profile For further information contact: John-Paul Sousa Planning Research Analyst Direct: (519) 661-2500 ext. 5989 I email: jpsousa@london.ca Page 1 Page 2 Population Characteristics & Age Distribution
Residential Demographic Multipliers
 Rutgers University, Center for Urban Policy Research Residential Demographic Multipliers Estimates of the Occupants of New Housing (Residents, School-Age Children, Public School-Age Children) by State,
Prepared for: North Dakota Housing Finance Agency, Bismarck, ND, and its partners across the state of North Dakota
 2016 North Dakota Statewide Housing Needs Assessment: Component 3 - Detailed Tables Accompanying data to the 2016 North Dakota Statewide Housing Needs Assessment: Population & Housing Forecast Issued:
Westminster Neighbourhood Profile
 Westminster Profile For further information contact: John-Paul Sousa Planning Research Analyst Direct: (519) 661-2500 ext. 5989 I email: jpsousa@london.ca Page 1 Page 2 Population Characteristics & Age
Oakmont: Who are we?
 Oakmont: Who are we? A Snapshot of our community from the April 2010 US Census Contents Age and Gender... 1 Marital Status... 2 Home Ownership and Tenure... 3 Past Demographic Characteristics... 5 Income
U.S. Property Market Outlook, 2013Q1. Jim Costello, Managing Director CBRE Americas Research Investment Research
 U.S. Property Market Outlook, 2013Q1 Jim Costello, Managing Director CBRE Americas Research Investment Research CBRE Page 2 Outlook for the Real Side of the Economy Operationally, what do Research Teams
Developing Regional Solutions In Southeast Michigan
 Developing Regional Solutions In Southeast Michigan Presentation to Metropolitan Detroit Medical Library Group March 15, 2018 Membership Map 171 Total Members Including education members: Livingston Educational
Domestic Energy Fact File (2006): Owner occupied, Local authority, Private rented and Registered social landlord homes
: Owner occupied, Local authority, Private rented and Registered social landlord homes") Domestic Energy Fact File (2006): Owner occupied, Local authority, Private rented and Registered social landlord homes Domestic Energy Fact File (2006): Owner occupied, Local authority, Private rented
Domestic Energy Fact File (2006): Owner occupied, Local authority, Private rented and Registered social landlord homes Domestic Energy Fact File (2006): Owner occupied, Local authority, Private rented
The Outlook for Real Estate and Residential Construction. Patrick M. Barkey, Director Bureau of Business and Economic Research University of Montana
 The Outlook for Real Estate and Residential Construction Patrick M. Barkey, Director Bureau of Business and Economic Research University of Montana Montana s Real Estate Performance: Getting Back to Boom
Huron Heights Neighbourhood Profile
 Huron Heights Neighbourhood Profile For further information contact: John-Paul Sousa Planning Research Analyst Direct: (519) 661-2500 ext. 5989 I email: jpsousa@london.ca Page 1 Page 2 Population Characteristics
Stoney Creek Neighbourhood Profile
 Stoney Creek Profile For further information contact: John-Paul Sousa Planning Research Analyst Direct: (519) 661-2500 ext. 5989 I email: jpsousa@london.ca Page 1 Page 2 Population Characteristics & Age
NC Demographic Trends Through 2035
 NC Demographic Trends Through 2035 Joint Appropriation Committee on Transportation February 21, 2017 Rebecca Tippett, PhD Director, Carolina Demography July 1 Population (Millions) North Carolina s Total
Fixed Guideway Transit Outcomes on Rents, Jobs, and People and Housing
 Fixed Guideway Transit Outcomes on Rents, Jobs, and People and Housing Arthur C. Nelson, Ph.D., ASCE, FAICP Professor of Planning and Real Estate Development University of Arizona 1 Changing Transportation
Ector County I.S.D. Demographic Update
 Ector County I.S.D. Demographic Update April 2017 E.C.I.S.D. Demographic Trends Employment Trends Housing Projections Ratios: Students per Household Projected Student Enrollment 2 1 Numeric Change in Student
New town planning and imbalanced development: The case of Stevenage
 New town planning and imbalanced development: The case of Stevenage Mohammad, A. Shokouhi Department of Geography Ferdowsi University, Campus University Azadi Squre Mashhad Iran. Abstract: The major differences
Social Development Index 2018 ( )
") Social Development Index 2018 (23-5-2018) Social Development Index 2018 Introduction to Social Development Index Introduction to Social Development Index (SDI) A system of objective indicators including:
Social Development Index 2018 (23-5-2018) Social Development Index 2018 Introduction to Social Development Index Introduction to Social Development Index (SDI) A system of objective indicators including:
Southcrest Neighbourhood Profile
 Southcrest Neighbourhood Profile For further information contact: John-Paul Sousa Planning Research Analyst Direct: (519) 661-2500 ext. 5989 I email: jpsousa@london.ca Page 1 Page 2 Population Characteristics
1999 On-Board Sacramento Regional Transit District Survey
 SACOG-00-009 1999 On-Board Sacramento Regional Transit District Survey June 2000 Sacramento Area Council of Governments 1999 On-Board Sacramento Regional Transit District Survey June 2000 Table of Contents
Michigan Population Trends: The School Age Population
 Michigan Population Trends: The School Age Population Eric Guthrie Michigan s State Demographer January 16, 2018 State Demographer Michigan s liaison with the U.S. Census Bureau for most programs including
Acknowledgements. Ms. Linda Banister Ms. Tracy With Mr. Hassan Shaheen Mr. Scott Johnston
 Acknowledgements The 2005 Household Travel Survey was funded by the City of Edmonton and Alberta Infrastructure and Transportation (AIT). The survey was led by a steering committee comprised of: Dr. Alan
A Threatened Bay: Challenges to the Future of the Penobscot Bay Region and its Communities
 A Threatened Bay: Challenges to the Future of the Penobscot Bay Region and its Communities 1 A A Threatened Bay: Challenges to the Future of the Penobscot Bay Region and its Communities In 1996 the Island
The Impact of TennCare: A Survey of Recipients 2009
 The Impact of TennCare: A Survey of Recipients 2009 Christopher Carty Research Associate, Center for Business and Economic Research William F. Fox Director, Center for Business and Economic Research and
Webinar: The Association Between Light Rail Transit, Streetcars and Bus Rapid Transit on Jobs, People and Rents
 Portland State University PDXScholar TREC Webinar Series Transportation Research and Education Center (TREC) 11-15-2016 Webinar: The Association Between Light Rail Transit, Streetcars and Bus Rapid Transit
NC s Shifting Population: Growth, Decline, and Rebound
 NC s Shifting Population: Growth, Decline, and Rebound House Select Committee on Strategic Transportation Planning and Long-Term Funding Solutions April 30, 2018 Rebecca Tippett, PhD Director, Carolina
2016 Capital Bikeshare Member Survey Report
 2016 Capital Bikeshare Member Survey Report Prepared by: LDA Consulting Washington, DC 20015 (202) 548-0205 February 24, 2017 EXECUTIVE SUMMARY Overview This report presents the results of the November
Additional Policies & Objectives for Local Area Plans Ashbourne LAP. Ashbourne
 Ashbourne Strategic Policies SP 1 To operate an Order of Priority for the release of residential lands in compliance with the requirements of CS OBJ 6 of the County Development Plan as follows: i) The
Understanding barriers to participation across gender, age & disability
 Understanding barriers to participation across gender, age & disability Dr. Rachel Aldred University of Westminster www.rachelaldred.org @RachelAldred Cycling is or is it? Not for disabled people A white
Housing Market Update Greater Moncton. Housing market intelligence you can count on
 Housing Market Update Greater Moncton Housing market intelligence you can count on Housing Market Drivers Multi-Residential/Rental Market New Home Market Single Family Homes Resale Market 2013/2014 Outlook
nipigon.net Township of Nipigon 2018 Community Profile
 nipigon.net Township of Nipigon V 1.0 February 2018 2018 Nipigon nipigon.net nipigon.net Township of Nipigon nipigon.net Township of Nipigon nipigon.net Township of Nipigon nipigon.net Township of Nipigon
WORLD. Geographic Trend Report for GMAT Examinees
 2012 WORLD Geographic Trend Report for GMAT Examinees WORLD Geographic Trend Report for GMAT Examinees The World Geographic Trend Report for GMAT Examinees identifies mobility trends among candidates applying
The Impact of TennCare: A Survey of Recipients 2006
 The Impact of TennCare: A Survey of Recipients 2006 Brad Kiser Research Associate, Center for Business and Economic Research William F. Fox Director, Center for Business and Economic Research and Professor
Exceeding expectations: The growth of walking in Vancouver and creating a more walkable city in the future through EcoDensity
 Exceeding expectations: The growth of walking in Vancouver and creating a more walkable city in the future through EcoDensity Melina Scholefield, P. Eng. Manager, Sustainability Group, City of Vancouver
HEALTH INSURANCE COVERAGE STATUS American Community Survey 1-Year Estimates
 S2701 HEALTH INSURANCE COVERAGE STATUS 2014 American Community Survey 1-Year Estimates Supporting documentation on code lists, subject definitions, data accuracy, and statistical testing can be found on
Nevada County Population Projections 2015 to 2034
 Nevada County Population Projections 2015 to 2034 Prepared By: Jeff Hardcastle, AICP Nevada State Demographer Nevada Department of Taxation Reno Office: 4600 Kietzke Lane, Building L Suite 235 Reno, NV
PERSONALISED TRAVEL PLANNING IN MIDLETON, COUNTY CORK
 PERSONALISED TRAVEL PLANNING IN MIDLETON, COUNTY CORK Elaine Brick Principal Transport Planner AECOM Abstract Smarter Travel funding was awarded to the Chartered Institute of Highways and Transportation
Determining bicycle infrastructure preferences A case study of Dublin
 *Manuscript Click here to view linked References 1 Determining bicycle infrastructure preferences A case study of Dublin Brian Caulfield 1, Elaine Brick 2, Orla Thérèse McCarthy 1 1 Department of Civil,
HOUSING NOW TABLES Trois-Rivières CMA
 Housing M a r k e t Infor m at ion HOUSING NOW TABLES Trois-Rivières CMA Date Released: First Quarter 2016 Housing market intelligence you can count on Housing Now Tables - Trois-Rivières CMA - Date Released
Lewisham Pharmaceutical Needs Assessment Appendix B - Lewisham The Place
 Lewisham Pharmaceutical Needs Assessment 2018 Appendix B - Lewisham The Place Lewisham is the 13 th largest borough in London by population size and the 5 th largest in Southwark Inner London Source: MYE
Statistical Profile of the Osceola County School District
 of the Osceola County District The Osceola County District is facing many challenges including low student performance and rapid population changes. County Profile This section describes the statistical
A review of 2015 fatal collision statistics as of 31 December 2015
 A review of fatal collision statistics as of 31 December This report summarises the main trends in road fatalities that have emerged in. This has been prepared by the Road Safety Authority following analysis
2011 Census Profile for Loxley CP with Stratford included as a comparison geography
 Demography Number Percentage Rank () Number Percentage Rank (5) Demography Number Percentage Rank () Number Percentage Rank (5) Total Population 399 N/A 120,485 3 Males 198 49.6% N/A 58,497 48.6% 5 Females
Review of Fatal Collisions
 Review of Fatal Collisions January to July 1 st 16 Review of 16 fatal collision statistics as of 1st July 16 Overview This report summarises the main trends in road fatalities that have emerged up to the
2009 Master Plan & Reexamination Report Verona, New Jersey
 2009 Master Plan & Reexamination Report Verona, New Jersey MASTER PLAN TOWNSHIP OF VERONA, NEW JERSEY PREPARED FOR THE PLANNING BOARD OF THE TOWNSHIP OF VERONA, NJ PREPARED BY KASLER ASSOCIATES, PA 34
Not For Sale. An American Profile: The United States and Its People
 An American Profile: The United States and Its People Not For Sale 1 759_EM_AmPro_ptg1.indd 1 Not For Sale 759_EM_AmPro_ptg1.indd 2 An American Profile: The United States and Its People 3 Table 1 Population,
Relationship Between Child Pedestrian Accidents and City Planning in Zarqa, Jordan
 112 TRANSPORTATION RESEARCH RECORD 1281 Relationship Between Child Pedestrian Accidents and City Planning in Zarqa, Jordan ADU H. AL-BALBISSI, MOHAMED T. ABOUL-ELA, AND SABAH SAMMOUR The relationship between
Factors Associated with the Bicycle Commute Use of Newcomers: An analysis of the 70 largest U.S. Cities
 : An analysis of the 70 largest U.S. Cities Ryan J. Dann PhD Student, Urban Studies Portland State University May 2014 Newcomers and Bicycles Photo Credit: Daveena Tauber 2 Presentation Outline Introduction
WOMEN IN THE NWT - SUMMARY
 In 16, 44,469 people lived in the Northwest Territories (NWT) with females accounting for just under half (49%) of the population. The NWT population consists of almost equal numbers of Indigenous (First
Maynooth Traffic Management Plan & Traffic Model
 Maynooth Traffic Management Plan & Traffic Model Traffic Survey Report Draft September 6 Designer AECOM Adelphi Plaza George's Street Upper Dún Laoghaire Co.Dublin Client Kildare County Council Aras Cill
Drivers of cycling demand and cycling futures in the Danish context.
 Downloaded from orbit.dtu.dk on: Dec 17, 2017 Drivers of cycling demand and cycling futures in the Danish context. Nielsen, Thomas Alexander Sick; Christiansen, Hjalmar; Jensen, Carsten; Skougaard, Britt
Vision - Britain's Ocean City One of Europe's most vibrant waterfront cities where an outstanding quality of life is enjoyed by everyone
 PLYMOUTH Economy Nina Sarlaka, Enterprise & Inward Investment Manager Vision - Britain's Ocean City One of Europe's most vibrant waterfront cities where an outstanding quality of life is enjoyed by everyone
Guidelines for Providing Access to Public Transportation Stations APPENDIX C TRANSIT STATION ACCESS PLANNING TOOL INSTRUCTIONS
 APPENDIX C TRANSIT STATION ACCESS PLANNING TOOL INSTRUCTIONS Transit Station Access Planning Tool Instructions Page C-1 Revised Final Report September 2011 TRANSIT STATION ACCESS PLANNING TOOL INSTRUCTIONS
A Profile of Plaistow South Big Local Area
 A Profile of Plaistow South Big Local Area DRAFT2 GENERAL DESCRIPTION Plaistow South Big Local is situated in the London Borough of Newham, in east London. It is comprised of 5 of the 8 Local Super Output
Small Business Dynamics and Job Creation. Small Business Numbers, Pretty Pictures and Not So Pretty Pictures
 Small Business Dynamics and Job Creation Or Small Business Numbers, Pretty Pictures and Not So Pretty Pictures Brian Headd Office of Advocacy U.S. Small Business Administration Employers 8,000,000 7,500,000
Participation. Workers Compensation Insurance Seminar. May 22, Nick Beleiciks
 Oregon s Falling Labor Force Participation Workers Compensation Insurance Seminar May 22, 2013 Nick Beleiciks Let s start with a simple graph. Oregon Employment Loss by Recession 0% % Job Loss from Peak
Key Ward Information - Cowes South and Northwood (part of the Cowes cluster of wards)
") Key Ward Information - Cowes South and Northwood - 2017 (part of the Cowes cluster of wards) This report has been designed to support provide data and information about Cowes South and Northwood and compare
Key Ward Information - Cowes South and Northwood - 2017 (part of the Cowes cluster of wards) This report has been designed to support provide data and information about Cowes South and Northwood and compare
State of the City of Carpinteria
 April 21, 2017 Mark Schniepp Director State of the City of Carpinteria jobs 1,000 Employment in Information / Carpinteria Valley 2006 -- 2016 800 600 400 200 0 2006 2008 2010 2012 2014 2016 ConstructiveDIVE.com
An American Profile: The United States and Its People
 An American Profile: The United States and Its People 1 153641_EM_AmPro.indd 1 12/16/8 11:1:32 PM An American Profile: The United States and Its People 3 Table 1 Population, Percentage Change, and Racial
DEVELOPMENT OF A SET OF TRIP GENERATION MODELS FOR TRAVEL DEMAND ESTIMATION IN THE COLOMBO METROPOLITAN REGION
 DEVELOPMENT OF A SET OF TRIP GENERATION MODELS FOR TRAVEL DEMAND ESTIMATION IN THE COLOMBO METROPOLITAN REGION Ravindra Wijesundera and Amal S. Kumarage Dept. of Civil Engineering, University of Moratuwa
Title VI Fare Change Equity Analysis
 Title VI Fare Change Equity Analysis Evaluation Report Submitted to Dallas Area Rapid Transit Submitted by TranSystems June 2012 Title VI Fare Change Equity Analysis Introduction DART has proposed a schedule
COOPERATIVE EXTENSION Bringing the University to You
 COOPERATIVE EXTENSION Bringing the University to You Special Publication - 06-16 ECONOMIC IMPACT OF TOURISM ON COLORADO RIVER COMMUNITIES INCLUDING: LAUGHLIN BULLHEAD CITY FORT MOHAVE MOHAVE VALLEY GOLDEN
Americans in Transit A Profile of Public Transit Passengers
 Americans in Transit A Profile of Public Transit Passengers published by American Public Transit Association December 1992 Louis J. Gambacclnl, Chairman Rod Diridon, Vice Chairman Fred M. Gilliam, Secretary-Treasurer
CHAPTER 4: IDENTIFICATION OF ROAD SYSTEM DEFICIENCIES: TRANSPORTATION PLANNING MODEL
 CHAPTER 4: IDENTIFICATION OF ROAD SYSTEM DEFICIENCIES: TRANSPORTATION PLANNING MODEL I. INTRODUCTION Transportation planning models are the primary tools used to predict future travel conditions. With
Bob Costello Chief Economist & Vice President American Trucking Associations. Economic & Motor Carrier Industry Trends. September 10, 2013
 Bob Costello Chief Economist & Vice President American Trucking Associations Economic & Motor Carrier Industry Trends September 10, 2013 The Freight Economy Washington continues to be a headwind on economic