New Data for Vermont and our Communities: A Focus on Programs of the U.S. Census Bureau Town Officer Education Seminars uvm.
|
|
|
- Oscar Townsend
- 6 years ago
- Views:
Transcription
1 New Data for Vermont and our Communities: A Focus on Programs of the U.S. Census Bureau 2011 Town Officer Education Seminars
2 Our Focus Today
3 Accessing the Data Target to serve 2010 Census and ACS 5 year data in Summer/Fall 2011.
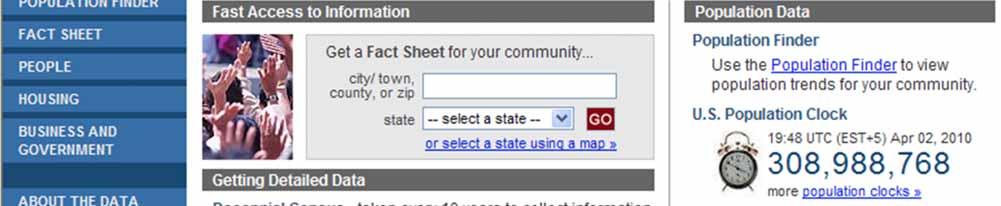
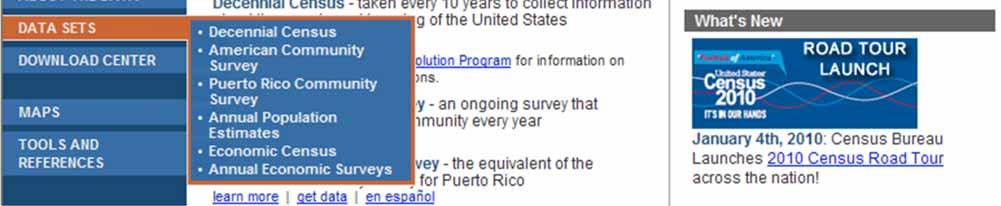
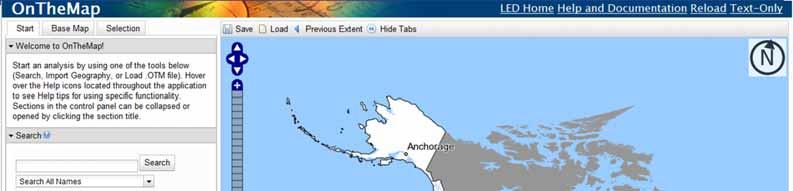
4 American FactFinder factfinder.census.gov factfinder2.census.gov
5 February 2011 Population Age 18 Race and Ethnicity Occupied and Vacant Housing
6 More on the Way Age Household size and composition Housing tenure and vacancy types Full dataset Including urban and rural counts
7 Review of Changes in 2010
8 Which one do I Use? Even after it is getting old But nowhere near as accurate as Census


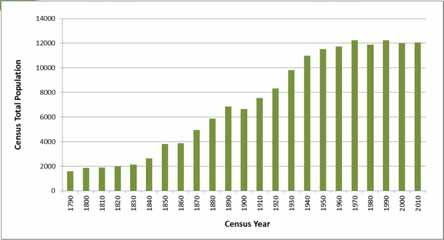
9 2010 Census Vermont s resident population on April 1, 2010 was 625,741. Growth rate of 2.8% from 2000 Rate of growth 44 th in the nation


10 Share of State Population County % Change Addison County Bennington County Caledonia County Chittenden County Essex County Franklin County Grand Isle County Lamoille County Orange County Orleans County Rutland County Washington County Windham County Windsor County
11 Traditional Centers Brattleboro Morristown St. Albans City


12 Rural and New Growth Stowe Belvidere Fairfax
13 New and Old Dynamics Communities with Designated Downtowns as a Proxy


14 Across the State Towns as share of State Population. Keyed to 4 equal groups in


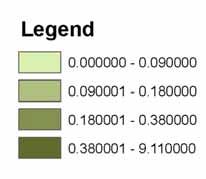
15 Percent Loss of Population Under Vermont statewide lost 12.4% (more than 18,000) U.S. Census Bureau 2000 & 2010 Census
16 Doubtful of Your Count?


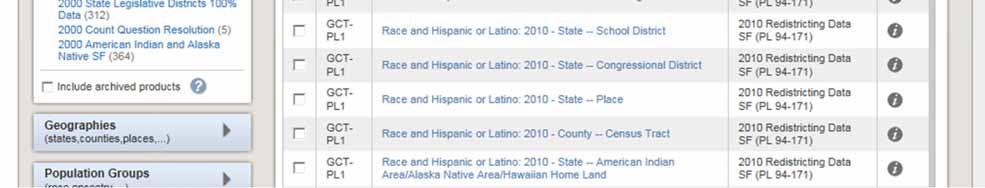
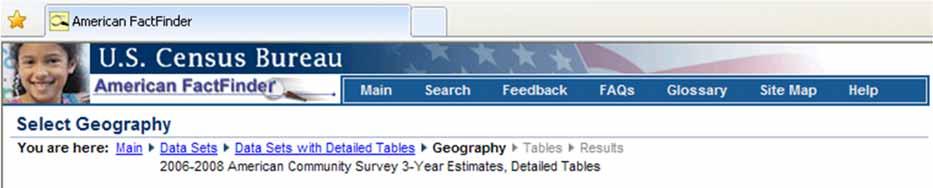
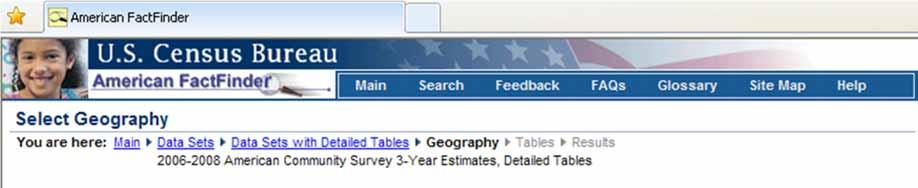
17 New American FactFinder factfinder2.census.gov Source for 2010 Census


18 Here for choosing data and datasets Here for geography


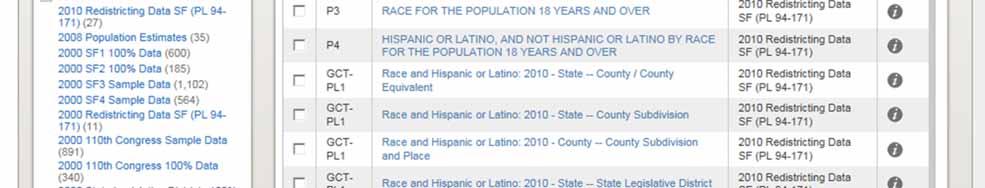
19 Topic, Dataset, 2010 Census


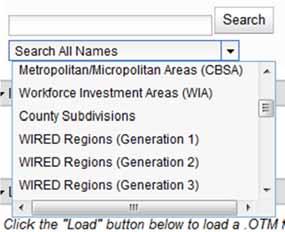
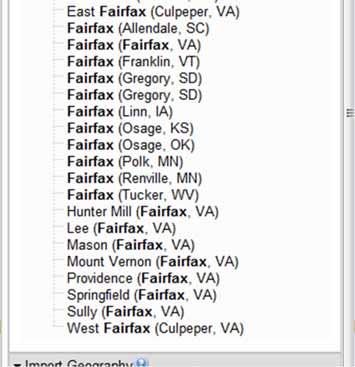
20 For Towns: Choose County Subdivisions! Dataset Chosen Here Geography, Summary Level, County Subdivisions


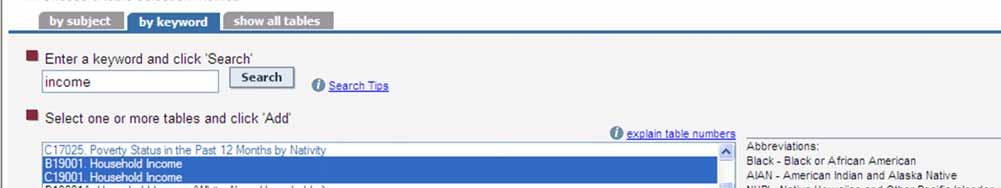
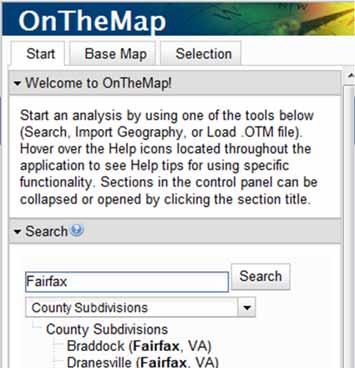
21 Search or Choose All


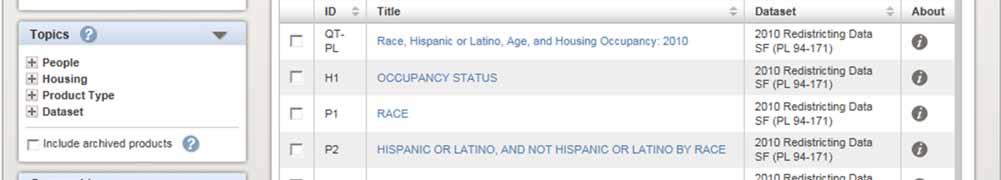
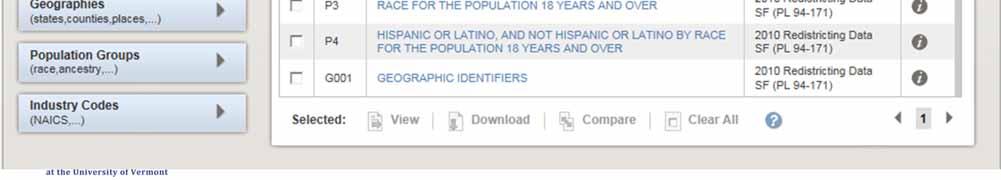

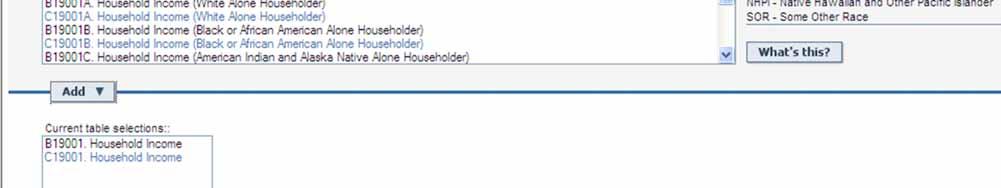
22 Options Chosen Here Choose a Table!
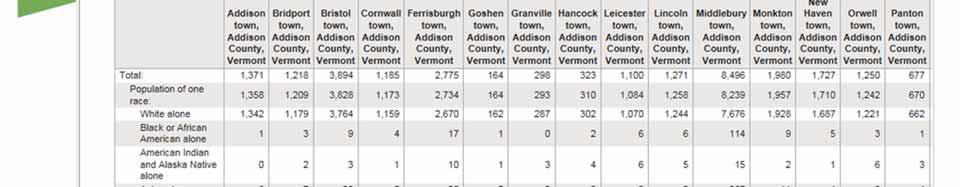


23 Total Population
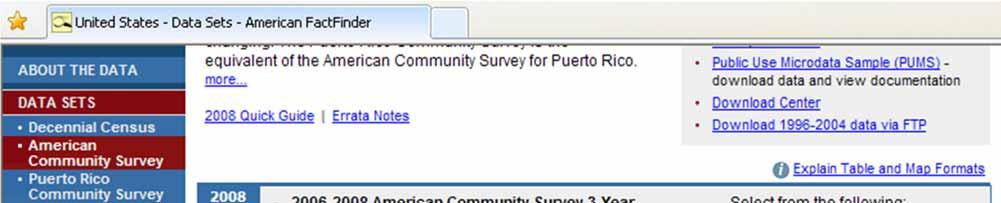
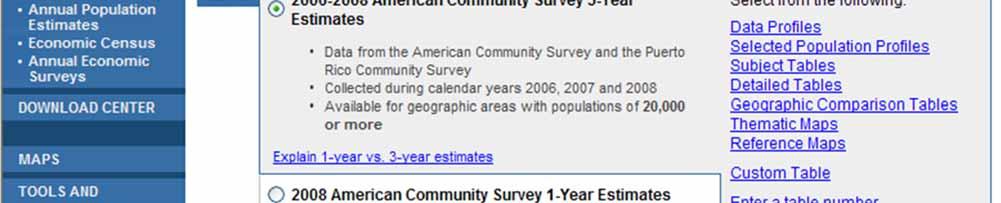
24 American Community Survey
25 American Community Survey
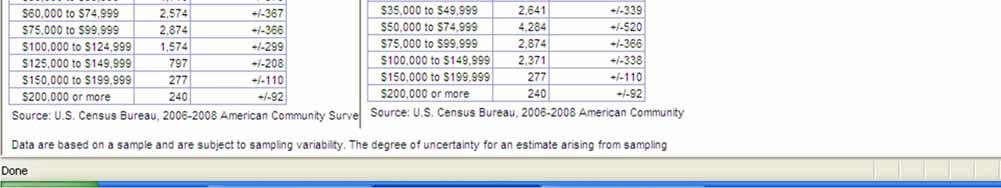
26 American Community Survey Combine more than one year s sample Not Averages!
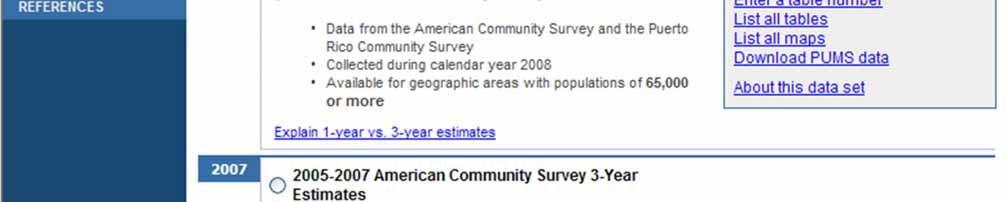
27 ACS and Availability 1 Year Estimates Latest 2009 For Vermont and Chittenden County 3 Year Estimates Latest For Vermont, 12 Counties and Burlington 5 Year Estimates Latest For All Geographies Always compare within the same period estimate. E.g. don t compare 3 year data to 5 year data
28 Multi Year Estimates Example of 5-year average graph Only two values truly independent of each other Average % year period


29 ACS Test Site Data Courtesy of Nebraska State Data Center Multi-year estimates subject to lag in reflection of trends.
30 Margins of Error American Community Survey Poverty Rate Estimate MOE Vermont COUNTY Addison County Bennington County Caledonia County Chittenden County Essex County Franklin County Grand Isle County Lamoille County Orange County Orleans County Rutland County Washington County Windham County Windsor County Data actually in ranges Allow tests for statistical significance
31 Statistical Significance American Community Survey Poverty Rate Estimate MOE Vermont COUNTY Essex County Orleans County Caledonia County Lamoille County Addison County Rutland County Bennington County Franklin County Windham County Chittenden County Washington County Windsor County Orange County Grand Isle County Not Statistically Different

32
33 Median Household Income 1999 Adjusted 2005 for Inflation to Geography (BLS) 2009 Margin Trend Vermont 40,856 52,610 51,284 ±467 Addison County 43,142 55,554 55,427 ±1,796 Bennington County 39,926 51,413 46,265 ±2,247 Caledonia County 34,800 44,812 41,897 ±1,607 Chittenden County 47,673 61,389 59,634 ±1,372 Essex County 30,490 39,262 40,046 ±2,771 Franklin County 41,659 53,644 52,279 ±1,799 Grand Isle County 43,033 55,414 56,202 ±2,522 Lamoille County 39,356 50,679 51,037 ±2,260 Orange County 39,855 51,321 51,011 ±1,515 Orleans County 31,084 40,027 40,605 ±1,295 Rutland County 36,743 47,314 46,153 ±1,287 Washington County 40,972 52,760 54,227 ±1,637 Windham County 38,204 49,195 46,465 ±1,362 Windsor County 40,688 52,394 51,066 ±1,658 Sources: U.S. Census Bureau, 2000 Census and American Community Survey


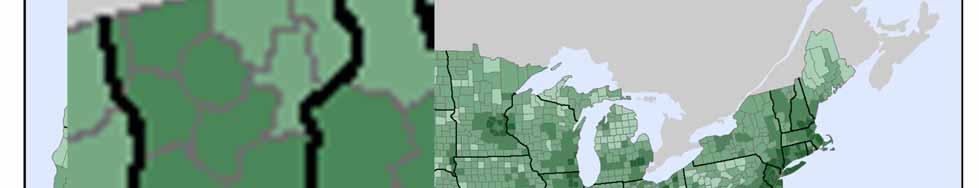
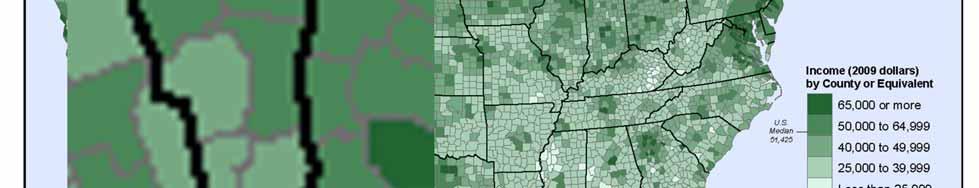
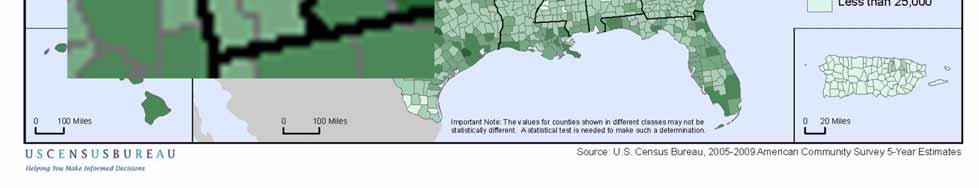
34 Median Household Income, ( previous 12 months ) U.S. Census Bureau American Community Survey Note: Margins of Error not shown
35
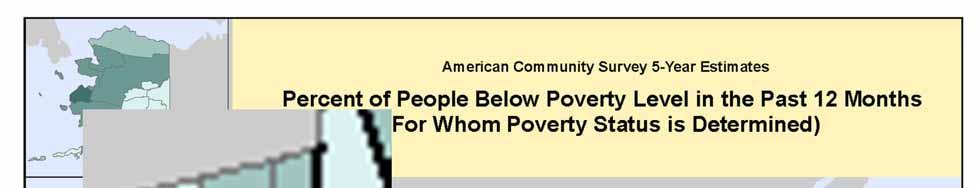
36 Poverty Rate Geography Vermont ±0.4 Addison County ±1.4 Bennington County ±1.9 Caledonia County ±1.6 Chittenden County ±0.7 Essex County ±2.2 Franklin County ±1.7 Grand Isle County ±1.7 Lamoille County ±2.1 Orange County ±1.4 Orleans County ±1.5 Rutland County ±1.1 Washington County ±1.2 Windham County ±1.4 Windsor County ± Margin Trend Sources: U.S. Census Bureau, 2000 Census and American Community Survey
 U.S.")

37 % People Below Poverty, ( previous 12 months ) U.S. Census Bureau American Community Survey Note: Margins of Error not shown
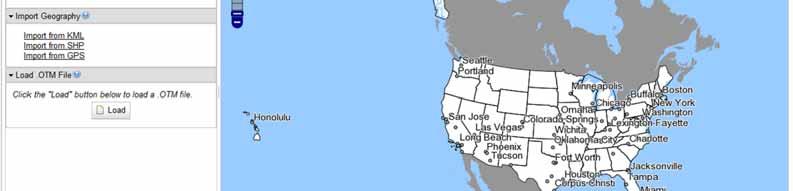
38 Accessing the ACS

39
40

41

42


43


44


45
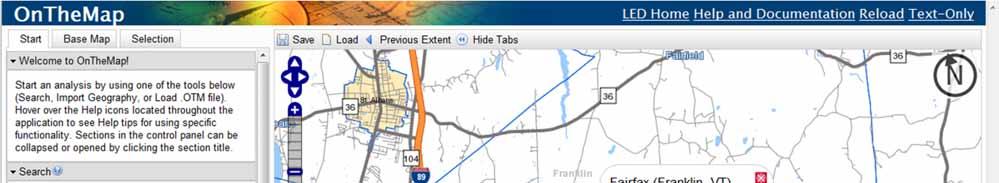
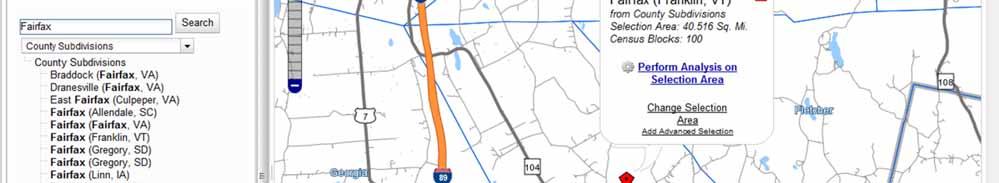
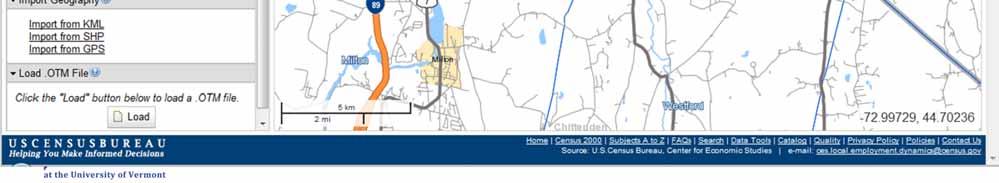
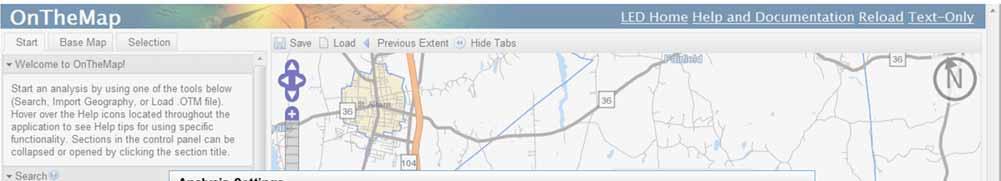
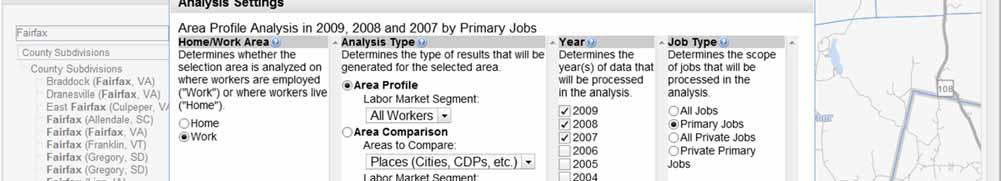
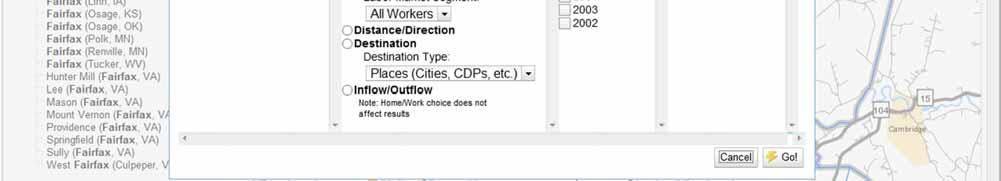
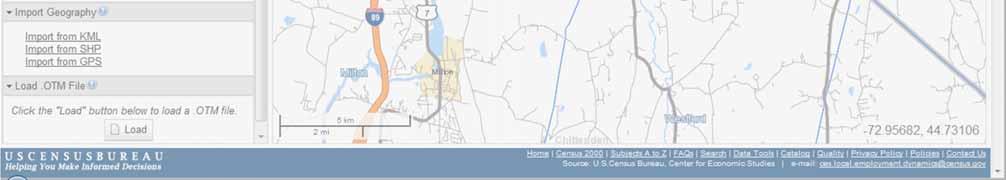
46 LEHD On The Map

47
48
49
50


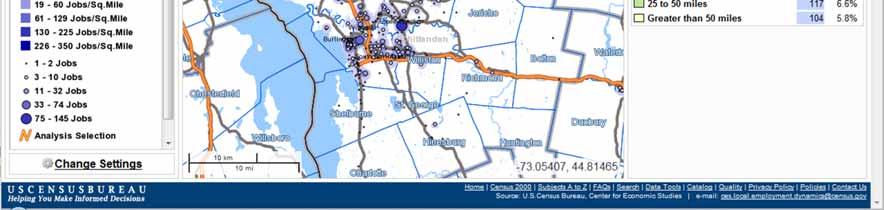
51 Distance people travel to work


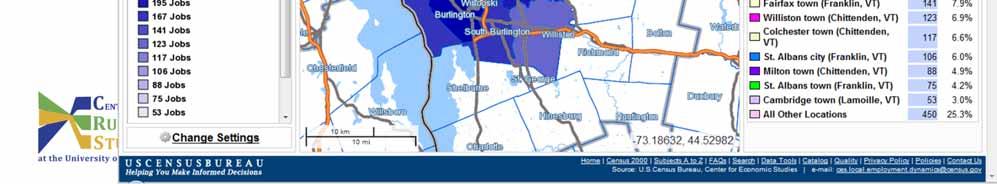
52 Where People Commute to


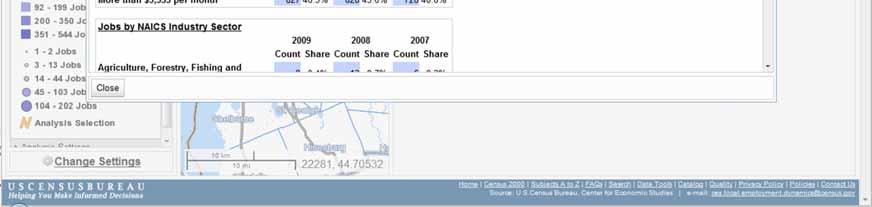
53 Labor Market Profile
54 Web Links Vermont State Data Center American FactFinder LEHD On the Map American Community Survey Info Vermont Indicators Online Vermont Housing Data
55 Host a Presentation!
56 Find this Presentation

57 Thank you! resources and expertise to support rural people and communities Will Chip Sawyer Vermont State Data Center at the UVM Center for Rural Studies crs.uvm.edu/census U.S. Census Bureau: census.gov This presentation contains materials based upon work supported by the U.S. Department of Agriculture, under Award No Any opinions, findings, conclusions, or recommendations expressed in this publication are those of the author s and do not necessarily reflect the views of the U.S. Department of Agriculture. Special thanks to Senator Patrick Leahy.
2017 Nebraska Profile
 2017 Nebraska Profile State, 9 NEW Regions, 93 Counties, plus 31 Cities Three Volumes Demographic Change in the State Economic Influences at Work Housing Statistics and Trends Summary of Findings Discuss
HEALTH INSURANCE COVERAGE STATUS American Community Survey 1-Year Estimates
 S2701 HEALTH INSURANCE COVERAGE STATUS 2014 American Community Survey 1-Year Estimates Supporting documentation on code lists, subject definitions, data accuracy, and statistical testing can be found on
Improving the Accuracy and Reliability of ACS Estimates for Non-Standard Geographies Used in Local Decision Making
 Improving the Accuracy and Reliability of ACS Estimates for Non-Standard Geographies Used in Local Decision Making Warren Brown, Joe Francis, Xiaoling Li, and Jonnell Robinson Cornell University Outline
Population & Demographics
 Population & Demographics Conditions and Trends When looking at trends in the total number of people living in Windham (population) and at the characteristics of the people who live here by factors such
Economic Update Edward Seiler NH&RA
 Economic Update Edward Seiler NH&RA 2 Annual Real GDP Growth (%) 5.0 4.0 Actual (BEA) Forecast (CBO in red, OMB red + orange) 3.0 2.0 1.0 0.0-1.0 1990 1991 1992 1993 1994 1995 1996 1997 1998 1999 2000
Prepared for: North Dakota Housing Finance Agency, Bismarck, ND, and its partners across the state of North Dakota
 2016 North Dakota Statewide Housing Needs Assessment: Component 3 - Detailed Tables Accompanying data to the 2016 North Dakota Statewide Housing Needs Assessment: Population & Housing Forecast Issued:
Understanding Transit Demand. E. Beimborn, University of Wisconsin-Milwaukee
 Understanding Transit Demand E. Beimborn, University of Wisconsin-Milwaukee 1 Purpose To provide a basic understanding of transit ridership and some common misunderstandings. To explain concepts of choice
There are three major federal data sources that we evaluate in our Bicycle Friendly States ranking:
 Since the landmark Intermodal Surface Transportation Efficiency Act (ISTEA) created the Transportation Enhancements program in 1991 bicycle and pedestrian projects have been eligible for programmatic federal
APPENDIX A COUNTY-LEVEL HOUSING CHARACTERISTICS IN 2000
 APPENDIX A COUNTY-LEVEL HOUSING CHARACTERISTICS IN 2000 Overview There are 67 counties in Pennsylvania, some of which are urban and others rural. Pennsylvania is home to the major cities of Philadelphia
Summary of Travel Trends Findings from the 2017 NHTS. Nancy McGuckin, Travel Behavior Analyst Anthony Fucci, Westat
 1 Summary of Travel Trends Findings from the 2017 NHTS Nancy McGuckin, Travel Behavior Analyst Anthony Fucci, Westat 2 A BIG thank you to: FHWA Team: Danny Jenkins, FHWA Stacey Bricka, Macrosys Tim Reusher,
Estimating Ridership of Rural Public Demand- Response Transit
 Estimating Ridership of Rural Public Demand- Response Transit Wednesday, November 16, 2016 U.S. Department of Transportation Federal Transit Administration Jeremy Mattson Associate Research Fellow, Small
NC Demographic Trends Through 2035
 NC Demographic Trends Through 2035 House Select Committee on Strategic Transportation Planning and Long Term Funding Solutions February 22, 2016 Rebecca Tippett, University of North Carolina July 1 Population
Oakmont: Who are we?
 Oakmont: Who are we? A Snapshot of our community from the April 2010 US Census Contents Age and Gender... 1 Marital Status... 2 Home Ownership and Tenure... 3 Past Demographic Characteristics... 5 Income
INDEX OF RIVERS & STREAMS
 INDEX OF RIVERS & STREAMS For rivers, stream,brooks and creeks NOT LISTED in this index, see Table 1, Table 3, and Table 4 Alder Brook Black River to Sargent Pond Outlet Coventry Orleans 1 3 1 Closed to
U.S. Property Market Outlook, 2013Q1. Jim Costello, Managing Director CBRE Americas Research Investment Research
 U.S. Property Market Outlook, 2013Q1 Jim Costello, Managing Director CBRE Americas Research Investment Research CBRE Page 2 Outlook for the Real Side of the Economy Operationally, what do Research Teams
Demographic Change in North Carolina
 Demographic Change in North Carolina 5 Trends to Watch North Carolina Aggregates Association June 29, 2017 Rebecca Tippett, PhD Director, Carolina Demography July 1 Population (Millions) North Carolina
University Of Maryland
 2000 Census Census Data 200 Census Change 2000 to 200 SUBJECT Number Percent SUBJECT Number Percent Number Percent TOTAL POPULATION 437 TOTAL POPULATION 246-9 -43.7 White 283 64.8 White 65 67. -8-4.7 Black
Factors Associated with the Bicycle Commute Use of Newcomers: An analysis of the 70 largest U.S. Cities
 : An analysis of the 70 largest U.S. Cities Ryan J. Dann PhD Student, Urban Studies Portland State University May 2014 Newcomers and Bicycles Photo Credit: Daveena Tauber 2 Presentation Outline Introduction
Current Report: Community Profile Report of Congressional District: Texas's 25th District
 Current Report: Community Profile Report of Congressional District: Texas's 25th District Date: January 30, 2017 Proposed Location: This location, Texas's 25th District (Congressional District, 114th),
ZONE ANALYSIS FOR BICYCLE PLANNING. Department of Transportation Safe Streets Division Bicycle & Pedestrian Program June 2018
 ZONE ANALYSIS FOR BICYCLE PLANNING Department of Transportation Safe Streets Division Bicycle & Pedestrian Program June 2018 CONTENTS INTRODUCTION...3 DEFINING THE ZONES...4 BASIC FACTS...5 SOCIOECONOMICS...6
Regional Real Estate Trends
 Regional Real Estate Trends Terry L. Clower, Ph.D. Director, Center for Regional Analysis Schar School of Policy and Government George Mason University April 6, 2018 140.0 120.0 100.0 80.0 60.0 40.0 20.0
Not For Sale. An American Profile: The United States and Its People
 An American Profile: The United States and Its People Not For Sale 1 759_EM_AmPro_ptg1.indd 1 Not For Sale 759_EM_AmPro_ptg1.indd 2 An American Profile: The United States and Its People 3 Table 1 Population,
NC Demographic Trends Through 2035
 NC Demographic Trends Through 2035 Joint Appropriation Committee on Transportation February 21, 2017 Rebecca Tippett, PhD Director, Carolina Demography July 1 Population (Millions) North Carolina s Total
STRAVA - DATA ACCESS AND USES. March 9, 2016 Shaun Davis + Dewayne Carver Florida Dept. of Transportation
 STRAVA - DATA ACCESS AND USES March 9, 2016 Shaun Davis + Dewayne Carver Florida Dept. of Transportation AGENDA Training Accessing the Data Data Characteristics Potential Uses Question and Answer WHAT
Demographic Characteristics and Trends of Bexar County and San Antonio, TX
 Demographic Characteristics and Trends of Bexar County and San Antonio, TX Leadership San Antonio Understand Infrastructure. Prepare for Growth. May 2, 2012 San Antonio, TX Select Growing States, 2000-2010
On The Road Again CLAREMORE INDUSTRIAL PARK COMMUTING STUDY
 On The Road Again CLAREMORE INDUSTRIAL PARK COMMUTING STUDY 2 On The Road Again Overview of Study Every day, almost 2,000 people go to work at the Claremore Industrial Park. The park is located in Rogers
Fox Hollow Neighbourhood Profile
 Fox Hollow Profile For further information contact: John-Paul Sousa Planning Research Analyst Direct: (519) 661-2500 ext. 5989 I email: jpsousa@london.ca Page 1 Page 2 Population Characteristics & Age
Fixed Guideway Transit Outcomes on Rents, Jobs, and People and Housing
 Fixed Guideway Transit Outcomes on Rents, Jobs, and People and Housing Arthur C. Nelson, Ph.D., ASCE, FAICP Professor of Planning and Real Estate Development University of Arizona 1 Changing Transportation
2016 VERMONT WILDLIFE HARVEST REPORT WILD TURKEY
 2016 VERMONT WILDLIFE HARVEST REPORT WILD TURKEY FISH & WILDLIFE DEPARTMENT (802) 828-1000 / www.vtfishandwildlife.com 2016 Vermont Wild Turkey Report Most of the programs described in this report are
Webinar: The Association Between Light Rail Transit, Streetcars and Bus Rapid Transit on Jobs, People and Rents
 Portland State University PDXScholar TREC Webinar Series Transportation Research and Education Center (TREC) 11-15-2016 Webinar: The Association Between Light Rail Transit, Streetcars and Bus Rapid Transit
Texas Housing Markets: Metropolitan vs. Border Communities. September 22, 2014
 Texas Housing Markets: Metropolitan vs. Border Communities Luis Bernardo Torres Ruiz, Ph.D. Research Economist El Paso Branch Dallas Federal Rio Grande Economic Association September 22, 2014 Contents
Leasing and Sales Book COLEMAN S CROSSING. Marysville, Ohio
 Leasing and Sales Book COLEMAN S CROSSING Marysville, Ohio Coleman s Crossing 339-555 Coleman s Crossing Blvd. Marysville, Ohio TABLE OF CONTENTS OVERVIEW 1 Property Profile Available Outlots Available
East London Neighbourhood Profile
 East London Neighbourhood Profile For further information contact: John-Paul Sousa Planning Research Analyst Direct: (519) 661-2500 ext. 5989 I email: jpsousa@london.ca Page 1 Page 2 Population Characteristics
Tulsa Metropolitan Area LONG RANGE TRANSPORTATION PLAN
 Tulsa Metropolitan Area LONG RANGE TRANSPORTATION PLAN Indian Nations Council of Governments August 2005 CONTACTING INCOG In developing the Destination 2030 Long Range Transportation Plan, INCOG s Transportation
An American Profile: The United States and Its People
 An American Profile: The United States and Its People 1 153641_EM_AmPro.indd 1 12/16/8 11:1:32 PM An American Profile: The United States and Its People 3 Table 1 Population, Percentage Change, and Racial
Small Business Dynamics and Job Creation. Small Business Numbers, Pretty Pictures and Not So Pretty Pictures
 Small Business Dynamics and Job Creation Or Small Business Numbers, Pretty Pictures and Not So Pretty Pictures Brian Headd Office of Advocacy U.S. Small Business Administration Employers 8,000,000 7,500,000
Americans in Transit A Profile of Public Transit Passengers
 Americans in Transit A Profile of Public Transit Passengers published by American Public Transit Association December 1992 Louis J. Gambacclnl, Chairman Rod Diridon, Vice Chairman Fred M. Gilliam, Secretary-Treasurer
METROPOLITAN PROFILE 2016 ANNUAL REPORT OF THE FARGO-MOORHEAD METROPOLITAN AREA
 METROPOLITAN PROFILE 2016 ANNUAL REPORT OF THE FARGO-MOORHEAD METROPOLITAN AREA community & demographics roadway system freight & interstate travel bicycle & pedestrian network transit network PREPARED
Chapter 14 PARLIER RELATIONSHIP TO CITY PLANS AND POLICIES. Recommendations to Improve Pedestrian Safety in the City of Parlier (2014)
") Chapter 14 PARLIER This chapter describes the current status and future plans for biking and walking in the City of Parlier. RELATIONSHIP TO CITY PLANS AND POLICIES The Parlier General Plan is the primary
Chapter 14 PARLIER This chapter describes the current status and future plans for biking and walking in the City of Parlier. RELATIONSHIP TO CITY PLANS AND POLICIES The Parlier General Plan is the primary
Hamilton Road Neighbourhood Profile
 Hamilton Road Neighbourhood Profile For further information contact: John-Paul Sousa Planning Research Analyst Direct: (519) 661-2500 ext. 5989 I email: jpsousa@london.ca Page 1 Page 2 Population Characteristics
Quebec City tops poll of city services second year in a row
 lbozinoff@ FOR IMMEDIATE RELEASE Quebec City tops poll of city services second year in a row Burnaby, Mississauga, Sherbrooke, Oakville round out top five Toronto, May 29th, 2012 In a sampling of opinion
ANNUAL REPORT OF THE FARGO MOORHEAD METROPOLITAN AREA FARGO MOORHEAD METROPOLITAN COUNCIL OF GOVERNMENTS PREPARED BY:
 ANNUAL REPORT OF THE FARGO MOORHEAD METROPOLITAN AREA community & demographics roadway system freight & interstate travel bicycle & pedestrian network transit network PREPARED BY: FARGO MOORHEAD METROPOLITAN
50 by 30 Live, Learn, Earn
 50 by 30 Live, Learn, Earn SCALE Meeting Workforce Readiness October 13, 2017 Workforce Readiness Update Key Data Points Next Steps Employer Panel Workforce Readiness Vision Elevate each person s contribution
Understanding YOUR GROWTH Demographics
 Understanding YOUR GROWTH Demographics Outline 1. Bowling Demographic Snapshot 2. Youth Bowlers 3. Adult Bowling Segments 4. Local-Center Demographics Bowling Demographic Snapshot Bowler Overview 2009
U.S. Bicycling Participation Study
 U.S. Bicycling Participation Study Report of findings from the 2016 survey Conducted by Corona Insights Commissioned by PeopleForBikes Released July 2017 Table of Contents Background and Objectives 3 Research
Central London Neighbourhood Profile
 Central London Neighbourhood Profile For further information contact: John-Paul Sousa Planning Research Analyst Direct: (519) 661-2500 ext. 5989 I email: jpsousa@london.ca Page 1 Page 2 Population Characteristics
U.S. Economy in a Snapshot
 U.S. Economy in a Snapshot Economic Press Briefing: May 19, 2016 The views expressed here are those of the presenter and do not necessarily represent the views of the Federal Reserve Bank of New York or
VERMONT FISH & WILDLIFE DEPARTMENT ACCESS AREA PROGRAM 2011 MAINTENANCE AND CONSTRUCTION REPORT
 VERMONT FISH & WILDLIFE DEPARTMENT ACCESS AREA PROGRAM 2011 Submitted to: Vermont Legislature House Fish, Wildlife, and Water Resource Committee Submitted by: Patrick Berry, Commissioner Vermont Fish and
Bike Share Social Equity and Inclusion Target Neighborhoods
 Bike Share Social Equity and Inclusion Target Neighborhoods Target Neighborhoods West End/Visitation Park/Academy/Hamilton Heights Wellsgoodfellow/Kingsway West The Ville/Greater Ville Kingsway East/Fountain
Nebraska Births Report: A look at births, fertility rates, and natural change
 University of Nebraska Omaha DigitalCommons@UNO Publications since 2000 Center for Public Affairs Research 7-2008 Nebraska Births Report: A look at births, fertility rates, and natural change David J.
Jackson Neighbourhood Profile
 Jackson Profile For further information contact: John-Paul Sousa Planning Research Analyst Direct: (519) 661-2500 ext. 5989 I email: jpsousa@london.ca Page 1 Page 2 Population Characteristics & Age Distribution
Southcrest Neighbourhood Profile
 Southcrest Neighbourhood Profile For further information contact: John-Paul Sousa Planning Research Analyst Direct: (519) 661-2500 ext. 5989 I email: jpsousa@london.ca Page 1 Page 2 Population Characteristics
Westminster Neighbourhood Profile
 Westminster Profile For further information contact: John-Paul Sousa Planning Research Analyst Direct: (519) 661-2500 ext. 5989 I email: jpsousa@london.ca Page 1 Page 2 Population Characteristics & Age
Rail Station Fact Sheet University of Dallas Station
 Rail Station Fact Sheet University of Dallas Station Station Overview University of Dallas Station is located on John Carpenter Freeway and west of Loop 12 across from the University of Dallas in Irving.
White-tailed Deer Age Report from the Deer Harvest
 White-tailed Deer Age Report from the 2016 Deer Harvest The Vermont Fish and Wildlife Department has made a concerted effort, beginning in 2015, to increase the amount of age data collected from harvested
Colorado Economic Update
 Colorado Economic Update Steamboat Economic Summit Place cover image here Brian Lewandowski Associate Director, Business Research Division October 21, 2016 Recession 8 Months Recession 18 Months Real GDP
Lewisham Pharmaceutical Needs Assessment Appendix B - Lewisham The Place
 Lewisham Pharmaceutical Needs Assessment 2018 Appendix B - Lewisham The Place Lewisham is the 13 th largest borough in London by population size and the 5 th largest in Southwark Inner London Source: MYE
FULL PROFILE Census, 2018 Estimates with 2023 Projections Calculated using Weighted Block Centroid from Block Groups Realm Realty Lat/Lon: 3
 FULL PROFILE 2000-2010 Census, 2018 Estimates with 2023 Projections Calculated using Weighted Block Centroid from Block Groups Realm Realty Lat/Lon: 30.0027/-90.1613 RF1 Lakeside Shopping Center Metairie,
Huron Heights Neighbourhood Profile
 Huron Heights Neighbourhood Profile For further information contact: John-Paul Sousa Planning Research Analyst Direct: (519) 661-2500 ext. 5989 I email: jpsousa@london.ca Page 1 Page 2 Population Characteristics
Guidelines for Providing Access to Public Transportation Stations APPENDIX C TRANSIT STATION ACCESS PLANNING TOOL INSTRUCTIONS
 APPENDIX C TRANSIT STATION ACCESS PLANNING TOOL INSTRUCTIONS Transit Station Access Planning Tool Instructions Page C-1 Revised Final Report September 2011 TRANSIT STATION ACCESS PLANNING TOOL INSTRUCTIONS
FOR LEASE HARMS ROAD INDUSTRIAL PARK Harms Road, Houston Texas 77041
 FOR LEASE HARMS ROAD INDUSTRIAL PARK 7206-7214 Harms Road, Houston Texas 77041 Property Statistics: Single-tenant Industrial Park Tilt wall construction with stone facade Crane ready Heavy power, grade
Pain at the Pump: The relationship between gas prices and transit ridership in urban and rural counties of Vermont
 University of Vermont ScholarWorks @ UVM Environmental Studies Electronic Thesis Collection Undergraduate Theses 2015 Pain at the Pump: The relationship between gas prices and transit ridership in urban
Stoney Creek Neighbourhood Profile
 Stoney Creek Profile For further information contact: John-Paul Sousa Planning Research Analyst Direct: (519) 661-2500 ext. 5989 I email: jpsousa@london.ca Page 1 Page 2 Population Characteristics & Age
OLDER PEDESTRIANS AT RISK
 OLDER PEDESTRIANS AT RISK A TEN-YEAR SURVEY AND A LOOK AHEAD August 0 The population of older adults is growing in the U.S. and in the tri-state region. According to AARP, one in three Americans is now
PHILADELPHIA HOUSE PRICE INDICES
 PHILADELPHIA HOUSE PRICE INDICES February 13, 2017 KEVIN C. GILLEN, Ph.D. Kevin.C.Gillen@Drexel.edu Disclaimers and Acknowledgments: The Lindy Institute for Urban Innovation at Drexel University provides
COOPERATIVE EXTENSION Bringing the University to You
 COOPERATIVE EXTENSION Bringing the University to You Special Publication - 06-16 ECONOMIC IMPACT OF TOURISM ON COLORADO RIVER COMMUNITIES INCLUDING: LAUGHLIN BULLHEAD CITY FORT MOHAVE MOHAVE VALLEY GOLDEN
Monthly Indicators - 5.2% % % Activity Overview New Listings Pending Sales. Closed Sales. Days on Market Until Sale. Median Sales Price
 Monthly Indicators 2018 Sales and new listings continue to perform well throughout the state of New York largely due to a booming U.S. economy that has increased listing and purchasing confidence. Housing
Wildlife Ad Awareness & Attitudes Survey 2015
 Wildlife Ad Awareness & Attitudes Survey 2015 Contents Executive Summary 3 Key Findings: 2015 Survey 8 Comparison between 2014 and 2015 Findings 27 Methodology Appendix 41 2 Executive Summary and Key Observations
2010 Nashville Area Regional Transportation Study
 2010 Nashville Area Regional Transportation Study FINAL Survey Report Conducted for The Nashville Area Metropolitan Planning Organization By ETC Institute 725 W. Frontier Circle Olathe, Kansas 66061 (913)
3105 Alderwood Mall Blvd, Lynnwood, WA FOR SALE PAUL SLEETH th Street SW. Alderwood Mall Parkway
 3105 Alderwood Mall Blvd, Lynnwood, WA 98036 196th Street SW Alderwood Mall Alderwood Mall Parkway FOR SALE PAUL SLEETH 206.518.9547 paul.sleeth@ngkf.com BILLY SLEETH 206.518.9567 billy.sleeth@ngkf.com
Hunter and Angler Expenditures, Characteristics, and Economic Effects, North Dakota,
 Agribusiness and Applied Economics Report No. 507-S January 2003 Hunter and Angler Expenditures, Characteristics, and Economic Effects, North Dakota, 2001-2002 Dean A. Bangsund and F. Larry Leistritz*
North Carolina Competitiveness
 ted@econleadership.com North Carolina Competitiveness NC 200,000 180,000 160,000 140,000 120,000 100,000 80,000 60,000 40,000 20,000 0 The Punch Job Change 1990 to 2012 182,905 The loss of about 8 of our
Missing Opportunities: Racial and Ethnic Disparities in the Twin Cities Metro in 2016
 New MetroStats Missing Opportunities: Racial and Ethnic Disparities in the Twin Cities Metro in 2016 10/2/2017 Community Development Committee What s New American Community Survey data released (9/14)
Pennsylvania Highway Statistics
 Pennsylvania Highway Statistics 2011 Highway Data PUB 600 (12-12) I-83 North Harrisburg 2011 HIGHWAY STATISTICS INTRODUCTION Pennsylvania Highway Statistics is annually updated to summarize a variety of
Competitiveness
 North Carolina ted@econleadership.com Competitiveness NC Everyone has a plan till they get hit in the mouth Mike Tyson The Punch Job Change 1990 to 2012 200,000 180,000 160,000 140,000 120,000 100,000
MIDCOAST MAINE TRANSIT STUDY. In Association with: MORRIS COMMUNICATIONS
 MIDCOAST MAINE TRANSIT STUDY In Association with: MORRIS COMMUNICATIONS Public Meetings June, 2013 Project Background Four coastal towns of Knox County have agreed on the importance of a transit study
2009 Master Plan & Reexamination Report Verona, New Jersey
 2009 Master Plan & Reexamination Report Verona, New Jersey MASTER PLAN TOWNSHIP OF VERONA, NEW JERSEY PREPARED FOR THE PLANNING BOARD OF THE TOWNSHIP OF VERONA, NJ PREPARED BY KASLER ASSOCIATES, PA 34
2018 VERMONT HARVEST REPORT WHITE-TAILED DEER. FISH & WILDLIFE DEPARTMENT (802) /
 /") 2018 VERMONT WHITE-TAILED DEER HARVEST REPORT FISH & WILDLIFE DEPARTMENT (802) 828-1000 / www.vtfishandwildlife.com 2018 VERMONT WHITE-TAILED DEER HARVEST REPORT Most of the programs described in this
2018 VERMONT WHITE-TAILED DEER HARVEST REPORT FISH & WILDLIFE DEPARTMENT (802) 828-1000 / www.vtfishandwildlife.com 2018 VERMONT WHITE-TAILED DEER HARVEST REPORT Most of the programs described in this
JERRY D. PARRISH, PH.D. Chief Economist Florida Chamber
 JERRY D. PARRISH, PH.D. Chief Economist Florida Chamber Foundation jparrish@flfoundation.org @DrJerryParrish 2007 2007 2014 US versus Florida Coincident Indicators 190 180 170 160 150 140 130 120 110 100
The Outlook for Real Estate and Residential Construction. Patrick M. Barkey, Director Bureau of Business and Economic Research University of Montana
 The Outlook for Real Estate and Residential Construction Patrick M. Barkey, Director Bureau of Business and Economic Research University of Montana Montana s Real Estate Performance: Getting Back to Boom
Nebraska s Population and Economic Trends
 Nebraska s Population and Economic Trends Jerry Deichert, David Drozd UNO Center for Public Affairs Research Twenty-first Annual Nebraska State Data Center Summer Conference August 17, 2010 CPACS Collaborating
PHILADELPHIA HOUSE PRICE INDICES
 PHILADELPHIA HOUSE PRICE INDICES July 20, 2017 KEVIN C. GILLEN, Ph.D. Kevin.C.Gillen@Drexel.edu Disclaimers and Acknowledgments: The Lindy Institute for Urban Innovation at Drexel University provides this
Joint Strategic Needs Assessment (JSNA) Picture of Lewisham 2018
 Picture of Lewisham 2018") Joint Strategic Needs Assessment (JSNA) Picture of Lewisham 2018 Lewisham s Population Lewisham is the 13 th largest borough in London by population size and the 5 th largest in Southwark Inner London
Joint Strategic Needs Assessment (JSNA) Picture of Lewisham 2018 Lewisham s Population Lewisham is the 13 th largest borough in London by population size and the 5 th largest in Southwark Inner London
Multifamily Market Survey
 Multifamily Market Survey Third Quarter 2018 Economics & Housing Policy Group FOR IMMEDIATE RELEASE Contact: Stephanie Pagan 202-266-8254 spagan@nahb.org www.nahb.org Multifamily Builder and Developer
2014 Economic Indicators, Trends & Observations. 51 South Main Street Janesville, WI P F RockCountyAlliance.
 2014 Economic Indicators, Trends & Observations 51 South Main Street Janesville, WI 53545 P.608.757.5598 F.608.757.5586 RockCountyAlliance.com Indicators, Trends & Observations National Level State of
INTERSECTIONS. Metro Denver 2016 Economic Forecast January 2016
 INTERSECTIONS Metro Denver 2016 Economic Forecast January 2016 Employment Intersections Employment growth and Great Recession recovery Industry clusters Average annual salary Photo Credit: istockphoto
WHERE ARE ARIZONA DEMOGRAPHICS TAKING US? HOW GROWING SLOWER, OLDER AND MORE DIVERSE AFFECTS REAL ESTATE
 WHERE ARE ARIZONA DEMOGRAPHICS TAKING US? HOW GROWING SLOWER, OLDER AND MORE DIVERSE AFFECTS REAL ESTATE March 2017 Tom Rex Office of the University Economist and Center for Competitiveness and Prosperity
State Health Assessment: Findings from the Ohio Medicaid Assessment Survey
 State Health Assessment: Findings from the Ohio Medicaid Assessment Survey County Commissioners Association of Ohio October 23, 2013 Presented by The Ohio Colleges of Medicine Government Resource Center
The Wisconsin and Minnesota Economies: What can we learn from each other? Noah Williams
 The Economies: What can we learn from each other? Noah University of Wisconsin - Madison Future Wisconsin Summit 2016 Economies Location, size, demographics, and history make Wisconsin and Minnesota natural
The Virginia Economy: Labor Markets and Workforce
 The Virginia Economy: Labor Markets and Workforce April 4, 2017 Sonya Ravindranath Waddell Regional Economist Research Department The views and opinions expressed herein are those of the author. They do
The Economic Status of Women in the U.S. What Has Changed in the Last Years
 The Economic Status of Women in the U.S. What Has Changed in the Last 20 40 Years March 28, 2018 Heidi Hartmann, Ph.D. President, IWPR Scholar in Residence, American University Editor, Journal of Women,
NFL1. Do you think television shows, in general, are getting better or getting worse?
 1350 Willow Rd, Suite 102 Menlo Park, CA 94025 www.knowledgenetworks.com Interview dates: January 21 January 26, 2011 Total Interviews: 1,125 adults NFL Fans: 482 adults Sampling margin of error for a
Lookout Valley/Lookout Mountain
 Neighborhoods Lookout Valley/Lookout Mountain State Hwy 27 Palisades W Us Hwy 27 State Hwy 8 5 1 2 Miles State Hwy 58 State Hwy 134 Us Hwy 41 I 24 Wauhatchie I 24 Us Hwy 11 State Hwy 318 State Hwy 148
The Case for New Trends in Travel
 The Case for New Trends in Travel The Future of Cities and Travel Steven E. Polzin, PhD. Center for urban Transportation Research University of South Florida October 19, 2008 Successful Strategies from
Alternative Measures of Economic Activity. Jan J. J. Groen, Officer Research and Statistics Group
 Alternative Measures of Economic Activity Jan J. J. Groen, Officer Research and Statistics Group High School Fed Challenge Student Orientation: February 1 and 2, 217 Outline Alternative indicators: data
2011 VERMONT HARVEST REPORT WHITE-TAILED DEER. Fish & Wildlife Department (802) /
 /") 2011 VERMONT WHITE-TAILED DEER HARVEST REPORT Fish & Wildlife Department (802) 241-3700 / www.vtfishandwildlife.com 2011 VERMONT WHITE-TAILED DEER HARVEST REPORT Most of the programs described in this
2011 VERMONT WHITE-TAILED DEER HARVEST REPORT Fish & Wildlife Department (802) 241-3700 / www.vtfishandwildlife.com 2011 VERMONT WHITE-TAILED DEER HARVEST REPORT Most of the programs described in this
Executive Summary. TUCSON TRANSIT ON BOARD ORIGIN AND DESTINATION SURVEY Conducted October City of Tucson Department of Transportation
 Executive Summary TUCSON TRANSIT ON BOARD ORIGIN AND DESTINATION SURVEY Conducted October 2004 Prepared for: City of Tucson Department of Transportation May 2005 TUCSON TRANSIT ON BOARD ORIGIN AND DESTINATION
REGIONAL HOUSEHOLD TRAVEL SURVEY:
 Defining the Vision. Shaping the Future. REGIONAL HOUSEHOLD TRAVEL SURVEY: Profile Why we travel How we travel Who we are and how often we travel When we travel Where we travel How far and how long we travel
2020 K Street NW, Suite 410 Washington, DC (202)
") 2020 K Street NW, Suite 410 Washington, DC 20006 (202) 463-7300 Interview dates: October 24 25, 2013 Interviews: 1,008 adults CONDUCTED BY IPSOS PUBLIC AFFAIRS These are findings of an Ipsos online poll
2020 K Street NW, Suite 410 Washington, DC 20006 (202) 463-7300 Interview dates: October 24 25, 2013 Interviews: 1,008 adults CONDUCTED BY IPSOS PUBLIC AFFAIRS These are findings of an Ipsos online poll
Kentucky s Surface Transportation System
 Kentucky s Surface Transportation System ROAD AND BRIDGE CONDITIONS, TRAFFIC SAFETY, TRAVEL TRENDS, AND NEEDS MARCH 2018 PREPARED BY WWW.TRIPNET.ORG Founded in 1971, TRIP of Washington, DC, is a nonprofit