September 2017: Aspen Snowmass Real Estate Market Snapshot RELEASED 10/08/17 ON OR NEAR THE 1ST MONDAY EACH MONTH
|
|
|
- Lester Francis Gordon
- 5 years ago
- Views:
Transcription

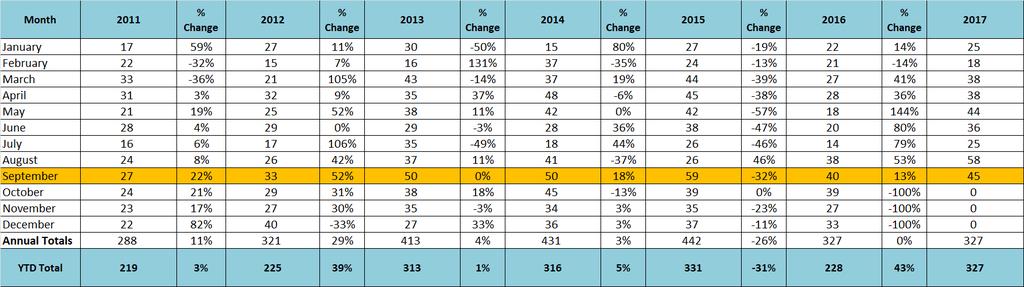
1 September 2017: Aspen Snowmass Real Estate Market Snapshot RELEASED 10/08/17 ON OR NEAR THE 1ST MONDAY EACH MONTH v2.1 The Estin Report publishes a monthly Aspen real estate market Snapshot on or near the 1st Monday of each month. The Monthly Snapshot details residential real estate sales in Aspen s upper Roaring Fork Valley with three sections: 1) Total combined Aspen Snowmass Village Market; 2) The Aspen Market; 3) The Snowmass Village Market. It features charts, tables and 30-day live links to photos and details of sold properties and compares the subject month to the same time in prior years. The Monthly Snapshot is the only Aspen and Snowmass property sales information widely published in a timely and consistent manner early each month. Bottom Line: We are on a remarkably similar path to 2015, the biggest year since the Great Recession. > Through Sep 2017 YTD, total Aspen and SMV combined dollar sales have exceeded Sep 2015 YTD by 4.3%, $1.165B vs $1.117B. > Unit sales are also similar: (327) in 2017 YTD vs (331) in 2015 YTD. ->And luxury sales of properties over $10M are tracking 2015: there have been (21) in 2017 YTD vs (23) in 2015 YTD. Listing Inventory for the combined marketplace is down (-18%) to 590 properties for sale in Sept vs. (671) in Sept For the Aspen market, it's down -14% to (353) properties from (403) in Sept 2015; for Snowmass Village, it's down -13% to (237) from (268) in Sept September 2017 Aspen & Snowmass Village Real Estate The Estin Report: Aspen Snowmass Real Estate Monthly Charts document sales activity for the subject month in the upper Roaring Fork Valley for Aspen (with Brush Creek) and Snowmass Village (SMV). Woody Creek and Old Snowmass are not included but they are represented on Pgs 7 and 9 Sales by Location. Property types included are single family homes, condos, townhomes, duplexes and residential vacant lots at sold prices over $250,000. Fractionals are not included.
 in September 17 from (138) in September 16 Aspen condo sales YTD Unit Sales: +41% (135) in September 17 from (96) in September 16 Dollar")
 in September 17 from (13) in September 16 Dollar Sales: +19% $82M in September 17 from $69M in September 16 Inventory Active Listings: -15% (170) in September 17 from (201) in September 16")
 in September 17 from (293) in September 16 * Typically, the Aspen market represents 70-75% of the total combined Aspen Snowmass Village real estate marketplace.")
2 September 2017 Market Statistics Summary for Aspen Only * Aspen condo sales September 2017 Unit Sales: +35% (23) in September 17 from (17) in September 16 Dollar Sales: +84% $67M in September 17 from $36M in September 16 Inventory Active Listings: -26% (187) in September 17 from (138) in September 16 Aspen condo sales YTD Unit Sales: +41% (135) in September 17 from (96) in September 16 Dollar Sales: +51% $310M in September 17 from $205M in September 16 Inventory Active Listings: -17% (323) in September 17 from (387) in September 16 Aspen Single family home sales September 2016 Unit Sales: -38% (8) in September 17 from (13) in September 16 Dollar Sales: +19% $82M in September 17 from $69M in September 16 Inventory Active Listings: -15% (170) in September 17 from (201) in September 16 Aspen Single family home sales YTD Unit Sales: +137% (83) in September 17 from (35) in September 16 Dollar Sales: +184% $630M in September 17 from $222M in September 16 Inventory Active Listings: +1% (298) in September 17 from (293) in September 16 * Typically, the Aspen market represents 70-75% of the total combined Aspen Snowmass Village real estate marketplace. 1, , Unit Sales Listing Inventory September 2017 Aspen Snowmass Market Inventory and Sales Listing Inventory UC/Pending 0 Oct-11 Oct-12 Oct-13 Oct-14 Oct-14 UC NOTE: UC The number of units that went Under Contract in September This does not necessarily mean that they will close in May, or at all. They may fall out of contract. UC s are used as an indicator of future activity when compared to the prior year. In general, a rising number of under contracts combined with falling inventory of properties for sale indicates price pressure upwards, and vice versa, but this information needs to be evaluated by specific neighborhood for concrete conclusions.
 category now includes Townhomes (TH) and Duplexes per Aspen Glenwood MLS definition. Single Family Homes are SFH. A blank cell above represents no sales during time period.")

3 September 2017 Aspen and Snowmass Median Prices Note: Aspen includes Aspen and Brush Creek Village. Not included are Snowmass Village, Old Snowmass and Woody Creek. * Condos (CO) category now includes Townhomes (TH) and Duplexes per Aspen Glenwood MLS definition. Single Family Homes are SFH. A blank cell above represents no sales during time period. Median prices are less likely than average prices to be disproportionately skewed by extreme high or low priced sales, and they are generally considered a more accurate measure of price direction. September 2017 Avg $ / Sq Ft for Aspen and Snowmass Village Note: Aspen includes Aspen and Brush Creek Village. Not included are Snowmass Village, Old Snowmass and Woody Creek. *Condos (CO) category now includes Townhomes (TH) and Duplexes per Aspen Glenwood MLS definition. Single Family Homes are SFH. A blank cell above represents no sales during the time period.


4 Estin Report: Total Aspen Snowmass Combined Market Sept 2017 & Historical Sales Estin Report: Total Aspen Snowmass Market September 2017 Dollar Sales Estin Report: Total Aspen Snowmass Market September 2017 Unit Sales

5 September 2017 Aspen & Snowmass Village Total Sales Comparisons Bars represent $ volume by property type (left axis) and shaded areas represent unit sales/listing inventory (right axis) Vacant Land is excluded from graph for scale reasons. The Estin Report: The chart and table above and on Pg 6 and 7 document sales activity for Aspen, including Brush Creek, and Snowmass Village (SMV) combined in the subject month. SMV sales are covered similarly on Pgs 8 and 9. Woody Creek (WC) and Old Snowmass (OSM) sales are identified on Pg 7 by location/neighborhood. Included property types are single family homes, condos, townhomes, duplexes and residential vacant land at sold at prices over $250,000. Fractionals are not included. Starting with the September 2016 Snapshot, Aspen* no longer includes WC and OSM. Information is from sources deemed reliable but cannot be guaranteed. The Estin Report is copyrighted 2016 and all rights reserved. Use is permitted subject to the following attribution with an active link to the source: "The Estin Report on Aspen real estate." For sales assistance and inquiries, please call Aspen Sothebys broker Tim Estin at or tim@estinaspen.com

6 September 2017 Aspen Sales Comparisons Bars represent $ volume by property type (left axis) and shaded areas represent unit sales/listing inventory (right axis) *Includes Aspen and Brush Creek Village not Snowmass Village, Woody Creek, and Old Snowmass. Vacant land excluded for scale reasons. The Estin Report: The chart and table above and on Pg 6 and 7 document sales activity for Aspen, including Brush Creek, in the subject month. Snowmass Village (SMV) sales are covered similarly on Pgs 8 and 9. Woody Creek (WC) and Old Snowmass (OSM) sales are identified on Pg 7, sales by location/neighborhood. Included property types are single family homes, condos, townhomes, duplexes and residential vacant land at sold at prices over $250,000. Fractionals are not included. Starting with the September 2016 Snapshot, Aspen* no longer includes WC and OSM. Information is from sources deemed reliable but cannot be guaranteed. The Estin Report is copyrighted 2016 and all rights reserved. Use is permitted subject to the following attribution with an active link to the source: "The Estin Report on Aspen real estate." For sales assistance and inquiries, please call Aspen Sothebys broker Tim Estin at or tim@estinaspen.com


7 Estin Report: September 2017 Aspen Condos - 3-Mos. Averages Estin Report: What Aspen* Areas Are Selling? 3-Mos. Avg. Sales by Location *Specific Aspen areas only, does not include Snowmass Village and Old Snowmass and not all Aspen neighborhoods are represented. NOTE: All blank spaces represent a zero value or invalid percentage.

8 September 2017 Snowmass Village Sales Comparisons Bars represent $ volume by property type (left axis) and shaded areas represent unit sales/listing inventory (right axis) *Snowmass Village only. Vacant Land is excluded from graph for scale reasons. NOTE: All blank spaces represent a zero value or invalid percentage. The Estin Report: The chart and table above and on Pg 6 and 7 document sales activity for Aspen, including Brush Creek, in the subject month. Snowmass Village (SMV) sales are covered similarly on Pgs 8 and 9. Woody Creek (WC) and Old Snowmass (OSM) sales are identified on Pg 7, sales by location/neighborhood. Included property types are single family homes, condos, townhomes, duplexes and residential vacant land at sold at prices over $250,000. Fractionals are not included. Starting with the September 2016 Snapshot, Aspen* no longer includes WC and OSM. Information is from sources deemed reliable but cannot be guaranteed. The Estin Report is copyrighted 2016 and all rights reserved. Use is permitted subject to the following attribution with an active link to the source: "The Estin Report on Aspen real estate." For sales assistance and inquiries, please call Aspen Sothebys broker Tim Estin at or tim@estinaspen.com


9 Estin Report: September 2017 Snowmass Village Condos 3-Mos. Averages Estin Report: What Snowmass Village* Areas Are Selling? Monthly and 3-Mos. Averages *Specific Snowmass Village areas only, does not include Aspen, Woody Creek, Brush Creek Village, and Old Snowmass and not all SMV neighborhoods are represented. NOTE: All blank spaces represent a zero value or invalid percentage.

10 September 2017: Aspen Snowmass Real Estate Market Snap-
August 2016: Aspen Snowmass Real Estate Market Snapshot RELEASED 9/9/2016 ON OR NEAR THE 1ST MONDAY EACH MONTH
 August 2016: Aspen Snowmass Real Estate Market Snapshot RELEASED 9/9/2016 ON OR NEAR THE 1ST MONDAY EACH MONTH v5.0 The Estin Report publishes a monthly Aspen real estate market Snapshot on or near the
Estin Report: Summer 2015 Market Snapshot Aspen Snowmass Real Estate
 Estin Report: Summer 2015 Market Snapshot Aspen Snowmass Real Estate 09/03/2015 v2 The Estin Report began publishing monthly Aspen real estate market snapshots in 2012 on or near the 1st Monday of each
REAL ESTATE MARKET REPORT
 Second Quarter ASPEN SNOWMASS REAL ESTATE MARKET REPORT presented by KLUG PROPERTIES CHRIS KLUG 97.948.755 CHRIS KLUG 97.948.755 Klug Properties SECOND QUARTER MARKET REPORT Happy summertime! I hope you
REAL ESTATE MARKET REPORT
 Third Quarter 2017 ASPEN SNOWMASS REAL ESTATE MARKET REPORT presented by KLUG PROPERTIES CHRIS KLUG 970.948.7055 Klug Properties THIRD QUARTER 2017 MARKET REPORT Happy fall season from Aspen! I hope you
Preston s Edmond Market Report
 Preston s Edmond arket Report July 2 Prepared By Brian Preston RE/AX Associates obile: 45-826-5725 Office: 45-359-87 bpreston88@sbcglobal.net www.edmond4sale.com Realtor of the Year 1995 & 22 Lifetime
Monthly Indicators + 3.2% + 8.6% + 7.7%
 Monthly Indicators 2018 Residential real estate activity comprised of single-family properties, townhomes and condominiums combined. Percent changes are calculated using rounded figures. Activity Snapshot
Greater Las Vegas Snapshot by Sale Type Last Month's Sold
 Available Units Pending Units Las Vegas Market Update - February 2018 Greater Las Vegas Snapshot by Sale Type Last Month's Sold Units Median List Price Average List Price Median Sold Price Average Sold
Greater Las Vegas Snapshot by Sale Type Last Month's Sold
 Available Units Pending Units Las Vegas Market Update - April 2018 Greater Las Vegas Snapshot by Sale Type Last Month's Sold Units Median List Price Average List Price Median Sold Price Average Sold Price
Greater Las Vegas Snapshot by Sale Type Last Month's Sold
 Available Units Pending Units Las Vegas Market Update - June 2018 Greater Las Vegas Snapshot by Sale Type Last Month's Sold Units Median List Price Average List Price Median Sold Price Average Sold Price
Greater Las Vegas Snapshot by Sale Type Last Month's Sold
 Available Units Pending Units Las Vegas Market Update - July 2018 Greater Las Vegas Snapshot by Sale Type Last Month's Sold Units Median List Price Average List Price Median Sold Price Average Sold Price
Greater Las Vegas Snapshot by Sale Type Last Month's Sold
 Available Units Pending Units Las Vegas Market Update - December 2018 Greater Las Vegas Snapshot by Sale Type Last Month's Sold Units Median List Price Average List Price Median Sold Price Average Sold
Monthly Indicators - 9.1% + 4.5% + 8.0% Activity Overview New Listings. Closed Sales Median Sales Price
 Monthly Indicators 2018 Home prices were consistently up again in most markets in 2018 but at reduced levels compared to recent years. High demand for few homes for sale fueled price increases, but evidence
Alabama Residential Report August 2018
 Alabama Residential Report August 2018 Monthly Indicators Recent Figures Trends Total Residential Sales Current Month August 2018 5,862 Alabama home sales for August 2018 vs. Prior Month July 2018 5,722
May 2018 MLS Statistical Report
 Jan Feb Mar Apr May Jun Jul Aug Sep Oct Nov Dec January February March April May June July August Septem October Novem Decemb Days on Market The graph on the right illustrates the drastic decline in the
Alabama Residential Report December 2016
 Alabama Residential Report December 2016 Monthly Indicators Recent Figures Trends : Total Residential Sales Total Residential Sales Current Month December 2016 4,035 6,000 Alabama home sales for December
THE SLIFER REPORT VAIL VALLEY REAL ESTATE 2018 ANNUAL MARKET REVIEW 2018 VAIL VALLEY, COLORADO
 THE SLIFER REPORT VAIL VALLEY REAL ESTATE 2018 ANNUAL MARKET REVIEW 2018 VAIL VALLEY, COLORADO TABLE OF CONTENTS Overall Market Share & Recap Vail Valley Overview Luxury Market Overview 3 4 5 Vail Village
Monthly Indicators % + 8.2% % Market Overview New Listings Pending Sales. Closed Sales. Days on Market Until Sale. Median Sales Price
 Monthly Indicators 2018 Some economy observers are pointing to 2018 as the final period in a long string of sentences touting several happy years of buyer demand and sales excitement for the housing industry.
Monthly Indicators - 5.2% % % Activity Overview New Listings Pending Sales. Closed Sales. Days on Market Until Sale. Median Sales Price
 Monthly Indicators 2018 Sales and new listings continue to perform well throughout the state of New York largely due to a booming U.S. economy that has increased listing and purchasing confidence. Housing
2009 California & Bay Area Real Estate Market Outlook
 2009 California & Bay Area Real Estate Market Outlook November 24, 2008 Fairmont Hotel Leslie Appleton-Young C.A.R. Vice President and Chief Economist California Real Estate Market: 2008 California s Housing
Monthly Indicators - 6.4% + 8.0% - 5.3% Market Overview New Listings Pending Sales. Closed Sales. Days on Market Until Sale. Median Sales Price
 Monthly Indicators 2018 The booming U.S. economy continues to prop up home sales and new listings in much of the nation, although housing affordability remains a concern. Historically, housing is still
Monthly Indicators 0.0% + 7.9% %
 Monthly Indicators 2018 Residential real estate activity comprised of single-family properties, townhomes and condominiums combined. Percent changes are calculated using rounded figures. Activity Snapshot
News Release : Fewer commercial property sales in first quarter 2013
 News Release : Fewer commercial property sales in first quarter 2013 Vancouver, B.C. June 6, 2013 The first quarter of 2013 saw a reduction in the total dollar value and quantity of commercial real estate
Asheville Region Monthly Indicators
 Asheville Region Monthly Indicators A RESEARCH TOOL PROVIDED BY CHARLOTTE REGIONAL REALTOR ASSOCIATION FOR MORE INFORMATION CONTACT A REALTOR 2018 If the last few months are an indication of the temperature
Commercial real estate sales down, prices up in the Lower Mainland
 News Release Commercial real estate sales down, prices up in the Lower Mainland Vancouver, B.C. September 13, 2018 The commercial real estate market in the Lower Mainland continued to see fewer transactions
Commercial real estate sales down from robust 2017 activity
 News Release Commercial real estate sales down from robust 2017 activity Vancouver, B.C. June 21, 2018 Commercial real estate sales in the Lower Mainland declined in the first quarter (Q1) of 2018 compared
Commercial real estate sales decline and price activity varies across the Lower Mainland
 News Release Commercial real estate sales decline and price activity varies across the Lower Mainland VANCOUVER, BC December 7, 2018 Commercial real estate sales in the Lower Mainland declined in the third
Charlotte Region Monthly Indicators
 Charlotte Region Monthly Indicators A RESEARCH TOOL PROVIDED BY CHARLOTTE REGIONAL REALTOR ASSOCIATION FOR MORE INFORMATION CONTACT A REALTOR 2018 If the last few months are an indication of the temperature
September 2017 MLS Statistical Report. Residential Inventory
 September 217 MLS Statistical Report Residential Inventory 2 2 1 1 21 216 217 Summary Inventories: Residential inventory is down 1%, Lots / Land inventory is down 13% and commercial inventory was down
Phone: Fax: Commissioners Road, W. London, Ontario N6J 1Y3 STATISTICAL REPORT. (for month ending June 30, 2017)
") Phone: 519-641-1400 Fax: 519-641-1419 342 Commissioners Road, W. London, Ontario N6J 1Y3 STATISTICAL REPORT (for month ending June 30, 2017) Table of Contents News Release for June 2017 3 Market Report
Phone: 519-641-1400 Fax: 519-641-1419 342 Commissioners Road, W. London, Ontario N6J 1Y3 STATISTICAL REPORT (for month ending June 30, 2017) Table of Contents News Release for June 2017 3 Market Report
Commercial real estate sales in 2017 were 11.1 per cent above the region s five-year sales average.
 News Release Commercial real estate sales down, values up in 2017 VANCOUVER, BC March 12, 2018 Commercial real estate sales activity in the Lower Mainland declined from the record highs of one year ago
Housing Market Update Greater Moncton. Housing market intelligence you can count on
 Housing Market Update Greater Moncton Housing market intelligence you can count on Housing Market Drivers Multi-Residential/Rental Market New Home Market Single Family Homes Resale Market 2013/2014 Outlook
Phone: Fax: Commissioners Road, W. London, Ontario N6J 1Y3 STATISTICAL REPORT. (for month ending April 30, 2017)
") Phone: 519-641-1400 Fax: 519-641-1419 342 Commissioners Road, W. London, Ontario N6J 1Y3 STATISTICAL REPORT (for month ending April 30, 2017) Table of Contents News Release for April 2017 3 Market Report
Phone: 519-641-1400 Fax: 519-641-1419 342 Commissioners Road, W. London, Ontario N6J 1Y3 STATISTICAL REPORT (for month ending April 30, 2017) Table of Contents News Release for April 2017 3 Market Report
Charlotte Region Monthly Indicators
 Charlotte Region Monthly Indicators A RESEARCH TOOL PROVIDED BY CHARLOTTE REGIONAL REALTOR ASSOCIATION FOR MORE INFORMATION CONTACT A REALTOR 2018 Some economy observers are pointing to 2018 as the final
Residential Market Report
 MARKET Q1/08 REPORT Residential Rhode Island s Quarterly STATEWIDE The Rhode Island housing market in the first quarter of 2008 showed declines in both the median price of single family homes as well as
Aspen Snowmass Transient Lodging Inventory Study as of July 1, 2012
 INTRODUCTION A benchmark transient lodging inventory study was conducted by MTRiP on behalf of Aspen Skiing Company during the summer of 2008 for inventory in the City of Aspen and the Town of Snowmass
Charlotte Region Monthly Indicators
 Charlotte Region Monthly Indicators A RESEARCH TOOL PROVIDED BY CHARLOTTE REGIONAL REALTOR ASSOCIATION FOR MORE INFORMATION CONTACT A REALTOR 2018 The booming U.S. economy continues to prop up home sales
Monthly Indicators - 5.7% - 6.3% - 2.6% Activity Overview New Listings Pending Sales. Closed Sales. Days on Market Until Sale. Median Sales Price
 Monthly Indicators 2019 Despite a strong U.S. economy, historically low unemployment and steady wage growth, home sales began to slow across the nation late last year. Blame was given to a combination
Quick Facts. For Week Ending December 8, 2018 Data current as of December 17, % % - 5.0% Metrics by Week
 Charlotte Region Weekly Market Report A RESEARCH TOOL PROVIDED BY THE CHARLOTTE REGIONAL REALTOR ASSOCIATION FOR MORE INFORMATION CONTACT A REALTOR For Week Ending December 8, 2018 Data current as of December
Charlotte Region Monthly Indicators
 Charlotte Region Monthly Indicators A RESEARCH TOOL PROVIDED BY CHARLOTTE REGIONAL REALTOR ASSOCIATION FOR MORE INFORMATION CONTACT A REALTOR 2018 Home prices were consistently up again in most markets
Compiled from Santa Barbara Multiple Listing Service Data on 10/7/2014. Statistics Through September 14
 Compiled from Santa Barbara Multiple Listing Service Data on 10/7/2014 Statistics Through September 14 MLS vs CORT for August 14 2 Multi-Family 1 Cancelled in MLS 2 Closed in January 1 Closed in May 2
Compression Study: City, State. City Convention & Visitors Bureau. Prepared for
 : City, State Prepared for City Convention & Visitors Bureau Table of Contents City Convention & Visitors Bureau... 1 Executive Summary... 3 Introduction... 4 Approach and Methodology... 4 General Characteristics
Monthly Indicators + 1.7% + 7.1% % Market Overview New Listings Pending Sales. Closed Sales. Days on Market Until Sale. Median Sales Price
 Monthly Indicators 2018 Home prices were consistently up again in most markets in 2018 but at reduced levels compared to recent years. High demand for few homes for sale fueled price increases, but evidence
Phone: Fax: Commissioners Road, W. London, Ontario N6J 1Y3 STATISTICAL REPORT. (for month ending June 30, 2016)
") Phone: 519-641-1400 Fax: 519-641-1419 342 Commissioners Road, W. London, Ontario N6J 1Y3 STATISTICAL REPORT (for month ending June 30, 2016) Table of Contents News Release for June 2016 3 Market Report
Phone: 519-641-1400 Fax: 519-641-1419 342 Commissioners Road, W. London, Ontario N6J 1Y3 STATISTICAL REPORT (for month ending June 30, 2016) Table of Contents News Release for June 2016 3 Market Report
Quick Facts. For Week Ending February 16, 2019 Data current as of February 25, % % - 0.3% Metrics by Week
 Charlotte Region Weekly Market Report A RESEARCH TOOL PROVIDED BY THE CHARLOTTE REGIONAL REALTOR ASSOCIATION FOR MORE INFORMATION CONTACT A REALTOR For Week Ending February 16, 2019 Data current as of
2019 Market Outlook. Jeff Tumbarello Director SWFL REIA Broker/Owner Steelbridge Realty LLC
 2019 Market Outlook Jeff Tumbarello Director SWFL REIA Broker/Owner Steelbridge Realty LLC Data from MLS (exported 1/14/2019 9:26 AM) and public records. Trended with Microsoft excel. Unless otherwise
Big Changes, Unknown Impacts
 Big Changes, Unknown Impacts Boulder Economic Forecast Place cover image here Richard Wobbekind Senior Economist and Associate Dean for Business and Government Relations January 17, 2018 Real GDP Growth
Regional Real Estate Trends
 Regional Real Estate Trends Terry L. Clower, Ph.D. Director, Center for Regional Analysis Schar School of Policy and Government George Mason University April 6, 2018 140.0 120.0 100.0 80.0 60.0 40.0 20.0
Monday Morning Quarterback Summary
 Summary Jun, 8 Single-family existing homes Sales of single-family homes increased to 7 during the week of Jun, from the week prior The median price of single family homes decreased to $6,, a change of
State of the City of Carpinteria
 April 21, 2017 Mark Schniepp Director State of the City of Carpinteria jobs 1,000 Employment in Information / Carpinteria Valley 2006 -- 2016 800 600 400 200 0 2006 2008 2010 2012 2014 2016 ConstructiveDIVE.com
COMPARISON OF FIXED & VARIABLE RATES (25 YEARS) CHARTERED BANK ADMINISTERED INTEREST RATES - PRIME BUSINESS*
 CHARTERED BANK ADMINISTERED INTEREST RATES - PRIME BUSINESS*") COMPARISON OF FIXED & VARIABLE RATES (25 YEARS) Fixed Rates Variable Rates FIXED RATES OF THE PAST 25 YEARS AVERAGE RESIDENTIAL MORTGAGE LENDING RATE - 5 YEAR* (Per cent) Year Jan Feb Mar Apr May Jun Jul
COMPARISON OF FIXED & VARIABLE RATES (25 YEARS) Fixed Rates Variable Rates FIXED RATES OF THE PAST 25 YEARS AVERAGE RESIDENTIAL MORTGAGE LENDING RATE - 5 YEAR* (Per cent) Year Jan Feb Mar Apr May Jun Jul
Monthly Indicators. Quick Facts - 4.5% January % + 7.9%
 Monthly Indicators 2019 Despite a strong U.S. economy, historically low unemployment and steady wage growth, home sales began to slow across the nation late last year. Blame was given to a combination
Monthly Indicators. Quick Facts 0.0% January % + 3.2%
 Monthly Indicators 2019 Despite a strong U.S. economy, historically low unemployment and steady wage growth, home sales began to slow across the nation late last year. Blame was given to a combination
Charlotte Region Monthly Indicators
 Charlotte Region Monthly Indicators A RESEARCH TOOL PROVIDED BY CHARLOTTE REGIONAL REALTOR ASSOCIATION FOR MORE INFORMATION CONTACT A REALTOR 2019 Despite a strong U.S. economy, historically low unemployment
2019 Annual Recalculation and Reappraisal Setup Studies for All Residential Properties in Columbia County for Property Tax Assessment
 2019 Annual Recalculation and Reappraisal Setup Studies for All Residential Properties in Columbia County for Property Tax Assessment Published by the Columbia County Assessor January 2, 2019 Table of
Charting a Path to Lift Off? Understanding the Shifting Economic Winds
 Charting a Path to Lift Off? Understanding the Shifting Economic Winds Thomas F. Siems, Ph.D. Assistant Vice President and Senior Economist Federal Reserve Bank of Dallas Government Finance Officers Arlington,
Unit 6 Day 2 Notes Central Tendency from a Histogram; Box Plots
 AFM Unit 6 Day 2 Notes Central Tendency from a Histogram; Box Plots Name Date To find the mean, median and mode from a histogram, you first need to know how many data points were used. Use the frequency
Percent of Brokerages by Size
 Percent of Brokerages by Size 80% 70% 60% 58.4% 50% 40% 30% 28.7% 20% 10% 0% #: +23.6% -7.3% +9.9% 0.1% 0.1% 0.2% 0.5% 0.6% 1.8% 2.6% 1,000+ 500-999 300-499 100-299 50-99 20-49 10-19 5-9 2-4 Single Brokers
Student Population Projections By Residence. School Year 2016/2017 Report Projections 2017/ /27. Prepared by:
 Student Population Projections By Residence School Year 2016/2017 Report Projections 2017/18 2026/27 Prepared by: Revised October 31, 2016 Los Gatos Union School District TABLE OF CONTENTS Introduction
95 Express Annual Operations Report: Fiscal Year
 95 Express Annual Operations Report: Fiscal Year 2014-2015 General The 95 Express Program completed its sixth full Fiscal Year of operations in June 2015. For the FDOT, its Fiscal Year (FY) is from July
Frederick Ross. Real Estate Market Overview. Presented by: Kevin Thomas Senior Vice President. Frederick Ross. Company.
 Frederick Ross Real Estate Market Overview Presented by: Kevin Thomas Senior Vice President Frederick Ross Company January 2003 Business Consumers Source: BEA, Ross Research Housing...Bust or Rust? 2001
Stay Aspen Snowmass Transient Inventory Study May 2015
 INTRODUCTION An analysis of the number and type of rental units and pillows available for short-term rental in Aspen and Snowmass, Colorado as of May 31, 2015 was conducted on behalf of Stay Aspen Snowmass.by
The Schindler Report: 2010
 The Schindler Report: 2010 Janet Feinberg Schindler San Francisco Brokerage Dear Homeowners, Happy New Year and thank you for your business in 2010! Thanks to you, Haute Living named me one of the eight
Monthly Indicators - 8.0% + 5.8% + 1.1% Activity Overview New Listings Pending Sales. Closed Sales. Days on Market. Median Sales Price
 Monthly Indicators 2019 Despite a strong U.S. economy, historically low unemployment and steady wage growth, home sales began to slow across the nation late last year. Blame was given to a combination
Statistical Process Control Basics. LeanSix LLC
 Statistical Process Control Basics Statistical Process Control (SPC) is an industry standard methodology for measuring and controlling quality during the manufacturing process. Attribute data (measurements)
Quick Facts. For Week Ending March 9, 2019 Data current as of March 18, % % - 1.5% Metrics by Week
 Charlotte Region Weekly Market Report A RESEARCH TOOL PROVIDED BY THE CHARLOTTE REGIONAL REALTOR ASSOCIATION FOR MORE INFORMATION CONTACT A REALTOR For Week Ending March 9, 2019 Data current as of March
Texas Economic Outlook: Recovery in 2010 Keith Phillips Federal Reserve Bank of Dallas San Antonio Office
 Texas Economic Outlook: Recovery in 2010 Keith Phillips Federal Reserve Bank of Dallas San Antonio Office The views expressed in this presentation are strictly those of the author and do not necessarily
INSIDE EDGE WINTER 2015 SLIFER SMITH & FRAMPTON REAL ESTATE. News from the most trusted name in Colorado mountain real estate since 1962
 SLIFER SMITH & FRAMPTON REAL ESTATE INSIDE EDGE SUMMITCOUNTYREALESTATE.COM WINTER 2015 IN THIS ISSUE >> Real Estate Market Update 2 Market Watch 3-4 Winter Life in Summit County 5 Summit County 6 Development
State of the Philadelphia Housing Market
 State of the Philadelphia Housing Market September 17, 2014 KEVIN C. GILLEN, Ph.D. gillenk@upenn.edu Disclaimers and Acknowledgments: The Fels Institute of Government at the University of Pennsylvania
PHILADELPHIA HOUSE PRICE INDICES
 PHILADELPHIA HOUSE PRICE INDICES February 13, 2017 KEVIN C. GILLEN, Ph.D. Kevin.C.Gillen@Drexel.edu Disclaimers and Acknowledgments: The Lindy Institute for Urban Innovation at Drexel University provides
Vail Town Council Vail Economic Advisory Council
 Vail Town Council Vail Economic Advisory Council Quarterly Market/Research Report: - Orientation/History - Econometrics - Summer Review, Winter Outlook -Transient Inventory Study Synopsys Data as of Oct.
RED DEER HOUSING MARKET OUTLOOK
 RED DEER - JUNE 3, 2009 RED DEER HOUSING MARKET OUTLOOK Regine durand Market Analyst - CMHC Prairie and Territories 50,000 48,000 46,000 44,000 42,000 40,000 38,000 36,000 34,000 32,000 30,000 28,000 Red
Personnel Benchmarking Author: Ed Rehkopf
 Author: Ed Rehkopf 2009 Club Resources International Table of Contents Background.................................. 1 Purpose.................................... 1 Sources of Information............................
Manufacturers continue capacity expansion as technology orders grow
 Contact: Penny Brown, AMT, 703-827-5275 pbrown@amtonline.org For Release: September 10, 2018 Manufacturers continue capacity expansion as technology orders grow Manufacturing technology orders for July
2007 Real Estate Market Forecast. October 18, 2006 Leslie Appleton-Young C.A.R. Vice President and Chief Economist
 2007 Real Estate Market Forecast October 18, 2006 Leslie Appleton-Young C.A.R. Vice President and Chief Economist Overview California Real Estate Market What happened in 2006? Tipping Points/Market Psychology
DEC DASHBOARD. Positive Response Compliance DEC. Compliant Tickets : On-Time Performance Analysis. December % Late.
 Positive Response Compliance 215 Compliant 215 Non-Compliant 216 Compliant 216 Non-Compliant 1% 87% 96% 86% 96% 88% 97% 89% 97% 89% 98% 88% 97% 86% 96% 92% 97% 93% 97% 94% 97% 96% 97% 94% 97% 8% 6% 4%
President and Chief Executive Officer Federal Reserve Bank of New York Washington and Lee University H. Parker Willis Lecture in Political Economics
 The U.S. Economic Outlook Chartspresented by WilliamC Dudley Charts presented by William C. Dudley President and Chief Executive Officer Federal Reserve Bank of New York Washington and Lee University H.
JAN DASHBOARD. Positive Response Compliance JAN. Compliant Tickets : On-Time Performance Analysis. January % Late.
 Positive Response Compliance 216 Compliant 216 Non-Compliant 217 Compliant 217 Non-Compliant 1% 96% 97% 8% 6% 4% 2% 4% 3% FEB MAR APR MAY JUN JUL AUG SEP OCT NOV DEC 8% Late Compliant Tickets : On-Time
Stats 2002: Probabilities for Wins and Losses of Online Gambling
 Abstract: Jennifer Mateja Andrea Scisinger Lindsay Lacher Stats 2002: Probabilities for Wins and Losses of Online Gambling The objective of this experiment is to determine whether online gambling is a
Annual Report on the Charlotte Region Housing Market RESIDENTIAL REAL ESTATE ACTIVITY FROM THE CHARLOTTE REGIONAL REALTOR ASSOCIATION
 Annual Report on the Charlotte Region Housing Market RESIDENTIAL REAL ESTATE ACTIVITY FROM THE CHARLOTTE REGIONAL REALTOR ASSOCIATION Annual Report on the Charlotte Region Housing Market RESIDENTIAL REAL
Total Production by Month (Acre Feet)
") Production by Month (acre-feet) 2008 2009 2010 2011 2012 2013 2014 2015 2016 2017 2018 January 25 339.10 228.90 249.50 297.99 243.06 327.14 247.66 212.37 206.84 239.68 ruary 234.00 218.80 212.10 241.52
Production by Month (acre-feet) 2008 2009 2010 2011 2012 2013 2014 2015 2016 2017 2018 January 25 339.10 228.90 249.50 297.99 243.06 327.14 247.66 212.37 206.84 239.68 ruary 234.00 218.80 212.10 241.52
Idaho Department of Lands Payette Lake Multiple Property Auction Friday, June 23rd, 2017, 1:00 pm MST
 Idaho Department of Lands Payette Lake Multiple Property Auction Friday, June 23rd, 2017, 1:00 pm MST ORDER OF AUCTION This information, while not guaranteed, is from sources we believe to be reliable.
Reading Time: 15 minutes Writing Time: 1 hour 30 minutes. Structure of Book. Number of questions to be answered. Number of modules to be answered
 Reading Time: 15 minutes Writing Time: 1 hour 30 minutes Letter Student Number: Structure of Book Section A - Core Section B - Modules Number of questions Number of questions to be answered Number of marks
VANCOUVER POLICE DEPARTMENT
 VANCOUVER POLICE DEPARTMENT REPORT TO THE VANCOUVER POLICE BOARD REPORT DATE: October 2, 2018 BOARD MEETING DATE: October 24, 2018 BOARD REPORT # 1810P01 Regular TO: FROM: SUBJECT: Vancouver Police Board
Golf Course Metrics WHEREAS:
 Golf Metrics Update Golf Course Metrics WHEREAS: 1. The Board holds three public golf courses and three pitch and putt courses in its jurisdiction; 2. These courses provide citizens with (181 - golf only)
STEAMBOAT SOTHEBY S INTERNATIONAL REALTY RESORT REPORT. Mid-Year 2015
 STEAMBOAT SOTHEBY S INTERNATIONAL REALTY RESORT REPORT Mid-Year 2015 RESORT MARKET AT A GLANCE STEAMBOAT SPRINGS, COLORADO Resort communities throughout Colorado, the western United States and around the
The Houston Economy Jesse Thompson Regional Business Economist The Federal Reserve Bank of Dallas, Houston Branch June 2016
 The Houston Economy Jesse Thompson Regional Business Economist The Federal Reserve Bank of Dallas, Houston Branch June 2016 Image from http://peoplesguidetohouston.wordpress.com/category/uncategorized/
Philadelphia Housing s Recovery Becomes More Equitable in Q3 Sales surge citywide; house value appreciation strongest in low-priced neighborhoods.
 Philadelphia Housing s Recovery Becomes More Equitable in Q3 Sales surge citywide; house value appreciation strongest in low-priced neighborhoods. October 13, 2014: After a brisk spring which saw widespread
Southern Lodging Summit Memphis, TN. Presented by Randy Smith Founder Smith Travel Research
 Southern Lodging Summit Memphis, TN Presented by Randy Smith Founder Smith Travel Research Total US - Key Statistics 12-Months Ending July 2012 % Change Hotels 52.3 k Room Supply 1.8 bn 0.4% Room Demand
PHILADELPHIA HOUSE PRICE INDICES
 PHILADELPHIA HOUSE PRICE INDICES April 14, 2014 KEVIN C. GILLEN, Ph.D. gillenk@upenn.edu Disclaimers and Acknowledgments: The Fels Institute of Government at the University of Pennsylvania provides this
The Canadian Real Estate Association News Release
 The Canadian Real Estate Association News Release Canadian home sales at five-year low in May Ottawa, ON, June 15, 2018 Statistics 1 released today by The Canadian Real Estate Association (CREA) show national
Spring Time for Housing
 Spring Time for Housing Arizona State University December 2 nd, 2015 Presented By: Elliott D. Pollack CEO, IN PHOENIX 1 2 The World has Changed Pre-2007 Post-2007 3 Employment Growth From Bottom of Recession
Economy On The Rebound
 Economy On The Rebound Robert Johnson Associate Director of Economic Analysis November 17, 2009 robert.johnson@morningstar.com (312) 696-6103 2009, Morningstar, Inc. All rights reserved. Executive
TOD TOWNHOUSE SITE. Seattle Apartment Team 70,000 LOT SF 7 TAX PARCELS 50+ TOWNHOUSE POTENTIAL SHORELINE, WA SEATTLE CBD
 UW SEATTLE CBD 70,000 LOT SF 7 TAX PARCELS 50+ POTENTIAL SHORELINE, WA TIM MCKAY O: +1 206 223 5586 Tim.McKay@Colliers.com NORTHGATE MALL DAN CHHAN O: +1 206 223 1265 Dan.Chhan@Colliers.com SAM WAYNE Associate
save percentages? (Name) (University)
 (University)") 1 IB Maths Essay: What is the correlation between the height of football players and their save percentages? (Name) (University) Table of Contents Raw Data for Analysis...3 Table 1: Raw Data...3 Rationale
1 IB Maths Essay: What is the correlation between the height of football players and their save percentages? (Name) (University) Table of Contents Raw Data for Analysis...3 Table 1: Raw Data...3 Rationale
PHILADELPHIA HOUSE PRICE INDICES
 PHILADELPHIA HOUSE PRICE INDICES January 15, 2015 KEVIN C. GILLEN, Ph.D. Kevin.C.Gillen@Drexel.edu Disclaimers and Acknowledgments: The Lindy Institute for Urban Innovation at Drexel University provides
The Party Is Over U.S. Automotive Outlooks
 The Party Is Over U.S. Automotive Outlooks Yen Chen Senior Research Economist Center for Automotive Research Federal Reserve Bank of Chicago Economic Outlook Symposium December 1, 2017 U.S. Light Vehicle
Order No. 55/18 CENTRA GAS MANITOBA INC.: PRIMARY GAS RATE APPLICATION, EFFECTIVE MAY 1, April 26, 2018
 CENTRA GAS MANITOBA INC.: PRIMARY GAS RATE APPLICATION, EFFECTIVE MAY 1, 2018 BEFORE: Larry Ring, Q.C., Panel Chair Marilyn Kapitany, B.Sc.(Hon), M.Sc., Vice Chair Carol Hainsworth, C.B.A., Member Susan
1. The data below gives the eye colors of 20 students in a Statistics class. Make a frequency table for the data.
 1. The data below gives the eye colors of 20 students in a Statistics class. Make a frequency table for the data. Green Blue Brown Blue Blue Brown Blue Blue Blue Green Blue Brown Blue Brown Brown Blue
High-Rise Fireground Field Experiments Results
 High-Rise Fireground Field Experiments Results These graphs show average times for each critical task by crew size. Percentage calculations for all the charts were based on the overall time from detection
Stock Market Handbook
 Stock Market Handbook May 11, 212 Dr. Edward Yardeni 516-972-7683 eyardeni@ Sailesh S Radha 83-786-1368 jabbott@ Please visit our sites at www. blog. thinking outside the box Table Of Contents Table Of