August 2016: Aspen Snowmass Real Estate Market Snapshot RELEASED 9/9/2016 ON OR NEAR THE 1ST MONDAY EACH MONTH
|
|
|
- Clarissa Ryan
- 5 years ago
- Views:
Transcription

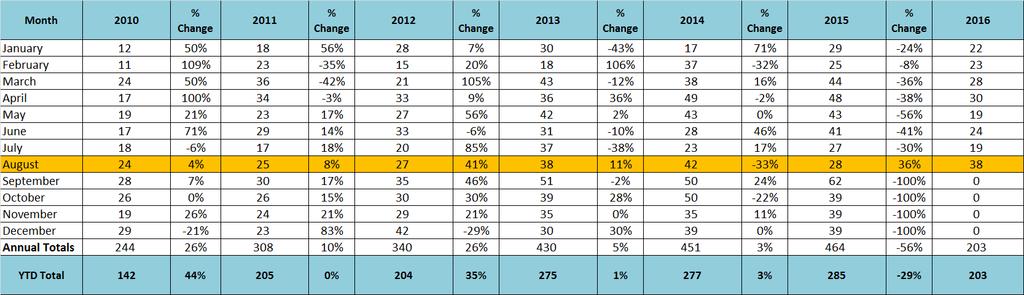
1 August 2016: Aspen Snowmass Real Estate Market Snapshot RELEASED 9/9/2016 ON OR NEAR THE 1ST MONDAY EACH MONTH v5.0 The Estin Report publishes a monthly Aspen real estate market Snapshot on or near the 1st Monday of each month. The Monthly Snapshot details residential real estate sales in Aspen s upper Roaring Fork Valley with three sections: 1) Total combined Aspen Snowmass Village Market; 2) The Aspen Market; 3) The Snowmass Village Market. It features charts, tables and 30-day live links to photos and details of sold properties and compares the subject Bottom line: August 2016 was another dramatically down sales month compared to same time last year. And the summer season June, July and August 2016 was also off similarly. Aspen single family home (SFH) unit sales especially suffered. They were down -55% to 5 sales in Aug 16 from 11 the same time last year, and down year-to-date (YTD) -64% to 22 sales in 2016 YTD from 61 in 2015 YTD. Dollar sales are off in almost the exact same percentages in Aug 2016 and for YTD Unit sales are the preferred metric indicating market activity and direction. Yes. Prices have started to come down - either upfront in the form of seasonal downward price decreases as sellers want to unload heading into the winter, or on the negotiating end with sellers willing to give up more from their ask prices. The result is that in most cases, the buyer is paying less. August 2016 Aspen & Snowmass Village Real Estate The Estin Report: Aspen Snowmass Real Estate Monthly Charts document sales activity for the subject month in the upper Roaring Fork Valley for Aspen (with Brush Creek) and Snowmass Village (SMV). Woody Creek and Old Snowmass are not included but they are represented on Pgs 7 and 9 Sales by Location. Property types included are single family homes, condos, townhomes, duplexes and residential vacant at sold at prices over $250,000. Fractionals are not included.
 in August 16 from (175) in August 15 Aspen condo sales YTD Unit Sales: -27% (78) in August 16 YTD from (107) in August 15 YTD Dollar Sales: -21% $168M")
 in August 15 Dollar Sales: -58% $42M in August 16 from $101M in August 15 Inventory Active Listings: +6% (199) in August 16 from (187) in August 15 Aspen Single family home sales")
 August 15 YTD * Typically, the Aspen market represents 70-75% of the total combined Aspen Snowmass Village real estate marketplace.")
2 August 2016 Market Statistics Summary for Aspen Only * Aspen condo sales August 2016 Unit Sales: +55% (17) in August 16 from (11) in August 15 Dollar Sales: +101% $32M in August 16 from $16M in August 15 Inventory Active Listings: +36% (238) in August 16 from (175) in August 15 Aspen condo sales YTD Unit Sales: -27% (78) in August 16 YTD from (107) in August 15 YTD Dollar Sales: -21% $168M in August 16 YTD from $213M in August 15 YTD Inventory Active Listings: +36% (238) in August 16 YTD from (175) in August 15 YTD Aspen Single family home sales August 2016 Unit Sales: -55% (5) in August 16 from (11) in August 15 Dollar Sales: -58% $42M in August 16 from $101M in August 15 Inventory Active Listings: +6% (199) in August 16 from (187) in August 15 Aspen Single family home sales YTD Unit Sales: -64% (22) in August 16 YTD from (61) in August 15 YTD Dollar Sales: -64% $153M in August 16 YTD from $426M in August 15 YTD Inventory Active Listings: +6% (199) in August 16 YTD from (187) August 15 YTD * Typically, the Aspen market represents 70-75% of the total combined Aspen Snowmass Village real estate marketplace. August 2016 Aspen Snowmass Market Inventory and Sales UC/Pending NOTE: UC The number of units that went Under Contract in August This does not necessarily mean that they will close in August, or at all. They August fall out of contract. UC s are used as an indicator of future activity when compared to the prior year. In general, rising inventory and a falling number of under contracts suggests a softening of pricing pressure, but this information needs to be viewed by specific neighborhood for a real determination.
 category now includes Townhomes (TH) and Duplexes per Aspen Glenwood MLS definition. Single Family Homes are SFH. A blank cell above represents no sales during time period.")

3 August 2016 Aspen and Snowmass Median Prices Note: Aspen includes Aspen and Brush Creek Village, not included are Snowmass Village, Old Snowmass and Woody Creek. * Condos (CO) category now includes Townhomes (TH) and Duplexes per Aspen Glenwood MLS definition. Single Family Homes are SFH. A blank cell above represents no sales during time period. Median prices are less likely than Avg Prices to be disproportionately skewed by extreme high or low priced sales. August 2016 Avg $ / Sq Ft for Aspen and Snowmass Village Note: Aspen includes Aspen and Brush Creek Village, not included are Snowmass Village, Old Snowmass and Woody Creek. *Condos (CO) category now includes Townhomes (TH) and Duplexes per Aspen Glenwood MLS definition. Single Family Homes are SFH. A blank cell above represents no sales during the time period.


4 Estin Report: Total Aspen Snowmass Market August 2016 & Historical Sales The Estin Report: Aug Estin Report: Total Aspen Snowmass Market August 2016 Sales Volume Estin Report: Total Aspen Snowmass Market August 2016 Unit Sales

5 August 2016 Aspen & Snowmass Village Total Sales Comparisons Bars represent $ volume by property type (left axis) and shaded areas represent unit sales/listing inventory (right axis) Vacant Land is excluded from graph for scale reasons. The Estin Report: Aug The Estin Report: Aspen Snowmass Real Estate Monthly Charts document sales activity for the subject month in the upper Roaring Fork Valley - Aspen, Snowmass Village (SMV), Woody Creek (WC) and Old Snowmass (OSM). Included property types are single family homes, condos, townhomes, duplexes and residential vacant land at sold at prices over $250,000. Fractionals are not included. Aspen* includes WC and OSM. Information is from sources deemed reliable but cannot be guaranteed. The Estin Report is copyrighted 2016 and all rights reserved. Use is permitted subject to the following attribution with an active link to the source: "The Estin Report on Aspen real estate." For sales assistance and inquiries, please call Aspen Sothebys broker Tim Estin at or tim@estinaspen.com

. Included property types are single family homes, condos, townhomes, duplexes and residential vacant land at sold at prices over $250,000. Fractionals are not included.")
6 August 2016 Aspen Sales Comparisons Bars represent $ volume by property type (left axis) and shaded areas represent unit sales/listing inventory (right axis) *Includes Aspen and Brush Creek Village not Snowmass Village, Woody Creek, and Old Snowmass. Vacant land excluded for scale reasons. The Estin Report: Aug The Estin Report: Aspen Snowmass Real Estate Monthly Charts document sales activity for the subject month in the upper Roaring Fork Valley - Aspen, Snowmass Village (SMV), Woody Creek (WC) and Old Snowmass (OSM). Included property types are single family homes, condos, townhomes, duplexes and residential vacant land at sold at prices over $250,000. Fractionals are not included. Aspen* includes WC and OSM. Information is from sources deemed reliable but cannot be guaranteed. The Estin Report is copyrighted 2016 and all rights reserved. Use is permitted subject to the following attribution with an active link to the source: "The Estin Report on Aspen real estate." For sales assistance and inquiries, please call Aspen Sothebys broker Tim Estin at or tim@estinaspen.com


7 Estin Report: August 2016 Aspen Condos - 3-Mos. Averages Estin Report: What Aspen* Areas Are Selling? 3-Mos. Avg. Sales by Location *Specific Aspen areas only, does not include Snowmass Village and Old Snowmass and not all Aspen neighborhoods are represented.

8 August 2016 Snowmass Village Sales Comparisons Bars represent $ volume by property type (left axis) and shaded areas represent unit sales/listing inventory (right axis) *Snowmass Village only. Vacant Land is excluded from graph for scale reasons. The Estin Report: Aug The Estin Report: Aspen Snowmass Real Estate Monthly Charts document sales activity for the subject month in the upper Roaring Fork Valley - Aspen, Snowmass Village (SMV), Woody Creek (WC) and Old Snowmass (OSM). Included property types are single family homes, condos, townhomes, duplexes and residential vacant land at sold at prices over $250,000. Fractionals are not included. Aspen* includes WC and OSM. Information is from sources deemed reliable but cannot be guaranteed. The Estin Report is copyrighted 2016 and all rights reserved. Use is permitted subject to the following attribution with an active link to the source: "The Estin Report on Aspen real estate." For sales assistance and inquiries, please call Aspen Sothebys broker Tim Estin at or tim@estinaspen.com


9 Estin Report: August 2016 Snowmass Village Condos 3-Mos. Averages Estin Report: What Snowmass Village* Areas Are Selling? Monthly and 3-Mos. Averages *Specific Snowmass Village areas only, does not include Aspen, Woody Creek, Brush Creek Village, and Old Snowmass and not all SMV neighborhoods are represented.

10 August 2016: Aspen Snowmass Real Estate Market Snapshot
September 2017: Aspen Snowmass Real Estate Market Snapshot RELEASED 10/08/17 ON OR NEAR THE 1ST MONDAY EACH MONTH
 September 2017: Aspen Snowmass Real Estate Market Snapshot RELEASED 10/08/17 ON OR NEAR THE 1ST MONDAY EACH MONTH v2.1 The Estin Report publishes a monthly Aspen real estate market Snapshot on or near
Estin Report: Summer 2015 Market Snapshot Aspen Snowmass Real Estate
 Estin Report: Summer 2015 Market Snapshot Aspen Snowmass Real Estate 09/03/2015 v2 The Estin Report began publishing monthly Aspen real estate market snapshots in 2012 on or near the 1st Monday of each
REAL ESTATE MARKET REPORT
 Second Quarter ASPEN SNOWMASS REAL ESTATE MARKET REPORT presented by KLUG PROPERTIES CHRIS KLUG 97.948.755 CHRIS KLUG 97.948.755 Klug Properties SECOND QUARTER MARKET REPORT Happy summertime! I hope you
Monthly Indicators - 9.1% + 4.5% + 8.0% Activity Overview New Listings. Closed Sales Median Sales Price
 Monthly Indicators 2018 Home prices were consistently up again in most markets in 2018 but at reduced levels compared to recent years. High demand for few homes for sale fueled price increases, but evidence
Monthly Indicators + 3.2% + 8.6% + 7.7%
 Monthly Indicators 2018 Residential real estate activity comprised of single-family properties, townhomes and condominiums combined. Percent changes are calculated using rounded figures. Activity Snapshot
REAL ESTATE MARKET REPORT
 Third Quarter 2017 ASPEN SNOWMASS REAL ESTATE MARKET REPORT presented by KLUG PROPERTIES CHRIS KLUG 970.948.7055 Klug Properties THIRD QUARTER 2017 MARKET REPORT Happy fall season from Aspen! I hope you
Monthly Indicators % + 8.2% % Market Overview New Listings Pending Sales. Closed Sales. Days on Market Until Sale. Median Sales Price
 Monthly Indicators 2018 Some economy observers are pointing to 2018 as the final period in a long string of sentences touting several happy years of buyer demand and sales excitement for the housing industry.
Monthly Indicators - 6.4% + 8.0% - 5.3% Market Overview New Listings Pending Sales. Closed Sales. Days on Market Until Sale. Median Sales Price
 Monthly Indicators 2018 The booming U.S. economy continues to prop up home sales and new listings in much of the nation, although housing affordability remains a concern. Historically, housing is still
Monthly Indicators - 5.2% % % Activity Overview New Listings Pending Sales. Closed Sales. Days on Market Until Sale. Median Sales Price
 Monthly Indicators 2018 Sales and new listings continue to perform well throughout the state of New York largely due to a booming U.S. economy that has increased listing and purchasing confidence. Housing
Alabama Residential Report August 2018
 Alabama Residential Report August 2018 Monthly Indicators Recent Figures Trends Total Residential Sales Current Month August 2018 5,862 Alabama home sales for August 2018 vs. Prior Month July 2018 5,722
Asheville Region Monthly Indicators
 Asheville Region Monthly Indicators A RESEARCH TOOL PROVIDED BY CHARLOTTE REGIONAL REALTOR ASSOCIATION FOR MORE INFORMATION CONTACT A REALTOR 2018 If the last few months are an indication of the temperature
Monthly Indicators 0.0% + 7.9% %
 Monthly Indicators 2018 Residential real estate activity comprised of single-family properties, townhomes and condominiums combined. Percent changes are calculated using rounded figures. Activity Snapshot
Monthly Indicators + 1.7% + 7.1% % Market Overview New Listings Pending Sales. Closed Sales. Days on Market Until Sale. Median Sales Price
 Monthly Indicators 2018 Home prices were consistently up again in most markets in 2018 but at reduced levels compared to recent years. High demand for few homes for sale fueled price increases, but evidence
Preston s Edmond Market Report
 Preston s Edmond arket Report July 2 Prepared By Brian Preston RE/AX Associates obile: 45-826-5725 Office: 45-359-87 bpreston88@sbcglobal.net www.edmond4sale.com Realtor of the Year 1995 & 22 Lifetime
Alabama Residential Report December 2016
 Alabama Residential Report December 2016 Monthly Indicators Recent Figures Trends : Total Residential Sales Total Residential Sales Current Month December 2016 4,035 6,000 Alabama home sales for December
THE SLIFER REPORT VAIL VALLEY REAL ESTATE 2018 ANNUAL MARKET REVIEW 2018 VAIL VALLEY, COLORADO
 THE SLIFER REPORT VAIL VALLEY REAL ESTATE 2018 ANNUAL MARKET REVIEW 2018 VAIL VALLEY, COLORADO TABLE OF CONTENTS Overall Market Share & Recap Vail Valley Overview Luxury Market Overview 3 4 5 Vail Village
Charlotte Region Monthly Indicators
 Charlotte Region Monthly Indicators A RESEARCH TOOL PROVIDED BY CHARLOTTE REGIONAL REALTOR ASSOCIATION FOR MORE INFORMATION CONTACT A REALTOR 2018 Some economy observers are pointing to 2018 as the final
Charlotte Region Monthly Indicators
 Charlotte Region Monthly Indicators A RESEARCH TOOL PROVIDED BY CHARLOTTE REGIONAL REALTOR ASSOCIATION FOR MORE INFORMATION CONTACT A REALTOR 2018 If the last few months are an indication of the temperature
Monthly Indicators. Quick Facts - 4.5% January % + 7.9%
 Monthly Indicators 2019 Despite a strong U.S. economy, historically low unemployment and steady wage growth, home sales began to slow across the nation late last year. Blame was given to a combination
Monthly Indicators - 5.7% - 6.3% - 2.6% Activity Overview New Listings Pending Sales. Closed Sales. Days on Market Until Sale. Median Sales Price
 Monthly Indicators 2019 Despite a strong U.S. economy, historically low unemployment and steady wage growth, home sales began to slow across the nation late last year. Blame was given to a combination
Monthly Indicators. Quick Facts 0.0% January % + 3.2%
 Monthly Indicators 2019 Despite a strong U.S. economy, historically low unemployment and steady wage growth, home sales began to slow across the nation late last year. Blame was given to a combination
Quick Facts. For Week Ending February 16, 2019 Data current as of February 25, % % - 0.3% Metrics by Week
 Charlotte Region Weekly Market Report A RESEARCH TOOL PROVIDED BY THE CHARLOTTE REGIONAL REALTOR ASSOCIATION FOR MORE INFORMATION CONTACT A REALTOR For Week Ending February 16, 2019 Data current as of
Greater Las Vegas Snapshot by Sale Type Last Month's Sold
 Available Units Pending Units Las Vegas Market Update - February 2018 Greater Las Vegas Snapshot by Sale Type Last Month's Sold Units Median List Price Average List Price Median Sold Price Average Sold
Greater Las Vegas Snapshot by Sale Type Last Month's Sold
 Available Units Pending Units Las Vegas Market Update - April 2018 Greater Las Vegas Snapshot by Sale Type Last Month's Sold Units Median List Price Average List Price Median Sold Price Average Sold Price
Quick Facts. For Week Ending December 8, 2018 Data current as of December 17, % % - 5.0% Metrics by Week
 Charlotte Region Weekly Market Report A RESEARCH TOOL PROVIDED BY THE CHARLOTTE REGIONAL REALTOR ASSOCIATION FOR MORE INFORMATION CONTACT A REALTOR For Week Ending December 8, 2018 Data current as of December
Charlotte Region Monthly Indicators
 Charlotte Region Monthly Indicators A RESEARCH TOOL PROVIDED BY CHARLOTTE REGIONAL REALTOR ASSOCIATION FOR MORE INFORMATION CONTACT A REALTOR 2018 Home prices were consistently up again in most markets
Greater Las Vegas Snapshot by Sale Type Last Month's Sold
 Available Units Pending Units Las Vegas Market Update - June 2018 Greater Las Vegas Snapshot by Sale Type Last Month's Sold Units Median List Price Average List Price Median Sold Price Average Sold Price
Greater Las Vegas Snapshot by Sale Type Last Month's Sold
 Available Units Pending Units Las Vegas Market Update - July 2018 Greater Las Vegas Snapshot by Sale Type Last Month's Sold Units Median List Price Average List Price Median Sold Price Average Sold Price
Greater Las Vegas Snapshot by Sale Type Last Month's Sold
 Available Units Pending Units Las Vegas Market Update - December 2018 Greater Las Vegas Snapshot by Sale Type Last Month's Sold Units Median List Price Average List Price Median Sold Price Average Sold
Phone: Fax: Commissioners Road, W. London, Ontario N6J 1Y3 STATISTICAL REPORT. (for month ending June 30, 2017)
") Phone: 519-641-1400 Fax: 519-641-1419 342 Commissioners Road, W. London, Ontario N6J 1Y3 STATISTICAL REPORT (for month ending June 30, 2017) Table of Contents News Release for June 2017 3 Market Report
Phone: 519-641-1400 Fax: 519-641-1419 342 Commissioners Road, W. London, Ontario N6J 1Y3 STATISTICAL REPORT (for month ending June 30, 2017) Table of Contents News Release for June 2017 3 Market Report
Phone: Fax: Commissioners Road, W. London, Ontario N6J 1Y3 STATISTICAL REPORT. (for month ending April 30, 2017)
") Phone: 519-641-1400 Fax: 519-641-1419 342 Commissioners Road, W. London, Ontario N6J 1Y3 STATISTICAL REPORT (for month ending April 30, 2017) Table of Contents News Release for April 2017 3 Market Report
Phone: 519-641-1400 Fax: 519-641-1419 342 Commissioners Road, W. London, Ontario N6J 1Y3 STATISTICAL REPORT (for month ending April 30, 2017) Table of Contents News Release for April 2017 3 Market Report
May 2018 MLS Statistical Report
 Jan Feb Mar Apr May Jun Jul Aug Sep Oct Nov Dec January February March April May June July August Septem October Novem Decemb Days on Market The graph on the right illustrates the drastic decline in the
Charlotte Region Monthly Indicators
 Charlotte Region Monthly Indicators A RESEARCH TOOL PROVIDED BY CHARLOTTE REGIONAL REALTOR ASSOCIATION FOR MORE INFORMATION CONTACT A REALTOR 2018 The booming U.S. economy continues to prop up home sales
2009 California & Bay Area Real Estate Market Outlook
 2009 California & Bay Area Real Estate Market Outlook November 24, 2008 Fairmont Hotel Leslie Appleton-Young C.A.R. Vice President and Chief Economist California Real Estate Market: 2008 California s Housing
Aspen Snowmass Transient Lodging Inventory Study as of July 1, 2012
 INTRODUCTION A benchmark transient lodging inventory study was conducted by MTRiP on behalf of Aspen Skiing Company during the summer of 2008 for inventory in the City of Aspen and the Town of Snowmass
Phone: Fax: Commissioners Road, W. London, Ontario N6J 1Y3 STATISTICAL REPORT. (for month ending June 30, 2016)
") Phone: 519-641-1400 Fax: 519-641-1419 342 Commissioners Road, W. London, Ontario N6J 1Y3 STATISTICAL REPORT (for month ending June 30, 2016) Table of Contents News Release for June 2016 3 Market Report
Phone: 519-641-1400 Fax: 519-641-1419 342 Commissioners Road, W. London, Ontario N6J 1Y3 STATISTICAL REPORT (for month ending June 30, 2016) Table of Contents News Release for June 2016 3 Market Report
Commercial real estate sales down, prices up in the Lower Mainland
 News Release Commercial real estate sales down, prices up in the Lower Mainland Vancouver, B.C. September 13, 2018 The commercial real estate market in the Lower Mainland continued to see fewer transactions
Commercial real estate sales down from robust 2017 activity
 News Release Commercial real estate sales down from robust 2017 activity Vancouver, B.C. June 21, 2018 Commercial real estate sales in the Lower Mainland declined in the first quarter (Q1) of 2018 compared
Commercial real estate sales decline and price activity varies across the Lower Mainland
 News Release Commercial real estate sales decline and price activity varies across the Lower Mainland VANCOUVER, BC December 7, 2018 Commercial real estate sales in the Lower Mainland declined in the third
News Release : Fewer commercial property sales in first quarter 2013
 News Release : Fewer commercial property sales in first quarter 2013 Vancouver, B.C. June 6, 2013 The first quarter of 2013 saw a reduction in the total dollar value and quantity of commercial real estate
Commercial real estate sales in 2017 were 11.1 per cent above the region s five-year sales average.
 News Release Commercial real estate sales down, values up in 2017 VANCOUVER, BC March 12, 2018 Commercial real estate sales activity in the Lower Mainland declined from the record highs of one year ago
Quick Facts. For Week Ending March 9, 2019 Data current as of March 18, % % - 1.5% Metrics by Week
 Charlotte Region Weekly Market Report A RESEARCH TOOL PROVIDED BY THE CHARLOTTE REGIONAL REALTOR ASSOCIATION FOR MORE INFORMATION CONTACT A REALTOR For Week Ending March 9, 2019 Data current as of March
September 2017 MLS Statistical Report. Residential Inventory
 September 217 MLS Statistical Report Residential Inventory 2 2 1 1 21 216 217 Summary Inventories: Residential inventory is down 1%, Lots / Land inventory is down 13% and commercial inventory was down
Monday Morning Quarterback Summary
 Summary Jun, 8 Single-family existing homes Sales of single-family homes increased to 7 during the week of Jun, from the week prior The median price of single family homes decreased to $6,, a change of
Monthly Indicators - 8.0% + 5.8% + 1.1% Activity Overview New Listings Pending Sales. Closed Sales. Days on Market. Median Sales Price
 Monthly Indicators 2019 Despite a strong U.S. economy, historically low unemployment and steady wage growth, home sales began to slow across the nation late last year. Blame was given to a combination
PHILADELPHIA HOUSE PRICE INDICES
 PHILADELPHIA HOUSE PRICE INDICES February 13, 2017 KEVIN C. GILLEN, Ph.D. Kevin.C.Gillen@Drexel.edu Disclaimers and Acknowledgments: The Lindy Institute for Urban Innovation at Drexel University provides
Charlotte Region Monthly Indicators
 Charlotte Region Monthly Indicators A RESEARCH TOOL PROVIDED BY CHARLOTTE REGIONAL REALTOR ASSOCIATION FOR MORE INFORMATION CONTACT A REALTOR 2019 Despite a strong U.S. economy, historically low unemployment
Stay Aspen Snowmass Transient Inventory Study May 2015
 INTRODUCTION An analysis of the number and type of rental units and pillows available for short-term rental in Aspen and Snowmass, Colorado as of May 31, 2015 was conducted on behalf of Stay Aspen Snowmass.by
Percent of Brokerages by Size
 Percent of Brokerages by Size 80% 70% 60% 58.4% 50% 40% 30% 28.7% 20% 10% 0% #: +23.6% -7.3% +9.9% 0.1% 0.1% 0.2% 0.5% 0.6% 1.8% 2.6% 1,000+ 500-999 300-499 100-299 50-99 20-49 10-19 5-9 2-4 Single Brokers
2019 Annual Recalculation and Reappraisal Setup Studies for All Residential Properties in Columbia County for Property Tax Assessment
 2019 Annual Recalculation and Reappraisal Setup Studies for All Residential Properties in Columbia County for Property Tax Assessment Published by the Columbia County Assessor January 2, 2019 Table of
State of the City of Carpinteria
 April 21, 2017 Mark Schniepp Director State of the City of Carpinteria jobs 1,000 Employment in Information / Carpinteria Valley 2006 -- 2016 800 600 400 200 0 2006 2008 2010 2012 2014 2016 ConstructiveDIVE.com
Annual Report on the Charlotte Region Housing Market RESIDENTIAL REAL ESTATE ACTIVITY FROM THE CHARLOTTE REGIONAL REALTOR ASSOCIATION
 Annual Report on the Charlotte Region Housing Market RESIDENTIAL REAL ESTATE ACTIVITY FROM THE CHARLOTTE REGIONAL REALTOR ASSOCIATION Annual Report on the Charlotte Region Housing Market RESIDENTIAL REAL
Residential Market Report
 MARKET Q1/08 REPORT Residential Rhode Island s Quarterly STATEWIDE The Rhode Island housing market in the first quarter of 2008 showed declines in both the median price of single family homes as well as
PHILADELPHIA REGIONAL HOUSE PRICE INDICES
 PHILADELPHIA REGIONAL HOUSE PRICE INDICES August 11, 2015 KEVIN C. GILLEN, Ph.D. Kevin.C.Gillen@Drexel.edu Disclaimers and Acknowledgments: The Lindy Institute for Urban Innovation at Drexel University
Big Changes, Unknown Impacts
 Big Changes, Unknown Impacts Boulder Economic Forecast Place cover image here Richard Wobbekind Senior Economist and Associate Dean for Business and Government Relations January 17, 2018 Real GDP Growth
The Schindler Report: 2010
 The Schindler Report: 2010 Janet Feinberg Schindler San Francisco Brokerage Dear Homeowners, Happy New Year and thank you for your business in 2010! Thanks to you, Haute Living named me one of the eight
Unit 6 Day 2 Notes Central Tendency from a Histogram; Box Plots
 AFM Unit 6 Day 2 Notes Central Tendency from a Histogram; Box Plots Name Date To find the mean, median and mode from a histogram, you first need to know how many data points were used. Use the frequency
Regional Real Estate Trends
 Regional Real Estate Trends Terry L. Clower, Ph.D. Director, Center for Regional Analysis Schar School of Policy and Government George Mason University April 6, 2018 140.0 120.0 100.0 80.0 60.0 40.0 20.0
Metro Atlanta. Cleve s 10-Year Market Projections SF Detached. GoGaddis.com 89,002 83,829 78,958 74,369 70,047 65,976 62,142 58,531 55,129 51,926
 350000 300000 250000 200000 $231,000 $221,760 $228,413 $235,265 $242,323 Metro Atlanta Cleve s 10-Year Market Projections SF Detached $252,016 $262,097 $275,909 $290,450 $305,756 $321,870 Total Single
Student Population Projections By Residence. School Year 2016/2017 Report Projections 2017/ /27. Prepared by:
 Student Population Projections By Residence School Year 2016/2017 Report Projections 2017/18 2026/27 Prepared by: Revised October 31, 2016 Los Gatos Union School District TABLE OF CONTENTS Introduction
Compiled from Santa Barbara Multiple Listing Service Data on 10/7/2014. Statistics Through September 14
 Compiled from Santa Barbara Multiple Listing Service Data on 10/7/2014 Statistics Through September 14 MLS vs CORT for August 14 2 Multi-Family 1 Cancelled in MLS 2 Closed in January 1 Closed in May 2
PHILADELPHIA HOUSE PRICE INDICES
 PHILADELPHIA HOUSE PRICE INDICES July 20, 2017 KEVIN C. GILLEN, Ph.D. Kevin.C.Gillen@Drexel.edu Disclaimers and Acknowledgments: The Lindy Institute for Urban Innovation at Drexel University provides this
Condos September August. Townhomes September August
 September 2018 Detached Properties September August Total 6,787 6,368 + 6.6% 6,783 6,124 + 10.8% 513 865-40.7% 579 915-36.7% Days on Market Average 53 42 + 26.2% 54 36 + 50.0% MLS HPI $1,540,900 $1,613,700-4.5%
Housing Market Update Greater Moncton. Housing market intelligence you can count on
 Housing Market Update Greater Moncton Housing market intelligence you can count on Housing Market Drivers Multi-Residential/Rental Market New Home Market Single Family Homes Resale Market 2013/2014 Outlook
PHILADELPHIA REGIONAL HOUSE PRICE INDICES
 PHILADELPHIA REGIONAL HOUSE PRICE INDICES May 6, 2015 KEVIN C. GILLEN, Ph.D. Kevin.C.Gillen@Drexel.edu Disclaimers and Acknowledgments: The Lindy Institute for Urban Innovation at Drexel University provides
INSIDE EDGE WINTER 2015 SLIFER SMITH & FRAMPTON REAL ESTATE. News from the most trusted name in Colorado mountain real estate since 1962
 SLIFER SMITH & FRAMPTON REAL ESTATE INSIDE EDGE SUMMITCOUNTYREALESTATE.COM WINTER 2015 IN THIS ISSUE >> Real Estate Market Update 2 Market Watch 3-4 Winter Life in Summit County 5 Summit County 6 Development
State of the Philadelphia Housing Market
 State of the Philadelphia Housing Market September 17, 2014 KEVIN C. GILLEN, Ph.D. gillenk@upenn.edu Disclaimers and Acknowledgments: The Fels Institute of Government at the University of Pennsylvania
Compression Study: City, State. City Convention & Visitors Bureau. Prepared for
 : City, State Prepared for City Convention & Visitors Bureau Table of Contents City Convention & Visitors Bureau... 1 Executive Summary... 3 Introduction... 4 Approach and Methodology... 4 General Characteristics
TWO FORKS RANCH A5 REAL ESTATE. 790 Acres. Smiths Fork - Lincoln County - Wyoming
 TWO FORKS RANCH 790 Acres Smiths Fork - Lincoln County - Wyoming A5 REAL ESTATE WWW.A5REALESTATE.COM QUICK FACTS Located in the upper Smiths Fork drainage of Lincoln County, Wyoming, the Two Forks Ranch
PHILADELPHIA HOUSE PRICE INDICES
 PHILADELPHIA HOUSE PRICE INDICES April 14, 2014 KEVIN C. GILLEN, Ph.D. gillenk@upenn.edu Disclaimers and Acknowledgments: The Fels Institute of Government at the University of Pennsylvania provides this
PHILADELPHIA HOUSE PRICE INDICES
 PHILADELPHIA HOUSE PRICE INDICES January 15, 2015 KEVIN C. GILLEN, Ph.D. Kevin.C.Gillen@Drexel.edu Disclaimers and Acknowledgments: The Lindy Institute for Urban Innovation at Drexel University provides
The Canadian Real Estate Association News Release
 The Canadian Real Estate Association News Release Canadian home sales activity strengthens in July Ottawa, ON, August 15, 2018 Statistics 1 released today by The Canadian Real Estate Association (CREA)
Reading Time: 15 minutes Writing Time: 1 hour 30 minutes. Structure of Book. Number of questions to be answered. Number of modules to be answered
 Reading Time: 15 minutes Writing Time: 1 hour 30 minutes Letter Student Number: Structure of Book Section A - Core Section B - Modules Number of questions Number of questions to be answered Number of marks
Idaho Department of Lands Payette Lake Multiple Property Auction Friday, June 23rd, 2017, 1:00 pm MST
 Idaho Department of Lands Payette Lake Multiple Property Auction Friday, June 23rd, 2017, 1:00 pm MST ORDER OF AUCTION This information, while not guaranteed, is from sources we believe to be reliable.
The Canadian Real Estate Association News Release
 The Canadian Real Estate Association News Release Canadian home sales at five-year low in May Ottawa, ON, June 15, 2018 Statistics 1 released today by The Canadian Real Estate Association (CREA) show national
PALMETTO DUNES SHELTER COVE LEAMINGTON
 PALMETTO DUNES SHELTER COVE LEAMINGTON The Plaza At Shelter Cove 50P Shelter Cove Lane Hilton Head Island, South Carolina FALL 2018 Hilton Head Island Performance Group... The perfect holiday gift!! Are
PHILADELPHIA REGIONAL HOUSE PRICE INDICES
 PHILADELPHIA REGIONAL HOUSE PRICE INDICES November 28, KEVIN C. GILLEN, Ph.D. Kevin.C.Gillen@Drexel.edu Sponsored By: Disclaimers and Acknowledgments: The Lindy Institute for Urban Innovation at Drexel
1. The data below gives the eye colors of 20 students in a Statistics class. Make a frequency table for the data.
 1. The data below gives the eye colors of 20 students in a Statistics class. Make a frequency table for the data. Green Blue Brown Blue Blue Brown Blue Blue Blue Green Blue Brown Blue Brown Brown Blue
95 Express Annual Operations Report: Fiscal Year
 95 Express Annual Operations Report: Fiscal Year 2014-2015 General The 95 Express Program completed its sixth full Fiscal Year of operations in June 2015. For the FDOT, its Fiscal Year (FY) is from July
STEAMBOAT SOTHEBY S INTERNATIONAL REALTY RESORT REPORT 2016
 STEAMBOAT SOTHEBY S INTERNATIONAL REALTY RESORT REPORT 2016 The life you love. steamboatsir.com RESORT MARKET AT A GLANCE Often found in desirable, slightly less accessible locations than national mainstream
COMPARISON OF FIXED & VARIABLE RATES (25 YEARS) CHARTERED BANK ADMINISTERED INTEREST RATES - PRIME BUSINESS*
 CHARTERED BANK ADMINISTERED INTEREST RATES - PRIME BUSINESS*") COMPARISON OF FIXED & VARIABLE RATES (25 YEARS) Fixed Rates Variable Rates FIXED RATES OF THE PAST 25 YEARS AVERAGE RESIDENTIAL MORTGAGE LENDING RATE - 5 YEAR* (Per cent) Year Jan Feb Mar Apr May Jun Jul
COMPARISON OF FIXED & VARIABLE RATES (25 YEARS) Fixed Rates Variable Rates FIXED RATES OF THE PAST 25 YEARS AVERAGE RESIDENTIAL MORTGAGE LENDING RATE - 5 YEAR* (Per cent) Year Jan Feb Mar Apr May Jun Jul
Economic Outlook: fear over fundamentals
 ECONOMICS I RESEARCH Economic Outlook: fear over fundamentals April 2016 Craig Wright (SVP & Chief Economist) (416) 974-7457 craig.wright@rbc.com Volatility index Market volatility index, (VIX) 90 80 70
Avison Young Atlanta Retail Overview Q Review
 Avison Young Atlanta Retail Overview Q3 2016 Review Partnership. Performance. Table of Contents Atlanta Overview Significant Retail Transactions by Market Atlanta Retail Market Overview Avison Young Overview
SALUDA HEIGHTS 0 SPARTANBURG HIGHWAY SALUDA, NC Michael Hoffman Broker of Record/Executive DirectorNC
 SALUDA HEIGHTS 0 SPARTANBURG HIGHWAY SALUDA, NC 28773 Michael Hoffman Broker of Record/Executive DirectorNC 828.774.5535 michael.hoffman@svn.com Kevin Jennings Advisor 828.774.5535 kevin.jennings@svn.com
High-Rise Fireground Field Experiments Results
 High-Rise Fireground Field Experiments Results These graphs show average times for each critical task by crew size. Percentage calculations for all the charts were based on the overall time from detection
RED DEER HOUSING MARKET OUTLOOK
 RED DEER - JUNE 3, 2009 RED DEER HOUSING MARKET OUTLOOK Regine durand Market Analyst - CMHC Prairie and Territories 50,000 48,000 46,000 44,000 42,000 40,000 38,000 36,000 34,000 32,000 30,000 28,000 Red
2009 Forecast for the Chicago CBD
 TR Mandigo & Company 2009 Forecast for the Chicago CBD Presented to: Council of Chicago Hotel General Managers By Ted Mandigo Director of TR Mandigo & Company 8/4/2009 Let s cut to the chase. There s a
STEAMBOAT SOTHEBY S INTERNATIONAL REALTY RESORT REPORT. Mid-Year 2015
 STEAMBOAT SOTHEBY S INTERNATIONAL REALTY RESORT REPORT Mid-Year 2015 RESORT MARKET AT A GLANCE STEAMBOAT SPRINGS, COLORADO Resort communities throughout Colorado, the western United States and around the
Frederick Ross. Real Estate Market Overview. Presented by: Kevin Thomas Senior Vice President. Frederick Ross. Company.
 Frederick Ross Real Estate Market Overview Presented by: Kevin Thomas Senior Vice President Frederick Ross Company January 2003 Business Consumers Source: BEA, Ross Research Housing...Bust or Rust? 2001
VALLEY VIEW BUSINESS PARK INDUSTRIAL 3859, 3863, 3867, 3871 Valley View Boulevard Las Vegas, NV 89103
 PROPERTY HIGHLIGHTS: ±855 - ±1,112 SF Suites available Lease rates: $0.89 - $1.33 SF/MG Zoning: M-1 (Light Manufacturing) All units have grade doors Project has excellent visibility and frontage along
Internet Technology Fundamentals. To use a passing score at the percentiles listed below:
 Internet Technology Fundamentals To use a passing score at the percentiles listed below: PASS candidates with this score or HIGHER: 2.90 High Scores Medium Scores Low Scores Percentile Rank Proficiency
2019 Market Outlook. Jeff Tumbarello Director SWFL REIA Broker/Owner Steelbridge Realty LLC
 2019 Market Outlook Jeff Tumbarello Director SWFL REIA Broker/Owner Steelbridge Realty LLC Data from MLS (exported 1/14/2019 9:26 AM) and public records. Trended with Microsoft excel. Unless otherwise
Statistical Process Control Basics. LeanSix LLC
 Statistical Process Control Basics Statistical Process Control (SPC) is an industry standard methodology for measuring and controlling quality during the manufacturing process. Attribute data (measurements)
PHILADELPHIA REGIONAL HOUSE PRICE INDICES
 PHILADELPHIA REGIONAL HOUSE PRICE INDICES June 17, 2016 KEVIN C. GILLEN, Ph.D. Kevin.C.Gillen@Drexel.edu Disclaimers and Acknowledgments: The Lindy Institute for Urban Innovation at Drexel University provides
2007 Real Estate Market Forecast. October 18, 2006 Leslie Appleton-Young C.A.R. Vice President and Chief Economist
 2007 Real Estate Market Forecast October 18, 2006 Leslie Appleton-Young C.A.R. Vice President and Chief Economist Overview California Real Estate Market What happened in 2006? Tipping Points/Market Psychology
Vail Town Council Vail Economic Advisory Council
 Vail Town Council Vail Economic Advisory Council Quarterly Market/Research Report: - Orientation/History - Econometrics - Summer Review, Winter Outlook -Transient Inventory Study Synopsys Data as of Oct.
2) Average Days on Market and Average List-to-Sales-Price Ratio
 Average Days on Market and Average List-to-Sales-Price Ratio") August 6, 2002 Readers of the monthly Market Watch report will note some changes in this month's issue. These are due to the fact that, with the improved functionality of the new Toronto-MLS system, it
August 6, 2002 Readers of the monthly Market Watch report will note some changes in this month's issue. These are due to the fact that, with the improved functionality of the new Toronto-MLS system, it
VANCOUVER POLICE DEPARTMENT
 VANCOUVER POLICE DEPARTMENT REPORT TO THE VANCOUVER POLICE BOARD REPORT DATE: October 2, 2018 BOARD MEETING DATE: October 24, 2018 BOARD REPORT # 1810P01 Regular TO: FROM: SUBJECT: Vancouver Police Board
Horse Thief Trail Ranch
 Horse Thief Trail Ranch 680 Acres with a Log Home and Barn - Livingston, MT! 1 LOCATION Located just 10 miles north of Livingston, Montana and 45 miles from Bozeman, Montana. Air Service Available: Gallatin
2016 Texas Prosperity Conference The Barnhill Center Brenham, Texas August 26, Dr. James P. Gaines Chief Economist. recenter.tamu.
 2016 Texas Prosperity Conference The Barnhill Center Brenham, Texas August 26, 2016 Dr. James P. Gaines Chief Economist recenter.tamu.edu Housing and People 2 Texas Population 1910-2050 60,000,000 50,000,000