PHILADELPHIA REGIONAL HOUSE PRICE INDICES
|
|
|
- Gyles Stevenson
- 5 years ago
- Views:
Transcription

1 PHILADELPHIA REGIONAL HOUSE PRICE INDICES November 28, KEVIN C. GILLEN, Ph.D. Sponsored By: Disclaimers and Acknowledgments: The Lindy Institute for Urban Innovation at Drexel University and Houwzer Inc. provide this report free of charge to the public. The report is produced by Kevin Gillen, a Senior Research Fellow with the Lindy Institute and a Senior Economic Advisor with Houwzer. The author thanks Houwzer Inc., Azavea.com, the Philadelphia Office of Property Assessment, the Federal Housing Finance Agency, Case-Shiller MacroMarkets LLC, RealtyTrac, Zillow.com, Trulia.com and the NAHB for making their data available for this report., Drexel University, All Rights Reserved.
2 Philadelphia Regional House Price Indices Q1= Phila. Region* U.S. Avg.** Q3 *Empirically estimated by Kevin C. Gillen, PhD **Courtesy Federal Housing Finance Agency (FHFA)
3 390.0 House Price Appreciation 1987-: Philadelphia Region v. 10-City U.S. Composite City Composite* Philadelphia Region % Change 10-City Philadelphia 1998 to Peak: +172% +106% From Peak: -0.4% -2.5% *Source: Case-Shiller MacroMarkets LLC. The 10-City Composite Index includes Boston, Chicago, Denver, Las Vegas, Los Angeles, Miami, New York, San Diego, San Francisco and Washington DC. It does not include Philadelphia
4 Philadelphia Regional House Price Indices by Philadelphia Region and State: 1980Q1= Phila. Region* DE** NJ** PA** Q3 *Empirically estimated by Kevin C. Gillen, Ph.D. **Courtesy Federal Housing Finance Agency (FHFA)
5 Philadelphia Regional House Price Indices City v. Suburb v. U.S. Average.: 1980Q1=100 Philadelphia* Phila. Suburbs* U.S. Avg.** *Empirically estimated by Kevin C. Gillen, Ph.D. Note: The suburban index includes all counties in the regional index, except for Philadelphia county.
6 % YoY Change in Average House Prices: Philadelphia County v. Philadelphia Suburbs v. 10-City Composite 25.0% 20.0% 15.0% 10.0% 5.0% 0.0% -5.0% -10.0% -15.0% -20.0% Phila. Suburbs* Philadelphia* 10-City Composite** -25.0% *Empirically estimated by Kevin C. Gillen, Ph.D. **Empirically estimated by Case-Shiller. The 10-City Composite reflects average annual house price changes in ten large US cities, including: Boston Chicago, Denver, Las Vegas, Los Angeles, Miami, New York, San Diego, San Francisco and Washington DC. It does not include Philadelphia.
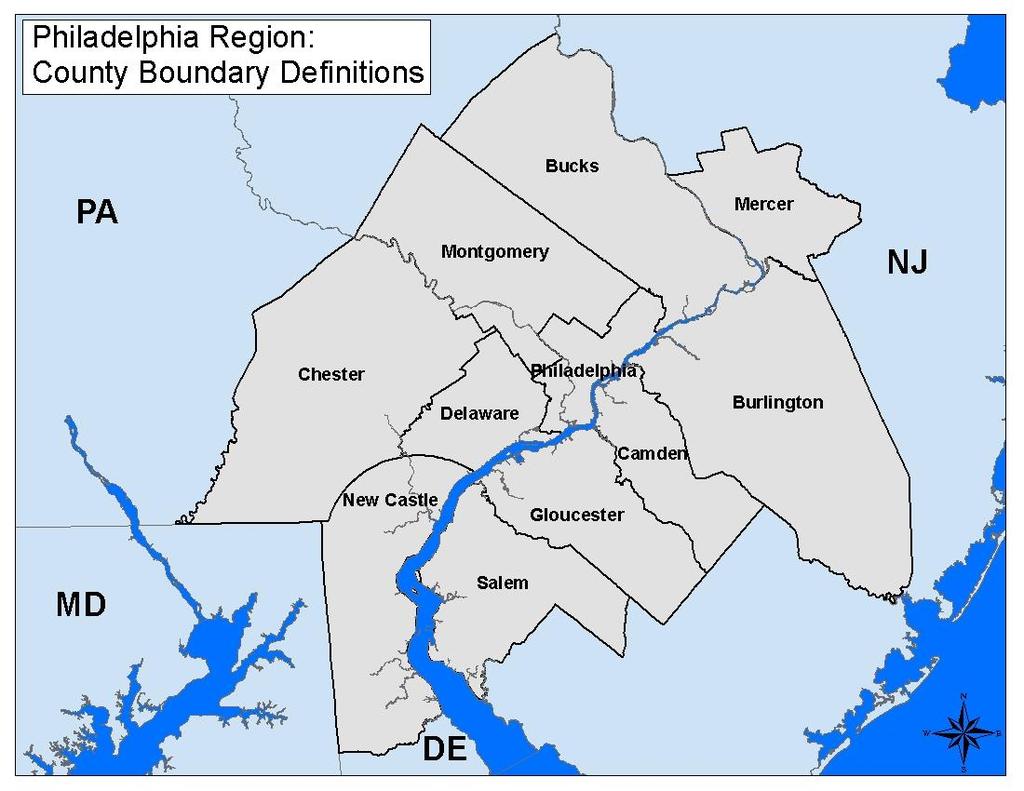
7 Philadelphia Regional House Price Indices 1980-, by County 1980Q1= Philadelphia* Bucks Chester Delaware Montgomery New Castle Mercer Burlington Camden Gloucester Salem Q3 *All indices empirically estimated by Kevin C. Gillen, PhD
8 Total House Price Appreciation Rates by Philadelphia Area Submarket and U.S. Period Philadelphia County* Philadelphia Suburbs* U.S.A.** 39-Year 172.2% 146.6% 147.1% 10-Year 23.6% -3.2% 23.2% 1-Year 0.0% 1.5% 6.3% 1-Quarter 2.1% 1.0% 1.1% *Empirically estimated by Kevin C. Gillen Ph.D. **Source: U.S. Federal Housing Finance Agency (FHFA). These numbers are through Q2 only. MSA = Metropolitan Statistical Area, which is the entire 10-county region.
9 Philadelphia Region House Price Appreciation Rates by County Period Philadelphia Bucks Chester Delaware Montgomery New Castle Mercer Burlington Camden Gloucester Salem 38-Year 172% 168% 162% 142% 155% 140% 163% 128% 122% 135% 102% 10-Year 23.6% 4.2% 6.1% -2.1% 4.4% -3.8% -4.4% -11.7% -16.9% -14.0% -47.4% 1-Year 0.0% 3.6% 1.8% 4.7% 5.3% 4.8% 2.8% 6.2% 4.3% 0.5% -2.5% 1-Quarter 2.1% 0.7% 0.0% -1.1% 2.1% -0.8% -0.4% 5.1% -0.3% -2.8% -3.2% All county-level indices and appreciation rates estimated by Kevin C. Gillen, Ph.D.
10
 rate relative to other counties. Salem: -3.2% Camden: -0.")
11 Q3 House Price Rate of Change by County Montgomery: +2.1% Bucks: +0.7% Philadelphia: +0.2% Mercer: -0.4% Chester: 0.0% Delaware: -1.1% Burlington: +5.1% New Castle: -0.8% Note: Each county is extruded by its average change in house values during Q3 in order to reflect its growth (or depreciation) rate relative to other counties. Salem: -3.2% Camden: -0.3% Gloucester: -2.8%
12 $250,000 Median Regional House Price v. Indexed Regional House Price: $200,000 Median Price Indexed Price* $150,000 $100,000 $50,000 $0 *Empirically estimated by Kevin C. Gillen, Ph.D.
13 Median House Price by County: $400,000 New Castle $350,000 $300,000 $250,000 $200,000 Mercer Burlington Camden Gloucester Salem Bucks Chester Delaware Montgomery $150,000 Philadelphia $100,000 $50,000 $0
14 Median House Price by County, Smoothed*: $400,000 $350,000 $300,000 $250,000 $200,000 New Castle Mercer Burlington Camden Gloucester Salem Bucks Chester Delaware Montgomery Philadelphia $150,000 $100,000 $50,000 $0 *The price data was smoothed by applying a 3-period moving average, in order to eliminate seasonal noise.
15 Number of Regional House Sales per Quarter: ,000 20,000 Q1 Q2 Q3 Q4 Qtly. Average 15,000 10,000 5,
16 Q1 Q2 Q3 Q4 Number of Regional House Sales with Price>=$1m 200 Qtly. Average

17 Philadelphia Region House Sales in Q3 Note: the categories for $price/sqft are based upon the quintiles of its distribution. Hence, exactly 20% of all sales fall into each one of the five categories.

18 Philadelphia County House Sales in Q3 Note: the categories for $price/sqft are based upon the quintiles of its distribution. Hence, exactly 20% of all sales fall into each one of the five categories.

19 Bucks County House Sales in Q3 Note: the categories for $price/sqft are based upon the quintiles of its distribution. Hence, exactly 20% of all sales fall into each one of the five categories.

20 Montgomery County House Sales in Q3 Note: the categories for $price/sqft are based upon the quintiles of its distribution. Hence, exactly 20% of all sales fall into each one of the five categories.

21 Chester County House Sales in Q3 Note: the categories for $price/sqft are based upon the quintiles of its distribution. Hence, exactly 20% of all sales fall into each one of the five categories.

22 Delaware County House Sales in Q3 Note: the categories for $price/sqft are based upon the quintiles of its distribution. Hence, exactly 20% of all sales fall into each one of the five categories.

23 New Castle County House Sales in Q3 Note: the categories for $price/sqft are based upon the quintiles of its distribution. Hence, exactly 20% of all sales fall into each one of the five categories.

24 Mercer County House Sales in Q3 Note: the categories for $price/sqft are based upon the quintiles of its distribution. Hence, exactly 20% of all sales fall into each one of the five categories.

25 Burlington County House Sales in Q3 Note: the categories for $price/sqft are based upon the quintiles of its distribution. Hence, exactly 20% of all sales fall into each one of the five categories.

26 Camden County House Sales in Q3 Note: the categories for $price/sqft are based upon the quintiles of its distribution. Hence, exactly 20% of all sales fall into each one of the five categories.

27 Gloucester County House Sales in Q3 Note: the categories for $price/sqft are based upon the quintiles of its distribution. Hence, exactly 20% of all sales fall into each one of the five categories.

28 Salem County House Sales in Q3 Note: the categories for $price/sqft are based upon the quintiles of its distribution. Hence, exactly 20% of all sales fall into each one of the five categories.

29 +$1 Million Dollar House Sales in Q3
30 # Houses Listed "For Sale" 14,000 12,000 10,000 8,000 6,000 4,000 2,000 Philadelphia Houses Listed For Sale: Inventory v. Sales Rate # Houses Listed For Sale % Absorbed 50.0% 45.0% 40.0% 35.0% 30.0% 25.0% 20.0% 15.0% 10.0% 5.0% %Absorbed=(#Sales/#Listings) %
31 # Homes Listed "For Sale" 40,000 35,000 30,000 25,000 20,000 15,000 Source: TrendMLS Philadelphia Suburb's Houses Listed For Sale: Inventory v. Sales Rate # Houses Listed For Sale % Absorbed 60% 50% 40% 30% 20% %Sold = (#Sales/#Listings) 10,000 5,000 10% 0 0%
32 Average Days-on-Market* for Home Sales 160 DOM-Region DOM-City *DOM is the average "days-on-market": the average number of days it takes for a listed home to sell. In a a market that is evenly balanced between buyers and sellers, days is considered the typical norm (source: Redfin). This number is not available separately for Philadelphia's suburbs, but the regional DOM can be considered more representative of the suburbs. 0
33 Months Supply of Inventory in Philadelphia Months Supply of Inventory measures how many months it would take to completely burn off the existing inventory of homes currently listed for sale, given their current pace of sales. 5-7 months is considered a normal, balanced market. More than 7 months indicates a Buyer's market, and less than 5 months indicates a Seller's market Buyer's Market 6.0 Balanced Market 4.0 Seller's Market
34 Months Supply of Inventory in Philadelphia Suburbs Months Supply of Inventory measures how many months it would take to completely burn off the existing inventory of homes currently listed for sale, given their current pace of sales. 5-7 months is considered a normal, balanced market. More than 7 months indicates a Buyer's market, and less than 5 months indicates a Seller's market. 8.0 Buyer's Market 6.0 Balanced Market Seller's Market

35 Pennsylvania Foreclosure Rates 1 out of every 1,173 homes in Philadelphia is currently in the process of foreclosure, which is down slightly from 1 out of every 1,105 homes in the previous quarter. In the entire Commonwealth, 1 out of every 2,009 homes in Pennsylvania is in the process of foreclosure, which is also down slightly from 1 out of every 1,988 homes in the previous quarter. Source:
36 New Jersey Foreclosure Rates Although South Jersey s foreclosure rate continues to remain the highest in the region, there was some improvement this quarter. Previously, four of the five counties in New Jersey with the highest foreclosure rates were in South Jersey, with an average foreclosure rate of 1 in every 393 homes. Camden and Atlantic Counties are no longer in this grouping, although Burlington County now is. Currently, the average foreclosure rate is 1 in every 389 homes in South Jersey, which is still well above the state s average of 1 in every 753 homes. Source:
37 Delaware Foreclosure Rates Sussex County passed Kent County to take the lead as the Delaware jurisdiction with the highest foreclosure rate this quarter. The foreclosure rate for New Castle County declined significantly in Q3, from 1 in every 691 homes to 1 in every 882. Kent County s foreclosure rate also fell dramatically, from 1 in every 694 homes to 1 in every 1,030. Source: But, Sussex County s foreclosure rate increased substantially, from 1 in every 1,427 homes to 1 in every 881.
38 Philadelphia Region House Price Index: Actual v. Forecast Phila. Region HPI Forecast HPI Zillow.com is currently forecasting the Philadelphia region s house prices to rise an average of 7.03% over the course of the next twelve months. Source:
PHILADELPHIA REGIONAL HOUSE PRICE INDICES
 PHILADELPHIA REGIONAL HOUSE PRICE INDICES September 26, 2018 KEVIN C. GILLEN, Ph.D. Kevin.C.Gillen@Drexel.edu Sponsored By: Disclaimers and Acknowledgments: The Lindy Institute for Urban Innovation at
PHILADELPHIA REGIONAL HOUSE PRICE INDICES
 PHILADELPHIA REGIONAL HOUSE PRICE INDICES August 11, 2015 KEVIN C. GILLEN, Ph.D. Kevin.C.Gillen@Drexel.edu Disclaimers and Acknowledgments: The Lindy Institute for Urban Innovation at Drexel University
PHILADELPHIA REGIONAL HOUSE PRICE INDICES
 PHILADELPHIA REGIONAL HOUSE PRICE INDICES May 6, 2015 KEVIN C. GILLEN, Ph.D. Kevin.C.Gillen@Drexel.edu Disclaimers and Acknowledgments: The Lindy Institute for Urban Innovation at Drexel University provides
PHILADELPHIA REGIONAL HOUSE PRICE INDICES
 PHILADELPHIA REGIONAL HOUSE PRICE INDICES June 17, 2016 KEVIN C. GILLEN, Ph.D. Kevin.C.Gillen@Drexel.edu Disclaimers and Acknowledgments: The Lindy Institute for Urban Innovation at Drexel University provides
PHILADELPHIA HOUSE PRICE INDICES
 PHILADELPHIA HOUSE PRICE INDICES February 13, 2017 KEVIN C. GILLEN, Ph.D. Kevin.C.Gillen@Drexel.edu Disclaimers and Acknowledgments: The Lindy Institute for Urban Innovation at Drexel University provides
PHILADELPHIA HOUSE PRICE INDICES
 PHILADELPHIA HOUSE PRICE INDICES January 15, 2015 KEVIN C. GILLEN, Ph.D. Kevin.C.Gillen@Drexel.edu Disclaimers and Acknowledgments: The Lindy Institute for Urban Innovation at Drexel University provides
PHILADELPHIA HOUSE PRICE INDICES
 PHILADELPHIA HOUSE PRICE INDICES July 20, 2017 KEVIN C. GILLEN, Ph.D. Kevin.C.Gillen@Drexel.edu Disclaimers and Acknowledgments: The Lindy Institute for Urban Innovation at Drexel University provides this
PHILADELPHIA CONDO PRICE INDICES
 PHILADELPHIA CONDO PRICE INDICES February 26, 2018 KEVIN C. GILLEN, Ph.D. Gillen@AllanDomb.com Disclaimers and Acknowledgments: Alland Domb Real Estate supports the production of this report and it free
PHILADELPHIA HOUSE PRICE INDICES
 PHILADELPHIA HOUSE PRICE INDICES April 14, 2014 KEVIN C. GILLEN, Ph.D. gillenk@upenn.edu Disclaimers and Acknowledgments: The Fels Institute of Government at the University of Pennsylvania provides this
Philadelphia Housing s Recovery Becomes More Equitable in Q3 Sales surge citywide; house value appreciation strongest in low-priced neighborhoods.
 Philadelphia Housing s Recovery Becomes More Equitable in Q3 Sales surge citywide; house value appreciation strongest in low-priced neighborhoods. October 13, 2014: After a brisk spring which saw widespread
State of the Philadelphia Housing Market
 State of the Philadelphia Housing Market September 17, 2014 KEVIN C. GILLEN, Ph.D. gillenk@upenn.edu Disclaimers and Acknowledgments: The Fels Institute of Government at the University of Pennsylvania
National Housing Trends
 National Housing Trends 34% America s Choice of Best Long Term Investment 26% 17% 15% 6% Real Estate Stocks / Mutual Funds Gold Savings Accounts / CDs Bonds Gallup 2018 Housing Affordability 197 Index
National Housing Trends
 National Housing Trends 34% America s Choice of Best Long Term Investment 26% 17% 15% 6% Real Estate Stocks / Mutual Funds Gold Savings Accounts / CDs Bonds Gallup 2018 Housing Affordability 197 Index
National Housing Trends
 National Housing Trends 34% America s Choice of Best Long Term Investment 26% 17% 15% 6% Real Estate Stocks / Mutual Funds Gold Savings Accounts / CDs Bonds Gallup 2018 Housing Affordability 197 Index
Dr. Richard Wobbekind Executive Director, Business Research Division and Senior Associate Dean for Academic Programs University of Colorado Boulder
 Dr. Richard Wobbekind Executive Director, Business Research Division and Senior Associate Dean for Academic Programs University of Colorado Boulder Member FDIC VectraBank.com Economic Outlook 2015 Richard
DFW MULTIFAMILY TRENDS & OBSERVATIONS Q2 2017
 DFW MULTIFAMILY TRENDS & OBSERVATIONS Q2 2017 DALLAS / FORT WORTH The Top US Demand Driven Apartment Market DFW MULTIFAMILY STARTS A HISTORY LESSON!!! The challenge boom or bust perception vs recent history
National Housing Trends
 National Housing Trends 34% America s Choice of Best Long Term Investment 26% 17% 15% 6% Real Estate Stocks / Mutual Funds Gold Savings Accounts / CDs Bonds Gallup 2018 Home Sales in thousands 2017 2018P
Economic Update Edward Seiler NH&RA
 Economic Update Edward Seiler NH&RA 2 Annual Real GDP Growth (%) 5.0 4.0 Actual (BEA) Forecast (CBO in red, OMB red + orange) 3.0 2.0 1.0 0.0-1.0 1990 1991 1992 1993 1994 1995 1996 1997 1998 1999 2000
Riverside Rising Economic Outlook for the Region April 2015
 Analysis. Answers Riverside Rising Economic Outlook for the Region April 2015 Beacon Economics, LLC California fact versus fiction Looking back a few years (2009 / 2010) everyone was saying that CA would
Frederick Ross. Real Estate Market Overview. Presented by: Kevin Thomas Senior Vice President. Frederick Ross. Company.
 Frederick Ross Real Estate Market Overview Presented by: Kevin Thomas Senior Vice President Frederick Ross Company January 2003 Business Consumers Source: BEA, Ross Research Housing...Bust or Rust? 2001
THE MOST INFORMATIVE EVENT COVERING REAL ESTATE INVESTMENTS
 THE MOST INFORMATIVE EVENT COVERING REAL ESTATE INVESTMENTS 2014 U.S. Economic, Capital Markets, and Retail Market Overview and Outlook Retail Trends 2014 U.S. Economic Overview and Outlook Total Employment
Introducing the 2015 New Jersey Auto Show
 Introducing the 2015 New Jersey Auto Show NJ Advance Media presents: New Jersey s 1 st Auto Show Set between the Philadelphia and New York DMA s, New Jersey represents one of the most densely populated
U.S. Economic and Apartment Market Overview and Outlook. July 15, 2014
 2014 U.S. Economic and Apartment Market Overview and Outlook July 15, 2014 U.S. Economic Overview U.S. GDP Growth Persistent Despite 1Q Polar Vortex Annualized Quarterly Percent Change 10% 5% 0% -5% -10%
Hotel InduSTRy Overview What Lies Ahead
 Hotel InduSTRy Overview What Lies Ahead Vail R. Brown Vice President, Global Business Development & Marketing www.hotelnewsnow.com Click on Hotel Data Presentations U.S. In Review Demand Growth Strong.
recenter.tamu.edu Dr. James P. Gaines Research Economist Real Estate Center at Texas A&M University
 recenter.tamu.edu Dr. James P. Gaines Research Economist Real Estate Center at Texas A&M University Area Market Reports RECENTER.TAMU.EDU Tierra Grande Economic Review Videos, Audios & Presentations Data,
The Gaming Industry in New Jersey: The Present and the Future
 The Gaming Industry in New Jersey: The Present and the Future Karyn Malinowski Ph.D. March 31, 2011 The New Jersey Equine Industry 2007 : Economic Impact Purposes of this study Economic and land use impact
Ranking Walkable Urbanism in America s Largest Metros
 Ranking Walkable Urbanism in America s Largest Metros The Largest 30 Metros in the United States SHARE OF U.S. POPULATION SHARE OF U.S. GDP 54% 46% 42% 58% LARGEST 30 METROS REST OF U.S. The Old Dichotomy
Cleve Gaddis Gaddis Partners, RE/MAX Center & USA Management
 Cleve Gaddis Gaddis Partners, RE/MAX Center & USA Management (a boutique residential property management company) 10475 Medlock Bridge Road, Suite 119 Johns Creek, GA 30097 www. 770-497-0000 All information
10 County Conference. Richard Wobbekind. Executive Director Business Research Division & Senior Associate Dean Leeds School of Business
 10 County Conference Richard Wobbekind Executive Director Business Research Division & Senior Associate Dean Leeds School of Business Hmm... (http://myfallsemester.blogspot.com) Real GDP Growth Percent
Carol Tomé CFO and Executive Vice President, Corporate Services
 Carol Tomé CFO and Executive Vice President, Corporate Services Financial Overview December 6, 2017 1 Discussion Overview Fiscal 2017 Financial Guidance Our View of the Economy and State of the U.S. Housing
Demographic and Economic Trends in the Tri-State Region
 Demographic and Economic Trends in the Tri-State Region James Gillard FEDERAL RESERVE BANK OF PHILADELPHIA Talk Outline Demographic Trends in the Region Economic Trends in the Region Regional Resources
Metro Atlanta. Cleve s 10-Year Market Projections SF Detached. GoGaddis.com 89,002 83,829 78,958 74,369 70,047 65,976 62,142 58,531 55,129 51,926
 350000 300000 250000 200000 $231,000 $221,760 $228,413 $235,265 $242,323 Metro Atlanta Cleve s 10-Year Market Projections SF Detached $252,016 $262,097 $275,909 $290,450 $305,756 $321,870 Total Single
Lodging Market Update. Valley Hotel and Resort Association April 13, 2016 Presented by: Robert Hayward
 Lodging Market Update Valley Hotel and Resort Association April 13, 2016 Presented by: Robert Hayward United States Lodging Market 63.7% 59.8% 58.9% 59.2% 61.3% 63.1% 63.3% 63.1% 60.3% 55.1% 57.5% 59.9%
Briefing on the State of the State. presented to the. SCAA Schuyler Center for Analysis and Advocacy
 Briefing on the State of the State presented to the SCAA Schuyler Center for Analysis and Advocacy Rae D. Rosen Assistant Vice President Federal Reserve Bank of New York November 16, 2006 Key Points: Economic
Fundamental Certainty
 Fundamental Certainty.or No? a presentation at: R. Mark Woodworth PKF Hospitality Research, LLC May 7, 2013 mark.woodworth@pkfc.com Hotel Horizons Forecasting Model Smith Travel Research Historical rooms
CALIFORNIA STATE UNIVERSITY LONG BEACH. Southern California Regional Economic Forecast
 CALIFORNIA STATE UNIVERSITY LONG BEACH Southern California Regional Economic Forecast Lisa M. Grobar, Ph.D. Director, CSULB Economic Forecast Project Office of Economic Research 2009: A terrible year for
Investing in Real Estate. The smart choice for today s investor
 Investing in Real Estate The smart choice for today s investor Real Estate is preferred over stocks Real estate out performs stocks http://blog.863katy.com/category/national-housing-news/page/2/ Real Estate
The Chamber of Commerce for Greater Philadelphia Economic Outlook Survey Results
 The Chamber of Commerce for Greater Philadelphia Economic Outlook Survey Results January 19, 2018 Elif Sen Senior Economic Analyst FEDERAL RESERVE BANK OF PHILADELPHIA * The views expressed today are my
Education Committee Economic Background and Issue Review
 Education Committee Economic Background and Issue Review Montpelier, Vermont January 22, 2014 Thomas E. Kavet State Economist and Principal Economic Advisor to the Vermont State Legislature Since 1996
APPENDIX A COUNTY-LEVEL HOUSING CHARACTERISTICS IN 2000
 APPENDIX A COUNTY-LEVEL HOUSING CHARACTERISTICS IN 2000 Overview There are 67 counties in Pennsylvania, some of which are urban and others rural. Pennsylvania is home to the major cities of Philadelphia
RSTF Measurements and Status
 RSTF Measurements and Status Items in green text are on or ahead of target. Items in red text need attention. Objective & Measures Status November, 2011 Winter, 3/8/12 Build, Maintain, & Leverage Partnerships
Public Transport and Development: Making It Work
 Public Transport and Development: Making It Work Robert T. Dunphy Urban Land Institute World Bank Transport Forum 2006 March 28, 2006 Transportation Development Disconnect Now Few Then places w/o car Many
Real Estate: Investing for the Future. Sponsored By:
 Real Estate: Investing for the Future Sponsored By: Percent Change, Year Ago 6 5 4 3 2 1 Real GDP Growth United States, 2000 Prices 0 1994 1995 1996 1997 1998 1999 2000 2001 2002 2003 2004 U.S. Employment
2012 Raleigh-Durham Market Forecast Investment Sales. Jeff Glenn CBRE Wednesday, March 21, 2012
 2012 Raleigh-Durham Market Forecast Investment Sales Jeff Glenn CBRE Wednesday, March 21, 2012 What s Wrong with this Picture? TOPICS I. National Perspective II. Raleigh-Durham Spotlight III. A Closer
The Erie Economy: Performance, Opportunities, and Challenges
 The Erie Economy: Performance, Opportunities, and Challenges Eggs n Issues Manufacturer and Business Association December 2015 Dr. Kenneth Louie The Economic Research Institute of Erie Sam and Irene Black
2016 Texas Prosperity Conference The Barnhill Center Brenham, Texas August 26, Dr. James P. Gaines Chief Economist. recenter.tamu.
 2016 Texas Prosperity Conference The Barnhill Center Brenham, Texas August 26, 2016 Dr. James P. Gaines Chief Economist recenter.tamu.edu Housing and People 2 Texas Population 1910-2050 60,000,000 50,000,000
U.S. REITs have rebounded strongly Dow Jones Equity REIT Total Return Index
 U.S. REITs have rebounded strongly Dow Jones Equity REIT Total Return Index Index, 2005 = 100 250 200 150 100 50 0 2005 2006 2007 2008 2009 2010 2011 2012 2013 2014 Sources: Bloomberg, Dow Jones. Affordability
Texas Economic Outlook: Recovery in 2010 Keith Phillips Federal Reserve Bank of Dallas San Antonio Office
 Texas Economic Outlook: Recovery in 2010 Keith Phillips Federal Reserve Bank of Dallas San Antonio Office The views expressed in this presentation are strictly those of the author and do not necessarily
The State of the Commercial Real Estate Industry: Year-End 2010 Office Review & Outlook
 The State of the Commercial Real Estate Industry: Year-End 2010 Office Review & Outlook Copyright 2011 CoStar Realty Information, Inc. No reproduction or distribution without permission. The following
Monthly Indicators - 5.2% % % Activity Overview New Listings Pending Sales. Closed Sales. Days on Market Until Sale. Median Sales Price
 Monthly Indicators 2018 Sales and new listings continue to perform well throughout the state of New York largely due to a booming U.S. economy that has increased listing and purchasing confidence. Housing
International Trade Economic Forecasts An Overview of Orange County and Southern California Exports
 International Trade Economic Forecasts An Overview of Orange County and Southern California Exports Mira Farka Adrian R. Fleissig Institute for Economic and Environmental Studies Orange County / Inland
5 THINGS TO KNOW IN Vail R. Brown, STR
 5 THINGS TO KNOW IN 2014 Vail R. Brown, STR VAIL R. BROWN Vice President of Global Business Development and Marketing for STR. Mrs. Brown is responsible for the overall coordination, functional management
U.S. Property Market Outlook, 2013Q1. Jim Costello, Managing Director CBRE Americas Research Investment Research
 U.S. Property Market Outlook, 2013Q1 Jim Costello, Managing Director CBRE Americas Research Investment Research CBRE Page 2 Outlook for the Real Side of the Economy Operationally, what do Research Teams
2014 Economic Forecast: Boulder & Beyond. Keynote Presentation
 2014 Economic Forecast: Boulder & Beyond Keynote Presentation Business Research Division Richard Wobbekind Executive Director Business Research Division & Senior Associate Dean Leeds School of Business
2009 California & Bay Area Real Estate Market Outlook
 2009 California & Bay Area Real Estate Market Outlook November 24, 2008 Fairmont Hotel Leslie Appleton-Young C.A.R. Vice President and Chief Economist California Real Estate Market: 2008 California s Housing
Beyond Bullet Points: Statistics, Trends and Analysis
 Beyond Bullet Points: Statistics, Trends and Analysis Vail R. Brown VP, Global Business Development & Marketing Vail@str.com @vail_str 5 THINGS TO KNOW www.hotelnewsnow.com Click on Data Presentations
Annual Report on the Charlotte Region Housing Market RESIDENTIAL REAL ESTATE ACTIVITY FROM THE CHARLOTTE REGIONAL REALTOR ASSOCIATION
 Annual Report on the Charlotte Region Housing Market RESIDENTIAL REAL ESTATE ACTIVITY FROM THE CHARLOTTE REGIONAL REALTOR ASSOCIATION Annual Report on the Charlotte Region Housing Market RESIDENTIAL REAL
US LODGING INDUSTRY OVERVIEW
 US LODGING INDUSTRY OVERVIEW Mark V. Lomanno President SMITH TRAVEL RESEARCH Presentation Outline US Lodging Industry Macro Trends Daily Data Chain Scales Resort Performance Construction Pipeline Forecast
Big Changes, Unknown Impacts
 Big Changes, Unknown Impacts Boulder Economic Forecast Place cover image here Richard Wobbekind Senior Economist and Associate Dean for Business and Government Relations January 17, 2018 Real GDP Growth
Percent of Brokerages by Size
 Percent of Brokerages by Size 80% 70% 60% 58.4% 50% 40% 30% 28.7% 20% 10% 0% #: +23.6% -7.3% +9.9% 0.1% 0.1% 0.2% 0.5% 0.6% 1.8% 2.6% 1,000+ 500-999 300-499 100-299 50-99 20-49 10-19 5-9 2-4 Single Brokers
What s Ahead for The Colorado Economy?
 What s Ahead for The Colorado Economy? Colorado Counties Inc. Place cover image here Richard Wobbekind Senior Economist and Associate Dean for Business and Government Relations November 28, 2017 Real GDP
THE NEW JERSEY EQUINE INDUSTRY Economic Impact
 THE NEW JERSEY EQUINE INDUSTRY 2007 Economic Impact The Rutgers Published Equine by Science Rutgers Center Equine Science Center New Jersey Equine Industry, 2007 Introduction There is a reason the state
National and Virginia Economic Outlook Professor Robert M. McNab Dragas Center for Economic Analysis and Policy Strome College of Business
 National and Virginia Economic Outlook Professor Robert M. McNab Dragas Center for Economic Analysis and Policy Strome College of Business October 24, 2018 The forecasts and commentary do not constitute
2014 MAJOR LEAGUE LEAGUE BASEBALL ATTENDANCE NOTES
 2014 MAJOR LEAGUE LEAGUE BASEBALL ATTENDANCE NOTES This is a brief summary of 2014 Major League Baseball attendance. It includes league and team attendance in the pages that follow the notes below. The
State of the City of Carpinteria
 April 21, 2017 Mark Schniepp Director State of the City of Carpinteria jobs 1,000 Employment in Information / Carpinteria Valley 2006 -- 2016 800 600 400 200 0 2006 2008 2010 2012 2014 2016 ConstructiveDIVE.com
Economic Recovery Has Stalled, Recession in the Cards by Year End
 Economic Indicators to Watch for Signs of Recovery Economic Recovery Has Stalled, Recession in the Cards by Year End New York, NY Monday, June 27, 2011 Richard Yamarone Author of The Trader s Guide to
Real Estate and Economic Outlook
 Real Estate and Economic Outlook Lawrence Yun, Ph.D. Chief Economist NATIONAL ASSOCIATION OF REALTORS Presentation at Inforum Outlook Conference University of Maryland College Park, MD December 12, 2013
Charting a Path to Lift Off? Understanding the Shifting Economic Winds
 Charting a Path to Lift Off? Understanding the Shifting Economic Winds Thomas F. Siems, Ph.D. Assistant Vice President and Senior Economist Federal Reserve Bank of Dallas Government Finance Officers Arlington,
A Housing Correction or a Housing Recession?
 A Housing Correction or a Housing Recession? Professor William Wheaton Department of Economics Center for Real Estate MIT January, 2007 MIT, IAP Topics: 1 Historic Housing Prices: relation to income. Cycles
May 2018 MLS Statistical Report
 Jan Feb Mar Apr May Jun Jul Aug Sep Oct Nov Dec January February March April May June July August Septem October Novem Decemb Days on Market The graph on the right illustrates the drastic decline in the
PlaySafe and Live Well!
 PlaySafe and Live Well! Welcome to PlaySafe, LLC s informational column. Every month we will work hard to provide you with up-to-date information on topics related to parks, recreation, health, wellness,
MBA Economic and Mortgage Finance Outlook
 MBA Economic and Mortgage Finance Outlook MBA of Alabama Annual Conference June 7, 2017 Presented by Lynn Fisher Mortgage Bankers Association 1 Summary of the MBA Outlook 2016 2017 2018 2019 GDP Growth
Charlotte Region Monthly Indicators
 Charlotte Region Monthly Indicators A RESEARCH TOOL PROVIDED BY CHARLOTTE REGIONAL REALTOR ASSOCIATION FOR MORE INFORMATION CONTACT A REALTOR 2018 The booming U.S. economy continues to prop up home sales
Southwest Ohio Regional Economy in Context. Richard Stock, PhD. Business Research Group
 Southwest Ohio Regional Economy in Context Richard Stock, PhD. Business Research Group State of the Metro Area (in January Each Year) Total Employment has slowly increased in the last three years after
Bike Sharing as Active Transportation
 Bike Sharing as Active Transportation February 28, 2013 Nicole Nagaya, P.E. Active Living Research Conference Image credit: Flickr User nycstreets What We Do What We Do Strong & Fearless
Ranking Walkable Urbanism in America s Largest Metros. By Christopher B. Leinberger & Patrick Lynch
 Ranking Walkable Urbanism in America s Largest Metros By Christopher B. Leinberger & Patrick Lynch The George Washington University School of Business 1 The Center for Real Estate and Urban Analysis Table
NYU International Hospitality Industry Investment Conference. Amanda W. Hite STR President & COO
 NYU International Hospitality Industry Investment Conference Amanda W. Hite STR President & COO Supply Middle East Leads in Development 6 5.9 4 3.8 2.5 2 1.0 1.2 1.1 0 Central- South America Europe Middle
the 54th Annual Conference of the Association of Collegiate School of Planning (ACSP) in Philadelphia, Pennsylvania November 2 nd, 2014
 in Philadelphia, Pennsylvania November 2 nd, 2014") the 54th Annual Conference of the Association of Collegiate School of Planning (ACSP) in Philadelphia, Pennsylvania November 2 nd, 2014 Hiroyuki Iseki, Ph.D. Assistant Professor Urban Studies and Planning
the 54th Annual Conference of the Association of Collegiate School of Planning (ACSP) in Philadelphia, Pennsylvania November 2 nd, 2014 Hiroyuki Iseki, Ph.D. Assistant Professor Urban Studies and Planning
2007 Real Estate Market Forecast. October 18, 2006 Leslie Appleton-Young C.A.R. Vice President and Chief Economist
 2007 Real Estate Market Forecast October 18, 2006 Leslie Appleton-Young C.A.R. Vice President and Chief Economist Overview California Real Estate Market What happened in 2006? Tipping Points/Market Psychology
Texas Housing Markets: Metropolitan vs. Border Communities. September 22, 2014
 Texas Housing Markets: Metropolitan vs. Border Communities Luis Bernardo Torres Ruiz, Ph.D. Research Economist El Paso Branch Dallas Federal Rio Grande Economic Association September 22, 2014 Contents
Will 2016 Be the Last Hurrah for Commercial Real Estate? Presented By: John Chang First Vice-President Marcus & Millichap Research Services
 Will 2016 Be the Last Hurrah for Commercial Real Estate? Presented By: John Chang First Vice-President Marcus & Millichap Research Services Rising Uncertainty Creating Headwinds for Commercial Real Estate
Preview. Tables in your paper Mass Transit as alternative to auto California s problems in urban transportation
 Preview Tables in your paper Mass Transit as alternative to auto California s problems in urban transportation Integrating tables in your writing Commuting in Urban Areas Last time auto and congestion
Monthly Indicators - 6.4% + 8.0% - 5.3% Market Overview New Listings Pending Sales. Closed Sales. Days on Market Until Sale. Median Sales Price
 Monthly Indicators 2018 The booming U.S. economy continues to prop up home sales and new listings in much of the nation, although housing affordability remains a concern. Historically, housing is still
Charlotte Region Monthly Indicators
 Charlotte Region Monthly Indicators A RESEARCH TOOL PROVIDED BY CHARLOTTE REGIONAL REALTOR ASSOCIATION FOR MORE INFORMATION CONTACT A REALTOR 2018 Some economy observers are pointing to 2018 as the final
What HQ2 Finalist Cities Think about Amazon Moving to Town. Table of Contents
 What HQ2 Finalist Cities Think about Amazon Moving to Town Survey of Adult Residents in U.S. Finalist MSAs In Partnership with the Business Journals March 30 th April 3 rd, 2018 Table of Contents SURVEY
Economic Update and Prospects for 2019 Professor Robert M. McNab Dragas Center for Economic Analysis and Policy Strome College of Business
 Economic Update and Prospects for 2019 Professor Robert M. McNab Dragas Center for Economic Analysis and Policy Strome College of Business January 3, 2019 The forecasts and commentary do not constitute
August 2016: Aspen Snowmass Real Estate Market Snapshot RELEASED 9/9/2016 ON OR NEAR THE 1ST MONDAY EACH MONTH
 August 2016: Aspen Snowmass Real Estate Market Snapshot RELEASED 9/9/2016 ON OR NEAR THE 1ST MONDAY EACH MONTH v5.0 The Estin Report publishes a monthly Aspen real estate market Snapshot on or near the
Residential Market Report
 MARKET Q1/08 REPORT Residential Rhode Island s Quarterly STATEWIDE The Rhode Island housing market in the first quarter of 2008 showed declines in both the median price of single family homes as well as
THE BLUE SKY REPORT A KERRIGAN QUARTERLY. Third Quarter 2018 December 2018
 THE BLUE SKY REPORT A KERRIGAN QUARTERLY Third Quarter 2018 December 2018 Contact Erin Kerrigan: (949) 439-6768 erin@kerriganadvisors.com Contact Ryan Kerrigan: (949) 728-8849 ryan@kerriganadvisors.com
Section 1: Introduction
 Date: October 18, 2016 Regarding: Vehicle Thefts with Keys in the United States - (Public Dissemination) Prepared By: Olivia Ortiz, Strategic Analyst and Josh Cahill, Strategic Analyst Section 1: Introduction
Lesson 2 Pre-Visit Big Business of the Big Leagues
 Lesson 2 Pre-Visit Big Business of the Big Leagues Objective: Students will be able to: Identify several sources of revenue for Major League Baseball teams. Use math skills to estimate team revenue from
ABA Commercial Real Estate Lending Committee
 ABA Commercial Real Estate Lending Committee Commercial Real Estate Outlook The Good, the Bad and the Ugly January 16, 2019 Rob Strand Senior Economist American Bankers Association aba.com 1-800-BANKERS
MAINTAINING MOMENTUM:
 MAINTAINING MOMENTUM: 2018 National Economic Update September 12, 2018 noun mo men tum \ mō-ˈmen-təm, mə- \ 1 b : the strength or force that allows something to continue or to grow stronger or faster as
UNITED 2026 BID: TRAINING SITE AGREEMENT. Park Board Committee Meeting Monday, February 19, 2018
 UNITED 2026 BID: TRAINING SITE AGREEMENT Park Board Committee Meeting Monday, February 19, 2018 Purpose Present and review Vancouver s participation in the United 2026 bid process Seek Board approval to
The 2015 Mid-Year Economic Update
 Download slides here at www.mdm.com/slides or email info@mdm.com The 2015 Mid-Year Economic Update Brian Lewandowski and Thomas P. Gale June 18, 2015 Produced by: Sponsored by: Download slides here at
Golf Participation in the U.S Edition
 Golf Participation in the U.S. 2016 Edition Golf Participation in the U.S. 2016 Edition Published by National Golf Foundation 501 N Highway A1A Jupiter, Florida 33477 (561) 744-6006 www.ngf.org April 2016
Economic Outlook: fear over fundamentals
 ECONOMICS I RESEARCH Economic Outlook: fear over fundamentals April 2016 Craig Wright (SVP & Chief Economist) (416) 974-7457 craig.wright@rbc.com Volatility index Market volatility index, (VIX) 90 80 70
ECONOMIC CALENDAR 2010
 J.P. Morgan ECONOMIC CALENDAR 2010 Release dates for US economic indicators and Treasury auctions J.P. Morgan ECONOMIC CALENDAR 2010 Release dates for US economic indicators and Treasury auctions This
Dr. James P. Gaines Research Economist. recenter.tamu.edu
 Dr. James P. Gaines Research Economist recenter.tamu.edu National Economic Recovery still Going 2 National Issues Expected GDP growth still modest: 2015 2.5%; personal consumption 2.5% Inflation not worrisome:
The U.S. Economy How Serious A Downturn? Nigel Gault Group Managing Director North American Macroeconomic Services
 The U.S. Economy How Serious A Downturn? Nigel Gault Group Managing Director North American Macroeconomic Services Growth Is Cooling; But a Soft Landing Is Likely (Real GDP, annualized rate of growth)