Spring Time for Housing
|
|
|
- Mervin Black
- 5 years ago
- Views:
Transcription

1 Spring Time for Housing Arizona State University December 2 nd, 2015 Presented By: Elliott D. Pollack CEO,

2 IN PHOENIX 1

3 2

4 The World has Changed Pre-2007 Post
5 Employment Growth From Bottom of Recession (Start of Recovery) Greater Phoenix Employment, Seasonally Adjusted Source: BLS Recession Emp. Trough 61 mos. Later % Growth Dec-74 Jan % Sep-82 Oct % 1991 Aug-91 Sep % 2001 Dec-01 Jan % Sep-10 Oct % 4
6 Population Growth after Recessions Greater Phoenix Source: ADOA Start of Recovery Population Population 9 years later % Growth ,377,700 1,606, % ,658,988 2,013, % ,301,825 2,784, % ,360,062 3,968, % ,087,390 4,404, % 5
7 Phoenix-Mesa-Scottsdale Employment Growth (Ranking among all metro areas greater than 1,000,000) Source: Arizona State University, U.S. Bureau of Labor Statistics Year Rank # MSA s Year Rank # MSA s * *YTD October 2015 vs. YTD October
8 Greater Phoenix Greater Phoenix has had a significant recovery in both absolute and relative terms. It is only when we compare ourselves to previous Arizona recoveries that we look so bad. 7
9 12.0% Greater Phoenix Unemployment Rate * Source: Bureau of Economic Analysis Recession Periods 10.0% 8.0% 6.0% 4.0% 2.0% *Data through September
10 Since the Recovery Greater Phoenix employment has increased 13.8%. By Comparison, for the first 61 months of the previous two recoveries, Greater Phoenix grew 32.3% and 20.4%, respectively. Source: Bureau of Labor Statistics Data through October
11 Since the Recovery the Greater Phoenix population has increased by 5.2%. By Comparison, for the first 5 years of the previous two recoveries, Greater Phoenix population increased by 21.0% and 18.1%, respectively. Source: Arizona Department of Administration 10
")
12 Less need for migrants (international and national) chasing jobs. 12

13 Fewer people mean fewer houses & less commercial construction. 13

14 The World has Changed Pre-2007 Post
15 MEDIOCRE Unexceptional Run-of-the-mill Second rate Commonplace Middling Sub-par 15

16 The World has Changed Pre-2007 Post
17 # Permits (000) 125% 105% 85% 65% 45% 25% 5% -15% -35% -55% -75% 27.3% 101.1% 29.5% -34.7% -39.0% Single Family Permits Greater Phoenix * Source: RL Brown & Elliott D. Pollack & company 9.2% -7.3% 67.3% % 24.7% 2.8% -11.6% -15.9% -20.5% -22.7% % 29.1% 23.2% 21.1% 4.1% 7.1% 13.5% 3.7% -1.9%-1.7% 27.6% 22.6% 4.2% 7.6% 4.4% % -26.5% -36.2% -59.6% -0.4% -15.0% % 10.2% 46.0% -15.2% % 18.0% *2015, 2016 and 2017 forecast is from as of November
18 18% Multi-Family Year-End Vacancy Rates Greater Phoenix County * Source: ASU Realty Studies / Berkadia** Recession Periods 15% 12% 9% 6% 3% 0% 6.2% 4.1% 3.3% 2.8% 3.9% 6.1% 6.1% 4.4% 7.7% 6.9% % 10.1% 14.1% 13.0% 13.4% 10.0% 9.5% 8.0% % 3.8%4.5%4.5%4.8% 5.1% 5.9% 6.8% 8.2% 9.4% 9.6% 7.8% 7.9% 6.8% 10.2% % 13.4% 10.8% 7.5% 6.6% 6.3% 6.0% 6.3% 6.2%6.1% *2015, 2016 & 2017 are forecasts from Elliott D. Pollack & Co. **Data prior to 2005 is from ASU 18
19 4,500,000 Apartments Births 26 year lag Source: U.S. Census Bureau ,000,000 3,500,000 3,000,000 2,500,000 Baby Boomers Gen X Millennials 2,000,000 19

20 The World has Changed Pre-2007 Post

21 JUST ALMOST DO IT. 21

22 What has changed? 22
23 Why has growth been slow? (1) Recovery from the financial crisis of 2007/2008 (2) Lack of accelerator to income- --Women entering workforce in 70s and 80s --Absence of a quadrupling stock market in the 90s --People not using their house as a credit card ( 96-05) (3) Underlying demographics (4) Increased regulation and high corporate taxes 23
24 Labor Force Participation Rate (16 years and over) * Source: Bureau of Labor Statistics Recession Periods 68.0% 66.0% 64.0% 62.0% 60.0% 58.0% 56.0% *Seasonally adjusted data through October
25 S&P * Source: Standard & Poor's (S&P); Moody's Analytics (ECCA) Converted Recession Periods 2,200 2,000 1,800 1,600 1,400 1,200 1, *Data through November 23,
26 Mortgage Equity Withdrawal as a share of Disposable Income U.S.: * Source: Bureau of Economic Analysis Recession Periods 8.0% 6.0% 4.0% 2.0% 0.0% -2.0% -4.0% -6.0% -8.0% -10.0% *Data through second quarter


27 (000s) 3,500 U.S. Population by Age Net Change Source: U.S. Census Bureau 3,286 2, ,316 1,014 1,591 1,967 2,016 1, , ,799-2,500 27
28 Movers (in millions) Distribution of Movers in U.S. by Type* Source: U.S. Census Bureau Diffeferent county, same state Different county, different state From Abroad *Excludes movers in the same county 28
29 For the U.S. as a Whole Total Movers down 25.6% Movers from abroad down (26%) Movers from other states down (34%) Movers from other counties in the state, down (18%) Source: U.S. Census Bureau Note: Does not include in-state movers 29
30 Arizona Capture Rate (from abroad and between states) = 3.7% = 3.3% Note: Does not include in-state movers 30
31 SB

32 There is Good News. 32

33 Single-family 33

34 34
35 Greater Phoenix Single Family Permits Source: R.L. Brown Year Permits % chg , % , % , % , % , % , % , % , % , % , % , % 2015* 13, % *Data through October
36 6% Greater Phoenix Population Annual Percent Change * Source: AZ Dept. of Administration, EDPCo Recession Periods 4% 2% 0% 2.7% 2.1% % 4.2% 4.7% 3.9% 3.3% 3.1% 3.0% 4.3% 5.1% 4.4% 4.2% 2.9% 2.8% 2.5% 2.4% 1.3% % 4.3% 4.3% 4.3% 4.2%4.2% 3.5% 3.8% 3.6% 2.6% 2.7% 3.1% 3.8% 3.7% Pre-2008 Avg. 3.5% 3.0% 1.9% % 0.6% 0.3% 1.8% 1.5%1.5% 1.6% 1.1% *2015 & 2016 forecasts from Elliott D. Pollack & Co. as of July
37 Arizona Domestic Migration Ranking Source: U.S. Census Bureau
38 Arizona International Migration Ranking Source: U.S. Census Bureau SB 1070 passed in

39 The World has Changed Pre-2007 Post a
40 What is keeping potential buyers out of the housing market? Parade of horribles: (1) Negative Equity (2) Foreclosures (3) Short Sales (4) Millennials (5) Student Loans (6) FHA Loan Limit (7) Tougher Loan Standards 39
41 45.0% 40.0% U.S. and Greater Phoenix Negative Equity Share Source: CoreLogic 41.9% 35.0% 30.0% 25.0% 20.0% 15.0% 10.0% 24.9% 22.5% 22.3% 14.9% 25.6% 10.9% 19.5% 8.7% 15.4% 5.0% 0.0% 2010 Q Q Q Q Q Q2 U.S. Greater Phoenix Greater Phoenix data prior to 2012 Q2 not available. 40
42 120, , ,000 90,000 80,000 70,000 60,000 50,000 40,000 30,000 20,000 10,000 U.S. Foreclosure Lag Source: CoreLogic Sept Recession Periods Completed Foreclosures 7-Year Lag (Fannie/Freddie) 41
43 Greater Phoenix Short Sales January 2011 September 2015 Source: ASU 2,500 2,000 1,936 1,500 1,

44 Millennials/Living at Home There are approximately 1.5 million more year olds living with their parents than

45 When you delay marriage you delay children. That delays housing. That delays demand for housing stuff. 44

46 Total Student Loan Debt Has Tripled! 45
47 Total Student Loan Balances Billions of Dollars Source: Federal Reserve Bank of New York Consumer Credit Panel / Equifax Year TOTAL 2004 $ $ $ $ $ $ $ $ $ $1, $1, a
48 Expenses that Delayed Saving for a Down Payment or Home Purchase By Age Source: National Association of Realtors 2014 All Buyers 34 and younger 34 to to to to 89 Student Loans 46% 54% 23% 11% 7% 1% Credit Card Debt 50% 35% 41% 37% 21% 12% Car Loan 38% 30% 25% 16% 9% 5% Child Care Expenses 17% 10% 19% 5% 4% 2% Health Care Costs 12% 7% 11% 14% 13% 15% Other 8% 15% 24% 42% 58% 68% 46
49 740 Average Borrowers Credit Scores on All New FHA Loans * Source: U.S. Dept. of HUD/FHA Recession Periods *Data through third quarter a
50 Average Borrowers Credit Scores on All New Fannie Mae Loans * Source: Fannie Mae Recession Periods *Data through third quarter b
51 Year Single Family Permits Blue Chip Forecast Source: R.L. Brown, Greater Phoenix Blue Chip Permits % Change , % 2015* 15,880 46% 2016* 19,300 22% 2017* 22,900 19% *2015, 2016 & 2017 are forecasts from third quarter Greater Phoenix Blue Chip. 48
52 49

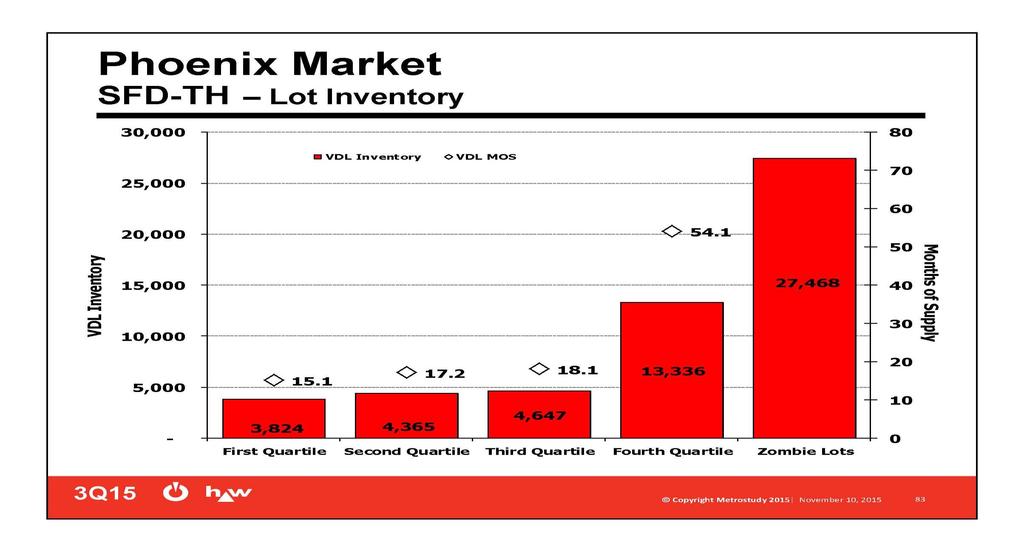
53 Lot Inventory 50
54 (000s) Greater Phoenix Construction Employment Annual * Source: University of Arizona Recession Periods Peak 179,900 jobs 84,000 Jobs Gap Current 95,300 jobs Trough 82,400 jobs *Data from U of A Q forecast 51


55 Arizona Population: Foreign-Born, Non-Citizen Source: American Community Survey Recession Periods 600, % 550, % -8.5% SB 1070 passed in , % 3.6% -6.4% 450, % 400, % -13.8% -2.4% -1.9% 2.3% -1.9% 350, ,000 52


56 Positions Builders are Having Trouble Filling Carpenters Framers 68.0% 67.0% Masons 53.0% Electricians Painters Plumbers Roofers 46.0% 46.0% 45.0% 40.0% Source: National Association of Home Builders, June

57 Who do we hire if there is a construction labor shortage? 54


58 The World has Changed Pre-2007 Post


59 Millions U.S. Population by Age Ages Source: U.S. Census Bureau, Population as of July 1, Largest Age Cohort Average Age of First-time Homebuyer Average Age of Repeat Homebuyer

60 Multi-Family 57
61 4,500,000 Apartments Births 26 year lag Source: U.S. Census Bureau ,000,000 3,500,000 3,000,000 2,500,000 Baby Boomers Gen X Millennials 2,000,000 58
62 4,500,000 Retirement Home Cycle Births 65 year lag Source: U.S. Census Bureau 4,000,000 3,500, ,000,000 2,500,000 Baby Boomers Gen X Millennials 2,000,000 59
63 18% Multi-Family Year-End Vacancy Rates Greater Phoenix County * Source: ASU Realty Studies / Berkadia** Recession Periods 15% 12% 9% 6% 3% 0% 6.2% 4.1% 3.3% 2.8% 3.9% 6.1% 6.1% 4.4% 7.7% 6.9% % 10.1% 14.1% 13.0% 13.4% 10.0% 9.5% 8.0% % 3.8%4.5%4.5%4.8% 5.1% 5.9% 6.8% 8.2% 9.4% 9.6% 7.8% 7.9% 6.8% 10.2% % 13.4% 10.8% 7.5% 6.6% 6.3% 6.0% 6.3% 6.2%6.1% *2015, 2016 & 2017 are forecasts from Elliott D. Pollack & Co. **Data prior to 2005 is from ASU 60
64 Multi-Family Housing Market Source: PMHS and Berkadia Absorption Completions 2007 (3,121) 3, (4,466) 5, ,100 6, , , , ,660 2, ,750 4,970 61
65 62
66 Multi-Family Pipeline Source: CB Richard Ellis Year Potential New Supply , , ,159 63

67 Construction still lags (except for apartment construction) 64

68 65

69 OFFICE 66
70 Office Space Year-End Vacancy Rates Greater Phoenix * Source: CBRE Recession Periods 35% 30% 25% 20% 15% 10% 5% 0% 26.7% 26.4% 26.7% 25.4% 24.0% 22.8% 22.7% 18.8% 14.8% 11.7% 9.5% 9.9% 9.5% 9.2% 10.0% % 18.3% 16.4% 16.0% 12.6% 11.1% 13.9% 19.1% 24.5% 26.2% 25.5% 23.9% 22.4% 21.1% 18.7% 17.5% 16.9% *2015, 2016 & 2017 are forecasts from Greater Phoenix Blue Chip. 67
71 Greater Phoenix Office Market* Source: CBRE Year Absorption (sf) Chg in Inventory (sf) ,119,293 7, ,245,888 **2,320, ,500,704 4,905, (603,112) 3,402, (667,329) 1,798, ,670 2,011, ,857,433 3,144, ,020, , ,721,366 (35,566) ,969,716 1,107, *** 2,232,024 1,832,319 *Only includes multi-tenant space greater than 10,000 SF ** A number of buildings in downtown and mid-town are being converted to office condos. ***Data through third quarter

72 INDUSTRIAL 69
73 20% Industrial Space Vacancy Rates Greater Phoenix * Source: CBRE Recession Periods 15% 10% 5% 16.4% 15.2% 14.8% 14.6% 13.2% 14.0% 13.6% 12.8% 12.8% 11.1% 10.8% 9.4% 9.7% 8.4% 7.4% 8.1% 6.6% 7.0% 7.1% 7.4% 5.7% 10.3% 9.8% 9.7% 8.5% 5.6% 6.7% 8.4% 16.1% 12.5% 14.7% 12.4% 11.4% 10.9% 11.0%11.1% 10.1% 9.4% % * 2015, 2016 & 2017 are forecasts from the Greater Phoenix Blue Chip 70
74 Greater Phoenix Industrial Market Source: CBRE Year Absorption (sf) Chg in Inventory (sf) ,349,129 7,072, ,032,175 7,829, ,359,835 13,914, ,838 13,467, (4,649,352) 4,753, ,455,097 2,451, ,753,111 2,842, ,405,168 3,358, ,783,982 8,902, ,214,680 6,791, * 5,639,447 3,329,149 *Data through third quarter

75 RETAIL 72
76 Greater Phoenix Retail Market Source: CBRE Year Absorption (sf) Chg in Inventory (sf) ,708,155 6,248, ,244,597 4,582, ,424,362 11,104, ,395,986 6,229, (1,117,100) 4,405, (75,352) 902, (152,647) 24, ,879, , ,579,202 (325,959) ,487,313 (49,225) 2015* 979,282 30,539 *Data through third quarter
77 Retail Space Vacancy Rates Greater Phoenix * Source: CBRE** Recession Periods 20% 15% 10% 5% 8.9% 6.6% 14.2% 13.1% 13.5% 11.8% 12.7% 10.0% 11.1% 9.8% 8.7% 7.9% 7.5% 7.4% 7.5% 6.3% 5.5% 5.3%6.6%7.3% 6.1% 6.2% 5.3%5.1% 12.2%12.2% 11.4% 11.0% 10.2% 9.6% 9.3% 8.7% 8.3% % * 2015, 2016 & 2017 are forecasts from the Greater Phoenix Blue Chip ** Data prior to 1992 is from Grubb & Ellis 74

78 Good News Outlook for real estate is improving. 75


79 The World has Changed Pre-2007 Post
80 For a quick analysis of important economic data released each week, subscribe to the Monday Morning Quarterback (Click on Subscribe to MMQ) 77
Kevin Thorpe Financial Economist & Principal Cassidy Turley
 Kevin Thorpe Financial Economist & Principal Cassidy Turley Economic & Commercial Real Estate Outlook Kevin Thorpe, Chief Economist 2012 Another Year Of Modest Improvement 2006Q1 2006Q3 2007Q1 2007Q3 2008Q1
U.S. Economic and Apartment Market Overview and Outlook. July 15, 2014
 2014 U.S. Economic and Apartment Market Overview and Outlook July 15, 2014 U.S. Economic Overview U.S. GDP Growth Persistent Despite 1Q Polar Vortex Annualized Quarterly Percent Change 10% 5% 0% -5% -10%
Houston and Tomball Economic and. Housing Outlook. recenter.tamu.edu. Dr. James P. Gaines Research Economist
 Houston and Tomball Economic and Dr. James P. Gaines Research Economist Housing Outlook recenter.tamu.edu THE CURRENT SITUATION The Future Just Ain t What It Used to Be! Yogi Berra National Economic Recovery
WHERE ARE ARIZONA DEMOGRAPHICS TAKING US? HOW GROWING SLOWER, OLDER AND MORE DIVERSE AFFECTS REAL ESTATE
 WHERE ARE ARIZONA DEMOGRAPHICS TAKING US? HOW GROWING SLOWER, OLDER AND MORE DIVERSE AFFECTS REAL ESTATE March 2017 Tom Rex Office of the University Economist and Center for Competitiveness and Prosperity
Economic and Real Estate Outlook
 Economic and Real Estate Outlook By Lawrence Yun, Ph.D. Chief Economist, National Association of REALTORS Presentation at Charlottesville Area Association of REALTORS October 13, 2016 1990 1991 1992 1993
U.S. Overview. Gathering Steam? Tuesday, October 1, 2013
 U.S. Overview Gathering Steam? Tuesday, October 1, 2013 Uneven global economic recovery Annual real GDP growth projections (%) Projections 2013 2014 World 3.1 3.1 3.8 United States 2.2 1.7 2.7 Euro Area
President and Chief Executive Officer Federal Reserve Bank of New York Washington and Lee University H. Parker Willis Lecture in Political Economics
 The U.S. Economic Outlook Chartspresented by WilliamC Dudley Charts presented by William C. Dudley President and Chief Executive Officer Federal Reserve Bank of New York Washington and Lee University H.
Big Changes, Unknown Impacts
 Big Changes, Unknown Impacts Boulder Economic Forecast Place cover image here Richard Wobbekind Senior Economist and Associate Dean for Business and Government Relations January 17, 2018 Real GDP Growth
recenter.tamu.edu Dr. James P. Gaines Research Economist Real Estate Center at Texas A&M University
 recenter.tamu.edu Dr. James P. Gaines Research Economist Real Estate Center at Texas A&M University Area Market Reports RECENTER.TAMU.EDU Tierra Grande Economic Review Videos, Audios & Presentations Data,
Housing Market Update Greater Moncton. Housing market intelligence you can count on
 Housing Market Update Greater Moncton Housing market intelligence you can count on Housing Market Drivers Multi-Residential/Rental Market New Home Market Single Family Homes Resale Market 2013/2014 Outlook
Economic Update and Prospects for 2019 Professor Robert M. McNab Dragas Center for Economic Analysis and Policy Strome College of Business
 Economic Update and Prospects for 2019 Professor Robert M. McNab Dragas Center for Economic Analysis and Policy Strome College of Business January 3, 2019 The forecasts and commentary do not constitute
RISI Housing Report An Update on the Housing Market
 RISI Housing Report An Update on the Housing Market North American Conference October 2018 Jennifer Coskren Senior Economist Agenda Current housing demand and demographic conditions Supply and impediments
10 County Conference. Richard Wobbekind. Executive Director Business Research Division & Senior Associate Dean Leeds School of Business
 10 County Conference Richard Wobbekind Executive Director Business Research Division & Senior Associate Dean Leeds School of Business Hmm... (http://myfallsemester.blogspot.com) Real GDP Growth Percent
Economic Update and Outlook
 Economic Update and Outlook NAIOP Vancouver Chapter November 15, 2012 Helmut Pastrick Chief Economist Central 1 Credit Union Outline: Global, U.S., and Canadian economic conditions Canada economic and
Bob Costello Chief Economist & Vice President American Trucking Associations. Economic & Motor Carrier Industry Trends. September 10, 2013
 Bob Costello Chief Economist & Vice President American Trucking Associations Economic & Motor Carrier Industry Trends September 10, 2013 The Freight Economy Washington continues to be a headwind on economic
Briefing on the State of the State. presented to the. SCAA Schuyler Center for Analysis and Advocacy
 Briefing on the State of the State presented to the SCAA Schuyler Center for Analysis and Advocacy Rae D. Rosen Assistant Vice President Federal Reserve Bank of New York November 16, 2006 Key Points: Economic
Dr. James P. Gaines Research Economist. recenter.tamu.edu
 Dr. James P. Gaines Research Economist recenter.tamu.edu National Economic Recovery still Going 2 National Issues Expected GDP growth still modest: 2015 2.5%; personal consumption 2.5% Inflation not worrisome:
Economy On The Rebound
 Economy On The Rebound Robert Johnson Associate Director of Economic Analysis November 17, 2009 robert.johnson@morningstar.com (312) 696-6103 2009, Morningstar, Inc. All rights reserved. Executive
From Recession to Recovery
 From Recession to Recovery Monday, April 26, 2010 8:00 AM - 9:15 AM Moderator Michael Klowden, President and CEO, Milken Institute Speakers Mohamed El-Erian, CEO and Co-Chief Investment Officer, Pacific
Dr. Richard Wobbekind Executive Director, Business Research Division and Senior Associate Dean for Academic Programs University of Colorado Boulder
 Dr. Richard Wobbekind Executive Director, Business Research Division and Senior Associate Dean for Academic Programs University of Colorado Boulder Member FDIC VectraBank.com Economic Outlook 2015 Richard
Will 2016 Be the Last Hurrah for Commercial Real Estate? Presented By: John Chang First Vice-President Marcus & Millichap Research Services
 Will 2016 Be the Last Hurrah for Commercial Real Estate? Presented By: John Chang First Vice-President Marcus & Millichap Research Services Rising Uncertainty Creating Headwinds for Commercial Real Estate
2009 California & Bay Area Real Estate Market Outlook
 2009 California & Bay Area Real Estate Market Outlook November 24, 2008 Fairmont Hotel Leslie Appleton-Young C.A.R. Vice President and Chief Economist California Real Estate Market: 2008 California s Housing
State of American Trucking
 State of American Trucking October 11, 2018 Rod Suarez Economic Analyst American Trucking Associations rsuarez@trucking.org Business Cycles U.S. Expansions Duration October 1949 - July 1953 May 1954 -
U.S. REITs have rebounded strongly Dow Jones Equity REIT Total Return Index
 U.S. REITs have rebounded strongly Dow Jones Equity REIT Total Return Index Index, 2005 = 100 250 200 150 100 50 0 2005 2006 2007 2008 2009 2010 2011 2012 2013 2014 Sources: Bloomberg, Dow Jones. Affordability
2016 Texas Prosperity Conference The Barnhill Center Brenham, Texas August 26, Dr. James P. Gaines Chief Economist. recenter.tamu.
 2016 Texas Prosperity Conference The Barnhill Center Brenham, Texas August 26, 2016 Dr. James P. Gaines Chief Economist recenter.tamu.edu Housing and People 2 Texas Population 1910-2050 60,000,000 50,000,000
ABA Commercial Real Estate Lending Committee
 ABA Commercial Real Estate Lending Committee Commercial Real Estate Outlook The Good, the Bad and the Ugly January 16, 2019 Rob Strand Senior Economist American Bankers Association aba.com 1-800-BANKERS
2018 Annual Economic Forecast Dragas Center for Economic Analysis and Policy
 2018 Annual Economic Forecast Dragas Center for Economic Analysis and Policy PRESENTING SPONSOR EVENT PARTNERS 2 The forecasts and commentary do not constitute an official viewpoint of Old Dominion University,
More of the Same; Or now for Something Completely Different?
 More of the Same; Or now for Something Completely Different? C2ER Place cover image here Richard Wobbekind Chief Economist and Associate Dean for Business and Government Relations June 14, 2017 Real GDP
CU Real Estate Forum. The Game is Still Going. The Longest 7 th Inning Ever. Presenter: Doug Wulf. Monday, December 7, 2015
 CU Real Estate Forum The Game is Still Going The Longest 7 th Inning Ever Presenter: Doug Wulf Monday, December 7, 2015 Out! Safe! Where Are We in the Cycle? Recession-Recovery Table History is not on
Partnerships with Purpose: Housing for Texans
 Partnerships with Purpose: Housing for Texans 25th Annual TALHFA Educational Conference October 25-27, 2017 Fort Worth, Texas Dr. James P. Gaines Chief Economist 2 Outlook Since November 10, 2017: Rising
Dr. James P. Gaines Research Economist recenter.tamu.edu
 Texas Uncertain Economy in a World of Uncertain Oil Prices Dr. James P. Gaines Research Economist recenter.tamu.edu National Economic Recovery still Going 2 U.S. Outlook Expected GDP growth still modest:
Real Estate and Economic Outlook
 Real Estate and Economic Outlook Lawrence Yun, Ph.D. Chief Economist NATIONAL ASSOCIATION OF REALTORS Presentation at Inforum Outlook Conference University of Maryland College Park, MD December 12, 2013
Babson Capital/UNC Charlotte Economic Forecast. May 13, 2014
 Babson Capital/UNC Charlotte Economic Forecast May 13, 2014 Outline for Today Myths and Realities of this Recovery Positive Economic Signs Negative Economic Signs Outlook for 2014 The Employment Picture
Zions Bank Economic Overview
 Zions Bank Economic Overview Kenworth National Dealers Conference November 8, 2018 1 National Economic Conditions 2 Volatility Returns to the Stock Market 27,000 Dow Jones Industrial Average October 10,
Friday, May 22, NAR Convention
 NAR Convention 5-14-09 NAR Convention 5-14-09 Lawrence Yun, NAR Chief Economist NAR Marketing Tips!Provide Market Data to buyers!forbes Buyer Survey: Now good time to buy home!best Banner Ads: 1. Has Market
U.S. Property Market Outlook, 2013Q1. Jim Costello, Managing Director CBRE Americas Research Investment Research
 U.S. Property Market Outlook, 2013Q1 Jim Costello, Managing Director CBRE Americas Research Investment Research CBRE Page 2 Outlook for the Real Side of the Economy Operationally, what do Research Teams
National and Regional Economic Outlook. Central Southern CAA Conference
 National and Regional Economic Outlook Central Southern CAA Conference Dr. Mira Farka & Dr. Adrian R. Fleissig California State University, Fullerton April 13, 2011 The Painfully Slow Recovery The Painfully
Texas Economic Outlook: Recovery in 2010 Keith Phillips Federal Reserve Bank of Dallas San Antonio Office
 Texas Economic Outlook: Recovery in 2010 Keith Phillips Federal Reserve Bank of Dallas San Antonio Office The views expressed in this presentation are strictly those of the author and do not necessarily
2017 Nebraska Profile
 2017 Nebraska Profile State, 9 NEW Regions, 93 Counties, plus 31 Cities Three Volumes Demographic Change in the State Economic Influences at Work Housing Statistics and Trends Summary of Findings Discuss
Transitions: 2019 Economic Forecast for Metro Denver February 6, 2019
 Transitions: 2019 Economic Forecast for Metro Denver February 6, 2019 Prepared by: Can Stock Photo / jkirsh In Partnership with: Consumer Changes and Influences Slowing population growth Aging of the population
National and Virginia Economic Outlook Professor Robert M. McNab Dragas Center for Economic Analysis and Policy Strome College of Business
 National and Virginia Economic Outlook Professor Robert M. McNab Dragas Center for Economic Analysis and Policy Strome College of Business October 24, 2018 The forecasts and commentary do not constitute
The Auction Market In 2015 & 2016 Review & Forecast. Dr. Ira Silver NAAA Economist
 The Auction Market In 2015 & 2016 Review & Forecast Dr. Ira Silver NAAA Economist silver@naaa.com Agenda Economic conditions Economic outlook Light vehicle sales Light vehicle sales outlook NAAA 2015 Annual
A comment on recent events, and...
 A comment on recent events, and... where we are in the current economic cycle November 15, 2016 Mark Schniepp Director Likely Trump Policies $4 to $5 Trillion in tax cuts over 10 years to corporations,
The Houston Economy Jesse Thompson Regional Business Economist The Federal Reserve Bank of Dallas, Houston Branch June 2016
 The Houston Economy Jesse Thompson Regional Business Economist The Federal Reserve Bank of Dallas, Houston Branch June 2016 Image from http://peoplesguidetohouston.wordpress.com/category/uncategorized/
RED DEER HOUSING MARKET OUTLOOK
 RED DEER - JUNE 3, 2009 RED DEER HOUSING MARKET OUTLOOK Regine durand Market Analyst - CMHC Prairie and Territories 50,000 48,000 46,000 44,000 42,000 40,000 38,000 36,000 34,000 32,000 30,000 28,000 Red
Colorado Economic Update
 Colorado Economic Update Steamboat Economic Summit Place cover image here Brian Lewandowski Associate Director, Business Research Division October 21, 2016 Recession 8 Months Recession 18 Months Real GDP
UDI Capital Region: Growth & Change
 UDI Capital Region: Growth & REAL ESTATE thoughtful Andrew Ramlo, VP, Market Intelligence Rennie Group Today's Roadmap: - Current Market Stats - The Drivers To - To 2021 & Beyond Current Market stats ALL
Zions Bank Economic Overview
 Zions Bank Economic Overview Intermountain Credit Education League May 10, 2018 Dow Tops 26,000 Up 48% Since 2016 Election Jan 26, 2018 26,616 Oct 30, 2016 17,888 Source: Wall Street Journal Dow Around
Percent of Brokerages by Size
 Percent of Brokerages by Size 80% 70% 60% 58.4% 50% 40% 30% 28.7% 20% 10% 0% #: +23.6% -7.3% +9.9% 0.1% 0.1% 0.2% 0.5% 0.6% 1.8% 2.6% 1,000+ 500-999 300-499 100-299 50-99 20-49 10-19 5-9 2-4 Single Brokers
2015 Economic Forecast & Industry Outlook. Robert A. Kleinhenz, Ph.D. Chief Economist, Kyser Center for Economic Research, LAEDC October 8, 2014
 2015 Economic Forecast & Industry Outlook Robert A. Kleinhenz, Ph.D. Chief Economist,, LAEDC October 8, 2014 Outline U.S. Economy California Economy Southern California Economy & Industries Five-Year Outlook
Economic & Financial Market Outlook
 Economic & Financial Market Outlook BC Pension Forum March 1, 2013 Chris Lawless, Chief Economist Overview Global forces Recent economic performance ~ US, Europe, Japan, China ~ Other emerging markets
Canadian Teleconference: Can the Canadian Economy Survive the Turmoil in the United States?
 Canadian Teleconference: Can the Canadian Economy Survive the Turmoil in the United States? Nigel Gault Chief U.S. Economist Dale Orr Canadian Macroeconomic Services Copyright 2008 Global Insight, Inc.
MARKET AND CAPACITY UPDATE. Matthew Marsh September 2016
 MARKET AND CAPACITY UPDATE Matthew Marsh September 2016 1980 1981 1982 1983 1984 1985 1986 1987 1988 1989 1990 1991 1992 1993 1994 1995 1996 1997 1998 1999 2000 2001 2002 2003 2004 2005 2006 2007 2008
How Much Wind Is in the Sails?
 How Much Wind Is in the Sails? Erie Chamber of Commerce Place cover image here Richard Wobbekind Senior Economist and Associate Dean for Business and Government Relations September 20, 2017 Real GDP Growth
WORKFORCE LOCAL AREA EMPLOYMENT STATISTICS (LAUS)
") AUGUST 2016 WORKFORCE LOCAL AREA EMPLOYMENT STATISTICS (LAUS) 1,150,000 1,100,000 1,050,000 1,000,000 950,000 900,000 850,000 800,000 750,000 700,000 Labor Force Employment June 2015 to June 2016: 36,504
AUGUST 2016 WORKFORCE LOCAL AREA EMPLOYMENT STATISTICS (LAUS) 1,150,000 1,100,000 1,050,000 1,000,000 950,000 900,000 850,000 800,000 750,000 700,000 Labor Force Employment June 2015 to June 2016: 36,504
Cement & Construction Outlook
 Cement & Construction Outlook Minnesota Concrete Council November 17, 2011 Dave Zwicke, PCA Analytics Manager, Sr. Economist Bottom Line Economy in a slow growth period characterized by tepid job gains.
ORLANDO MSA MARKET OVERVIEW LAST UPDATED: MAY 2018
 ORLANDO MSA MARKET OVERVIEW LAST UPDATED: MAY 2018 Orlando MSA Market Overview Labor Market Payroll Employment Commercial Real Estate Residential Real Estate Consumer Spending Visitor Industry Labor Market
Regional Real Estate Trends
 Regional Real Estate Trends Terry L. Clower, Ph.D. Director, Center for Regional Analysis Schar School of Policy and Government George Mason University April 6, 2018 140.0 120.0 100.0 80.0 60.0 40.0 20.0
2014 Economic Forecast: Boulder & Beyond. Keynote Presentation
 2014 Economic Forecast: Boulder & Beyond Keynote Presentation Business Research Division Richard Wobbekind Executive Director Business Research Division & Senior Associate Dean Leeds School of Business
The Changing Global Economy Impacts on Seaports and Trade Dr. Walter Kemmsies
 The Changing Global Economy Impacts on Seaports and Trade Dr. Walter Kemmsies Chief Economist, PAGI Group, JLL (Port, Airport & Global Infrastructure) Agenda Where are we in the cycle? What are the barriers
THE MOST INFORMATIVE EVENT COVERING REAL ESTATE INVESTMENTS
 THE MOST INFORMATIVE EVENT COVERING REAL ESTATE INVESTMENTS 2014 U.S. Economic, Capital Markets, and Retail Market Overview and Outlook Retail Trends 2014 U.S. Economic Overview and Outlook Total Employment
The Wisconsin and Minnesota Economies: What can we learn from each other? Noah Williams
 The Economies: What can we learn from each other? Noah University of Wisconsin - Madison Future Wisconsin Summit 2016 Economies Location, size, demographics, and history make Wisconsin and Minnesota natural
MBA Economic and Mortgage Finance Outlook
 MBA Economic and Mortgage Finance Outlook MBA of Alabama Annual Conference June 7, 2017 Presented by Lynn Fisher Mortgage Bankers Association 1 Summary of the MBA Outlook 2016 2017 2018 2019 GDP Growth
2019 ECONOMIC FORECAST AND FINANCIAL MARKET UPDATE
 2019 ECONOMIC FORECAST AND FINANCIAL MARKET UPDATE January 14, 2019 Scott Colbert, CFA Executive Vice President Director of Fixed Income & Chief Economist scott.colbert@commercebank.com GLOBAL GROWTH EXPECTATIONS
THIS AIN T THE 80s! And Houston isn t going anywhere.
 THIS AIN T THE 80s! And Houston isn t going anywhere. EXPECTEDLY, A DRAMATIC DOWNTURN IN OIL, ONE THAT HAS RUN EVEN FASTER AND DEEPER THAN DURING 2008-2009, RAISED ALARM ABOUT THE STABILITY OF THE HOUSTON
Curves On The Road Ahead
 Curves On The Road Ahead Light Vehicle Market Outlook November 2018 Charles Chesbrough Senior Economist A g e n d a Economic Outlook and New Vehicle Sales Affordability Threat and the Used Vehicle Market
Boulder Economic Summit The Future of the Talent-Driven Economy
 Boulder Economic Summit The Future of the Talent-Driven Economy Richard Wobbekind Executive Director Business Research Division & Senior Associate Dean Leeds School of Business National Employment Thousands,
Muhlenkamp & Company. Webinar December 1, Ron Muhlenkamp, Portfolio Manager Jeff Muhlenkamp, Portfolio Manager Tony Muhlenkamp, President
 Muhlenkamp & Company Webinar December 1, 2016 Ron Muhlenkamp, Portfolio Manager Jeff Muhlenkamp, Portfolio Manager Tony Muhlenkamp, President Muhlenkamp & Company, Inc. Intelligent Investment Management
DFW MULTIFAMILY TRENDS & OBSERVATIONS Q2 2017
 DFW MULTIFAMILY TRENDS & OBSERVATIONS Q2 2017 DALLAS / FORT WORTH The Top US Demand Driven Apartment Market DFW MULTIFAMILY STARTS A HISTORY LESSON!!! The challenge boom or bust perception vs recent history
 www.colorado.edu/leeds/brd CAREER ADVANCING DEGREES FROM LEEDS EVENING MBA PROGRAM FOR WORKING PROFESSIONALS #1 PART-TIME MBA Program in Colorado according to U.S. News & World Report Engage in a collaborative
Vancouver Real Estate Forum
 Vancouver Real Estate Forum MODERATOR John O Bryan Chairman CBRE Limited PANELIST Chris Dobrzanski, CEO, Citizens Bank David Franklin, President, CMLS Financial Ltd. Morley Greene, President, Trez Capital
Economic Overview. Melissa K. Peralta Senior Economist April 27, 2017
 Economic Overview Melissa K. Peralta Senior Economist April 27, 2017 TTX Overview TTX functions as the industry s railcar cooperative, operating under pooling authority granted by the Surface Transportation
WORKFORCE LOCAL AREA EMPLOYMENT STATISTICS (LAUS)
") AUGUST 2018 WORKFORCE LOCAL AREA EMPLOYMENT STATISTICS (LAUS) 1,200,000 1,100,000 1,000,000 900,000 Labor Force Employment 1,152,626 1,116,938 800,000 700,000 600,000 500,000 2016 to 2017: 35957 (3.1%)
AUGUST 2018 WORKFORCE LOCAL AREA EMPLOYMENT STATISTICS (LAUS) 1,200,000 1,100,000 1,000,000 900,000 Labor Force Employment 1,152,626 1,116,938 800,000 700,000 600,000 500,000 2016 to 2017: 35957 (3.1%)
INTERSECTIONS. Metro Denver 2016 Economic Forecast January 2016
 INTERSECTIONS Metro Denver 2016 Economic Forecast January 2016 Employment Intersections Employment growth and Great Recession recovery Industry clusters Average annual salary Photo Credit: istockphoto
National Housing Trends
 National Housing Trends 34% America s Choice of Best Long Term Investment 26% 17% 15% 6% Real Estate Stocks / Mutual Funds Gold Savings Accounts / CDs Bonds Gallup 2018 Housing Affordability 197 Index
National Housing Trends
 National Housing Trends 34% America s Choice of Best Long Term Investment 26% 17% 15% 6% Real Estate Stocks / Mutual Funds Gold Savings Accounts / CDs Bonds Gallup 2018 Housing Affordability 197 Index
Frederick Ross. Real Estate Market Overview. Presented by: Kevin Thomas Senior Vice President. Frederick Ross. Company.
 Frederick Ross Real Estate Market Overview Presented by: Kevin Thomas Senior Vice President Frederick Ross Company January 2003 Business Consumers Source: BEA, Ross Research Housing...Bust or Rust? 2001
National Housing Trends
 National Housing Trends 34% America s Choice of Best Long Term Investment 26% 17% 15% 6% Real Estate Stocks / Mutual Funds Gold Savings Accounts / CDs Bonds Gallup 2018 Home Sales in thousands 2017 2018P
2019 Economic Outlook: Will the Recovery Ever End?
 2019 Economic Outlook: Will the Recovery Ever End? Advantage Bank Place cover image here Richard Wobbekind Senior Economist and Associate Dean for Business and Government Relations November 15 th, 2018
US Economic Outlook IHS ECONOMICS. Paul Edelstein, Director NA Financial Economics, ,
 IHS ECONOMICS US Outlook US Economic Outlook How long will the ride last? September 2014 ihs.com Paul Edelstein, Director NA Financial Economics, +1 781 301 9014, paul.edelstein@ihs.com The US economy
What s Ahead for The Colorado Economy?
 What s Ahead for The Colorado Economy? Colorado Counties Inc. Place cover image here Richard Wobbekind Senior Economist and Associate Dean for Business and Government Relations November 28, 2017 Real GDP
National Housing Trends
 National Housing Trends 34% America s Choice of Best Long Term Investment 26% 17% 15% 6% Real Estate Stocks / Mutual Funds Gold Savings Accounts / CDs Bonds Gallup 2018 Housing Affordability 197 Index
Zions Bank Economic Overview
 Zions Bank Economic Overview Veteran Owned Business Conference May 11, 2018 Dow Tops 26,000 Up 48% Since 2016 Election Jan 26, 2018 26,616 Oct 30, 2016 17,888 Source: Wall Street Journal Dow Around Correction
Current Hawaii Economic Conditions. Eugene Tian
 Current Hawaii Economic Conditions Eugene Tian Department of Business, Economic Development & Tourism At the PATA/TTRA 2016 Annual Outlook & Economic Forecast Forum February 3, 2016 Positive Signs in the
Education Committee Economic Background and Issue Review
 Education Committee Economic Background and Issue Review Montpelier, Vermont January 22, 2014 Thomas E. Kavet State Economist and Principal Economic Advisor to the Vermont State Legislature Since 1996
The Texas Gulf Coast Overview and Outlook
 The Texas Gulf Coast Overview and Outlook Jesse Thompson Federal Reserve Bank of Dallas Houston Branch 06/2018 The views expressed in this presentation are strictly those of the presenter and do not necessarily
Economic Growth in the Trump Economy
 Economic Growth in the Trump Economy Presented to State Data Center Conference William F. Fox, Director November 18, 2016 GDP Grows, Though Slowly 10.0 8.0 Percentage Change, Previous Qtr, SAAR 6.0 4.0
MAINTAINING MOMENTUM:
 MAINTAINING MOMENTUM: 2018 National Economic Update September 12, 2018 noun mo men tum \ mō-ˈmen-təm, mə- \ 1 b : the strength or force that allows something to continue or to grow stronger or faster as
Joseph Von Nessen, Ph.D. Research Economist November 16, 2018
 Joseph Von Nessen, Ph.D. Research Economist November 16, 2018 joey.vonnessen@moore.sc.edu Post-WWII U.S. Economic Expansions by Length Date range of expansion (M/Y) 10/45-11/48 10/49-7/53 5/54-8/57 4/58/4/60
Demographic Change in North Carolina
 Demographic Change in North Carolina 5 Trends to Watch North Carolina Aggregates Association June 29, 2017 Rebecca Tippett, PhD Director, Carolina Demography July 1 Population (Millions) North Carolina
Your Texas Economy. Current through: Tuesday, Nov 20, 2018
 Your Texas Economy Current through: Tuesday, Nov 20, 2018 Overview of Texas Economy The Texas economy is growing robustly in 2018 2018 job growth through October is 2.9 percent annualized compared to 2.1
Down with vacancy and up with absorption in Q3 2018
 Austin Office, Q3 2018 Down with vacancy and up with absorption in Q3 2018 580,487 SF 575,927 SF 10.2% 4,445,358 SF $35.49 PSF Figure 1: Net Absorption and Vacancy Net Absorption (000s SF) 2,200 1,400
The U.S. Economy How Serious A Downturn? Nigel Gault Group Managing Director North American Macroeconomic Services
 The U.S. Economy How Serious A Downturn? Nigel Gault Group Managing Director North American Macroeconomic Services Growth Is Cooling; But a Soft Landing Is Likely (Real GDP, annualized rate of growth)
2018 Annual Economic Forecast Dragas Center for Economic Analysis and Policy
 2018 Annual Economic Forecast Dragas Center for Economic Analysis and Policy PRESENTING SPONSOR EVENT PARTNERS 2 The forecasts and commentary do not constitute an official viewpoint of Old Dominion University,
Zions Bank Economic Overview
 Zions Bank Economic Overview Utah Bankruptcy Lawyers Forum March 20, 2018 National Economic Conditions When Good News is Bad News Is Good News?? Dow Tops 26,000 Up 44% Since 2016 Election Source: Wall
Alternative Measures of Economic Activity. Jan J. J. Groen, Officer Research and Statistics Group
 Alternative Measures of Economic Activity Jan J. J. Groen, Officer Research and Statistics Group High School Fed Challenge Student Orientation: February 1 and 2, 217 Outline Alternative indicators: data
Desert Hot Springs Economy
 Desert Hot Springs Economy Period of Adjustment, 2008 John Husing, Ph.D. Economics & Politics, Inc. 4/30/2008 1 Inland Empire Job Growth, 2006 Employment Change, California Markets Annual Average, 2005-2006
Future of Housing Trends and the Housing Market Demographic Waves in the Region and Future of Housing. Illinois Finance Forum January 25, 2019
 Future of Housing Trends and the Housing Market Demographic Waves in the Region and Future of Housing Illinois Finance Forum January 25, 2019 Millions OUR STATE S POPULATION 2000-2017 13.0 12.4 M 12.9
Southern Lodging Summit Memphis, TN. Presented by Randy Smith Founder Smith Travel Research
 Southern Lodging Summit Memphis, TN Presented by Randy Smith Founder Smith Travel Research Total US - Key Statistics 12-Months Ending July 2012 % Change Hotels 52.3 k Room Supply 1.8 bn 0.4% Room Demand
The U. S. Economic Outlook: Robert J. Gordon
 The U. S. Economic Outlook: Upside and Risks Robert J. Gordon Ottawa a Economics Association Ottawa, a, September 14, 2017 Immigration Medical Care My Policy Package: Be Like Canada d University Tuition