Desert Hot Springs Economy
|
|
|
- Letitia Carson
- 6 years ago
- Views:
Transcription

1 Desert Hot Springs Economy Period of Adjustment, 2008 John Husing, Ph.D. Economics & Politics, Inc. 4/30/2008 1
2 Inland Empire Job Growth, 2006 Employment Change, California Markets Annual Average, Source: CA Employment Development Department 274,158 47, ,508 99,650 7,008 18,042 29,025 48,150 68,592 4/30/2008 Ventura Co.San Diego Co.Orange Co. Inland Empire L.A. Co. So. California California No. California2
3 Inland Empire Job Growth, 2008 Job Change, California Markets Inland Empire & Coastal Counties, March Source: CA Employment Development Department 57,700 3,200 (21,400) (21,300) (13,800) (6,000) (1,700) (3,300) (61,000) 4/30/2008 Inland EmpireOrange Co.Los Angeles Co. Ventura Co.San Diego Co.Imperial Co. So. California California No. California 3
4 Unemployment Exhibit 5.-Unemployment Rates, Annual, Inland Empire & California 12% 11% 10% 9% 8% 7% 6% 5% 4% A Housing Correction... Now is the Time But It Hurts! /30/ Source: CA Employment Development Department


5 How Coachella Valley Economy Has Worked? Secondary Tier Primary Tier 4/30/2008 5
6 Looking Ahead: 6 million more Southern Californians by 2030 Southern California Population Growth Composition, Foreign 871, % Natural Gain 1,131, % Domestic 7, % 4/30/2008 Source: California Department of Finance 6


7 People Prefer To Live Near The Coast 4/30/2008 7


8 Baby Boomers: Here They Come Born 1946 Current Age: 62! 4/30/2008 8


9 What is your ideal home? 86% Single Family Detached Would you prefer a detached home EVEN if you must drive? + = 66% YES 4/30/2008 9

10 Looking Ahead: Dirt Theory 1. Affordable Housing & Population Serving Jobs I 5 2. Industrial Projects & Blue Collar Jobs Ventura I 405 Los Angeles County State Hwy 2 I 15 I 215 State Hwy County Expensive Housing, Skilled Workers Rancho I-15 Cucamonga & Freeway High Mall Paying Site Jobs San Bernardino County I 605 State Hwy 91 State Hwy 215 I 10 I 110 Orange County Riverside County 4/30/ San Diego County
11 Not Enough Land Or Inadequate Zoning Prices Drive People Outward Home Price Advantage, Inland Empire & So. California Markets Median Priced New & Existing Home, 1st Quarter 2008 Median All Home Price Desert Hot Springs Advantage $453,000 $464,000 $485,000 $568,000 $354,000 $214,000 $303,000 $239,000 $250,000 $271,000 $89,000 Desert Hot Springs Inland Empire San Diego Los Angeles Ventura Orange 4/30/ Source: Dataquick

12 BUILD FREEWAYS & THEY LL COME Don t Build Them & They ll Come Anyway! 4/30/
13 Inland Empire Population Growth, ! Forecasted Population Growth, Inland Empire & Top 12 States (000) 8,335 7,783 7, U.S. 3,326 2,660 2,657 2,136 States! 1,839 1,538 1,454 1,201 1,091 California Texas Florida Arizona North Carolina Georgia Inland Empire 4/30/2008 Source: U.S. Bureau of Census, Southern California Association of Governments 2008 RTP 13 Virginia Washington Nevada Maryland Tennessee
14 Where Is L.A. s Edge In 2008? I 5 I 15 Ventura County I 405 Los Angeles County State Hwy 2 I-15 Freeway Rancho Cucamonga Mall Site I 215 State Hwy 247 San Bernardino County I 605 Metropolitan Southern California Now In Beaumont State Hwy 91 State Hwy 215 I 10 I 110 Orange County Riverside County 4/30/ San Diego County
15 Population Growth 42.0% Exhibit 2.-Population Growth Rates Coachella Valley & Other Major Areas, % 25.3% 11.2% 8.5% 7.7% Desert Hot Spr. Coachella Valley Inland Empire California Los Angeles County U.S. Note: Assumes Coachella Valley unincorporated grows at 16.5% of city growth rate in 2007 Source: CA Department of Finance, U.S. Census Bureau 4/30/
16 Desert Hot Springs Feeling L.A. Exhibit 1.-Population Growth Desert Hot Springs, , ,163 Up 6,962 or 42% 19,479 17,979 14,200 14,550 15,100 15,500 15,900 16,200 16,400 16,582 16,776 16,982 17,394 13,350 12,400 11, /30/ Source: CA Department of Finance
17 Population Growth By City, Exhibit 4.-Population Growth By City Coachella Valley Communities, Indio 22,538 La Quinta 14,646 Coachella 12,483 Cathedral City Palm Desert 8,434 8,384 Desert Hot Spr. 5,429 Palm Springs Rancho Mirage 3,632 3,423 Indian Wells 1,049 4/30/ Source: CA Department of Finance, U.S. Census Bureau
18 Population By City, Coachella Valley Exhibit 3.-Population By City Coachella Valley Cities, 2007 Indio 77,146 Cathedral City Palm Desert Palm Springs 46,858 52,115 49,752 La Quinta Coachella 38,486 41,092 Desert Hot Spr. 23,544 Rancho Mirage 16,944 Indian Wells 4,942 4/30/2008 Source: CA Department of Finance, U.S. Census Bureau 18
19 Desert Hot Springs Area Growth Forecast City Only 19,386 Population Growth Forecast Desert Hot Springs Area, ,206 71,136 77,872 84,364 90,964 50,922 31, /30/2008 Source: Southern California Association of Governments,
20 Home Prices Declining $375,000 $350,000 $325,000 $300,000 $275,000 $250,000 $225,000 $200,000 Existing Homes: -38.5% vs. IE -27.1% 4/30/2008 Source: Dataquick Exhibit 25.-Existing Home Prices, Quarterly Desert Hot Springs, Not Seasonally Adjusted, By Quarter, $175,000 $173,621 $150,000 $125,000 $100,000 $75,000 $50,000 $25,000 New Homes: -9.3% vs. IE -19.2% $ $318, $282, $350,

21 Remember: Foreclosures Now Driving Market 38.4% of CA Sales In March /30/
22 Housing Volume Setting A Floor 32, ,000 28, ,000 24, ,000 20, ,000 16,000 14, ,000 10, ,000 6, ,000 2, Existing Exhibit & New Homes 22.-New Sales, Home Inland Sales Empire Data Desert Hot Seasonally Springs, Seasonally Adjusted, by Adjusted, quarter, By Quarter, A -60.3% v % /30/2008 Source: Dataquick , , Source: Dataquick, Economics & Politics, Inc. Seasonality
23 Market Shares By Area Share of Southern California Home Sales Inland Empire, % 32% 34% 34% 37% 36% 37% 40% 20% 22% 22% 21% 24% 26% 26% 27% 45% 28% 48% 50% 52% 28% 31% 32% 54% 32% 45% 45% 28% 32% Orange Co. 18% to 9% San Diego Co. 23% to 18% /30/2008 Source: Dataquick 23 LA Co. 15% to 25%


24 Housing Prices Took Off For Sound Reasons Demand Rising With Demographics Supply Restrained Prices Had To Take-Off To Eliminate Buyers Exhibit 13.-Price Trend, New & Existing Homes Inland Empire, , Quarterly 460, , , , , , , , , , , , , , , , , , ,000 80,000 New Existing % per year 4/30/ Source: Dataquick


25 Real Problems Sub-Prime & Now This We Financed Have High Cut This Supply Prices 4/30/

26 We re Confused 4/30/
27 Housing Forecast What If Price Went Up At 6% per year in 2004, 2005 and 2006? ow much must Prices Fall, to get to where they would have been by 2007? New Homes: 13.6% lower Developers Can Adjust Home Size Existing Home Prices: 20% lower Home Owners Forced to Sell Remember: Every Home Sale Right Now Is A Distressed Sale 4/30/
28 Fed Trying to get Mortgage Rates Down. But, Lender Fear is Keeping Rates Unusually High. Exhibit Year Mortgage Rate & 10 Year Bond 9.00% 8.50% 8.00% 7.50% 7.00% 6.50% 6.00% 5.50% 5.00% 4.50% 4.00% 3.50% 3.00% 2.50% 2.00% 1.50% 1.00% 0.50% 0.00% 30 Yr. Fixed Mortg. 10-Year Bond Difference /30/ Sources: Federal Reserve Bank, Federal Home Loan Mortgage Corporation 5.88%
29 Home Financing after Home Price & Interest Rate decline $214,190 Local 1st Time Buyers Afford Home, 10% Down 5.88% Fixed 30- Rate, 30% of Income, 2008 $53,243 $44,887 $1,122*12=$13,466 Median Home Price Annual Payments Income Needed Median Income 4/30/2008 Source: CA Association of Realtors 29
30 New Affordability Levels 53% Share Able To Buy Median Price Home Inland Empire, % 58% 35% 18% DHS 4/30/2008 Source: CA Association of Realtors & John Husing 30
31 25.0 Months of Supply: Housing Inventories 44 mos Months of Housing Inventory mos So Cal Coast San Francisco Cent Cal Coast Reno, NV San Diego Las Vegas Salt Lake City Denver Sacramento Atlanta Maryland Colorado Spgs Minneapolis South Florida Raleigh-Durham Northern Virginia Northern Colorado Inland Empire Boise Chicago Phoenix Cent Cal Valley Austin Tampa Dallas/Ft Worth Charlotte Orlando Naples 4/30/ Northern Virginia-C Maryland-C Sarasota Houston Albuquerque/Santa Fe San Antonio Jacksonville Tuscon
32 Months of Finished Vacant Inventory Months of Supply of Finished 8.0 Vacant New Units 4/30/
33 Interest Rates Decline Will Help, But: FHA Loan Guarantees Rise From $362,790 to $500,000 BUT Does Not Have The Staff For The Huge Volume FNMA, Freddie Mac, Ginny MAE: $417,000 to $500,000 BUT % for loans over $417, % if Market has dropped 3% +0.25% if FICO Score Under % if don t have 20% equity 4/30/

34 U.S. Congress: Ideas FHA Given Greater Funding To Insure Questionable Mortgages Lower Loan Balance To Value of House Note Would Give Upside Back to Lender If Home Value Restored 4/30/
35 Route Out of Housing Recession Real Difficulties Resolved Market Psychology Changes Federal Action To Reduce Foreclosures Refinancing As Interest Rates Fall & Loan Guarantees Rise Affordability as Prices & Interest Rates Fall, Income Rises Underlying Housing Shortage Means Pent-Up Demand 4/30/
36 Assessed Valuation, Exhibit 43.-Assessed Valuation (millions) Desert Hot Springs, July 1, Assessed Valuation Growth $1.6 billion or 346.5% Inflation: 27.9% $1,697 $2,115 $997 $363 $400 $434 $460 $477 $488 $476 $477 $453 $456 $474 $500 $544 $603 $ /30/ Source: Riverside County Assessor's Office
37 Assessed Valuation Growth Exhibit 44.-Assessed Valuation Growth Desert Hot Springs & Coachella Valley Cities, Desert Hot Springs Coachella Valley 70% 39% 19% 25% 19% 21% 16% 13% 9% 10% 10% 8% 6% 6% 6% 4% 2% 4% 0% 2% 2% 0% 1% 7% 13% 12% 12% 11% 10% 11% 9% 4% 6% -0% -2% -5% /30/ Source: Riverside County Assessor's Office
38 Population Migration Slowing Domestic Migration Inland Empire, ,406 84,496 80,630 64,486 60,289 68,241 39,928 34, /30/ Source: CA Department of Finance, Demographic Research Unit
39 Soaring Oil Prices Apr-08 $ West Texas Intermediate Crude Oil Prices Monthly Average $115 $105 $95 $85 $75 $65 $55 $45 $35 $25 $15 $5 Jan % $ /30/
40 Total Taxable Sales, Exhibit 33.-Taxable Retail Sales (000) Desert Hot Springs, $44, Retail Sales Up $33.1 million or 52.1% Inflation: 22.7% $44,390 $46,919 $50,228 $48,924 $50,033 $47,935 $49,665 $52,998 $58,491 $63,475 $66,584 $65,974 $71,943 $82,056 $94,182 $96, /30/2008 Source: CA Board of Equalization 40
41 Taxable Sales Growth Rates, Exhibit 34.-Taxable Sales Growth Desert Hot Springs & Coachella Valley, Desert Hot Spr. Coachella Valley 15% 14% 14% 14% 15% 9% 6% 0% 6% 1% 7% 3% 3% 2% 4% 6% 4% 9% 7% 11% 10% 9% 5% 3% 3% 11% 9% 9% 3% 5% -6% -3% -4% -1% /30/ Source: CA Board of Equalization
42 Are Weak 20% 18% 16% 14% 12% 10% 8% 6% 4% 2% 0% -2% -4% -6% -8% -10% -12% -14% California Riverside San Bernardino Taxable Sales Growth Rates Quarterly, California & Inland Empire, /30/ Source: CA Board of Equalization, CA Dept. of Finance, SANBAG, RCTC


43 Blue Collar Jobs About Dirt 4/30/
44 Adult Educational Level, 2006 Share of Adults, No College Class & BA or Above Southern California Counties, People 25 & Over, % 52.1% 50.9% 48.0% 36.9% 36.3% Palm Spr. Sch. Dist. San Bdno. Riverside Los Angeles Orange San Diego Source: 2006 American Community Survey 4/30/


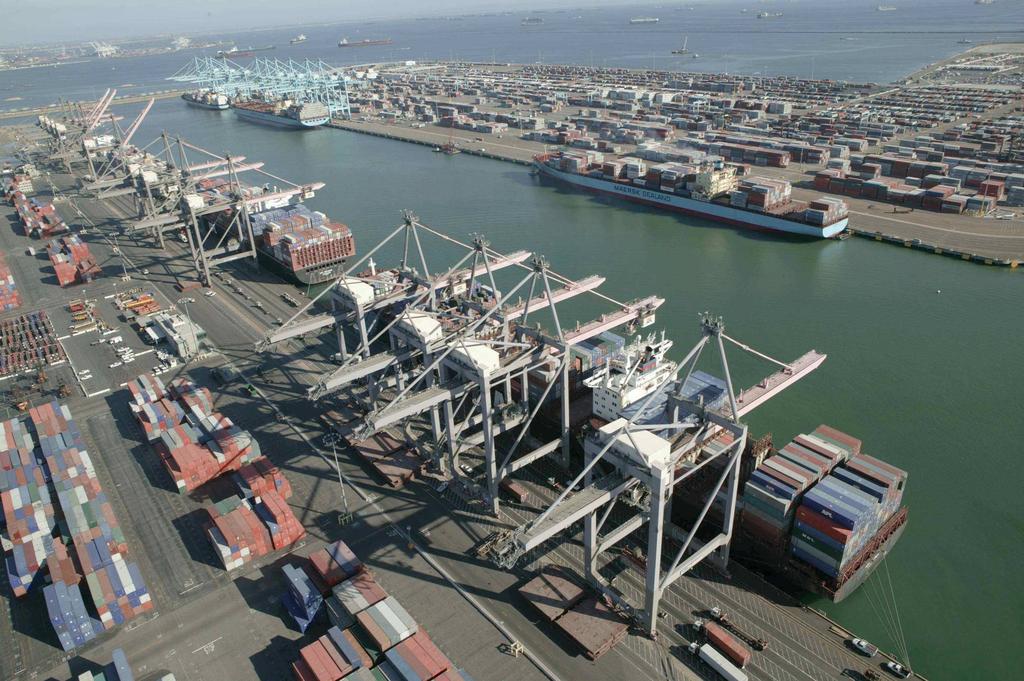
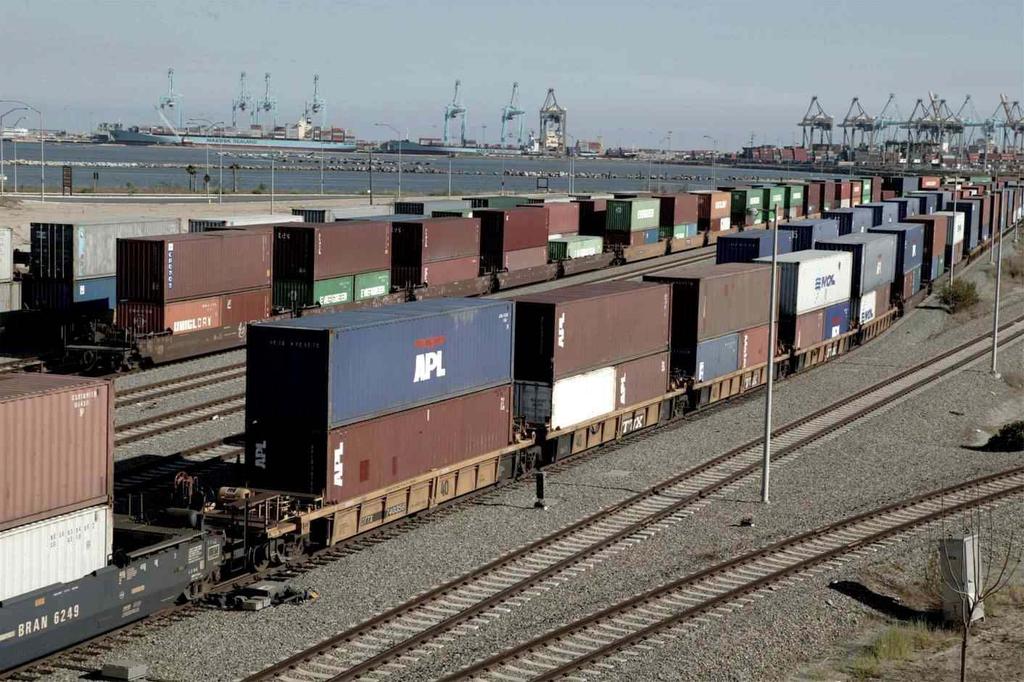
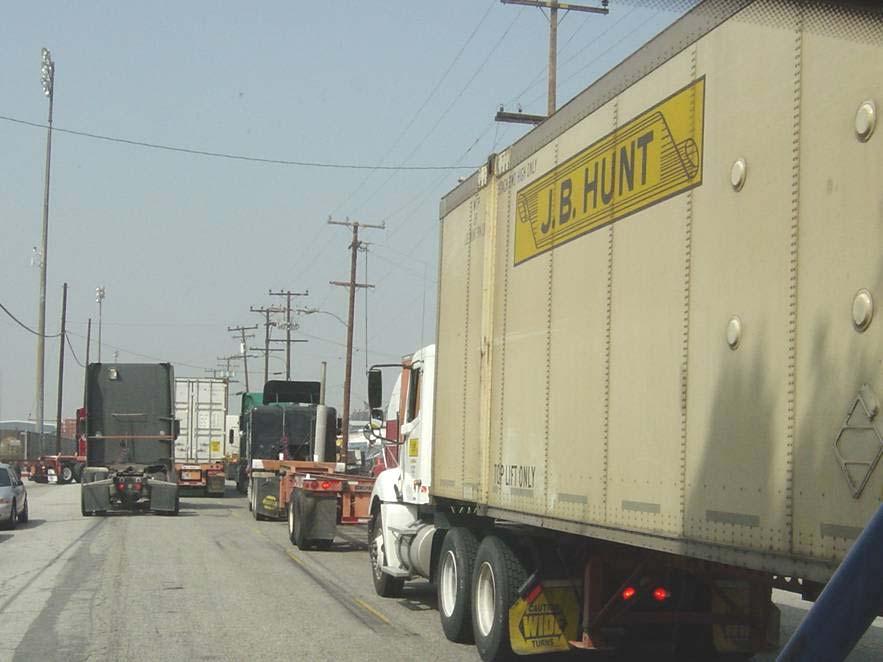


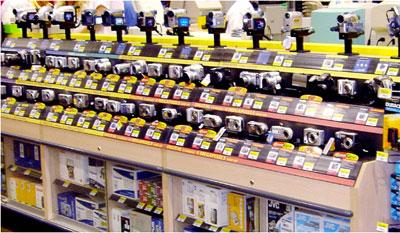

45 Exactly What Shippers Want To Distribution Centers AndMade by Trucks Shipped inat Containers Transported on Trains International Supply Goods in Asia Unloaded our Ports Chain Management 4/30/
46 1. Soaring International Containers Thru So. Calif. Exhibit 6.-Port Container Traffic Ports of Los Angeles & Long Beach, & 2025e (million TEUs) % U.S. Imported Containers 25.4% U.S. Exported Containers TEU=20 foot equivalent container units 4/30/ Source: Ports of Los Angeles & Long Beach; forecast: Moffatt & Nichol Engineers e


47 2. Ports On West Coast Nearest Asia Los Angeles Long Beach 4/30/

48 3. Deep Water Ports As Ships Draw Over 50 feet of Water 8,000-Container Post-Panamax Ships 4/30/
49 4. Competitors Much Smaller L.A.-Long Beach Ports Triple NY-NJ, the second largest complex 4/30/
50 Air Cargo Increase by 4-Fold Exhibit 61.-Changing Shares of Trade Los Angeles Customs District, (billions) Breakbulk Ship $ % 2005: $293.9 billion Air Cargo $ % Land Based $ % Breakbulk Ship $ % 2030: $796.2 billion Air Cargo $ % Land Based $ % Containerized Ship $ % Containerized Ship $ % 4/30/2008 Source: Los Angeles Customs District & Economics & Politics, Inc. 50
51 LAX Near Cargo Capacity Exhibit 17.-Air Cargo Tonnage For SCAG Area Airports 2030 Constrained Demand (1,000s tons) 2,252 2, ,024 1,092 1, % 2006: 2, % JWA BUR PSP LGB SCLA PMD SBD MAR ONT LAX 4/30/2008 Source: SCAG 2004 Regional Transportation Plan 51
52 Low Cost Industrial Dirt (400,000 SF) $412,000 Difference in Lease Rate = $8.2 million in 5% Return On Sales Orange-South San Diego-Escondido L.A. - North San Diego-San Marcos San Diego-Vista L.A. - South Bay Orange-West Orange-North Orange-Airport L.A. - Mid Cities San Gabriel Vly LA-Central Industrial Space Costs Southern California, Sub-Markets, 400,000 SF, December 2007 $4,032,000 $3,648,000 $3,600,000 $3,408,000 $3,120,000 $3,072,000 $3,072,000 $2,976,000 $2,736,000 $2,688,000 $2,496,000 $4,512,000 Inland Empire $2,084,000 nnn=net of taxes, insurance, common area fees 4/30/2008 Source: Grubb & Ellis 52
53 Quarterly Industrial Absorption, Exhibit 17.-Industrial Space Gross Absorption Inland Empire, (moving 4-quarter total) 47,500,000 42,500,000 37,500,000 32,500,000 27,500,000 22,500,000 17,500, million Sq.Ft. 12,500,000 7,500, /30/2008 Source: Grubb & Ellis & Economics & Politics, Inc
54 Inland Empire, 82.1% of So. Calif. Industrial Construction Market Exhibit 15.-Industrial Space Under Construction Southern California Market, December 2007 Inland Empire 23,139, % Orange County 703, % San Diego 1,197, % Los Angeles 3,134, % 4/30/2008 Sources: Grubb & Ellis 54
55 Industrial Vacancy Rate Very Low 26% 24% 22% 20% 18% 16% 14% 12% 10% 8% 6% 4% 2% 0% Exhibit 8-2.-Industrial Space Availability Rate Inland Empire, /30/ Source: Grubb & Ellis % 2008
56 East Valley Winning So Far Exhibit 19.-Location of Increased Industrial Occupancy Inland Empire Sub-Markets, June 2005-Dec (Sq. Ft.) 44.6% 28.8% 20.7% 3.0% 1.7% 1.1% East Valley Westend-SB March JPA Corona SW Riverside Co. High Desert Source: Economics & Politics Inc. using Grubb & Ellis data 4/30/
57 Where Industrial Space Being Built? Where is Industrial Space Being Built Inland Empire, December 2007 Westend 7,744, % High Desert 430, % East Valley 9,528, % March JPA 8,391, % Sources: Grubb & Ellis 4/30/
58 Where Is L.A. s Edge In 2008? I 5 I 15 Ventura County I 405 Los Angeles County State Hwy 2 I-15 Freeway Rancho Cucamonga Mall Site I 215 State Hwy 247 San Bernardino County I 605 Industrial In SB-Redlands & March JPA I 110 State Hwy 91 Orange County State Hwy 215 I 10 Riverside County 4/30/ San Diego County
59 Coachella Valley Is Not In The Goods Movement Discussion It Needs To Be 4/30/


60 Colorful History Powerful Potential Future! 4/30/
61 . 4/30/
U.S. Economic and Apartment Market Overview and Outlook. July 15, 2014
 2014 U.S. Economic and Apartment Market Overview and Outlook July 15, 2014 U.S. Economic Overview U.S. GDP Growth Persistent Despite 1Q Polar Vortex Annualized Quarterly Percent Change 10% 5% 0% -5% -10%
Riverside Rising Economic Outlook for the Region April 2015
 Analysis. Answers Riverside Rising Economic Outlook for the Region April 2015 Beacon Economics, LLC California fact versus fiction Looking back a few years (2009 / 2010) everyone was saying that CA would
Spring Time for Housing
 Spring Time for Housing Arizona State University December 2 nd, 2015 Presented By: Elliott D. Pollack CEO, IN PHOENIX 1 2 The World has Changed Pre-2007 Post-2007 3 Employment Growth From Bottom of Recession
National Housing Trends
 National Housing Trends 34% America s Choice of Best Long Term Investment 26% 17% 15% 6% Real Estate Stocks / Mutual Funds Gold Savings Accounts / CDs Bonds Gallup 2018 Housing Affordability 197 Index
National Housing Trends
 National Housing Trends 34% America s Choice of Best Long Term Investment 26% 17% 15% 6% Real Estate Stocks / Mutual Funds Gold Savings Accounts / CDs Bonds Gallup 2018 Home Sales in thousands 2017 2018P
THE MOST INFORMATIVE EVENT COVERING REAL ESTATE INVESTMENTS
 THE MOST INFORMATIVE EVENT COVERING REAL ESTATE INVESTMENTS 2014 U.S. Economic, Capital Markets, and Retail Market Overview and Outlook Retail Trends 2014 U.S. Economic Overview and Outlook Total Employment
National Housing Trends
 National Housing Trends 34% America s Choice of Best Long Term Investment 26% 17% 15% 6% Real Estate Stocks / Mutual Funds Gold Savings Accounts / CDs Bonds Gallup 2018 Housing Affordability 197 Index
Real Estate: Investing for the Future. Sponsored By:
 Real Estate: Investing for the Future Sponsored By: Percent Change, Year Ago 6 5 4 3 2 1 Real GDP Growth United States, 2000 Prices 0 1994 1995 1996 1997 1998 1999 2000 2001 2002 2003 2004 U.S. Employment
National Housing Trends
 National Housing Trends 34% America s Choice of Best Long Term Investment 26% 17% 15% 6% Real Estate Stocks / Mutual Funds Gold Savings Accounts / CDs Bonds Gallup 2018 Housing Affordability 197 Index
Southern California Economic Forecast & Industry Outlook
 2016-17 Southern California Economic Forecast & Industry Outlook Robert A. Kleinhenz, Ph.D. Sr. VP/Chief Economist, LAEDC February 17, 2016 Outline U.S. Economy California Economy Southern California Economy
2007 Real Estate Market Forecast. October 18, 2006 Leslie Appleton-Young C.A.R. Vice President and Chief Economist
 2007 Real Estate Market Forecast October 18, 2006 Leslie Appleton-Young C.A.R. Vice President and Chief Economist Overview California Real Estate Market What happened in 2006? Tipping Points/Market Psychology
CALIFORNIA STATE UNIVERSITY LONG BEACH. Southern California Regional Economic Forecast
 CALIFORNIA STATE UNIVERSITY LONG BEACH Southern California Regional Economic Forecast Lisa M. Grobar, Ph.D. Director, CSULB Economic Forecast Project Office of Economic Research 2009: A terrible year for
2009 California & Bay Area Real Estate Market Outlook
 2009 California & Bay Area Real Estate Market Outlook November 24, 2008 Fairmont Hotel Leslie Appleton-Young C.A.R. Vice President and Chief Economist California Real Estate Market: 2008 California s Housing
National and Regional Economic Outlook. Central Southern CAA Conference
 National and Regional Economic Outlook Central Southern CAA Conference Dr. Mira Farka & Dr. Adrian R. Fleissig California State University, Fullerton April 13, 2011 The Painfully Slow Recovery The Painfully
Kevin Thorpe Financial Economist & Principal Cassidy Turley
 Kevin Thorpe Financial Economist & Principal Cassidy Turley Economic & Commercial Real Estate Outlook Kevin Thorpe, Chief Economist 2012 Another Year Of Modest Improvement 2006Q1 2006Q3 2007Q1 2007Q3 2008Q1
Briefing on the State of the State. presented to the. SCAA Schuyler Center for Analysis and Advocacy
 Briefing on the State of the State presented to the SCAA Schuyler Center for Analysis and Advocacy Rae D. Rosen Assistant Vice President Federal Reserve Bank of New York November 16, 2006 Key Points: Economic
Investing in Real Estate. The smart choice for today s investor
 Investing in Real Estate The smart choice for today s investor Real Estate is preferred over stocks Real estate out performs stocks http://blog.863katy.com/category/national-housing-news/page/2/ Real Estate
Dr. Richard Wobbekind Executive Director, Business Research Division and Senior Associate Dean for Academic Programs University of Colorado Boulder
 Dr. Richard Wobbekind Executive Director, Business Research Division and Senior Associate Dean for Academic Programs University of Colorado Boulder Member FDIC VectraBank.com Economic Outlook 2015 Richard
The State of the Commercial Real Estate Industry: Year-End 2010 Office Review & Outlook
 The State of the Commercial Real Estate Industry: Year-End 2010 Office Review & Outlook Copyright 2011 CoStar Realty Information, Inc. No reproduction or distribution without permission. The following
2015 Economic Forecast & Industry Outlook. Robert A. Kleinhenz, Ph.D. Chief Economist, Kyser Center for Economic Research, LAEDC October 8, 2014
 2015 Economic Forecast & Industry Outlook Robert A. Kleinhenz, Ph.D. Chief Economist,, LAEDC October 8, 2014 Outline U.S. Economy California Economy Southern California Economy & Industries Five-Year Outlook
ORLANDO MSA MARKET OVERVIEW LAST UPDATED: MAY 2018
 ORLANDO MSA MARKET OVERVIEW LAST UPDATED: MAY 2018 Orlando MSA Market Overview Labor Market Payroll Employment Commercial Real Estate Residential Real Estate Consumer Spending Visitor Industry Labor Market
Will 2016 Be the Last Hurrah for Commercial Real Estate? Presented By: John Chang First Vice-President Marcus & Millichap Research Services
 Will 2016 Be the Last Hurrah for Commercial Real Estate? Presented By: John Chang First Vice-President Marcus & Millichap Research Services Rising Uncertainty Creating Headwinds for Commercial Real Estate
U.S. REITs have rebounded strongly Dow Jones Equity REIT Total Return Index
 U.S. REITs have rebounded strongly Dow Jones Equity REIT Total Return Index Index, 2005 = 100 250 200 150 100 50 0 2005 2006 2007 2008 2009 2010 2011 2012 2013 2014 Sources: Bloomberg, Dow Jones. Affordability
2012 Raleigh-Durham Market Forecast Investment Sales. Jeff Glenn CBRE Wednesday, March 21, 2012
 2012 Raleigh-Durham Market Forecast Investment Sales Jeff Glenn CBRE Wednesday, March 21, 2012 What s Wrong with this Picture? TOPICS I. National Perspective II. Raleigh-Durham Spotlight III. A Closer
recenter.tamu.edu Dr. James P. Gaines Research Economist Real Estate Center at Texas A&M University
 recenter.tamu.edu Dr. James P. Gaines Research Economist Real Estate Center at Texas A&M University Area Market Reports RECENTER.TAMU.EDU Tierra Grande Economic Review Videos, Audios & Presentations Data,
WORKFORCE LOCAL AREA EMPLOYMENT STATISTICS (LAUS)
") AUGUST 2018 WORKFORCE LOCAL AREA EMPLOYMENT STATISTICS (LAUS) 1,200,000 1,100,000 1,000,000 900,000 Labor Force Employment 1,152,626 1,116,938 800,000 700,000 600,000 500,000 2016 to 2017: 35957 (3.1%)
AUGUST 2018 WORKFORCE LOCAL AREA EMPLOYMENT STATISTICS (LAUS) 1,200,000 1,100,000 1,000,000 900,000 Labor Force Employment 1,152,626 1,116,938 800,000 700,000 600,000 500,000 2016 to 2017: 35957 (3.1%)
Real Estate and Economic Outlook
 Real Estate and Economic Outlook Lawrence Yun, Ph.D. Chief Economist NATIONAL ASSOCIATION OF REALTORS Presentation at Inforum Outlook Conference University of Maryland College Park, MD December 12, 2013
2018 Annual Economic Forecast Dragas Center for Economic Analysis and Policy
 2018 Annual Economic Forecast Dragas Center for Economic Analysis and Policy PRESENTING SPONSOR EVENT PARTNERS 2 The forecasts and commentary do not constitute an official viewpoint of Old Dominion University,
Economic and Real Estate Outlook
 Economic and Real Estate Outlook By Lawrence Yun, Ph.D. Chief Economist, National Association of REALTORS Presentation at Charlottesville Area Association of REALTORS October 13, 2016 1990 1991 1992 1993
Texas Economic Outlook: Recovery in 2010 Keith Phillips Federal Reserve Bank of Dallas San Antonio Office
 Texas Economic Outlook: Recovery in 2010 Keith Phillips Federal Reserve Bank of Dallas San Antonio Office The views expressed in this presentation are strictly those of the author and do not necessarily
Fundamental Certainty
 Fundamental Certainty.or No? a presentation at: R. Mark Woodworth PKF Hospitality Research, LLC May 7, 2013 mark.woodworth@pkfc.com Hotel Horizons Forecasting Model Smith Travel Research Historical rooms
Bob Costello Chief Economist & Vice President American Trucking Associations. Economic & Motor Carrier Industry Trends. September 10, 2013
 Bob Costello Chief Economist & Vice President American Trucking Associations Economic & Motor Carrier Industry Trends September 10, 2013 The Freight Economy Washington continues to be a headwind on economic
Frederick Ross. Real Estate Market Overview. Presented by: Kevin Thomas Senior Vice President. Frederick Ross. Company.
 Frederick Ross Real Estate Market Overview Presented by: Kevin Thomas Senior Vice President Frederick Ross Company January 2003 Business Consumers Source: BEA, Ross Research Housing...Bust or Rust? 2001
Carol Tomé CFO and Executive Vice President, Corporate Services
 Carol Tomé CFO and Executive Vice President, Corporate Services Financial Overview December 6, 2017 1 Discussion Overview Fiscal 2017 Financial Guidance Our View of the Economy and State of the U.S. Housing
State of the City of Carpinteria
 April 21, 2017 Mark Schniepp Director State of the City of Carpinteria jobs 1,000 Employment in Information / Carpinteria Valley 2006 -- 2016 800 600 400 200 0 2006 2008 2010 2012 2014 2016 ConstructiveDIVE.com
THIS AIN T THE 80s! And Houston isn t going anywhere.
 THIS AIN T THE 80s! And Houston isn t going anywhere. EXPECTEDLY, A DRAMATIC DOWNTURN IN OIL, ONE THAT HAS RUN EVEN FASTER AND DEEPER THAN DURING 2008-2009, RAISED ALARM ABOUT THE STABILITY OF THE HOUSTON
Sustainable Transportation Planning in the Portland Region
 Sustainable Transportation Planning in the Portland Region Jennifer Dill, Ph.D. Associate Professor School of Urban Studies & Planning jdill@pdx.edu http://web.pdx.edu/~jdill/ Outline Elements of a sustainable
Shifting International Trade Routes A National Economic Outlook. February 1, 2011
 Shifting International Trade Routes A National Economic Outlook February 1, 2011 Today s Objectives Endeavor to provide a broad context for today s program by briefly touching on: Some good news Some not
WORKFORCE LOCAL AREA EMPLOYMENT STATISTICS (LAUS)
") AUGUST 2016 WORKFORCE LOCAL AREA EMPLOYMENT STATISTICS (LAUS) 1,150,000 1,100,000 1,050,000 1,000,000 950,000 900,000 850,000 800,000 750,000 700,000 Labor Force Employment June 2015 to June 2016: 36,504
AUGUST 2016 WORKFORCE LOCAL AREA EMPLOYMENT STATISTICS (LAUS) 1,150,000 1,100,000 1,050,000 1,000,000 950,000 900,000 850,000 800,000 750,000 700,000 Labor Force Employment June 2015 to June 2016: 36,504
MARKET AND CAPACITY UPDATE. Matthew Marsh September 2016
 MARKET AND CAPACITY UPDATE Matthew Marsh September 2016 1980 1981 1982 1983 1984 1985 1986 1987 1988 1989 1990 1991 1992 1993 1994 1995 1996 1997 1998 1999 2000 2001 2002 2003 2004 2005 2006 2007 2008
Houston and Tomball Economic and. Housing Outlook. recenter.tamu.edu. Dr. James P. Gaines Research Economist
 Houston and Tomball Economic and Dr. James P. Gaines Research Economist Housing Outlook recenter.tamu.edu THE CURRENT SITUATION The Future Just Ain t What It Used to Be! Yogi Berra National Economic Recovery
The U.S. Economy How Serious A Downturn? Nigel Gault Group Managing Director North American Macroeconomic Services
 The U.S. Economy How Serious A Downturn? Nigel Gault Group Managing Director North American Macroeconomic Services Growth Is Cooling; But a Soft Landing Is Likely (Real GDP, annualized rate of growth)
Curves On The Road Ahead
 Curves On The Road Ahead Light Vehicle Market Outlook November 2018 Charles Chesbrough Senior Economist A g e n d a Economic Outlook and New Vehicle Sales Affordability Threat and the Used Vehicle Market
How Much Wind Is in the Sails?
 How Much Wind Is in the Sails? Erie Chamber of Commerce Place cover image here Richard Wobbekind Senior Economist and Associate Dean for Business and Government Relations September 20, 2017 Real GDP Growth
Beyond Bullet Points: Statistics, Trends and Analysis
 Beyond Bullet Points: Statistics, Trends and Analysis Vail R. Brown VP, Global Business Development & Marketing Vail@str.com @vail_str 5 THINGS TO KNOW www.hotelnewsnow.com Click on Data Presentations
CU Real Estate Forum. The Game is Still Going. The Longest 7 th Inning Ever. Presenter: Doug Wulf. Monday, December 7, 2015
 CU Real Estate Forum The Game is Still Going The Longest 7 th Inning Ever Presenter: Doug Wulf Monday, December 7, 2015 Out! Safe! Where Are We in the Cycle? Recession-Recovery Table History is not on
Hotel InduSTRy Overview What Lies Ahead
 Hotel InduSTRy Overview What Lies Ahead Vail R. Brown Vice President, Global Business Development & Marketing www.hotelnewsnow.com Click on Hotel Data Presentations U.S. In Review Demand Growth Strong.
Future Global Trade Trends - Risks & Opportunities. Pulse of the Ports: Peak Season Forecast March 21, 2013
 1 Future Global Trade Trends - Risks & Opportunities Pulse of the Ports: Peak Season Forecast March 21, 2013 June 2012 Dr. Walter Kemmsies Chief Economist Summary Higher economic growth in 2013, possible
2018 Annual Economic Forecast Dragas Center for Economic Analysis and Policy
 2018 Annual Economic Forecast Dragas Center for Economic Analysis and Policy PRESENTING SPONSOR EVENT PARTNERS 2 The forecasts and commentary do not constitute an official viewpoint of Old Dominion University,
How Global Trade Is Driving Demand For Ports
 How Global Trade Is Driving Demand For Ports 17 April, 2018 Dr. Walter Kemmsies Chief Strategist JLL Ports Airports and Global Infrastructure JLL Ports Airports and Global Infrastructure Capital Markets
MAINTAINING MOMENTUM:
 MAINTAINING MOMENTUM: 2018 National Economic Update September 12, 2018 noun mo men tum \ mō-ˈmen-təm, mə- \ 1 b : the strength or force that allows something to continue or to grow stronger or faster as
Managed Lanes: The Fitch Approach. Saavan Gatfield, Senior Director
 Managed Lanes: The Fitch Approach Saavan Gatfield, Senior Director HOT Lanes Getting Hotter Priced Managed Lanes Across the United States As of 4/27/14 Sources: HNTB Corporation; GAO analysis of USDOT,
U.S. Property Market Outlook, 2013Q1. Jim Costello, Managing Director CBRE Americas Research Investment Research
 U.S. Property Market Outlook, 2013Q1 Jim Costello, Managing Director CBRE Americas Research Investment Research CBRE Page 2 Outlook for the Real Side of the Economy Operationally, what do Research Teams
Dr. James P. Gaines Research Economist. recenter.tamu.edu
 Dr. James P. Gaines Research Economist recenter.tamu.edu National Economic Recovery still Going 2 National Issues Expected GDP growth still modest: 2015 2.5%; personal consumption 2.5% Inflation not worrisome:
Speedway Commerce Center III
 6255-6335 N Hollywood Boulevard (Bldgs A & B) For lease Rates from $0.46/s.f. NNN 32 minimum warehouse clear height 4,000 amps, 277/480 volt, 3-phase power supply Minimum 200 amps, 277/480 volt, 3-phase
Economy On The Rebound
 Economy On The Rebound Robert Johnson Associate Director of Economic Analysis November 17, 2009 robert.johnson@morningstar.com (312) 696-6103 2009, Morningstar, Inc. All rights reserved. Executive
Metro Atlanta. Cleve s 10-Year Market Projections SF Detached. GoGaddis.com 89,002 83,829 78,958 74,369 70,047 65,976 62,142 58,531 55,129 51,926
 350000 300000 250000 200000 $231,000 $221,760 $228,413 $235,265 $242,323 Metro Atlanta Cleve s 10-Year Market Projections SF Detached $252,016 $262,097 $275,909 $290,450 $305,756 $321,870 Total Single
10 County Conference. Richard Wobbekind. Executive Director Business Research Division & Senior Associate Dean Leeds School of Business
 10 County Conference Richard Wobbekind Executive Director Business Research Division & Senior Associate Dean Leeds School of Business Hmm... (http://myfallsemester.blogspot.com) Real GDP Growth Percent
Friday, May 22, NAR Convention
 NAR Convention 5-14-09 NAR Convention 5-14-09 Lawrence Yun, NAR Chief Economist NAR Marketing Tips!Provide Market Data to buyers!forbes Buyer Survey: Now good time to buy home!best Banner Ads: 1. Has Market
For Lease. Property Overview. Speedway Commerce Center III N Hollywood Boulevard North Las Vegas, NV 89115
 Speedway Commerce Center III 6255-6335 N Hollywood Boulevard For Lease Property Overview Spaces from 16,471-333,704 s.f. 32 minimum warehouse clear height Total 4,000 amps, 277/480 volt, 3-phase power
Dr. James P. Gaines Research Economist recenter.tamu.edu
 Texas Uncertain Economy in a World of Uncertain Oil Prices Dr. James P. Gaines Research Economist recenter.tamu.edu National Economic Recovery still Going 2 U.S. Outlook Expected GDP growth still modest:
Texas Housing Markets: Metropolitan vs. Border Communities. September 22, 2014
 Texas Housing Markets: Metropolitan vs. Border Communities Luis Bernardo Torres Ruiz, Ph.D. Research Economist El Paso Branch Dallas Federal Rio Grande Economic Association September 22, 2014 Contents
2008 Real Estate Market Forecast. October 10, 2007 Leslie Appleton-Young C.A.R. Vice President and Chief Economist
 2008 Real Estate Market Forecast October 10, 2007 Leslie Appleton-Young C.A.R. Vice President and Chief Economist Overview California Real Estate Market: 2007 Recap 2007 Forecast Sub-Prime, Credit Crunch
The Wisconsin and Minnesota Economies: What can we learn from each other? Noah Williams
 The Economies: What can we learn from each other? Noah University of Wisconsin - Madison Future Wisconsin Summit 2016 Economies Location, size, demographics, and history make Wisconsin and Minnesota natural
Partnerships with Purpose: Housing for Texans
 Partnerships with Purpose: Housing for Texans 25th Annual TALHFA Educational Conference October 25-27, 2017 Fort Worth, Texas Dr. James P. Gaines Chief Economist 2 Outlook Since November 10, 2017: Rising
Preview. Second midterm Tables in your paper Mass Transit as alternative to auto California s problems in urban transportation
 Preview Second midterm Tables in your paper Mass Transit as alternative to auto California s problems in urban transportation Score Distribution 1 st Midterm 2 nd Midterm 3.5-4.0 8% 21% 3.0-3.5 23% 34%
Canadian Teleconference: Can the Canadian Economy Survive the Turmoil in the United States?
 Canadian Teleconference: Can the Canadian Economy Survive the Turmoil in the United States? Nigel Gault Chief U.S. Economist Dale Orr Canadian Macroeconomic Services Copyright 2008 Global Insight, Inc.
Click to edit Master title style
 Click to edit Master title style Dallas July 27, 2017 7/27/2017 1 1 Click to edit Master title style 7/27/2017 2 2 Click to edit Master title style 7/27/2017 3 3 Click to edit Master title style TAP Software
Economic Update Edward Seiler NH&RA
 Economic Update Edward Seiler NH&RA 2 Annual Real GDP Growth (%) 5.0 4.0 Actual (BEA) Forecast (CBO in red, OMB red + orange) 3.0 2.0 1.0 0.0-1.0 1990 1991 1992 1993 1994 1995 1996 1997 1998 1999 2000
More of the Same; Or now for Something Completely Different?
 More of the Same; Or now for Something Completely Different? C2ER Place cover image here Richard Wobbekind Chief Economist and Associate Dean for Business and Government Relations June 14, 2017 Real GDP
The 2019 Economic Outlook Forum The Outlook for MS
 The 2019 Economic Outlook Forum The Outlook for MS February 2019 Mississippi University Research Center Mississippi Institutions of Higher Learning Darrin Webb, State Economist dwebb@mississippi.edu (601)432-6556
MBA Economic and Mortgage Finance Outlook
 MBA Economic and Mortgage Finance Outlook MBA of Alabama Annual Conference June 7, 2017 Presented by Lynn Fisher Mortgage Bankers Association 1 Summary of the MBA Outlook 2016 2017 2018 2019 GDP Growth
Economic Update and Prospects for 2019 Professor Robert M. McNab Dragas Center for Economic Analysis and Policy Strome College of Business
 Economic Update and Prospects for 2019 Professor Robert M. McNab Dragas Center for Economic Analysis and Policy Strome College of Business January 3, 2019 The forecasts and commentary do not constitute
Transitions: 2019 Economic Forecast for Metro Denver February 6, 2019
 Transitions: 2019 Economic Forecast for Metro Denver February 6, 2019 Prepared by: Can Stock Photo / jkirsh In Partnership with: Consumer Changes and Influences Slowing population growth Aging of the population
What s Ahead for The Colorado Economy?
 What s Ahead for The Colorado Economy? Colorado Counties Inc. Place cover image here Richard Wobbekind Senior Economist and Associate Dean for Business and Government Relations November 28, 2017 Real GDP
Babson Capital/UNC Charlotte Economic Forecast. May 13, 2014
 Babson Capital/UNC Charlotte Economic Forecast May 13, 2014 Outline for Today Myths and Realities of this Recovery Positive Economic Signs Negative Economic Signs Outlook for 2014 The Employment Picture
Economic Update and Outlook
 Economic Update and Outlook NAIOP Vancouver Chapter November 15, 2012 Helmut Pastrick Chief Economist Central 1 Credit Union Outline: Global, U.S., and Canadian economic conditions Canada economic and
Old Dominion University 2017 Regional Economic Forecast. Strome College of Business
 Old Dominion University 2017 Regional Economic Forecast January 25, 2017 Professor Vinod Agarwal Director, Economic Forecasting Project Strome College of Business www.odu.edu/forecasting The views expressed
The Changing Global Economy Impacts on Seaports and Trade Dr. Walter Kemmsies
 The Changing Global Economy Impacts on Seaports and Trade Dr. Walter Kemmsies Chief Economist, PAGI Group, JLL (Port, Airport & Global Infrastructure) Agenda Where are we in the cycle? What are the barriers
Growth, Innovation, and the Future of the Arizona Economy. Michael Crow Arizona State University December 21, 2016
 Growth, Innovation, and the Future of the Arizona Economy Michael Crow Arizona State University December 21, 2016 Billions Arizona Gross Domestic Product, 2005-2016 $280 $275 $270 $265 $260 $255 $250 $245
RISI Housing Report An Update on the Housing Market
 RISI Housing Report An Update on the Housing Market North American Conference October 2018 Jennifer Coskren Senior Economist Agenda Current housing demand and demographic conditions Supply and impediments
2017 Nebraska Profile
 2017 Nebraska Profile State, 9 NEW Regions, 93 Counties, plus 31 Cities Three Volumes Demographic Change in the State Economic Influences at Work Housing Statistics and Trends Summary of Findings Discuss
Preview. Tables in your paper Mass Transit as alternative to auto California s problems in urban transportation
 Preview Tables in your paper Mass Transit as alternative to auto California s problems in urban transportation Integrating tables in your writing Commuting in Urban Areas Last time auto and congestion
Inland Empire International Trade Economic Forecast
 Inland Empire International Trade Economic Forecast Mira Farka Adrian Fleissig Institute for Economic and Environmental Studies Orange County / Inland Empire Regional SBDC Network California State University,
Education Committee Economic Background and Issue Review
 Education Committee Economic Background and Issue Review Montpelier, Vermont January 22, 2014 Thomas E. Kavet State Economist and Principal Economic Advisor to the Vermont State Legislature Since 1996
Global Hotel Industry Outlook
 Global Hotel Industry Outlook NYU 2011 Mark V. Lomanno CEO STR www.hotelnewsnow.com Click on Industry Presentations Agenda Global Hotel Performance US Hotel Performance Chain Scales Group/Transient Distribution
2018 Annual Economic Forecast Dragas Center for Economic Analysis and Policy
 2018 Annual Economic Forecast Dragas Center for Economic Analysis and Policy PRESENTING SPONSOR EVENT PARTNERS 2 The forecasts and commentary do not constitute an official viewpoint of Old Dominion University,
Cleve Gaddis Gaddis Partners, RE/MAX Center & USA Management
 Cleve Gaddis Gaddis Partners, RE/MAX Center & USA Management (a boutique residential property management company) 10475 Medlock Bridge Road, Suite 119 Johns Creek, GA 30097 www. 770-497-0000 All information
A comment on recent events, and...
 A comment on recent events, and... where we are in the current economic cycle November 15, 2016 Mark Schniepp Director Likely Trump Policies $4 to $5 Trillion in tax cuts over 10 years to corporations,
Demographic Characteristics and Trends of Bexar County and San Antonio, TX
 Demographic Characteristics and Trends of Bexar County and San Antonio, TX Leadership San Antonio Understand Infrastructure. Prepare for Growth. May 2, 2012 San Antonio, TX Select Growing States, 2000-2010
Zions Bank Economic Overview
 Zions Bank Economic Overview Intermountain Credit Education League May 10, 2018 Dow Tops 26,000 Up 48% Since 2016 Election Jan 26, 2018 26,616 Oct 30, 2016 17,888 Source: Wall Street Journal Dow Around
2014 Economic Forecast: Boulder & Beyond. Keynote Presentation
 2014 Economic Forecast: Boulder & Beyond Keynote Presentation Business Research Division Richard Wobbekind Executive Director Business Research Division & Senior Associate Dean Leeds School of Business
International Trade Economic Forecasts An Overview of Orange County and Southern California Exports
 International Trade Economic Forecasts An Overview of Orange County and Southern California Exports Mira Farka Adrian R. Fleissig Institute for Economic and Environmental Studies Orange County / Inland
Economic Recovery Has Stalled, Recession in the Cards by Year End
 Economic Indicators to Watch for Signs of Recovery Economic Recovery Has Stalled, Recession in the Cards by Year End New York, NY Monday, June 27, 2011 Richard Yamarone Author of The Trader s Guide to
U.S Cement Outlook IEEE. Ed Sullivan Group VP, Chief Economist
 U.S Cement Outlook IEEE Ed Sullivan Group VP, Chief Economist 1 Construction Activity Billion Real $ 1,400 1,200 1,000 2014 = 2.5% 2015 = 5.6% 800 600 400 200 0 12 Year Peak-to- Peak Recovery 1998 2000
Your Texas Economy. Last updated: January 30, 2018
 Your Texas Economy Last updated: January 30, 2018 Texas economy strong in 2017 2017 job growth was 2.4% Overview 2015/2016 job growth was much weaker due to the oil bust (1.3% and 1.2%, respectively) 2014
Federal Reserve Bank of Dallas, FIRM (Financial Institution Relationship Management)
") The Economic Roller Coaster: Where Have We Been? And Where Are We Going? Thomas F. Siems, Ph.D. Senior Economist and Director of Economic Outreach Federal Reserve Bank of Dallas Economic Summit Dallas
The Economic Roller Coaster: Where Have We Been? And Where Are We Going? Thomas F. Siems, Ph.D. Senior Economist and Director of Economic Outreach Federal Reserve Bank of Dallas Economic Summit Dallas
Your Texas Economy. Current through: Tuesday, Nov 20, 2018
 Your Texas Economy Current through: Tuesday, Nov 20, 2018 Overview of Texas Economy The Texas economy is growing robustly in 2018 2018 job growth through October is 2.9 percent annualized compared to 2.1
Lodging Market Update. Valley Hotel and Resort Association April 13, 2016 Presented by: Robert Hayward
 Lodging Market Update Valley Hotel and Resort Association April 13, 2016 Presented by: Robert Hayward United States Lodging Market 63.7% 59.8% 58.9% 59.2% 61.3% 63.1% 63.3% 63.1% 60.3% 55.1% 57.5% 59.9%
INTERSECTIONS. Metro Denver 2016 Economic Forecast January 2016
 INTERSECTIONS Metro Denver 2016 Economic Forecast January 2016 Employment Intersections Employment growth and Great Recession recovery Industry clusters Average annual salary Photo Credit: istockphoto